-
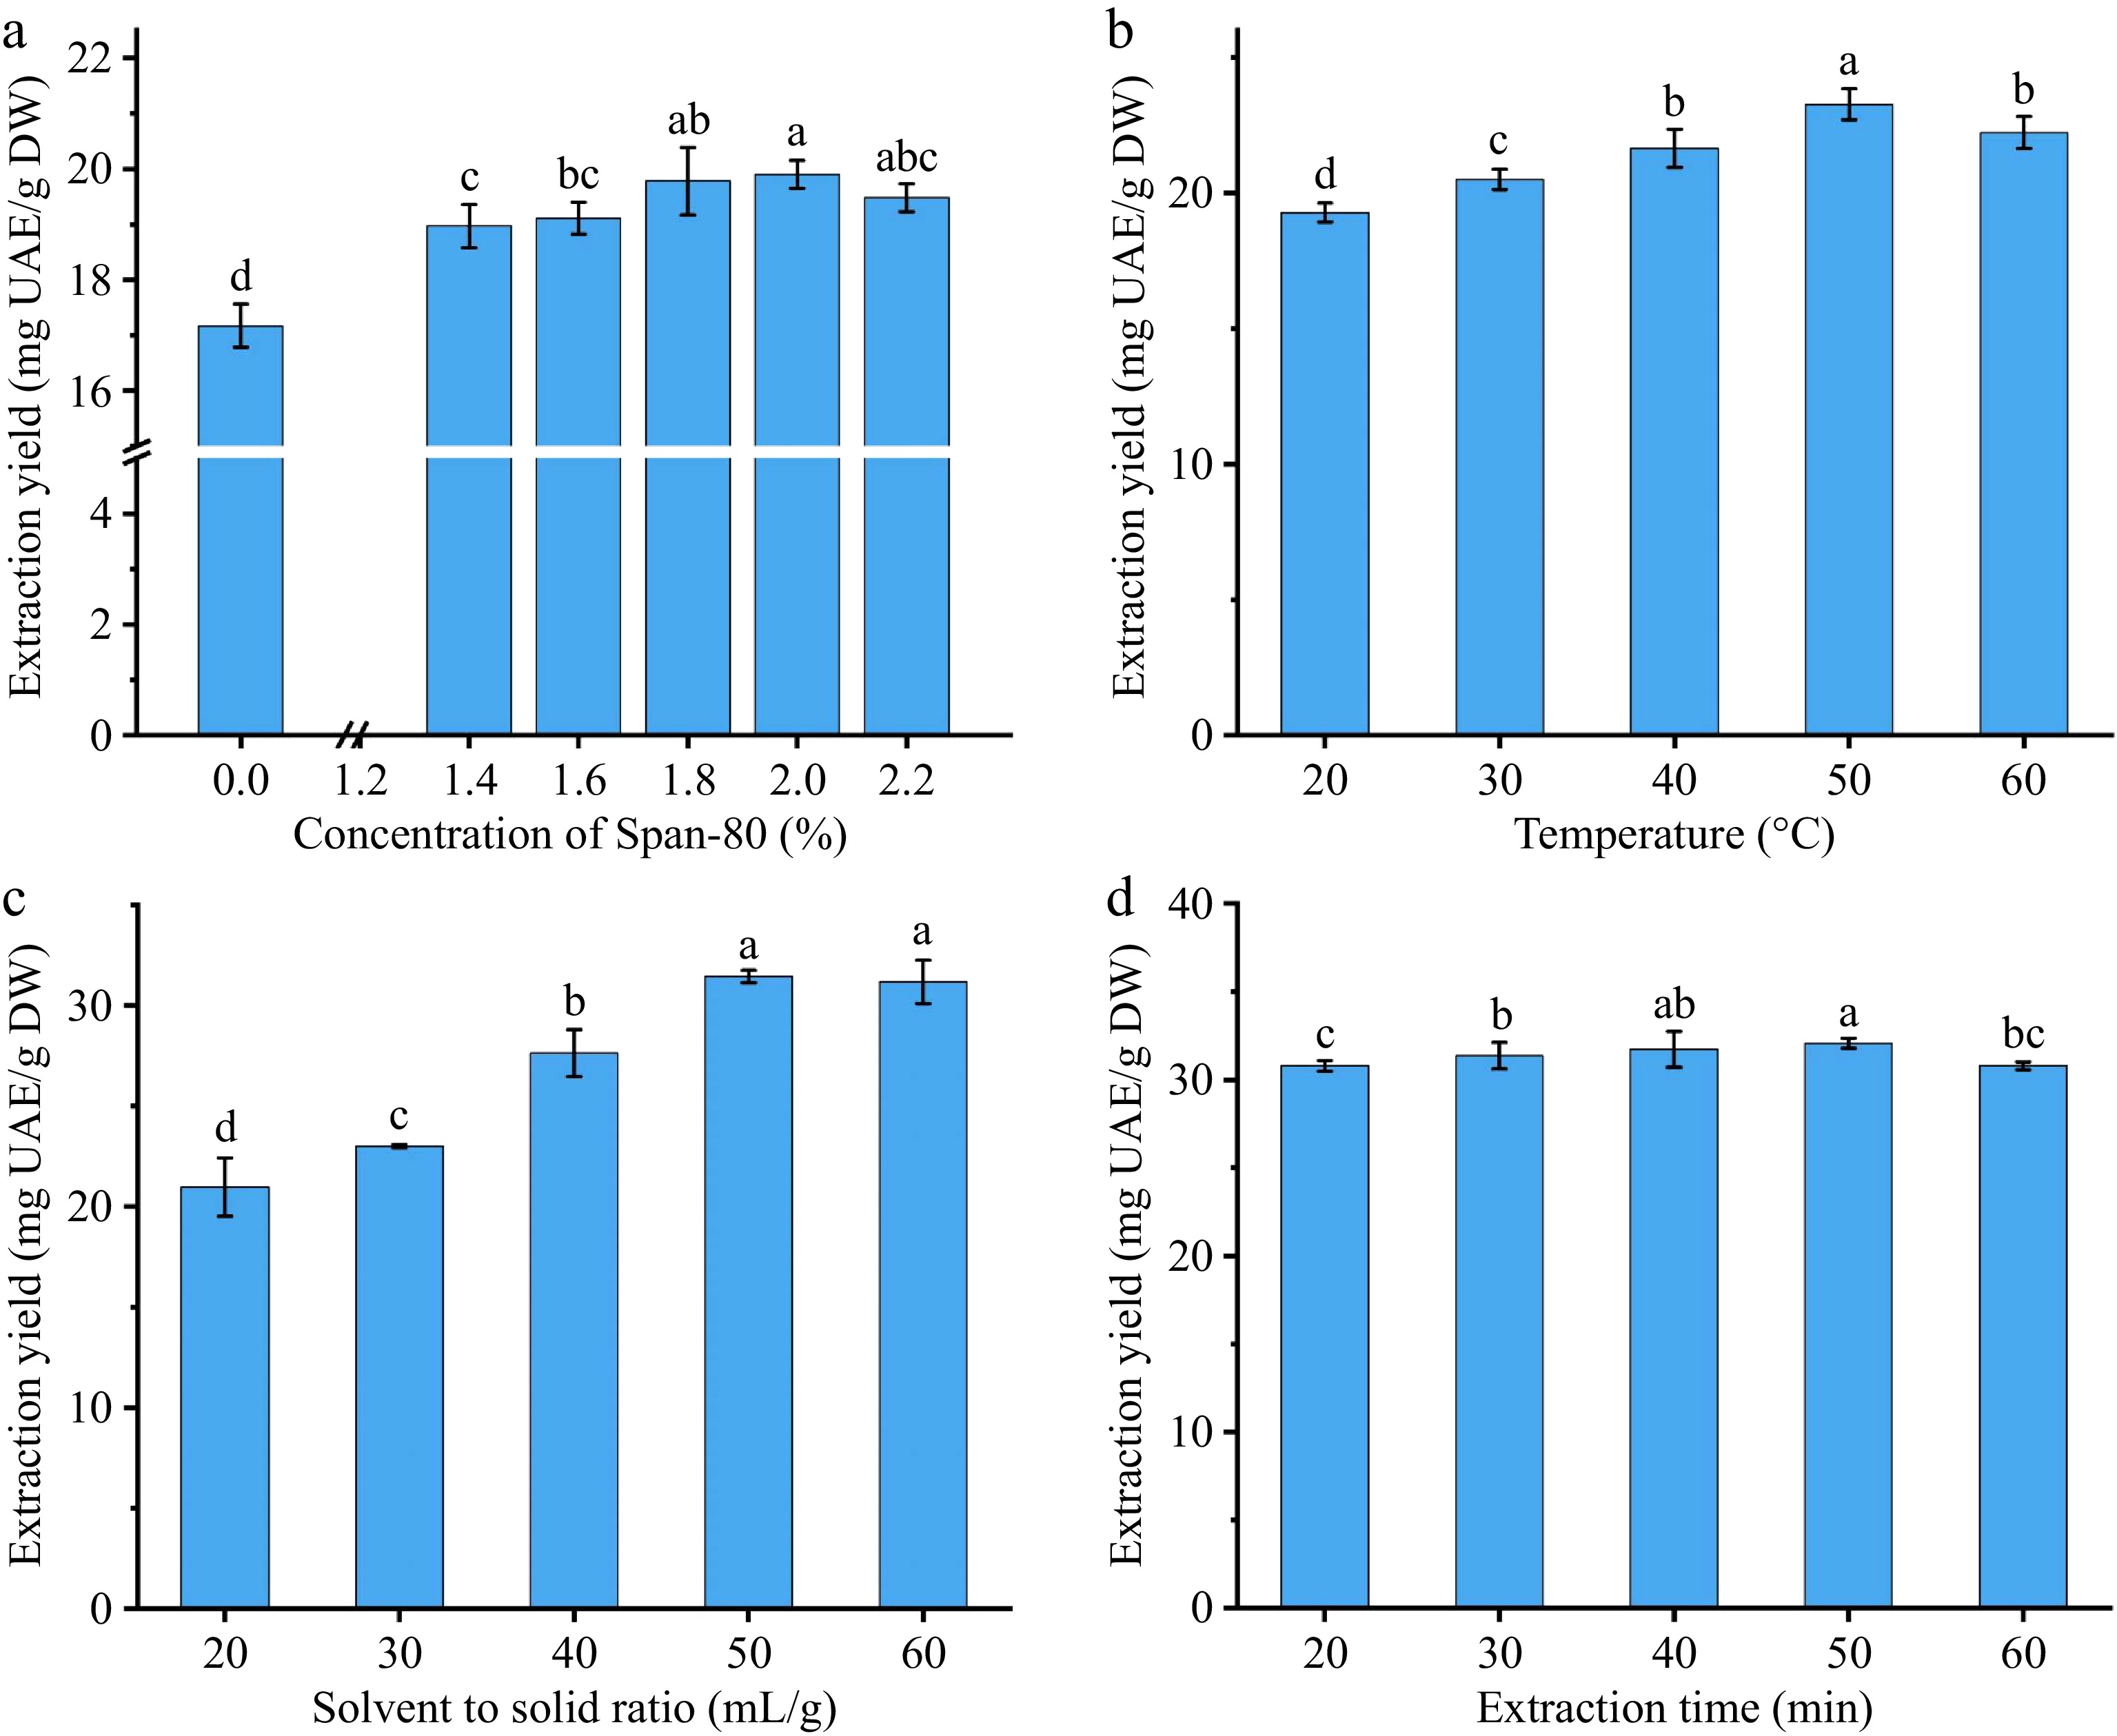
Figure 1.
Effects of (a) surfactant concentration, (b) temperature, (c) solvent to solid ratio, and (d) extraction time on the extraction yield of total triterpenoids.
-
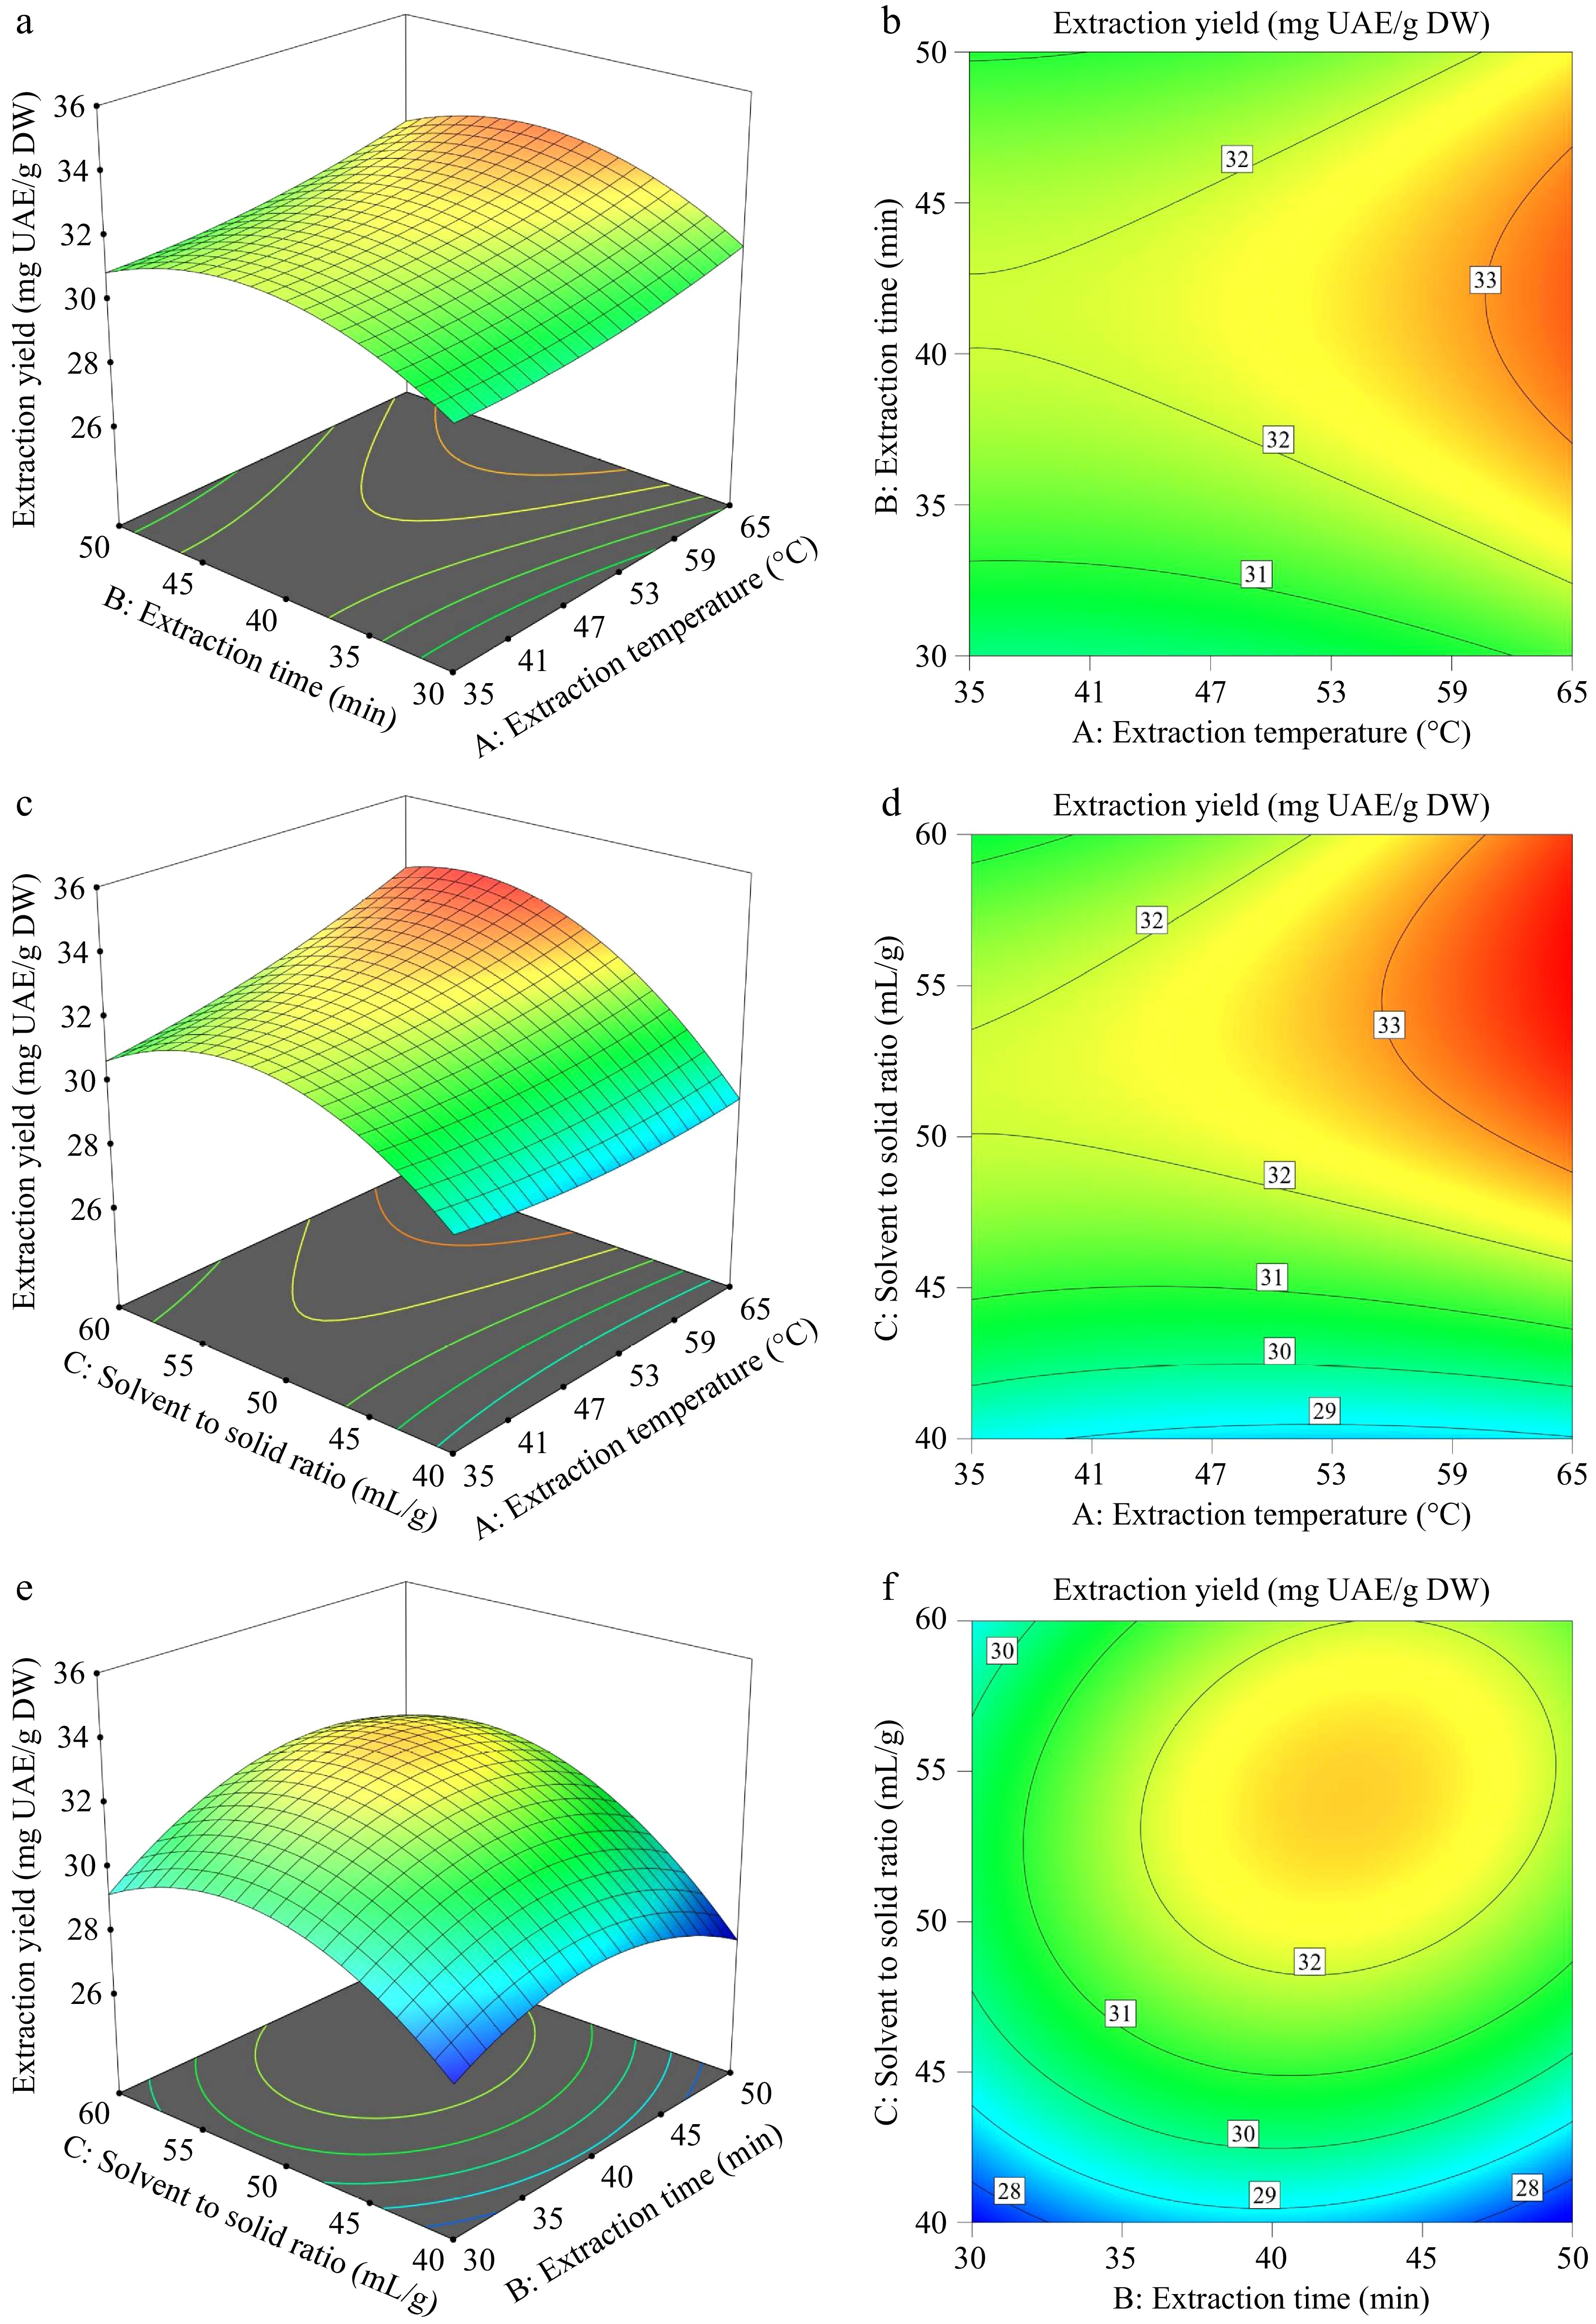
Figure 2.
(a), (c), (e) Response surface diagrams, and (b), (d), (f) the corresponding contour plots of the total triterpenoid yield.
-
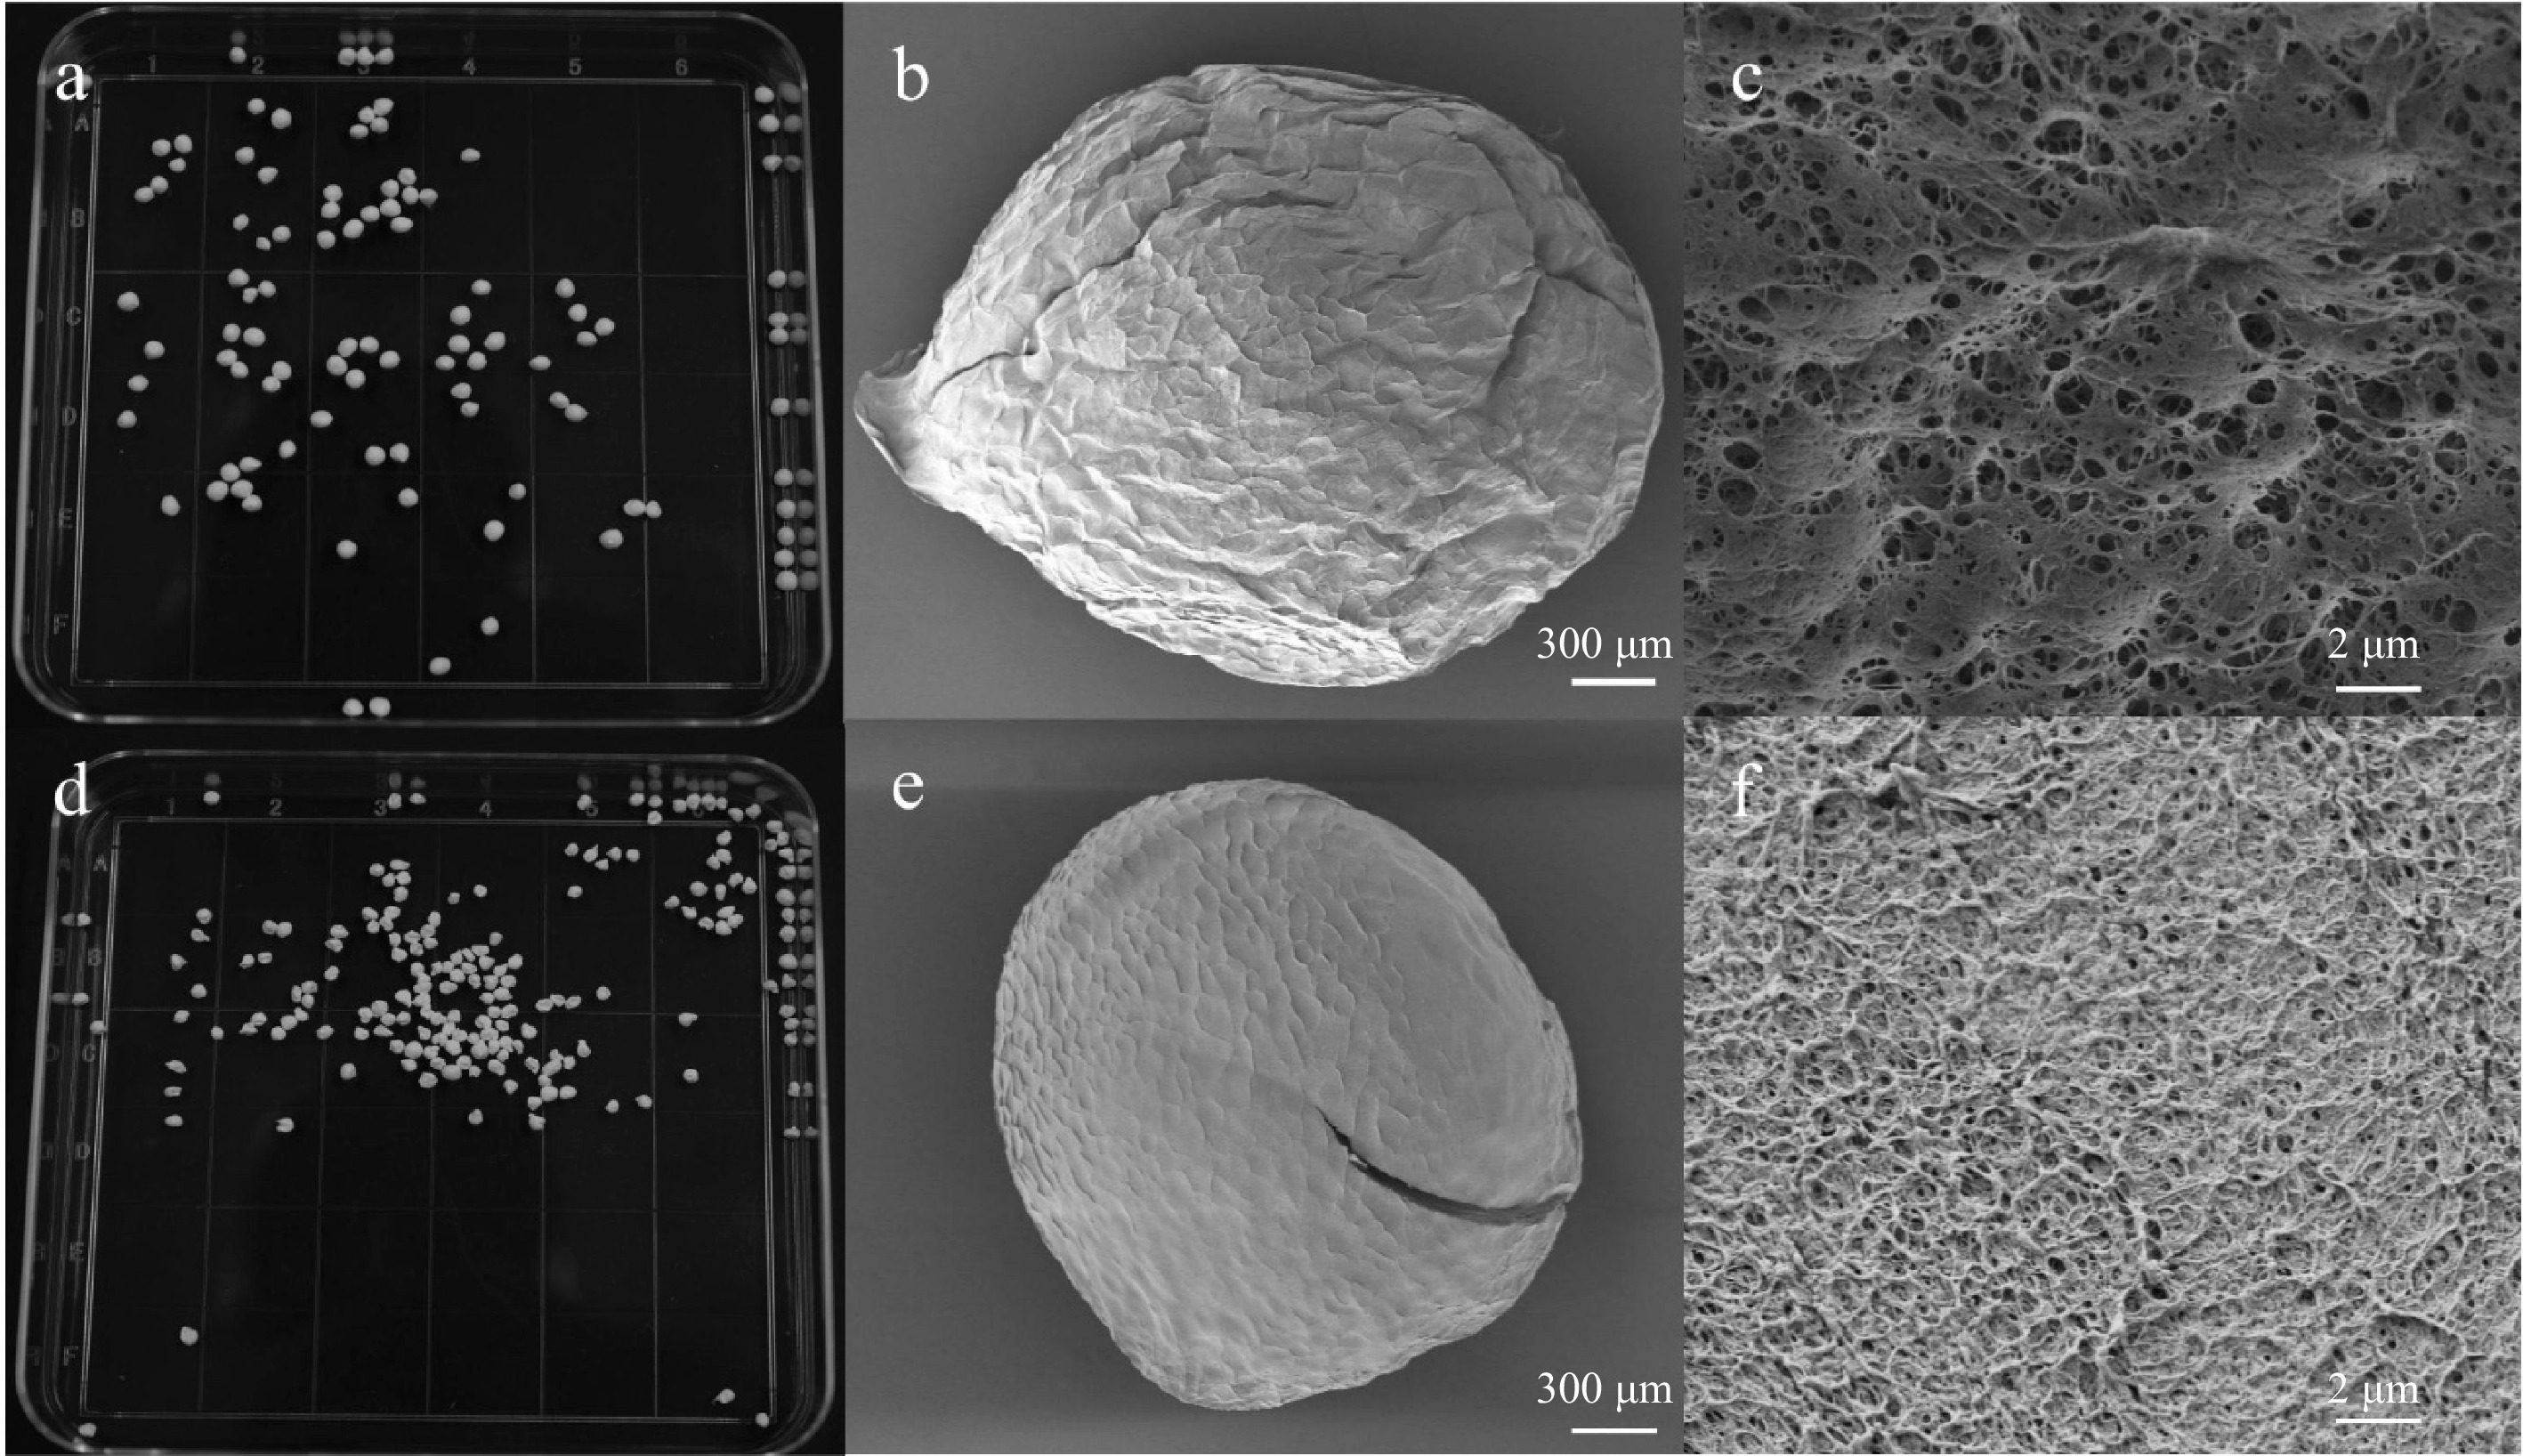
Figure 3.
The appearance, morphology, and surface pores observed by electron microscopy morphology of chitosan aerogel spheres prepared at the concentration of (a)−(c) 3 wt%, and (d)−(f) 2.5 wt%.
-
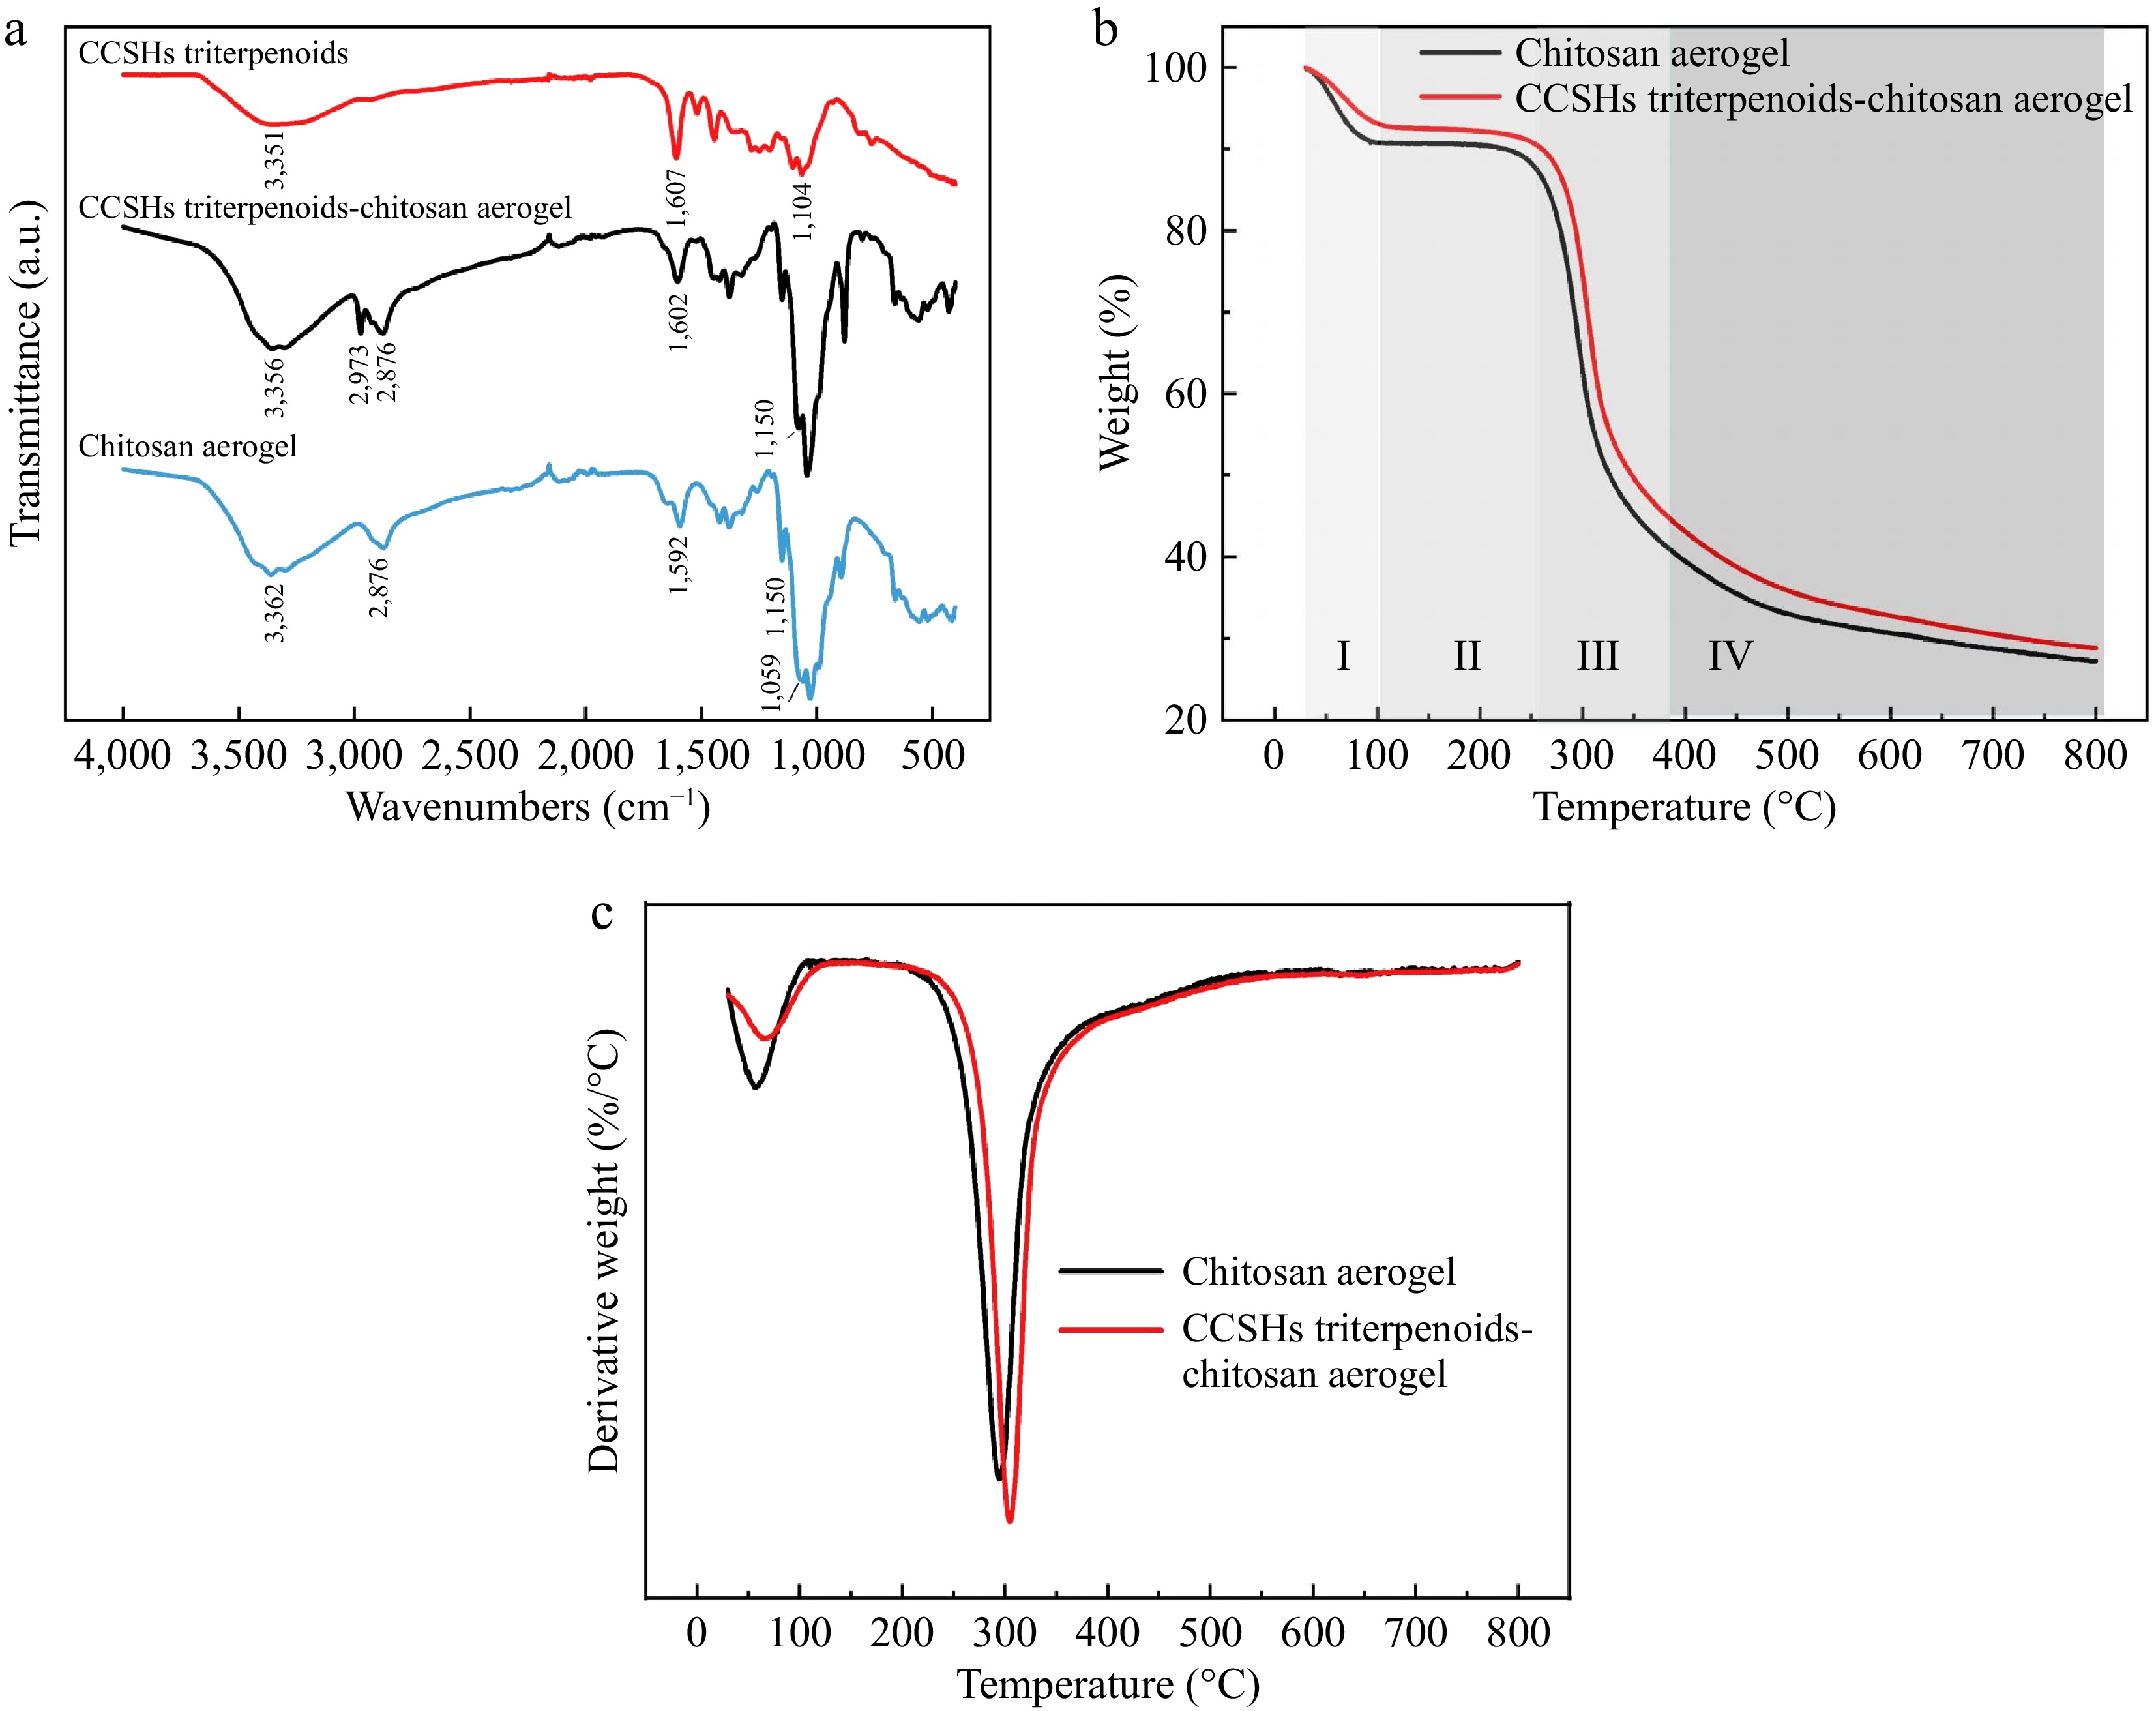
Figure 4.
(a) Fourier-transform infrared spectroscopy, (b) thermogravimetric curves, and (c) derivative thermogravimetry curves for chitosan aerogel spheres.
-
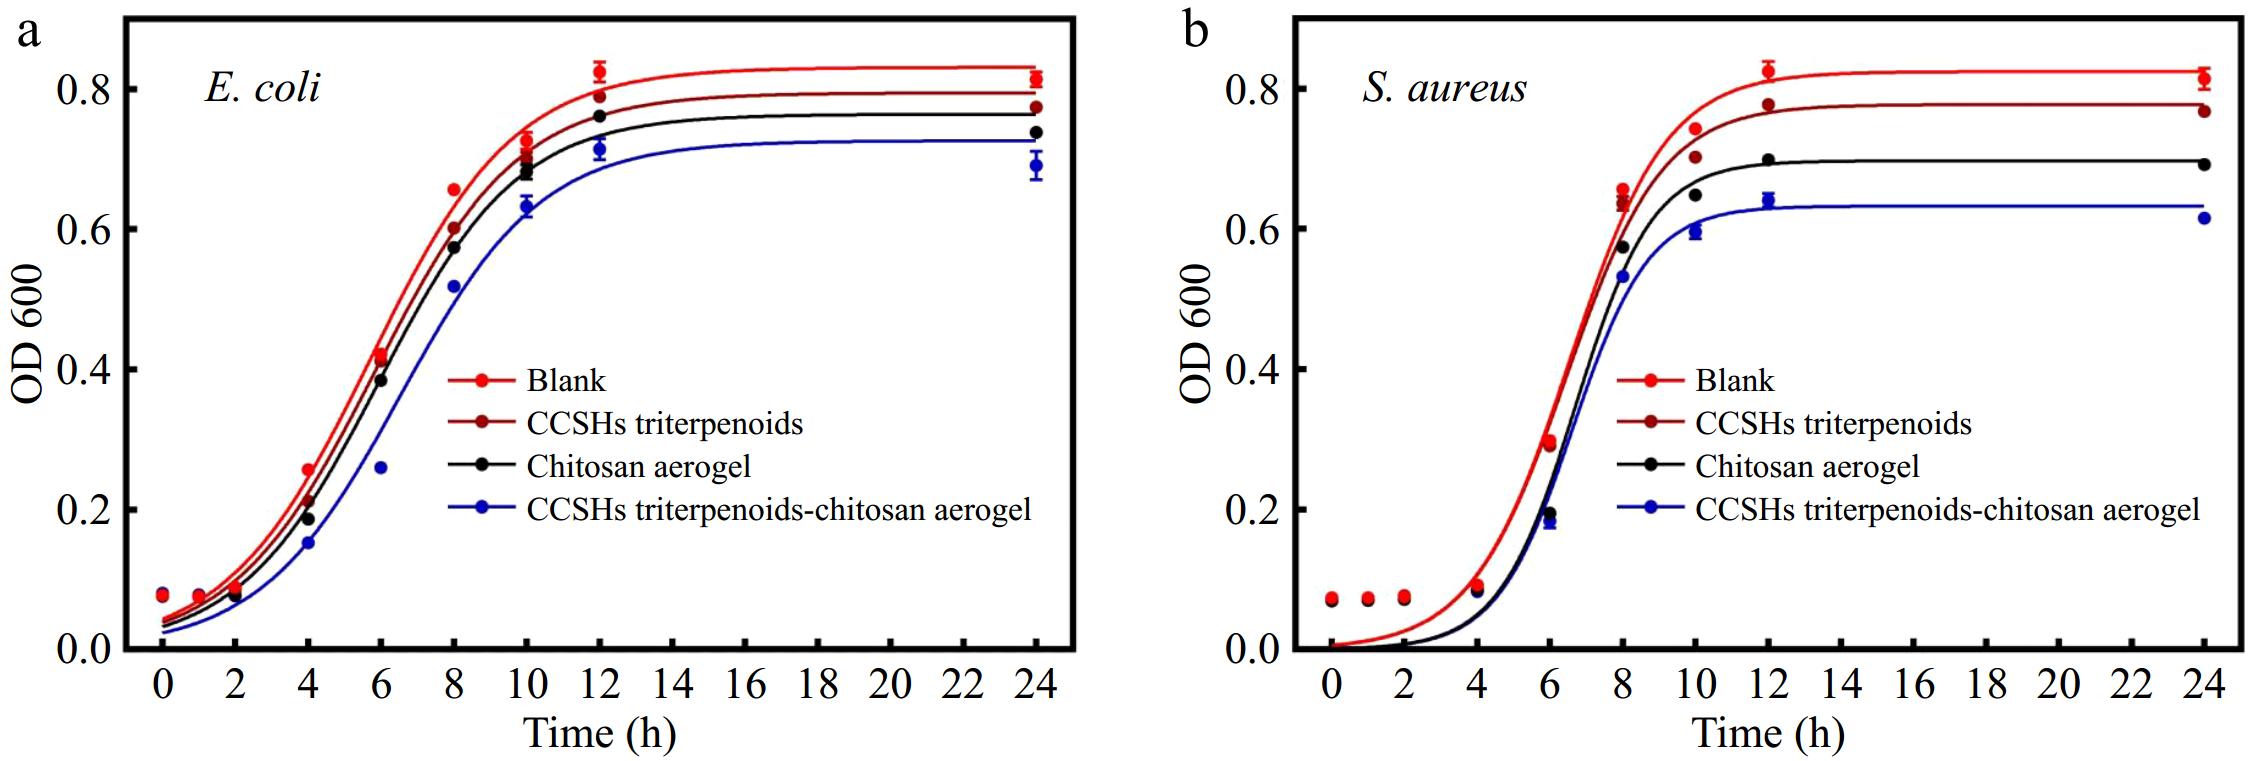
Figure 5.
Growth curves of (a) E. coli, and (b) S. aureus.
Figures
(5)
Tables
(0)