-
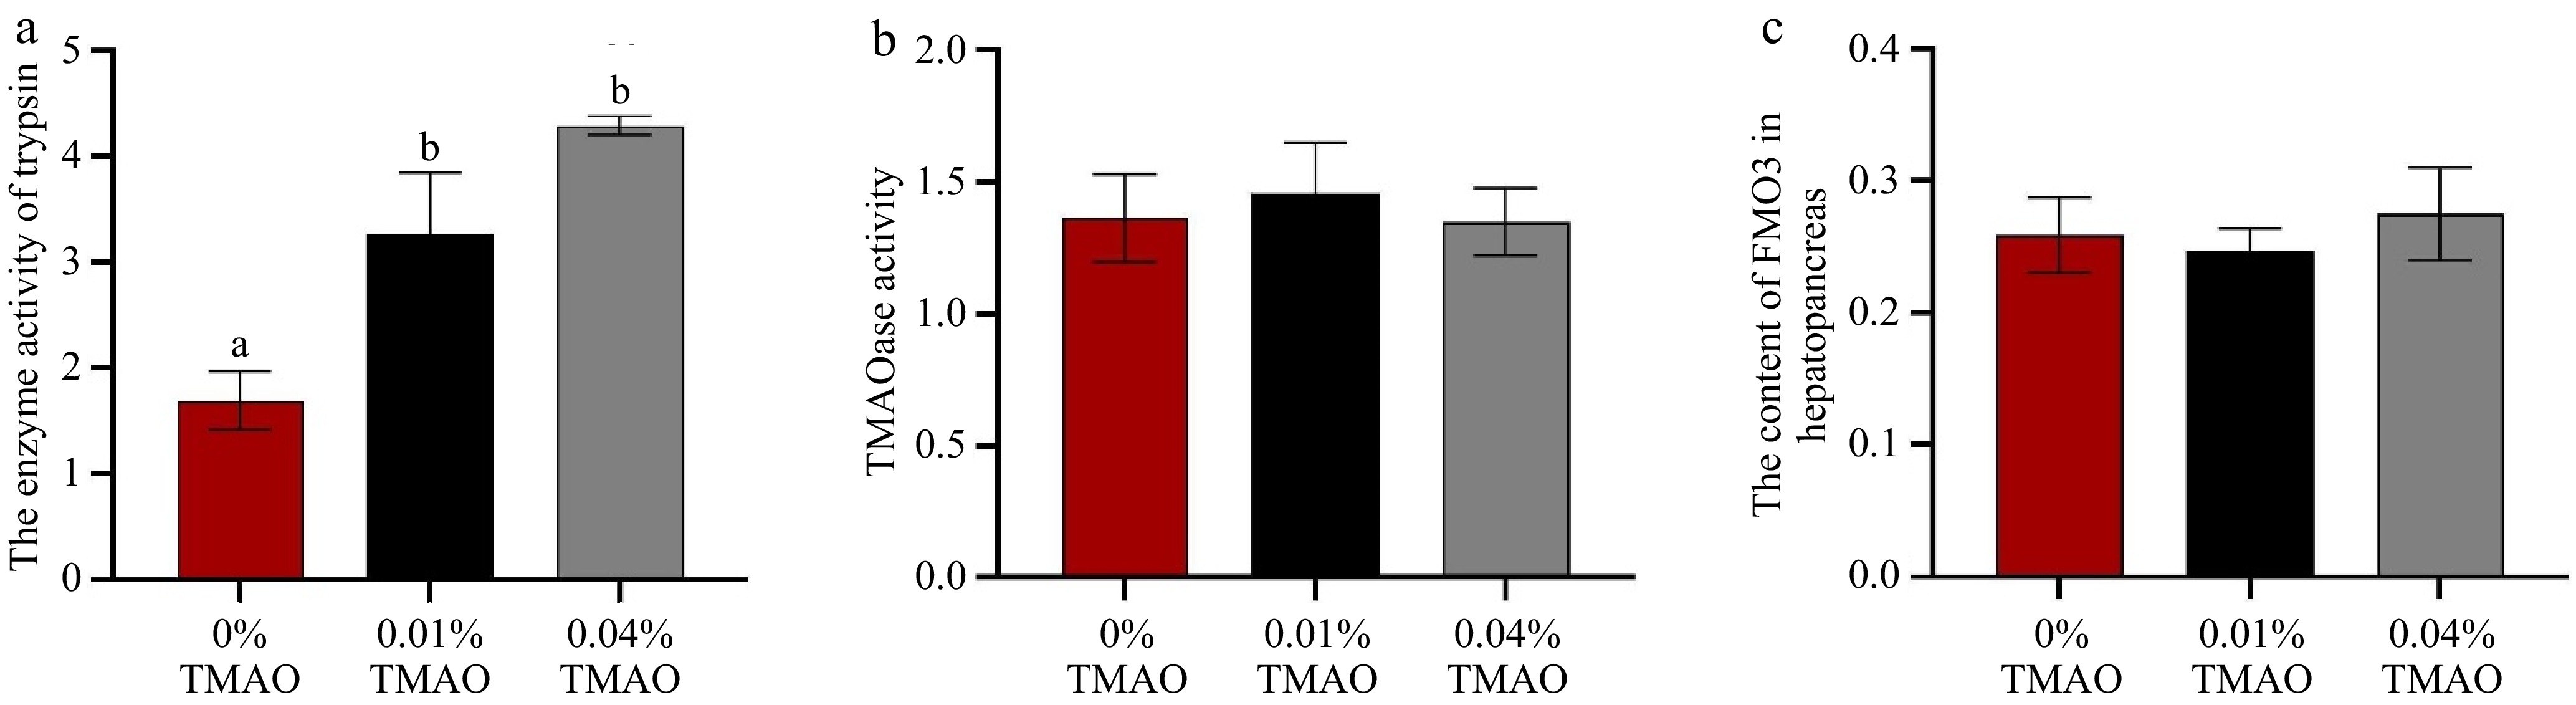
Figure 1.
Effect of dietary TMAO on (a) the enzyme activity of trypsin in the hepatopancreas, (b) the trimethylamine N-oxide demethylase (TMAOase) activity in the hepatopancreas, and (c) the content of flavin monooxygenase 3 (FMO3) in the hepatopancreas. The values are the means ± SEM (n = 3). Different letters indicate significant differences (p < 0.05).
-
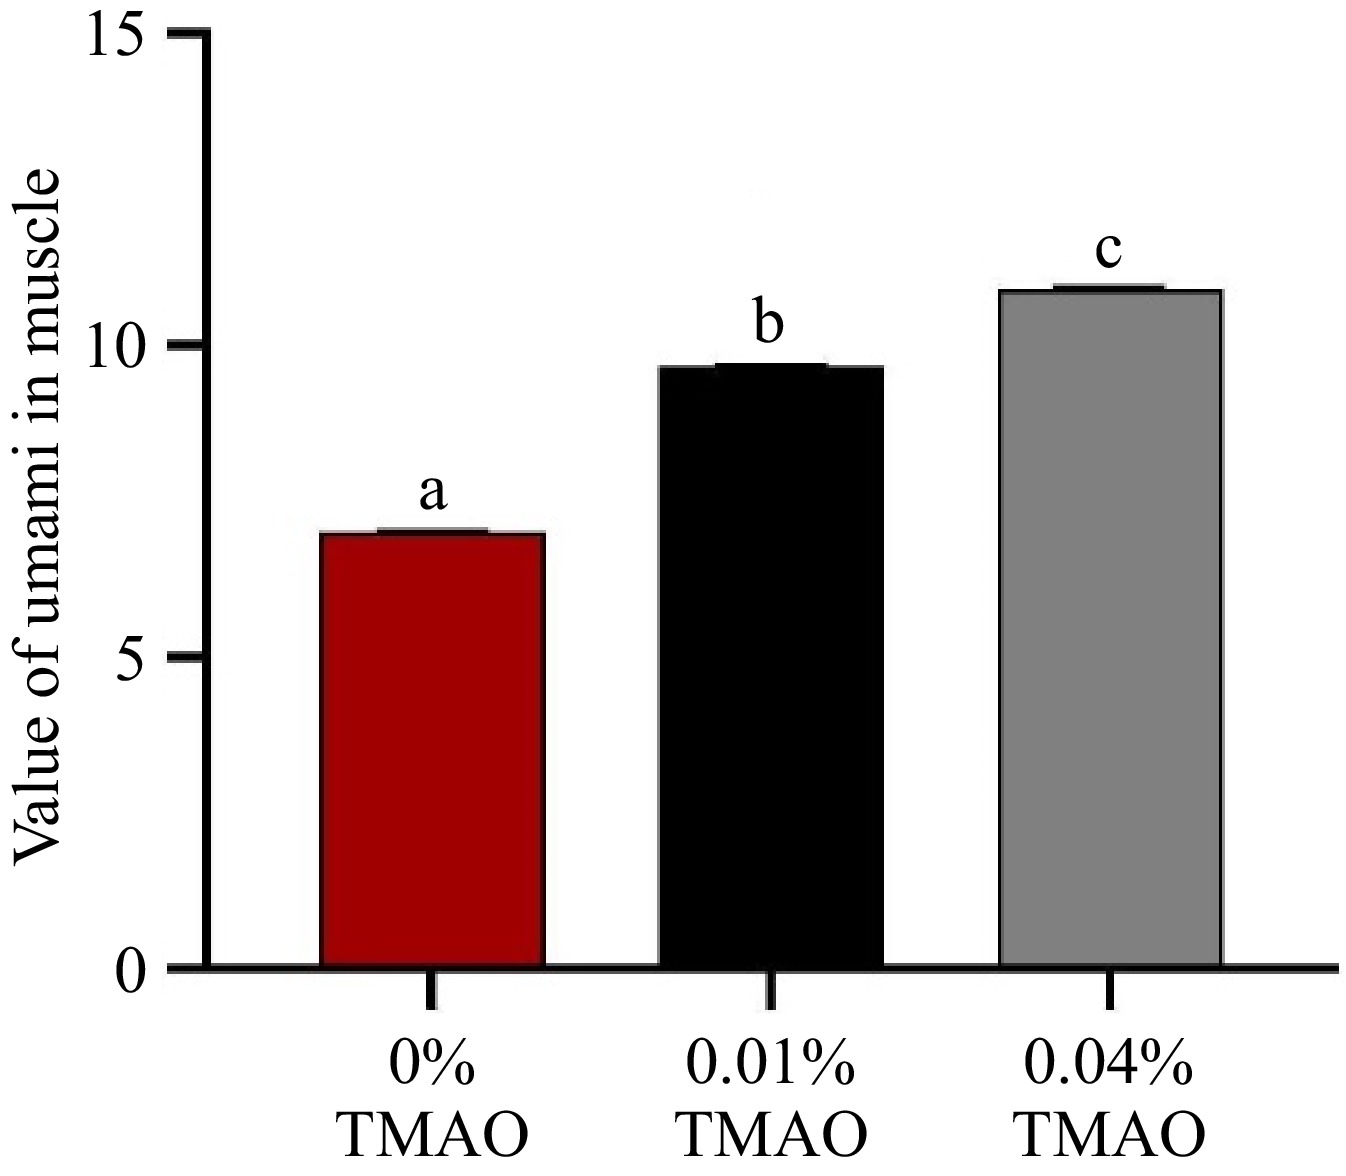
Figure 2.
Effect of dietary TMAO on the value of umami in muscle. The values are the means ± SEM (n = 3). Different letters indicate significant differences (p < 0.05).
-
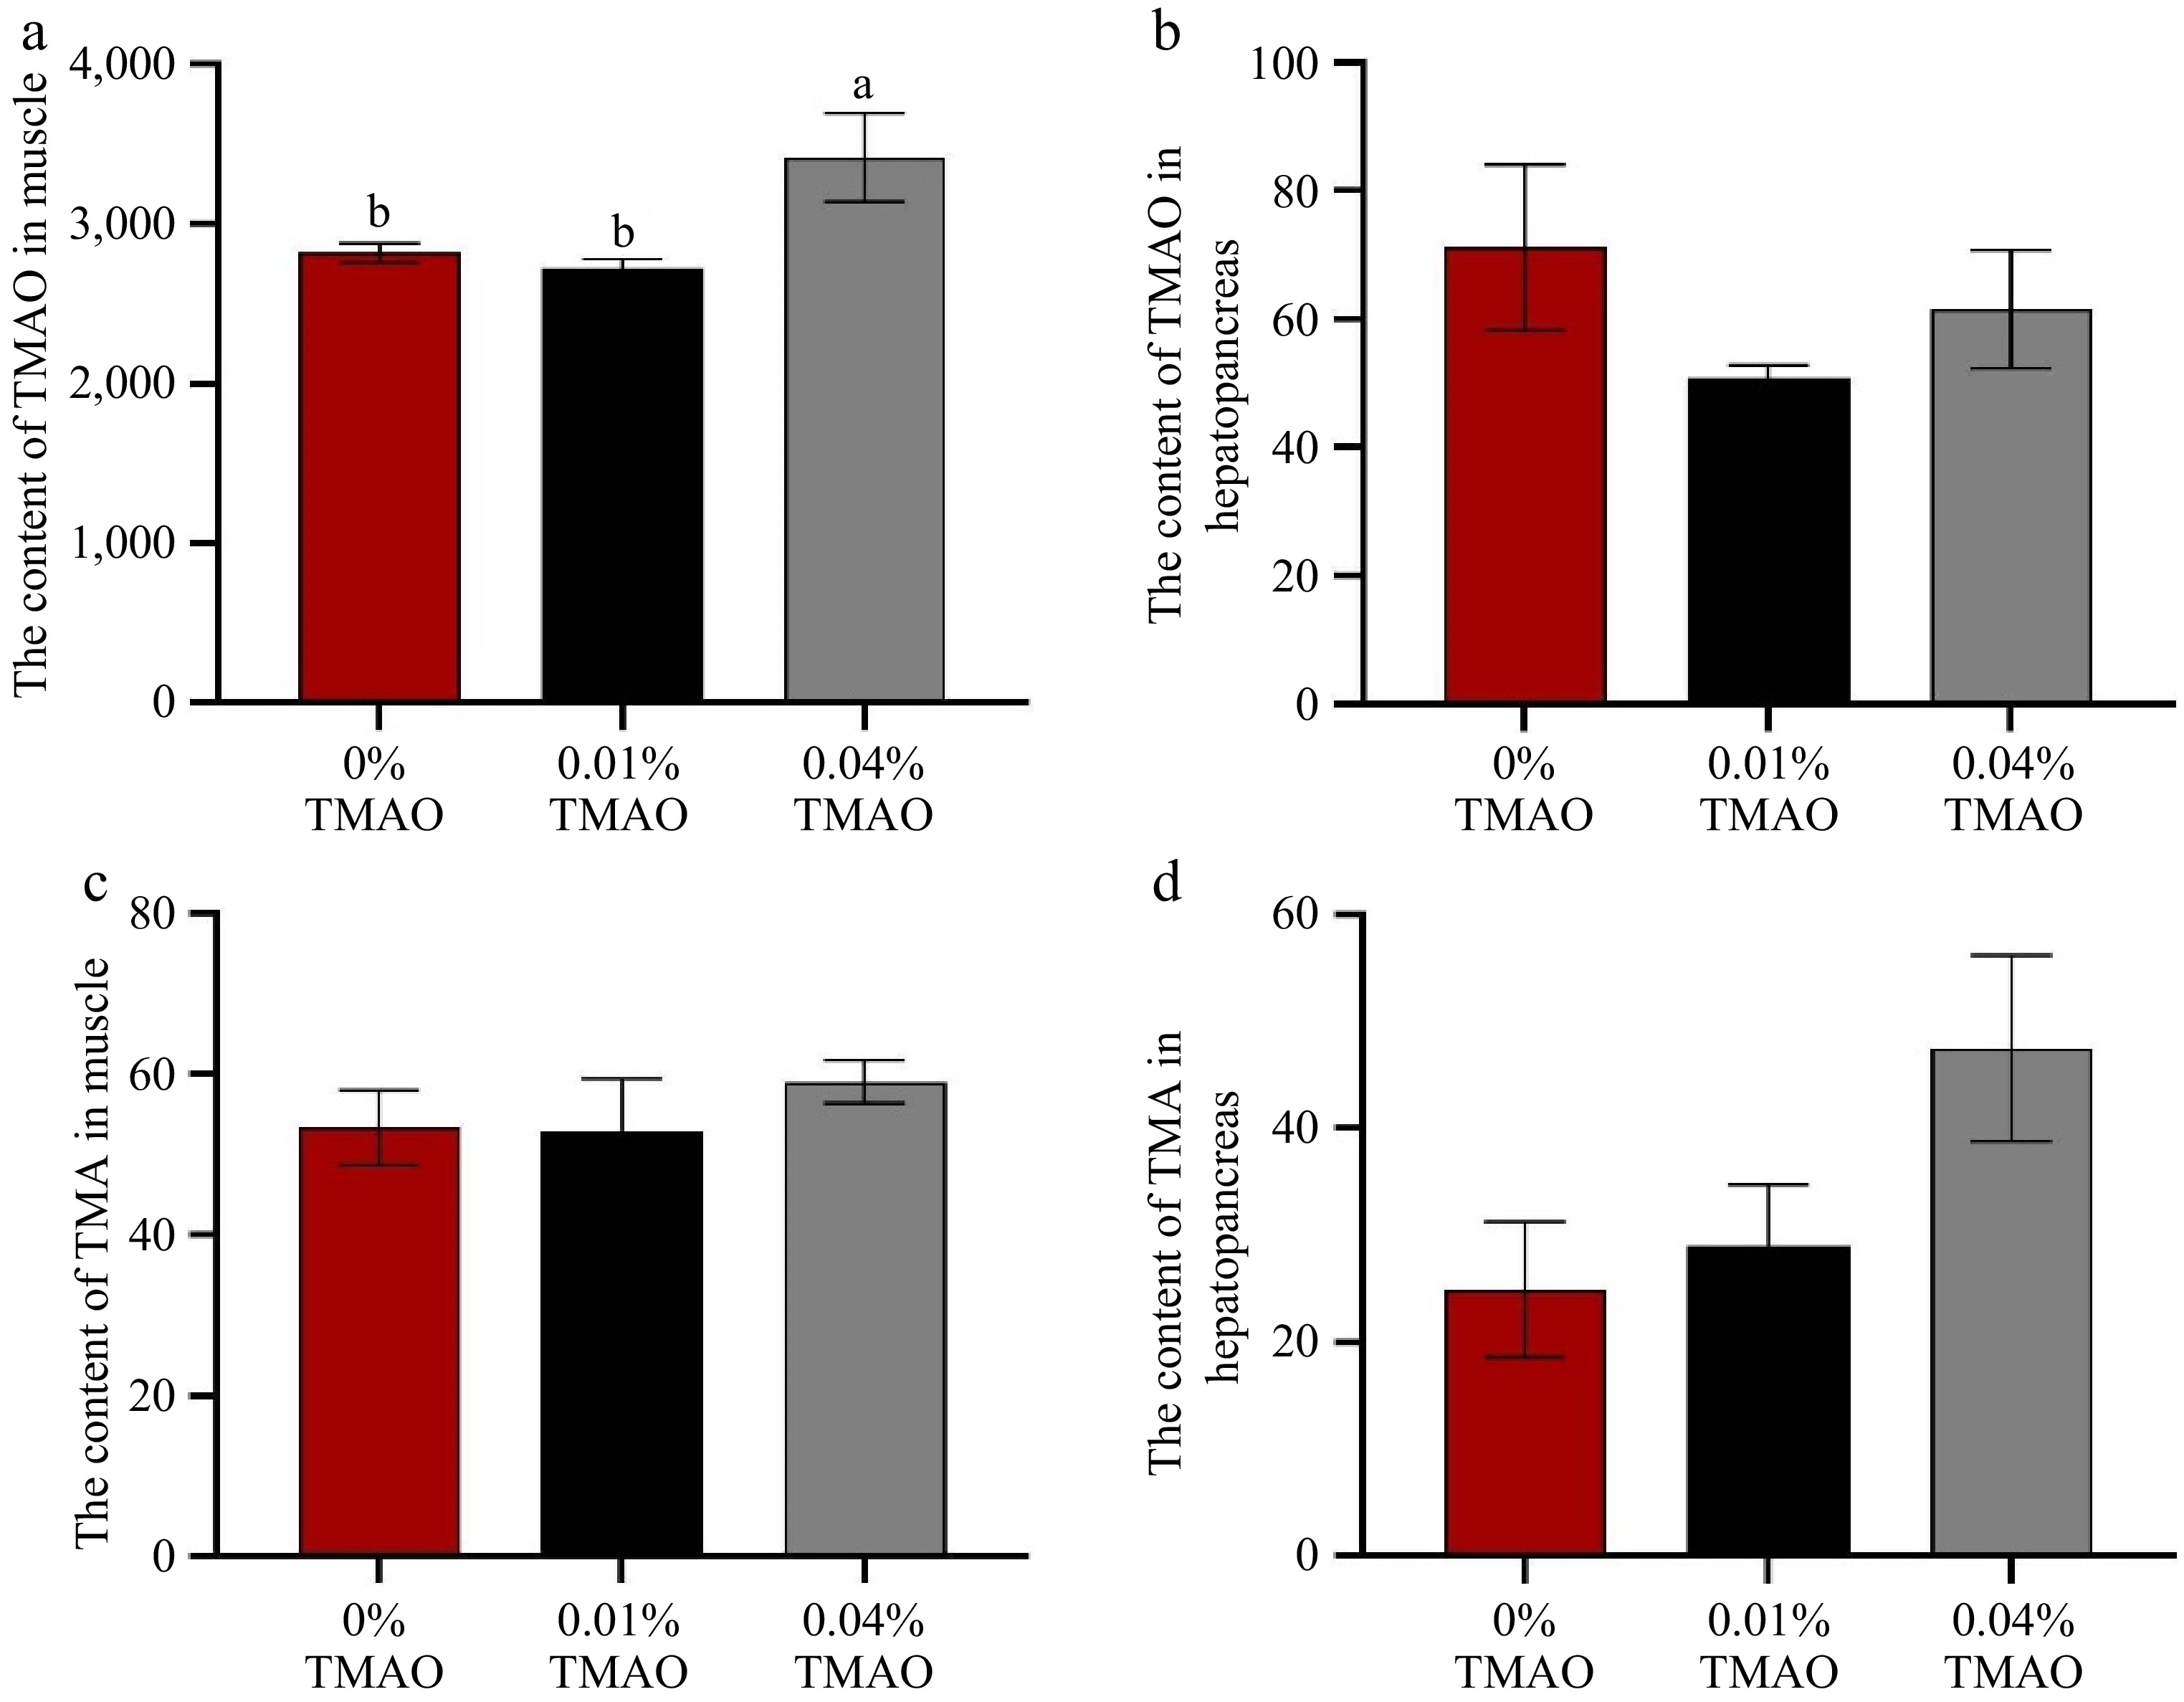
Figure 3.
Effect of dietary TMAO on (a) the content of TMAO in muscle, (b) the content of TMAO in the hepatopancreas, (c) the content of TMA in muscle, and (d) the content of TMA in the hepatopancreas. The values are the means ± SEM (n = 3). Different letters indicate significant differences (p < 0.05).
-
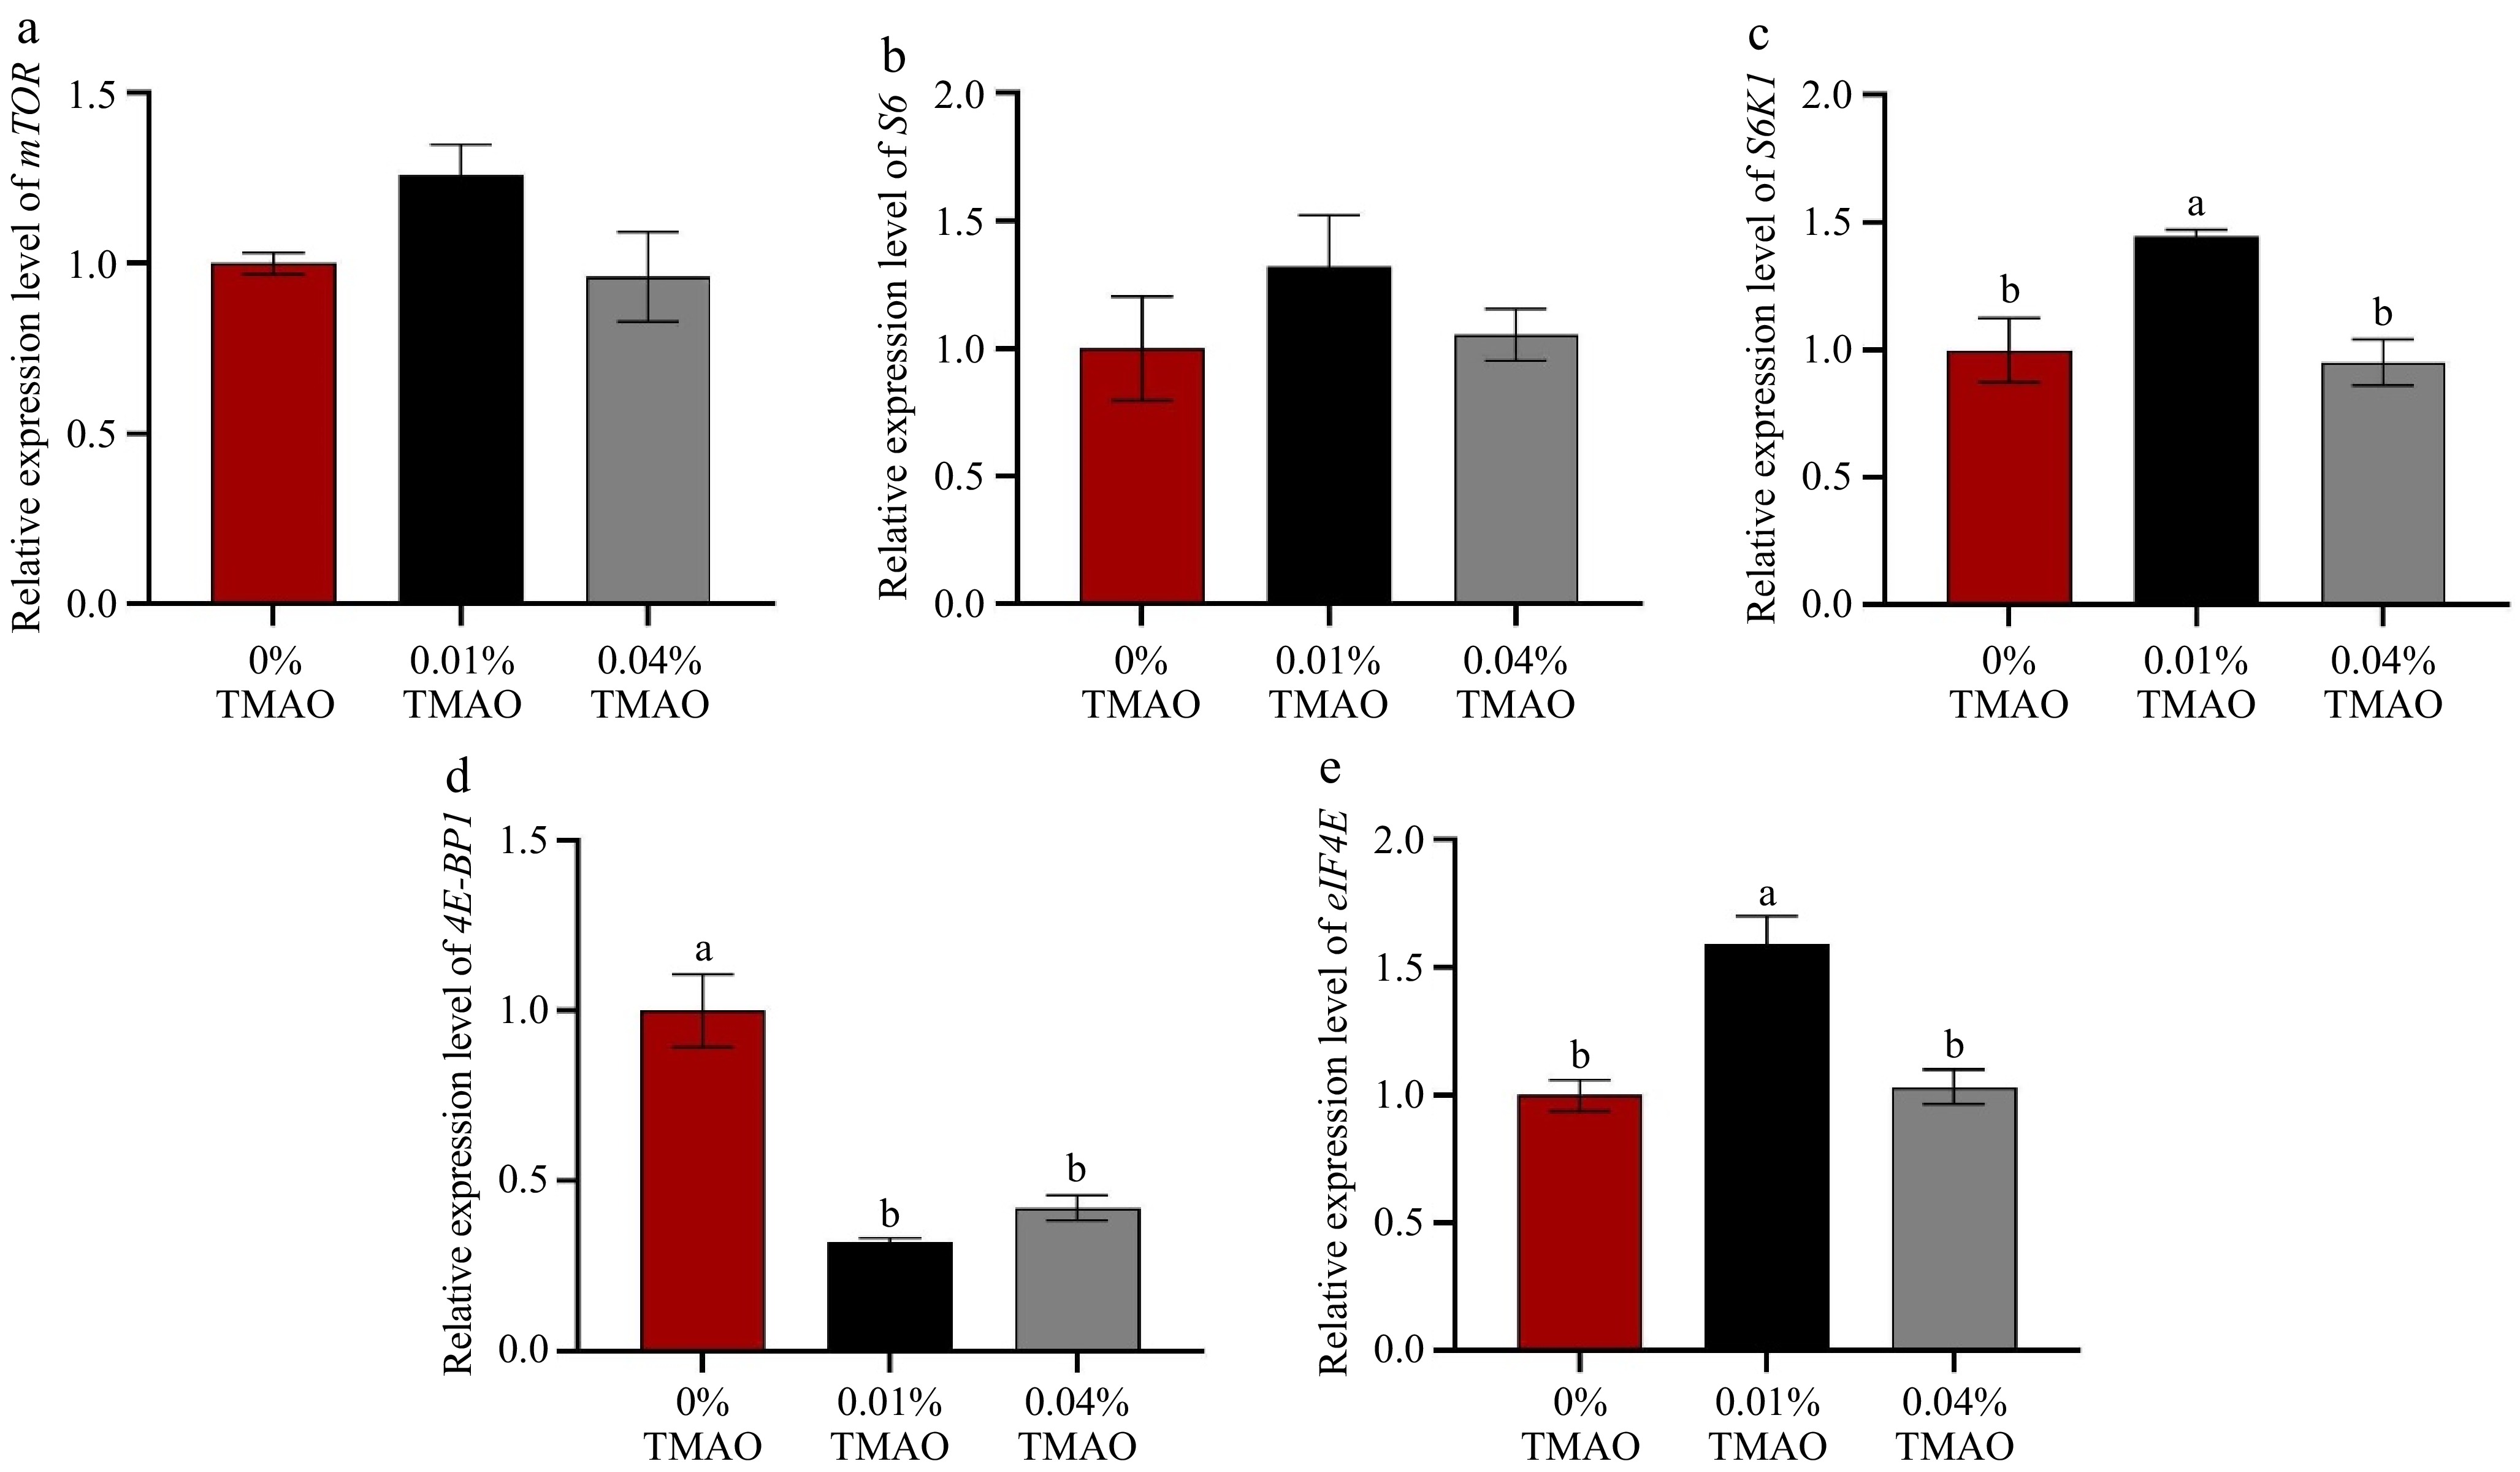
Figure 4.
Effect of dietary TMAO on (a) mammalian target of rapamycin (mTOR), (b) ribosomal protein S6 (S6), (c) ribosomal S6 protein kinase (S6K1), (d) eukaryotic translation initiation factor 4E-binding protein 1 (4E-BP1), and (e) eukaryotic translation initiation factor 4E (eIF4E). The values are the means ± SEM (n = 3). Different letters indicate significant differences (p < 0.05).
-
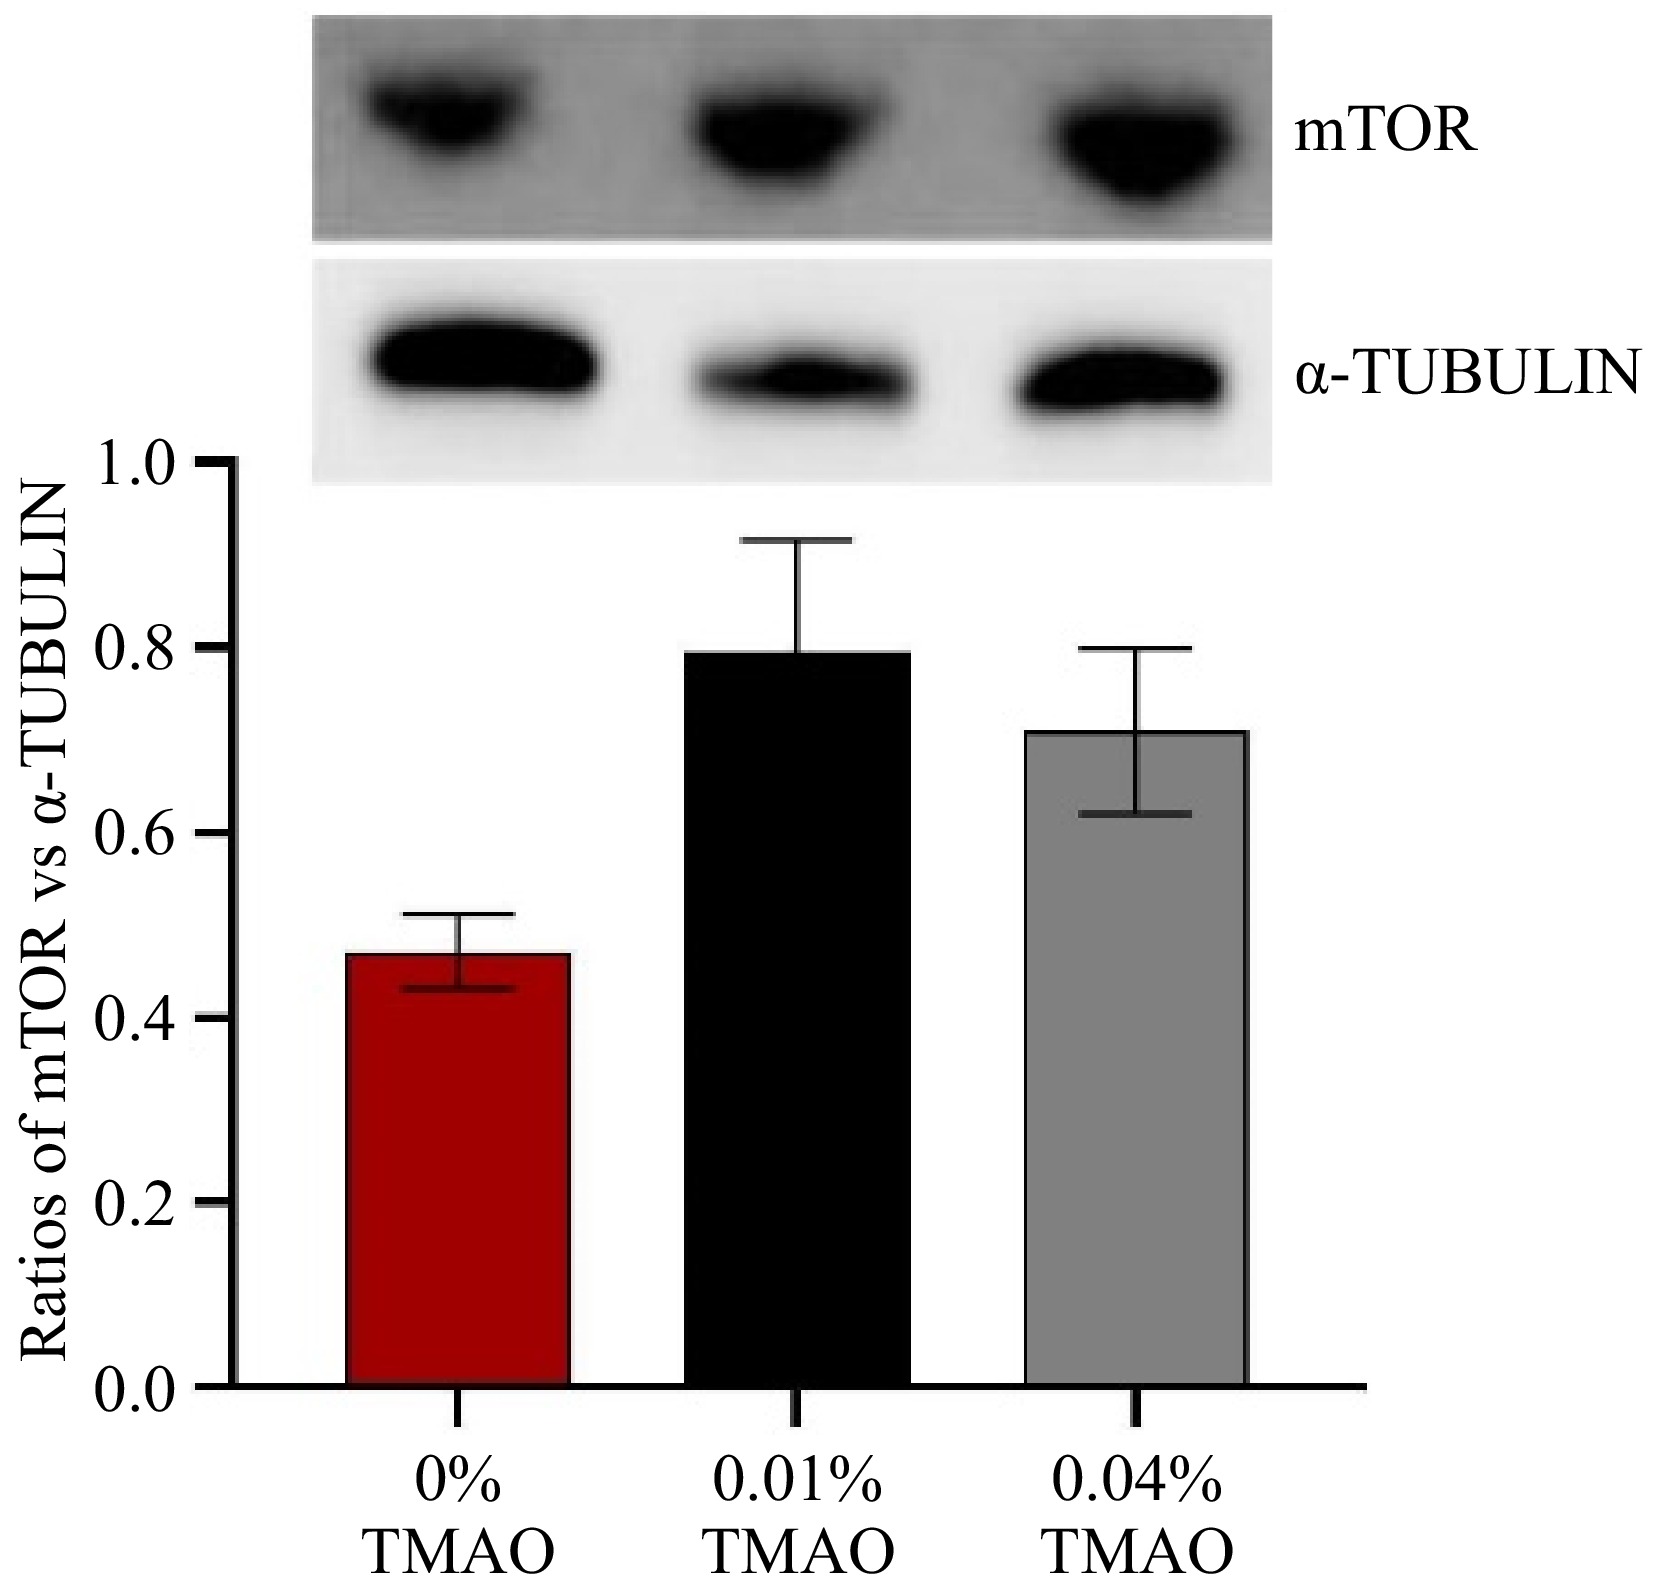
Figure 5.
Effect of dietary TMAO on mammalian target of rapamycin (mTOR) in muscle. α-TUBULIN is the internal reference protein. The values are the means ± SEM (n = 3).
-
Ingredients (%) 0% TMAO 0.01% TMAO 0.04% TMAO Fish meal 25.00 25.00 25.00 Rapeseed meal 2.50 2.50 2.50 Soybean meal 8.00 8.00 8.00 Cottonseed meal 3.00 3.00 3.00 Peanut meal 27.60 27.59 27.56 α-Starch 20.50 20.50 20.50 Fish oil 1.20 1.20 1.20 Soybean oil 3.90 3.90 3.90 Cholesterol 0.20 0.20 0.20 Carboxymethyl cellulose 2.00 2.00 2.00 Ca(H2PO4)2·H2O 2.20 2.20 2.20 Lecithin 0.20 0.20 0.20 Zeolite 0.40 0.40 0.40 Premixa 1.00 1.00 1.00 Mixtureb 2.30 2.30 2.30 Trimethylamine N-oxidec 0.00 0.01 0.04 Total 100.00 100.00 100.00 Proximate composition Crude protein 36.12 36.09 36.34 a Premix supplied the following vitamins (IU or mg/kg) and minerals (g/kg): vitamin A, 900,000 IU; vitamin B1, 320 mg; vitamin B2, 1,090 mg; vitamin B5, 2,000 mg; vitamin B6, 500 mg; vitamin B12, 1.6 mg; vitamin C, 10,000 mg; vitamin D, 200,000 IU; vitamin E, 4,500 mg; vitamin K3, 220 mg; pantothenate, 1,000 mg; folic acid, 165 mg; choline, 60,000 mg; biotin, 100 mg; and myoinositol, 15,000 mg; ZnSO4·7H2O, 22 g; FeSO4·7H2O, 25 g; CuSO4·5H2O, 2 g; MnSO4·4H2O, 7 g; CoCl2·6H2O, 0.1 g; KI, 0.026 g; Na2SeO3, 0.04 g. b Mixture includes the following ingredients (%): mildew-proof agent 2.35%; antioxidants 1.72%; choline chloride 4.75%; Lvkangyuan 59.61%; salt 22.06%; and biostime 9.51%. c Trimethylamine N-oxide was purchased from Nanjing Lattice Chemical Technology Co., Ltd, Nanjing, Jiangsu, China. Table 1.
Ingredient formulation in this feeding trial.
-
Gene Position Primer sequence Genebank
accessionLength Ref. mTOR Forward AGAAGCTGCATGACTGGGAC c148249_g1 20 [37] Reverse CGGTCACACGACACACTGTA 20 S6 Forward TTCCGAGGGTGAACAAGACG c141087_g1 20 [37] Reverse CTGGCCCATACGCTTCTCAT 20 S6K1 Forward TCAATAGCGTCGTCATCG c74214_g1 18 [37] Reverse CCCTGCGTGTAGTGGTTG 18 4E-BP1 Forward GCAACACGCCAACTAAACTC c114480_g1 20 [37] Reverse GCGACACCACCTAATATCCA 20 eIF4E Forward CAAGGCTGAGCAGGACTTCA c56848_g1 20 [37] Reverse AGCTGATCCAGGTCACAAGC 20 β-actin Forward TCGTGCGAGACATCAAGGAAA KM244725.1 21 [38] Reverse AGGAAGGAAGGCTGGAAGAGTG 22 mTOR: mammalian target of rapamycin; S6: ribosomal protein S6; S6K1: ribosomal S6 protein kinase; 4E-BP1: eukaryotic translation initiation factor 4E-binding protein 1; eIF4E: eukaryotic translation initiation factor 4E. Table 2.
Primer pair sequences and length of the genes used for real-time PCR (qPCR).
-
Indexs 0% TMAO 0.01% TMAO 0.04% TMAO p value SR (%) 60 ± 5.77 66.67 ± 6.67 66.67 ± 13.33 0.844 WGR (%) 114.56 ± 5.00 119.20 ± 8.37 124.98 ± 9.26 0.656 FCR 2.72 ± 0.22a 2.09 ± 0.05b 2.02 ± 0.21b 0.049 FI (g) 117.44 ± 4.53a 93.46 ± 4.85b 92.09 ± 2.70b 0.008 HSI (%) 6.12 ± 0.45 6.17 ± 0.02 5.33 ± 0.56 0.342 CW (cm) 57.35 ± 1.05 58.11 ± 1.04 57.01 ± 1.62 0.826 CL (cm) 52.11 ± 0.23 51.29 ± 1.24 51.86 ± 1.68 0.889 BH (cm) 27.89 ± 0.81 26.38 ± 0.65 27.02 ± 0.71 0.399 SR: survival rate; WGR: weight gain rate; FCR: feed conversion ratio; FI: feed intake; HSI: hepatopancreas somatic indices; CW: carapace width; CL: carapace length; BH: body height. The values are the means ± SEM (n = 3). Values in the same row with different superscripts are significantly different at p < 0.05. Table 3.
Growth performance of Chinese mitten crab fed experimental diets with different concentrations of trimethylamine N-oxide.
-
Muscle 0% TMAO 0.01% TMAO 0.04% TMAO p value Essential amino acid Threonine 0.54 ± 0.05 0.57 ± 0.01 0.60 ± 0.05 0.610 Valine 0.52 ± 0.04 0.56 ± 0.01 0.60 ± 0.05 0.441 Methionine 0.30 ± 0.03a 0.31 ± 0.02a 0.41 ± 0.01b 0.014 Isoleucine 0.45 ± 0.05 0.53 ± 0.01 0.55 ± 0.04 0.171 Leucine 0.81 ± 0.07 0.92 ± 0.01 0.95 ± 0.07 0.287 Phenylalanine 0.50 ± 0.04 0.53 ± 0.01 0.57 ± 0.06 0.456 Lysine 0.93 ± 0.07 1.01 ± 0.02 1.03 ± 0.08 0.492 Histidine 0.28 ± 0.03 0.29 ± 0.00 0.32 ± 0.03 0.539 Arginine 1.18 ± 0.08 1.24 ± 0.03 1.36 ± 0.09 0.268 Non-essential amino acid Aspartic acid 1.10 ± 0.08 1.21 ± 0.02 1.26 ± 0.10 0.373 Serine 0.51 ± 0.04 0.54 ± 0.01 0.59 ± 0.05 0.413 Glutamic acid 1.78 ± 0.13 1.95 ± 0.03 2.01 ± 0.15 0.378 Glycine 0.87 ± 0.05 0.90 ± 0.05 0.88 ± 0.02 0.876 Alanine 0.83 ± 0.06 0.91 ± 0.03 0.98 ± 0.12 0.490 Cystine 0.14 ± 0.02 0.14 ± 0.02 0.17 ± 0.02 0.548 Tyrosine 0.40 ± 0.04 0.44 ± 0.02 0.50 ± 0.12 0.278 Proline 0.47 ± 0.06 0.46 ± 0.03 0.51 ± 0.03 0.659 Total 11.61 ± 0.85 12.52 ± 0.29 13.27 ± 1.01 The values are the means ± SEM (n = 4). Values in the same row of each tissue with different superscripts are significantly different at p < 0.05. Table 4.
Effect on the composition of amino acids in the muscle of Chinese mitten crab fed experimental diets with different concentrations of trimethylamine N-oxide.
-
Amines 0% TMAO 0.01% TMAO 0.04% TMAO p value Spermidine 450.23 ± 51.83a 372.72 ± 12.41ab 334.46 ± 19.94b 0.112 Spermine 88.87 ± 11.95a 39.39 ± 3.09b 28.01 ± 1.35b 0.002 Cadaverine 62.83 ± 7.75 43.58 ± 11.26 34.17 ± 5.31 0.126 Histamine 10.78 ± 0.62 10.48 ± 0.15 10.07 ± 0.07 0.445 Putrescine 345.77 ± 37.71 312.99 ± 70.59 328.98 ± 66.13 0.423 Tyramine 5.89 ± 1.04 6.68 ± 0.78 7.73 ± 0.92 0.421 The values are the means ± SEM (n = 3). Values in the same row of with different superscripts are significantly different at p < 0.05. Table 5.
Deposition of biogenic amines in muscle of Chinese mitten crab fed experimental diets with different concentrations of trimethylamine N-oxide.
Figures
(5)
Tables
(5)