-
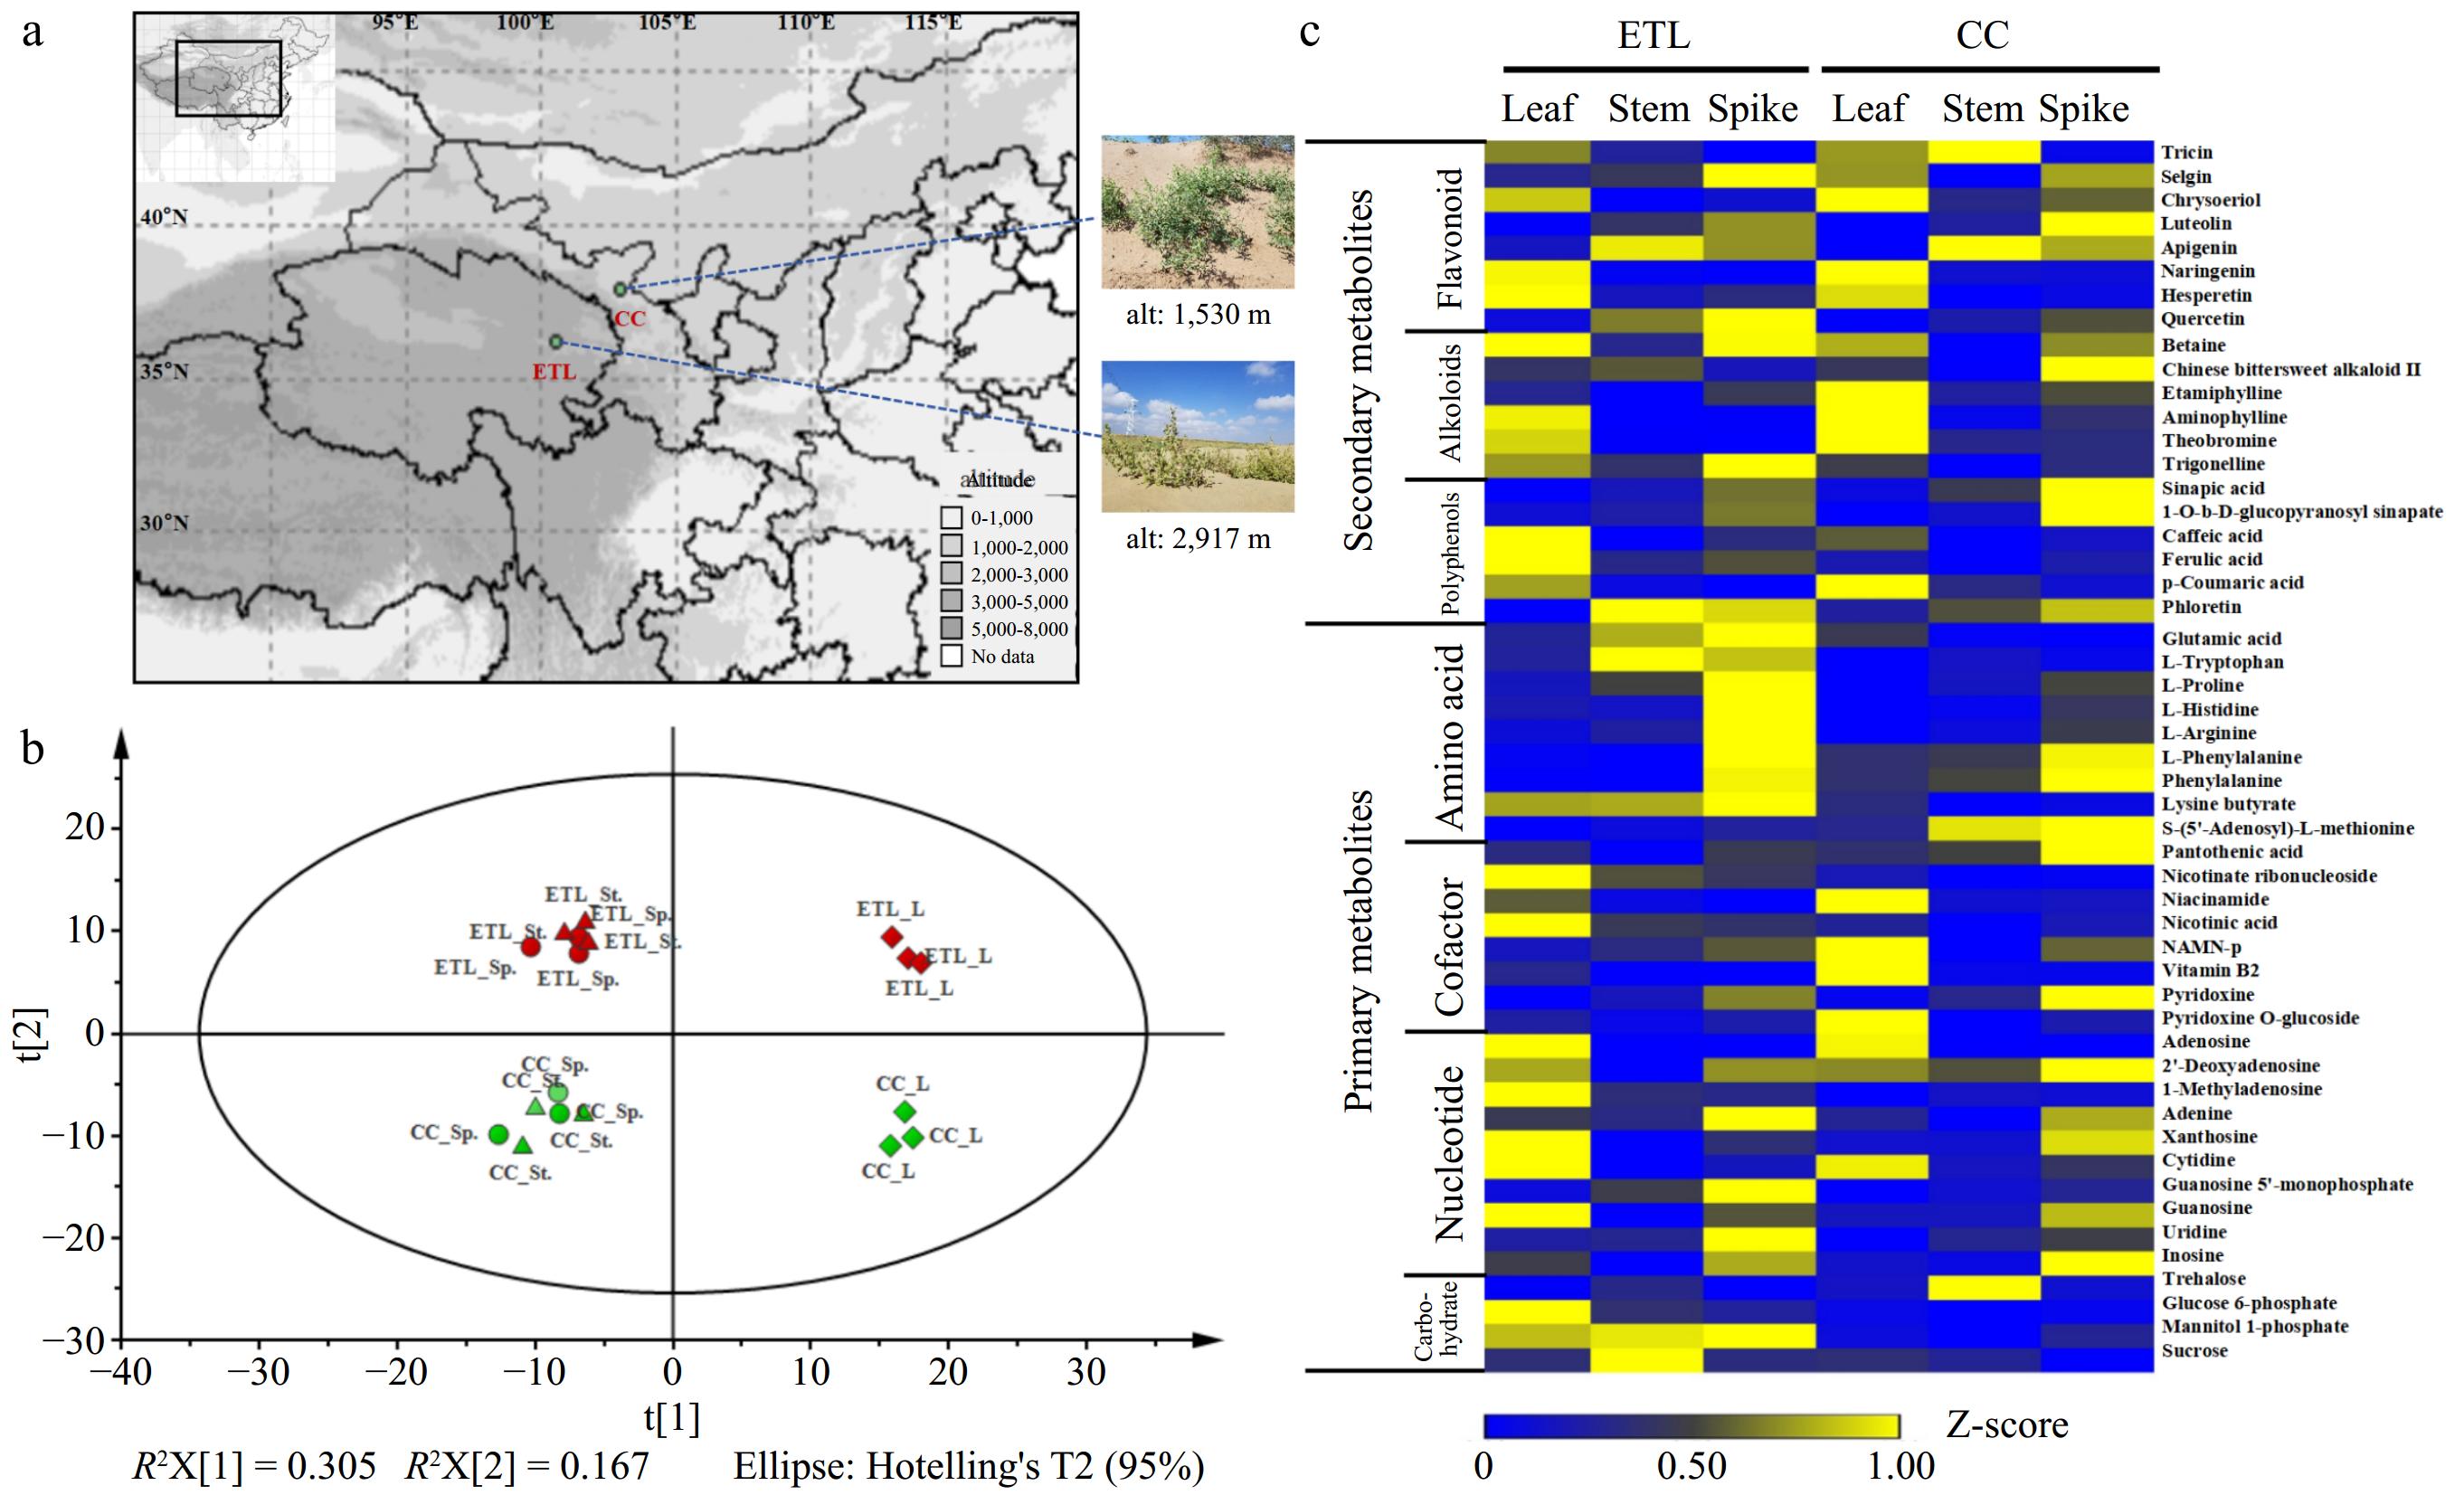
Figure 1.
Comparative metabolomic profilings of two altitudinal ecotypes of A. squarrosum. (a) Geographical localization of two altitudinal ecotypes of A. squarrosum provenances. (b) PCA plot of two ecotypes metabolomes revealing the first two principal components with t[1] = 30.5% and t[2] = 16.7%. The meaning of each abbreviation is as follows: L (leaf), St. (stem), Sp. (spike). Each samples have three biological replicates. (c) Heat map showing standardized contents of partial classified metabolites in different tissues of ETL and CC ecotype. These metabolites are classed into two groups according to their chemical characters.
-
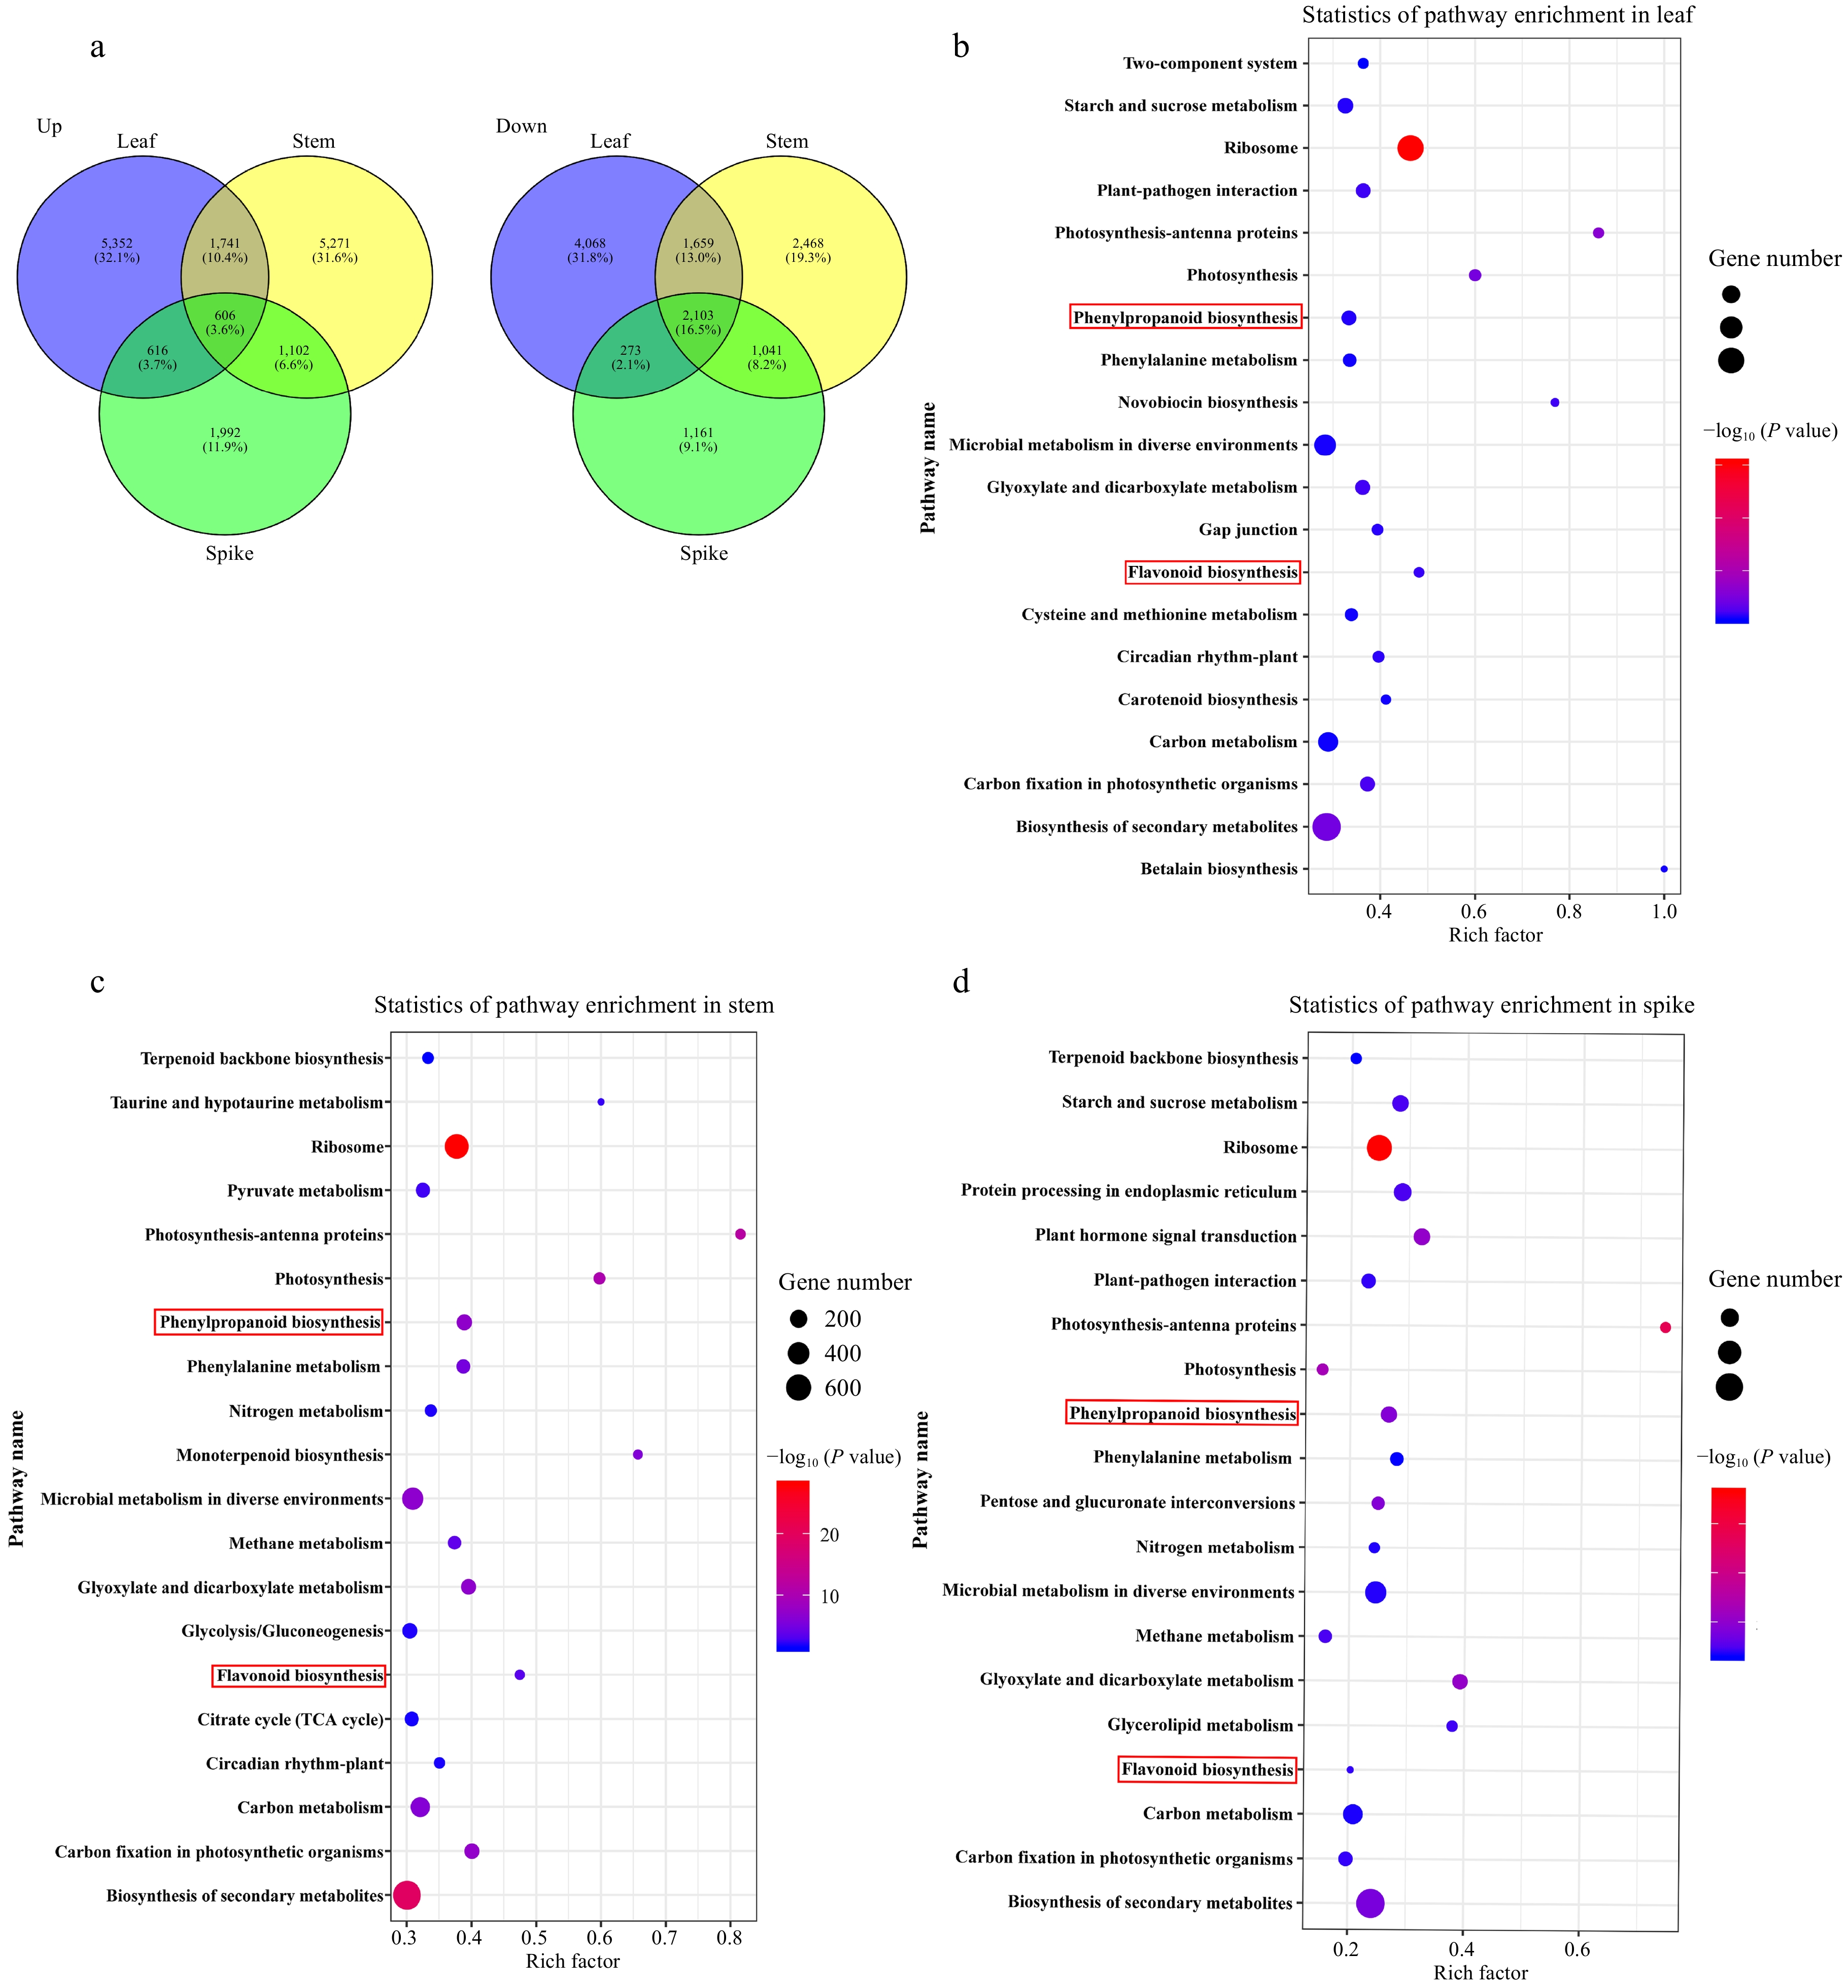
Figure 2.
The state and KEGG pathway enrichment of differentially expressed genes (DEGs) in different tissues from high- and middle-ecotypes of A. squarrosum. (a) Venn diagram indicating the overlapping and unique up-regulated (left) and down-regulated (right). (b)−(d) KEGG pathway enrichment analysis of DEGs in leaf, stem and spike. The number of genes is indicated by the size of the circle and the color of the circle shows significant enrichment through P-value. The top 20 pathways with the minimum P-value are shown in each tissue.
-
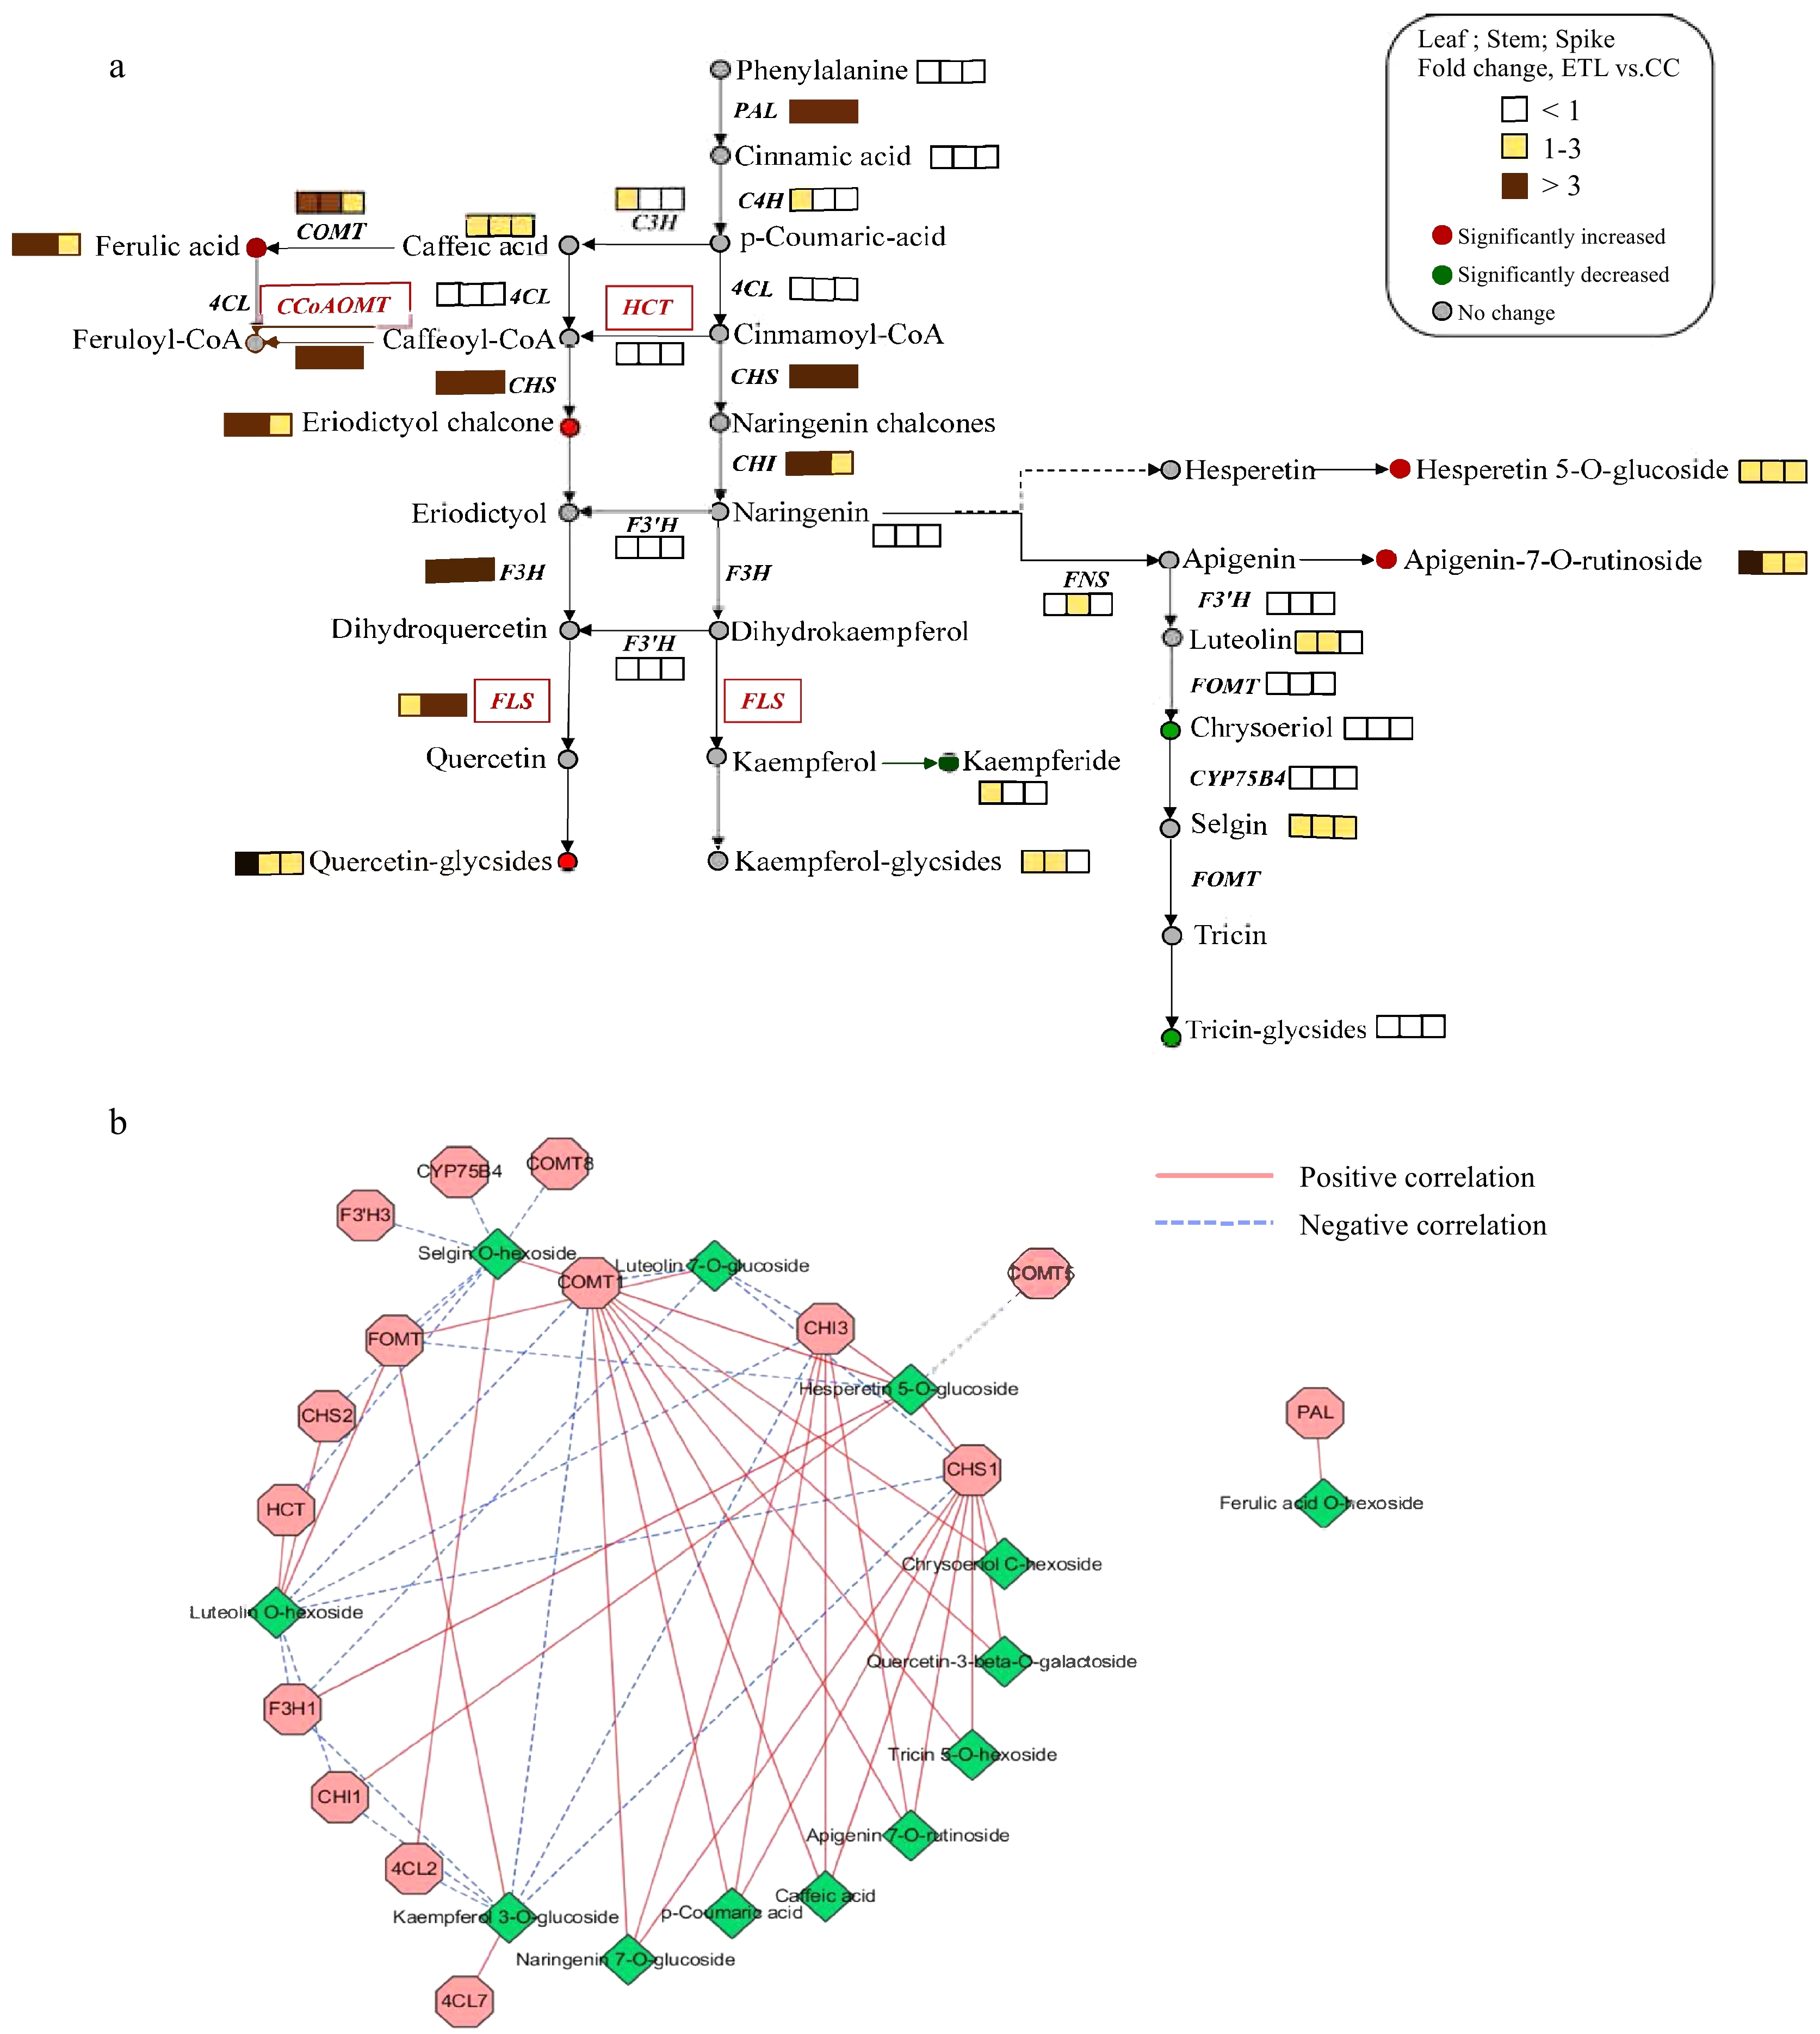
Figure 3.
Phenylpropanoid and flavonoid pathways in A. squarrosum. (a) The schematic representation of gene and metabolite changes in phenylpropanoid and flavonoid pathways. The dotted line represented unreported pathway. (b) The interacted network constituted from genes and metabolites co-expression in phenylpropanoid and flavonoid pathways.
-
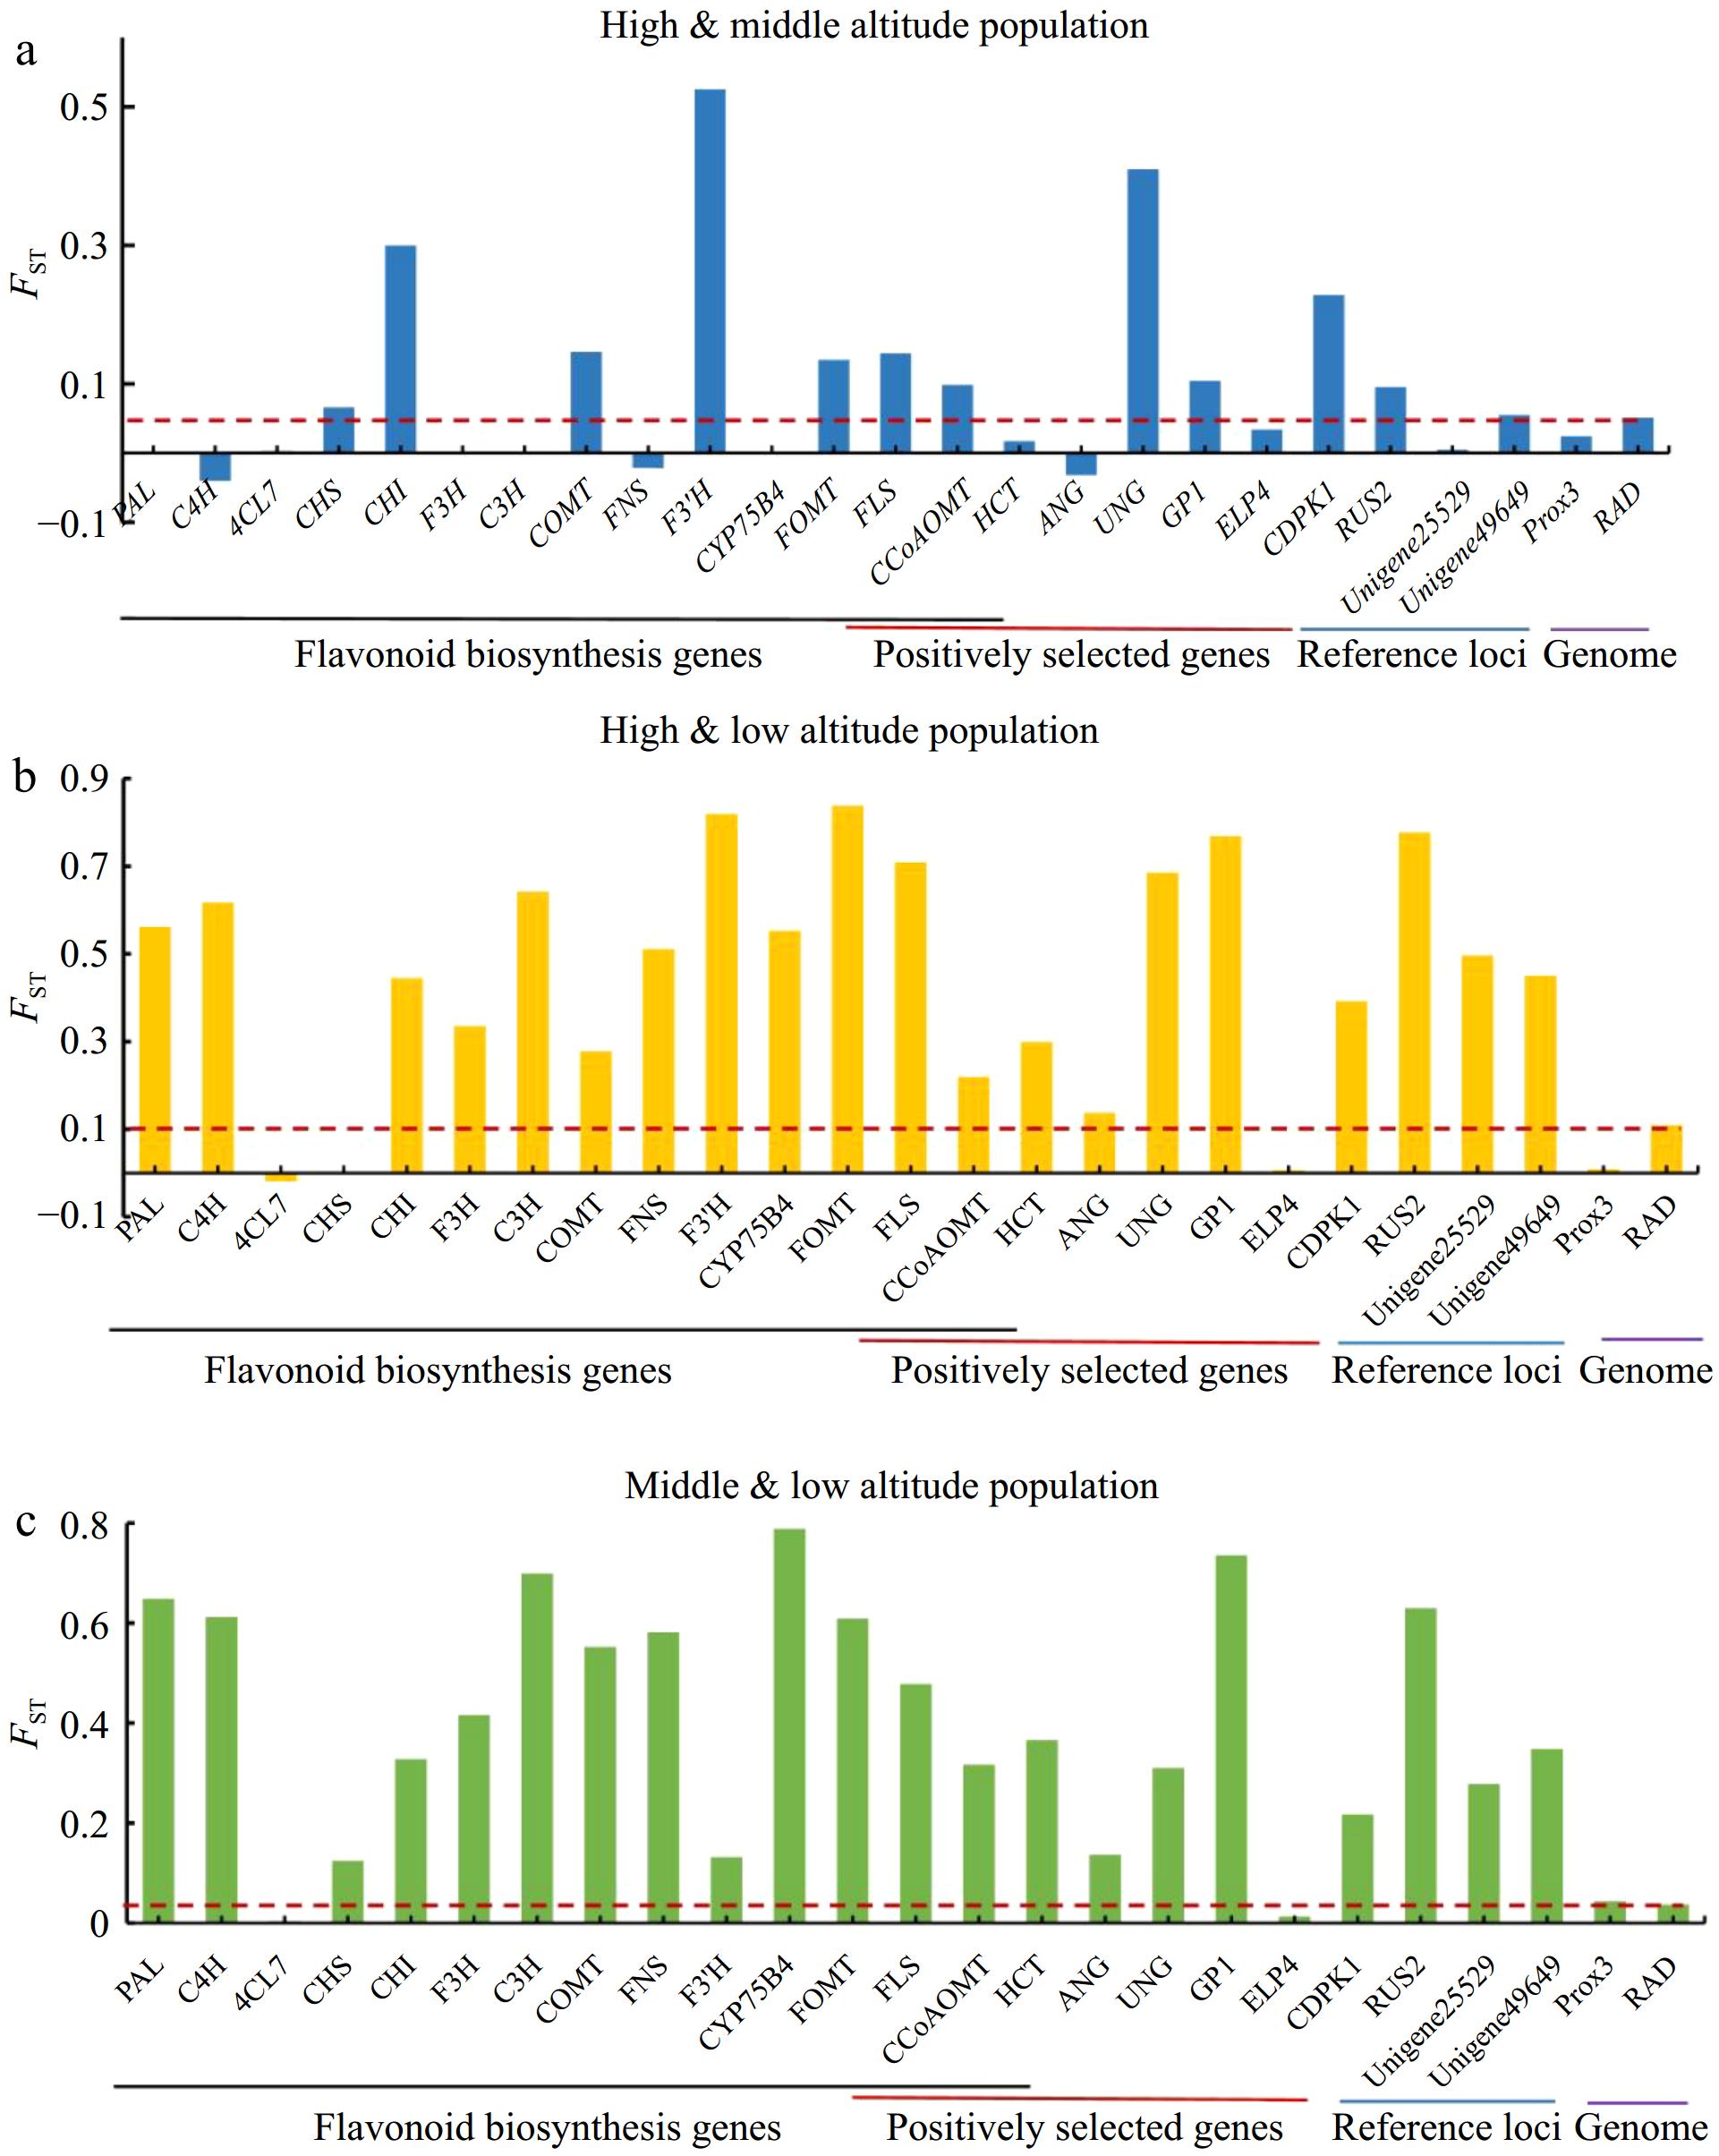
Figure 4.
Genetic differentiation among different altitudinal populations in A. squarrosum. (a) High- and middle-altitude populations. (b) High- and low-altitude populations. (c) Middle- and low-altitude populations. The red dashed line represents the average genome-wide FST level.
-
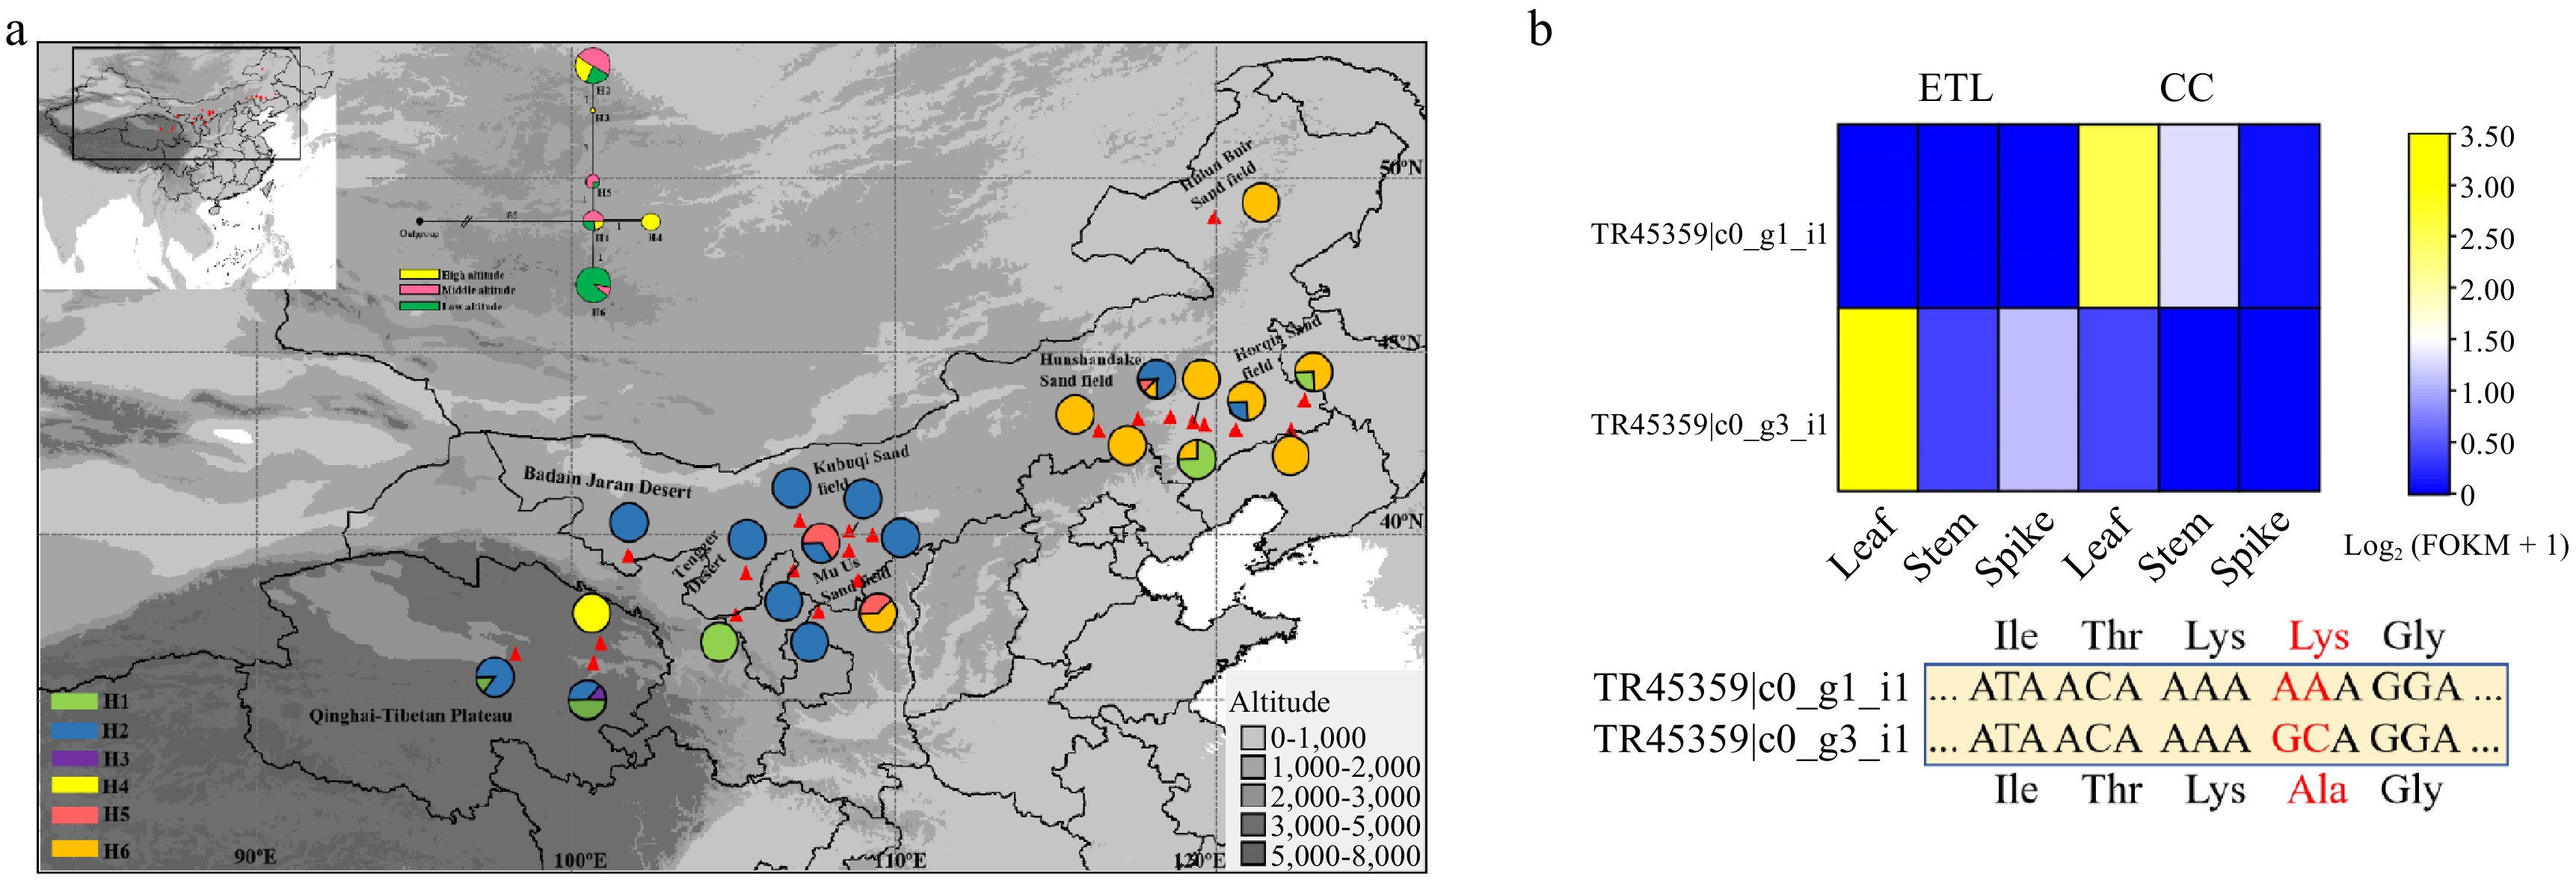
Figure 5.
Haplotype distribution of CCoAOMT in A. squarrosum populations and the expression of two alleles of this gene based on transcriptome data. (a) Haplotype topology of CCoAOMT. (b) Expression levels and mutation sites of the two CCoAOMT alleles in high-altitude and middle-altitude ecotypes of A. squarrosum.
-
Class Metabolite name ETL vs CC Leaf Stem Spike FC VIP FC VIP FC VIP Flavonoid Naringenin 7-O-glucoside 0.98 0.01 0.61 0.56 0.52 0.56 Hesperetin 5-O-glucoside 1.30 0.27 2.00 1.22 2.38 1.22 Apigenin 7-O-rutinoside 105.03 1.59 2.44 0.66 2.18 0.66 Luteolin 7-O-glucoside 1.44 0.67 1.31 0.43 0.93 0.43 Luteolin O-hexoside 1.77 0.96 1.33 0.78 0.92 0.78 Chrysoeriol O-hexoside 0.39↓ 1.52 0.45 0.94 0.65 0.94 Chrysoeriol C-hexoside 0.42 0.57 0.33 0.72 0.26 0.72 Selgin O-hexoside 1.03 0.54 1.16 0.53 1.07 0.53 Tricin O-rutinoside 0.32 0.89 0.17↓ 1.02 0.32↓ 1.02 Tricin 7-O-rutinoside 0.34↓ 1.09 0.20↓ 1.27 0.40↓ 1.27 Tricin 5-O-hexoside 0.83 0.12 0.43↓ 1.19 0.38↓ 1.19 Eriodictyol chalcone 5.93 1.39 3.43 1.42 2.62 1.42 Quercetin-3-beta-O-galactoside 4.23 1.03 1.19 0.08 1.07 0.08 Kaempferol 3-O-glucoside 1.55 0.96 1.24 0.38 0.95 0.38 Kaempferide 1.23 0.69 0.48↓ 1.42 0.62 1.42 Phenylpropanoids p-Coumaric acid 0.83 1.22 0.69 0.88 0.79 0.88 Caffeic acid 1.74 1.00 1.00 0.22 2.28 0.22 Ferulic acid O-hexoside 3.46 1.26 4.20 1.48 2.75 1.48 The relative abundance of metabolites were displayed in Supplementary Table S1. FC, the fold change of metabolites when ETL compared CC; VIP, variable importance in the projection value. Bold font indicates significantly changed metabolites (FC ≥ 2 or ≤ 0.5,VIP ≥ 0.5). represents increased metabolites in ETL. ↓ represents decreased metabolites in ETL. Table 1.
List of metabolites in phenylpropanoid and flavonoid biosynthesis pathways in two altitudinal ecotypes of A. squarrosum.
-
Unigene ID ETL_Leaf
FPKMCC_leaf
FPKMETL_spike
FPKMCC_spike
FPKMETL_stem
FPKMCC_stem
FPKMLa Ka Ks Ka/Ks Gene annotation Possible functions and biological process TR86494|c0_g1_i1 0 0 1.71 2.76 0.20 0.34 1044 0.00787 0.00365 2.157 Shikimate O-hydroxycinnamoyltransferase (HCT) Phenylpropanoid biosynthesis;
Flavonoid biosynthesisTR80792|c3_g1_i2 51.14 25.12 6.13 1.94 29.94 4.86 1176 0.00780 0.00423 1.845 Flavonol synthase (FLS) Phenylpropanoid biosynthesis;
Flavonoid biosynthesisTR45359|c0_g2_i1 29.58 5.35 1.73 0.27 7.19 1.72 489 0.0164 0.00899 1.828 Caffeoyl-CoA O-methyltransferase (CCoAOMT) Phenylpropanoid biosynthesis;
Flavonoid biosynthesisTR934|c0_g1_i1 0.94 0.84 2.68 2.48 2.49 1.38 1143 0.00288 0.00272 1.056 A/G-specific adenine DNA glycosylase (ANG ) Base excision repair TR74739|c0_g2_i1 2.13 3.45 3.52 3.52 3.50 2.85 1791 0.00514 0.00318 1.615 Uracil-DNA glycosylase (UNG) Base excision repair; Immune diseases TR39350|c0_g4_i1 1.59 3.59 1.53 2.28 9.18 6.21 1434 0.00358 0.00330 1.087 Vegetative cell wall protein gp1(GP1) Defense response TR39755|c0_g1_i1 7.79 2.74 5.65 4.64 7.37 3.86 1089 0.00505 0.00345 1.463 Elongator complex protein 4 (ELP4) Response to oxidative stress, abscisic acid signaling pathway TR40190|c7_g5_i1 25.76 28.38 23.06 20.04 31.05 27.46 300 0.02602 0.00831 3.130 Calcium-dependent protein kinase 1 (CDPK1) Plant-pathogen interaction; Response to drought, cold stress; Salicylic acid biosynthesis FPKM, gene expression level; La, the length of candidate genes (bp); Ka, nonsynonymous substitution rate; Ks, synonymous substitution rate; Ka/Ks, selective strength; p-value, the value computed by Fisher exact test when calculating Ka/Ks Table 2.
Typical differentiated genes for high elevation adaptation.
Figures
(5)
Tables
(2)