-
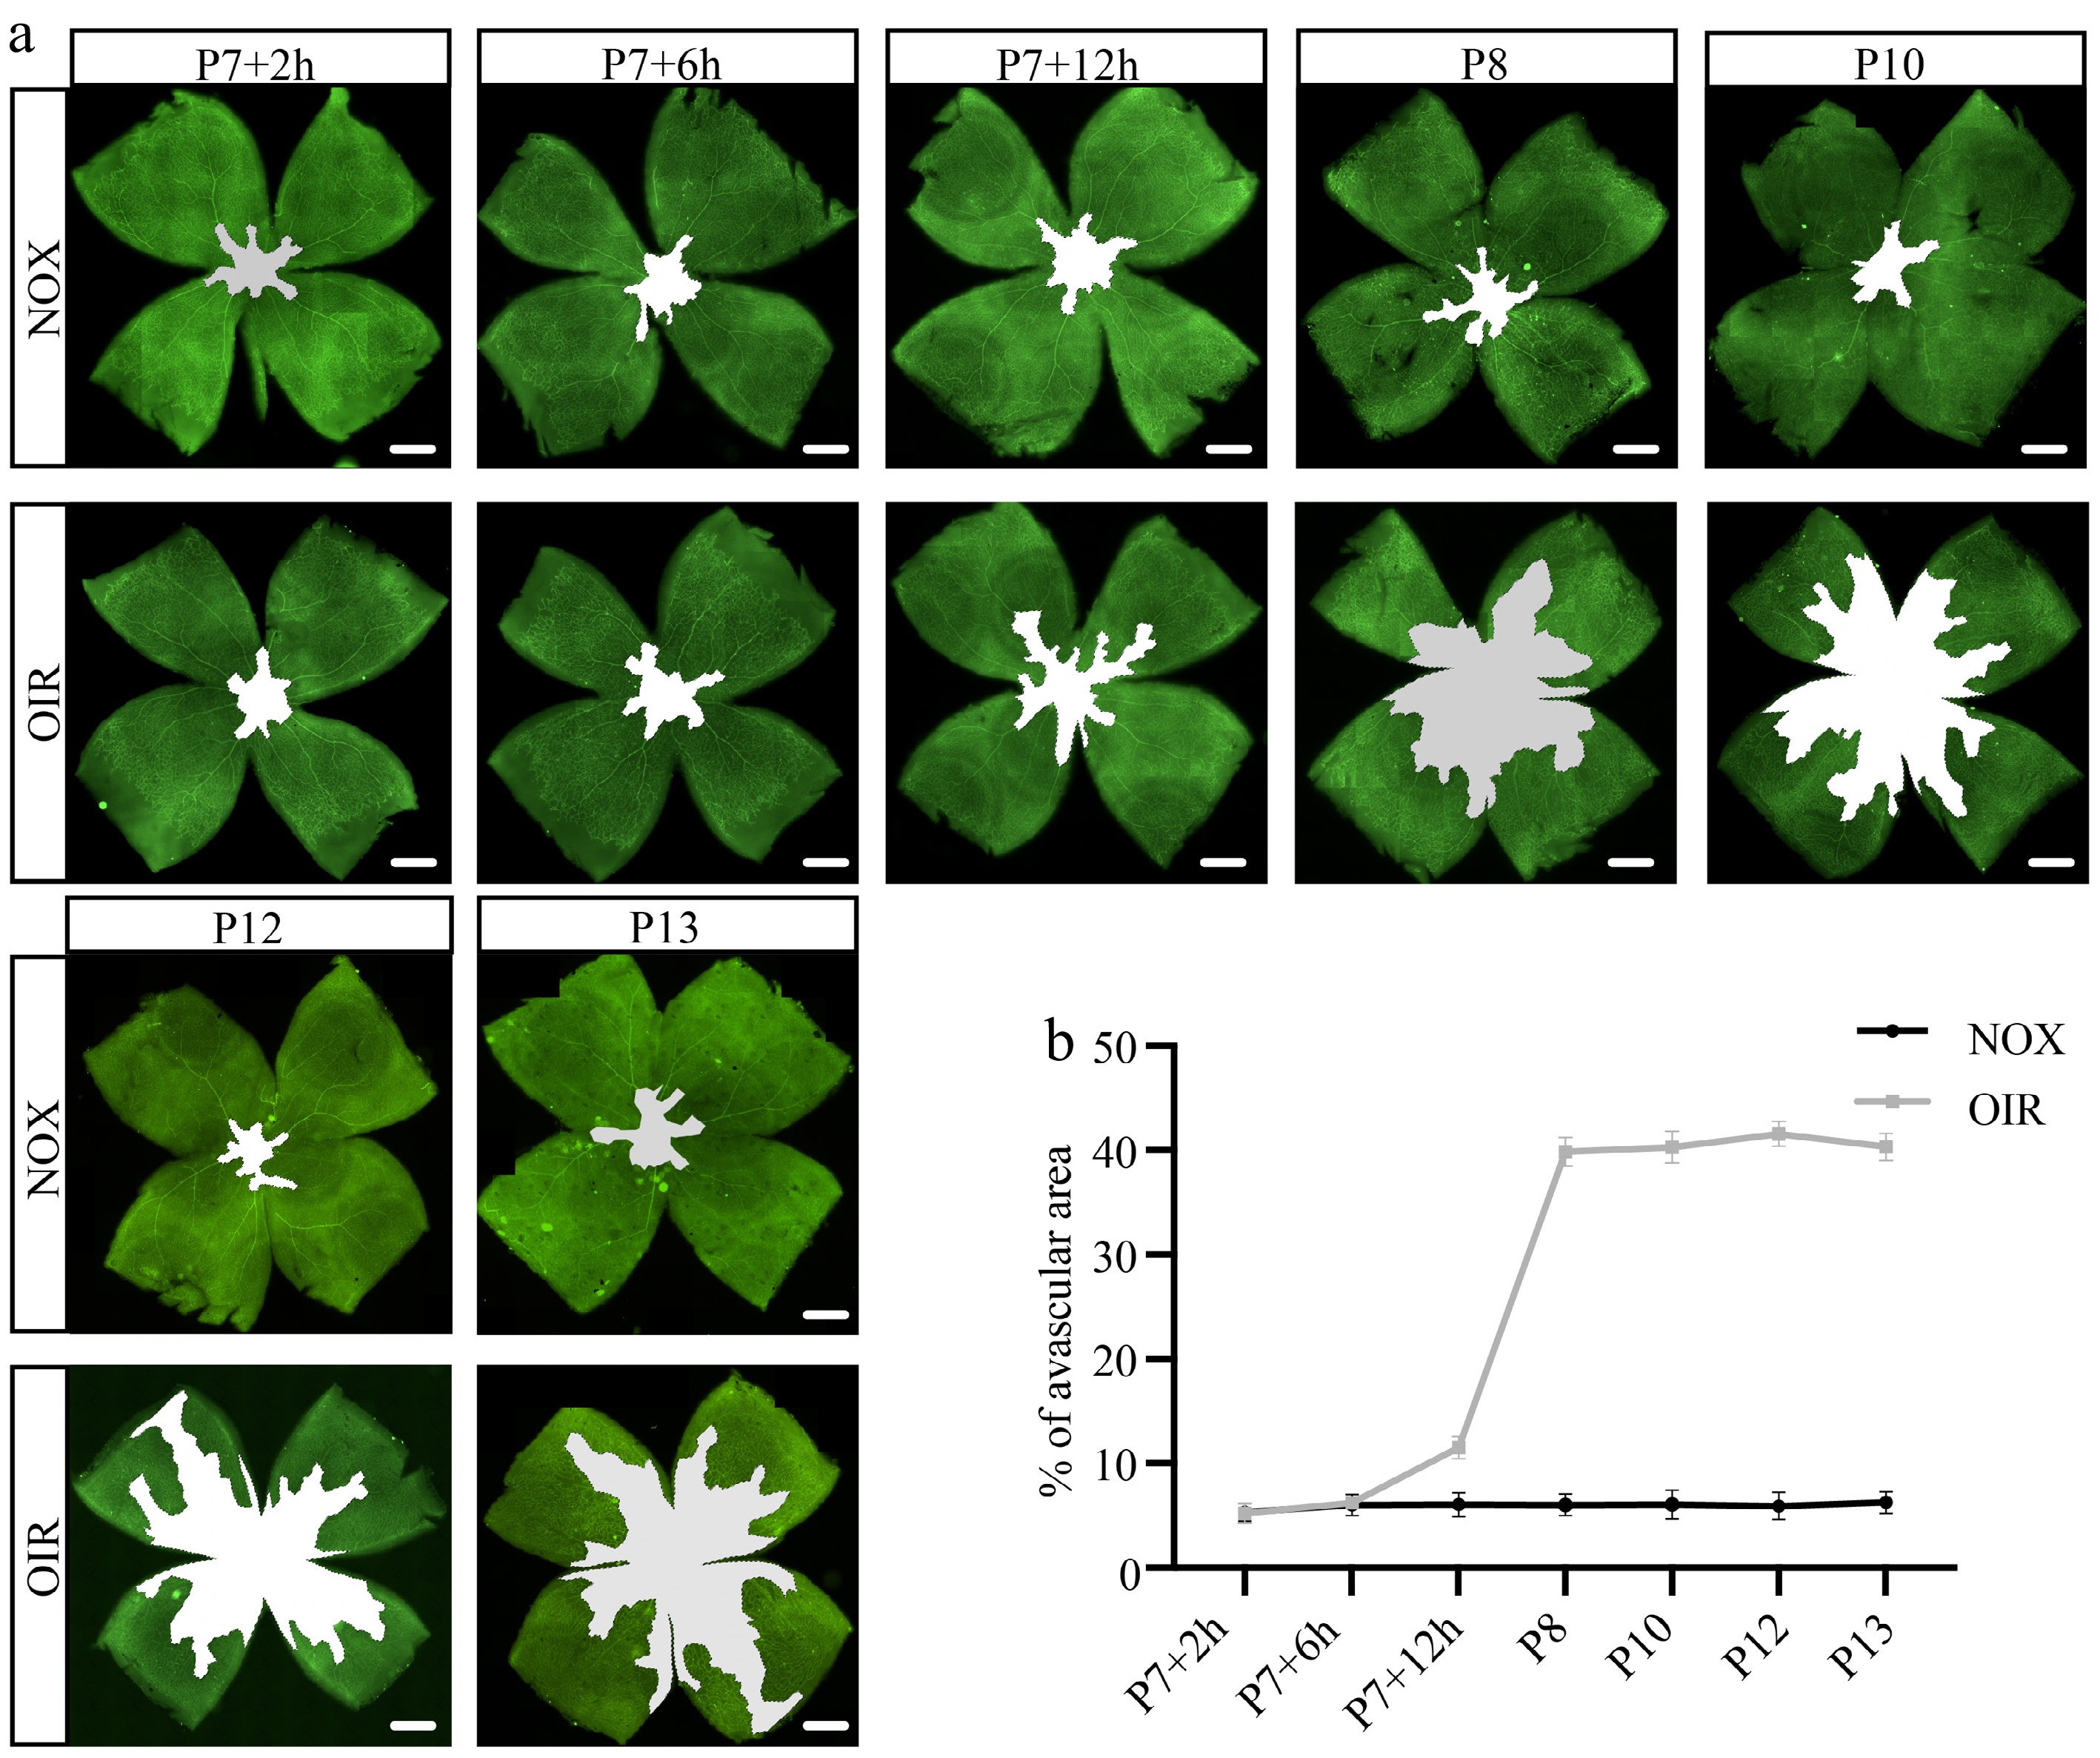
Figure 1.
Characteristics of retinal vascular regression under hyperoxic stimulation. (a) Representative panoramic images of retinal flat mounts stained with CD31 (green) at various time points, the white regions indicate avascular areas. Scale bar: 500 μm. (b) Proportion of avascular area in whole retina at different time points under hyperoxic stimulation. N = 5/group.
-
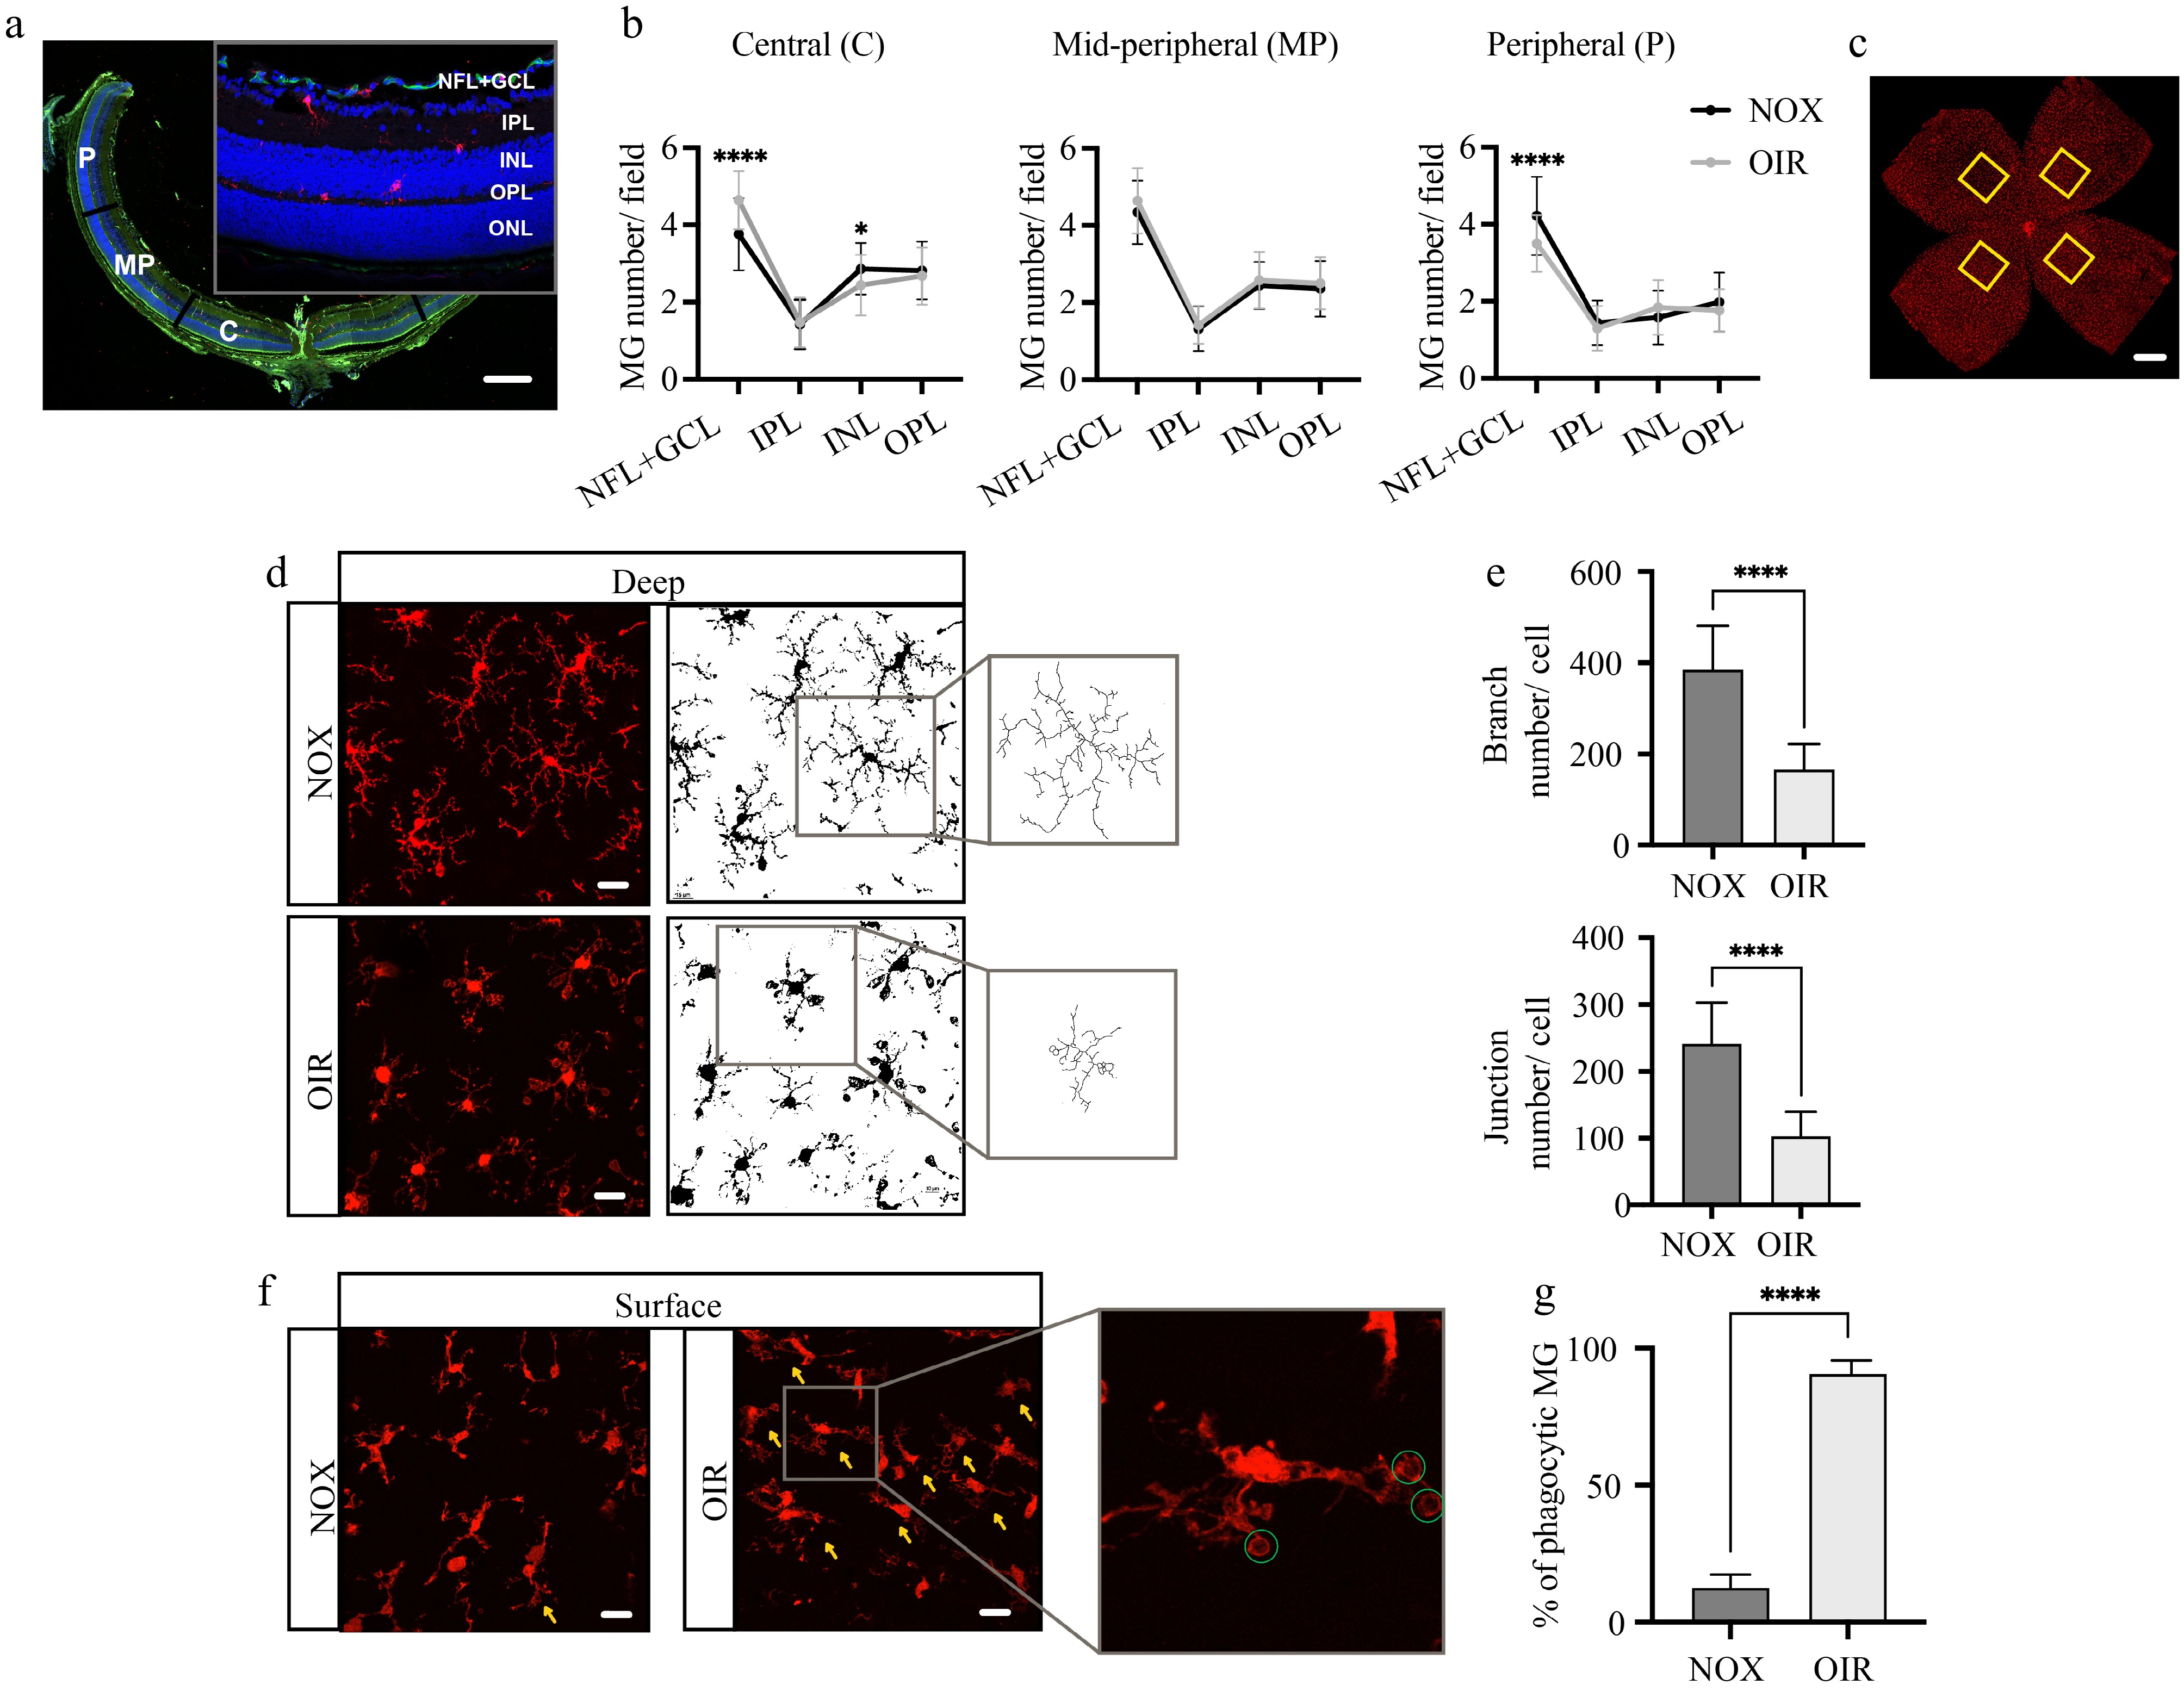
Figure 2.
Migration and activation of retinal microglia following short-term hyperoxic stimulation. (a) Representative image of retinal sections stained with CD31 (green), Iba1 (red), and DAPI (blue), illustrating the retinal regions and layers used for cell counting. Scale bar: 200 μm. (b) Quantification of microglial numbers in different regions at P7 + 16 h. N = 5/group. (c) Representative image of retinal flat mounts stained with Iba1 (red), the yellow boxes indicate areas selected for high-magnification imaging and subsequent cellular morphology analysis. Scale bar: 500 μm. (d) The morphological features of deep Iba1+ (red) microglia at P7 + 16 h, along with representative binary and skeletonized images of the microglia generated using Fiji software. Scale bar: 20 μm. (e) Quantification of the average branch and junction numbers per cell. N = 5/group. (f) The morphological features of superficial Iba1+ (red) microglia at P7 + 16 h, the yellow arrowheads indicate phagocytic morphology with 'ball-and-chain' structures, and the green circles highlight the phagocytic cups. Scale bar: 20 μm. (g) The percentage of phagocytic microglia per field. N = 5/group.
-
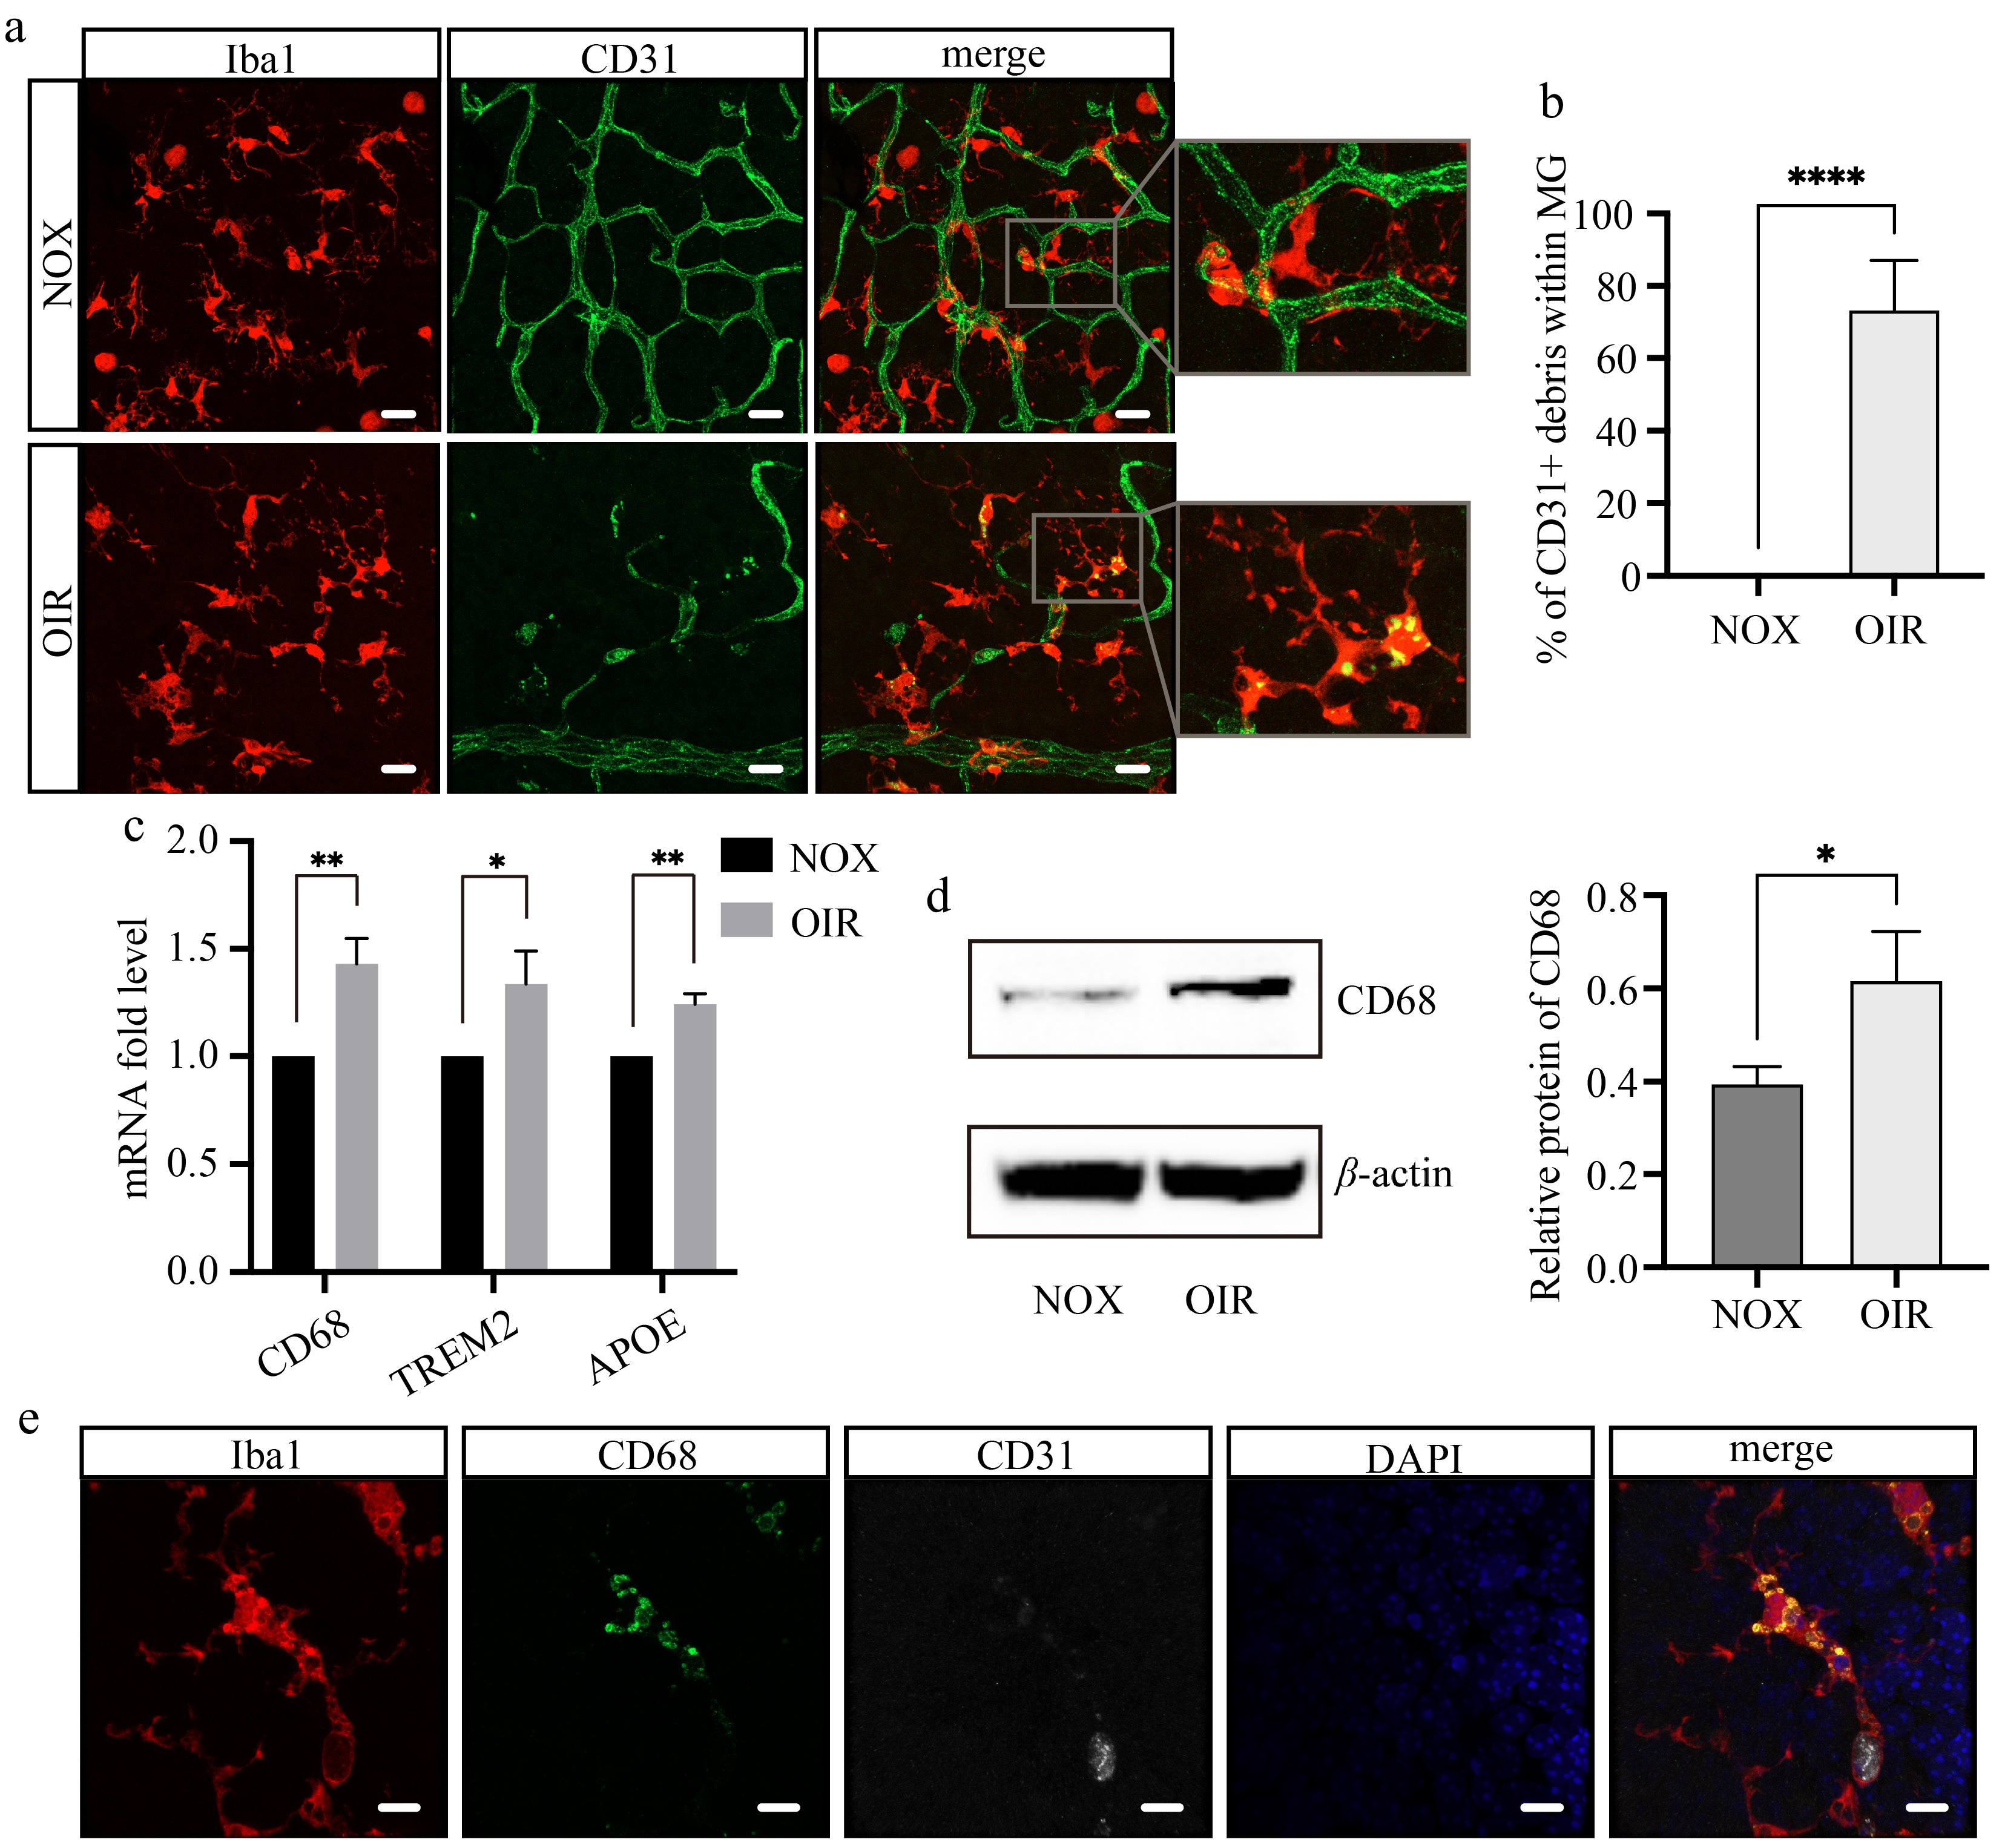
Figure 3.
Retinal microglia phagocytize vascular endothelial cells under hyperoxia. (a) Confocal images of retinal flat mounts stained with Iba1 (red) and CD31 (green) at P7 + 16 h. Scale bar: 20 μm. (b) The proportion of microglia containing CD31+ debris per field. N = 5/group. (c) The mRNA expression levels of genes related to phagocytosis. N = 3/group. (d) The protein expression and relative level of CD68. N = 3/group. (e) Multiple staining of Iba1 (red), CD31 (white), CD68 (green), and DAPI (blue) on the wholemount retina of OIR mice. Scale bar: 10 μm.
-
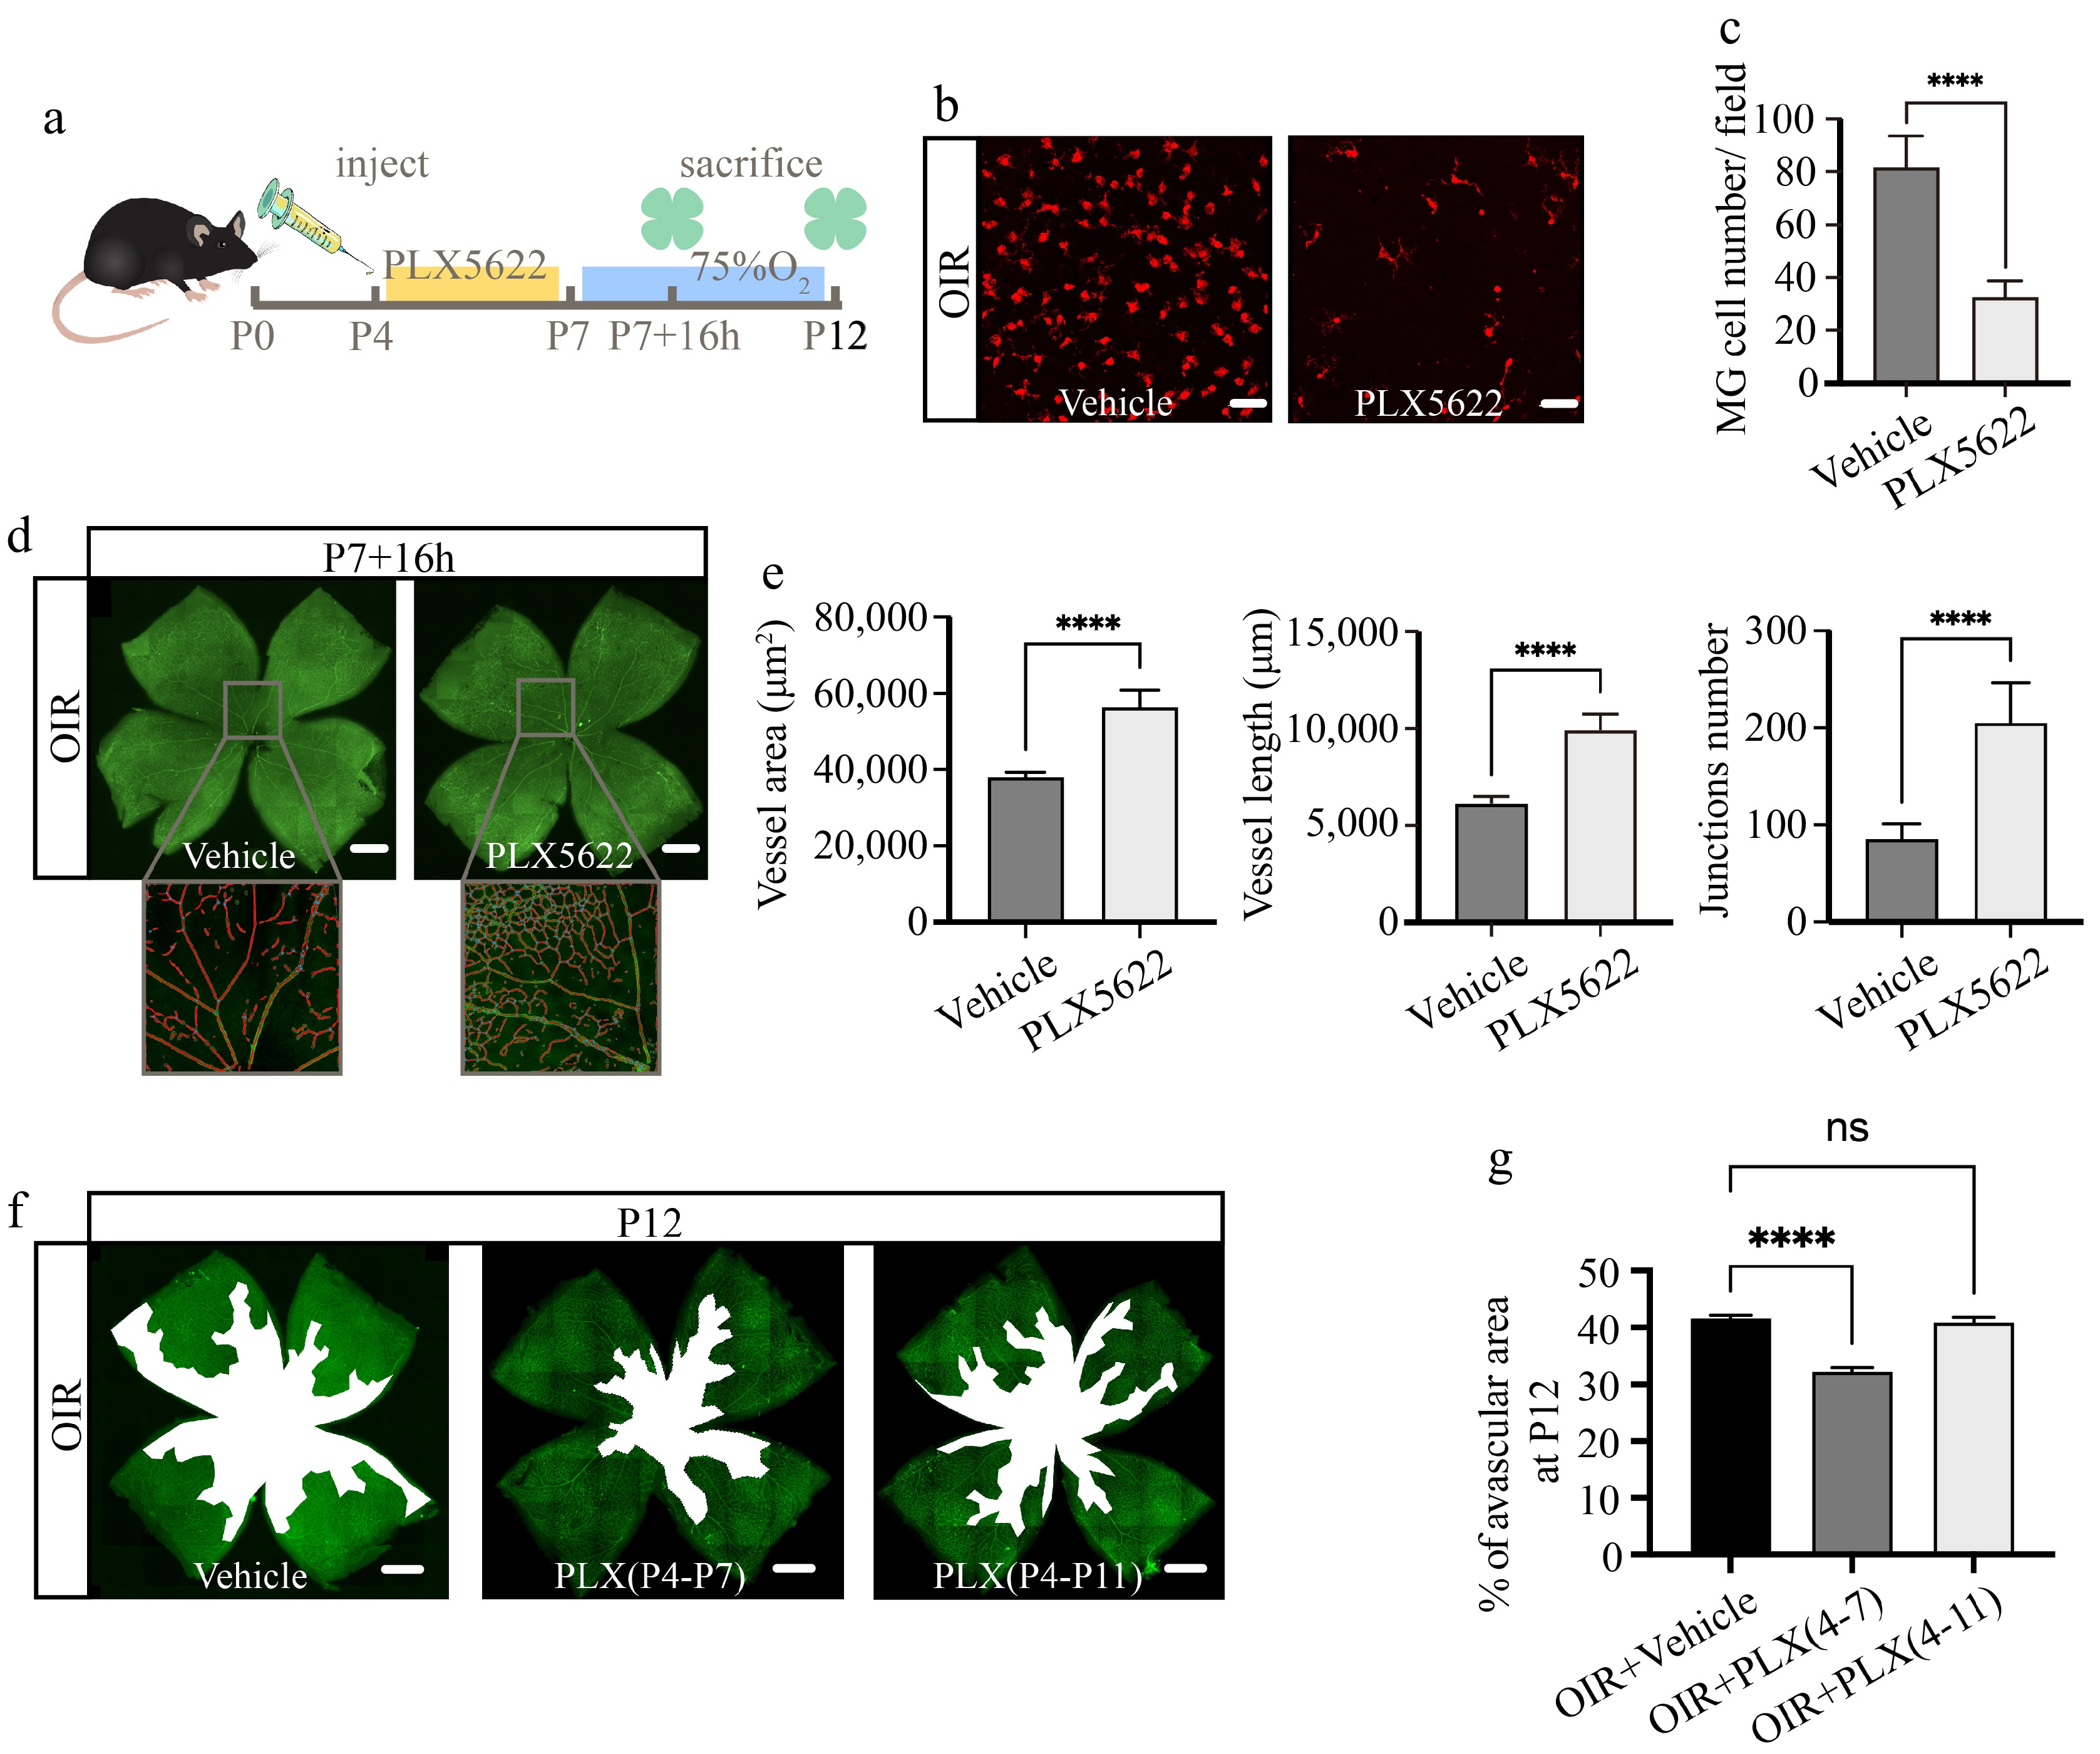
Figure 4.
Partial microglial depletion inhibits early retinal vascular breakdown induced by hyperoxia. (a) Schematic diagram and timeline of microglial depletion and subsequent observation. (b) Immunofluorescence staining of Iba1 (red) on retinal flat mounts at P7 + 16 h. Scale bar: 50 μm. (c) Quantification of Iba1+ microglial numbers per field. N = 5/group. (d) Immunofluorescence staining of CD31(green) on retinal flat mounts, with magnified vascular structure diagrams at P7 + 16 h. Scale bar: 500 μm. (e) Quantification of vessel area, vessel length, and junction numbers per field. N = 5/group. (f) Panoramic images of retinal flat mounts stained with CD31 (green), the white regions indicate avascular areas. Scale bar: 500 μm. (g) Proportion of avascular area in whole retina at P12. N = 5/group.
-
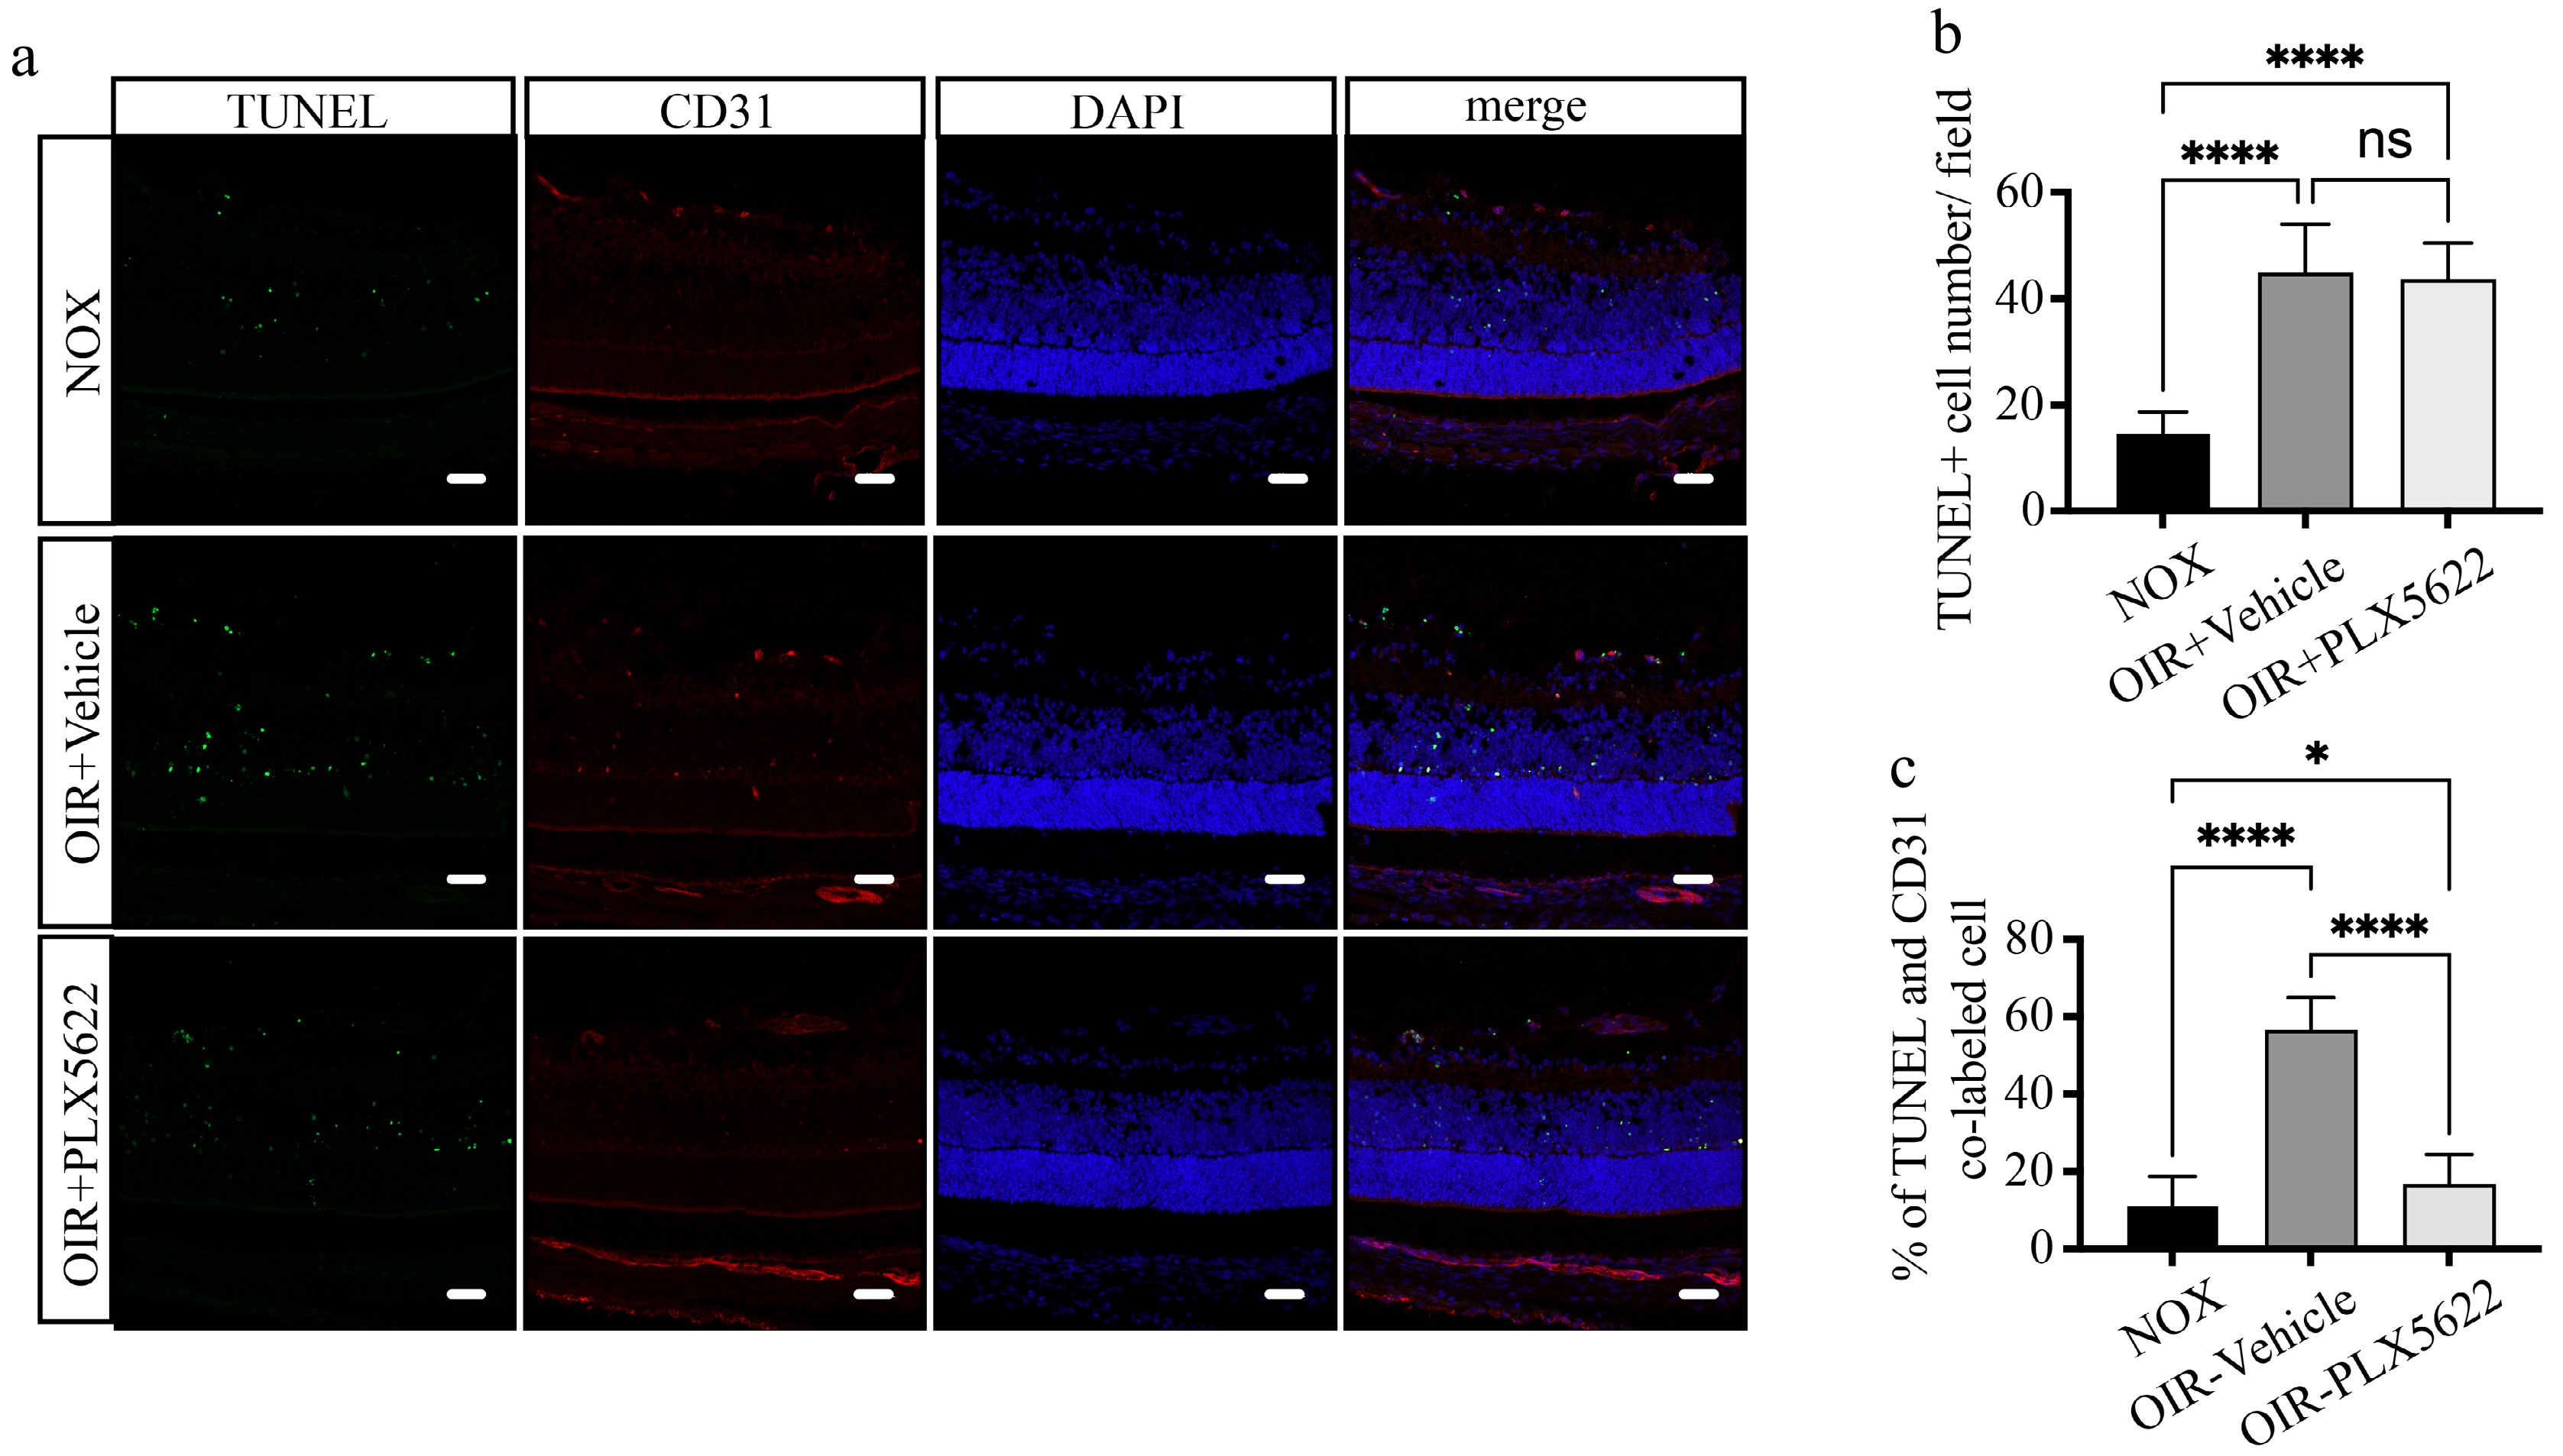
Figure 5.
Microglial depletion alleviates early endothelial cell apoptosis under high-oxygen conditions. (a) Representative images of retinal cryosections stained with TUNEL (green), CD31 (red), and DAPI (blue) at P7 + 16 h. Scale bar: 30 μm. (b) Quantification of TUNEL+ apoptotic cell numbers per field. N = 5/group. (c) The proportion of apoptotic endothelial cells co-labeled with TUNEL and CD31. N = 5/group.
-

Figure 6.
Hyperoxia-induced microglial phagocytosis is regulated by the complement pathway. (a) - (b) Heatmap and volcano plots of DEG distribution between the OIR + Vehicle and OIR + PLX5622 groups. (c) Top 10 pathways identified by KEGG enrichment analysis of downregulated DEGs. The yellow stars indicate pathways related to vascular inflammation and angiogenesis. (d) The mRNA expression level of the key genes in the complement pathway. N = 3/group. (e) Multiple staining of Iba1 (white), CD31 (green), C3ar1 (red), and DAPI (blue) on the retinal cryosection of OIR + Vehicle mice. Scale bar: 10 μm.
Figures
(6)
Tables
(0)