-
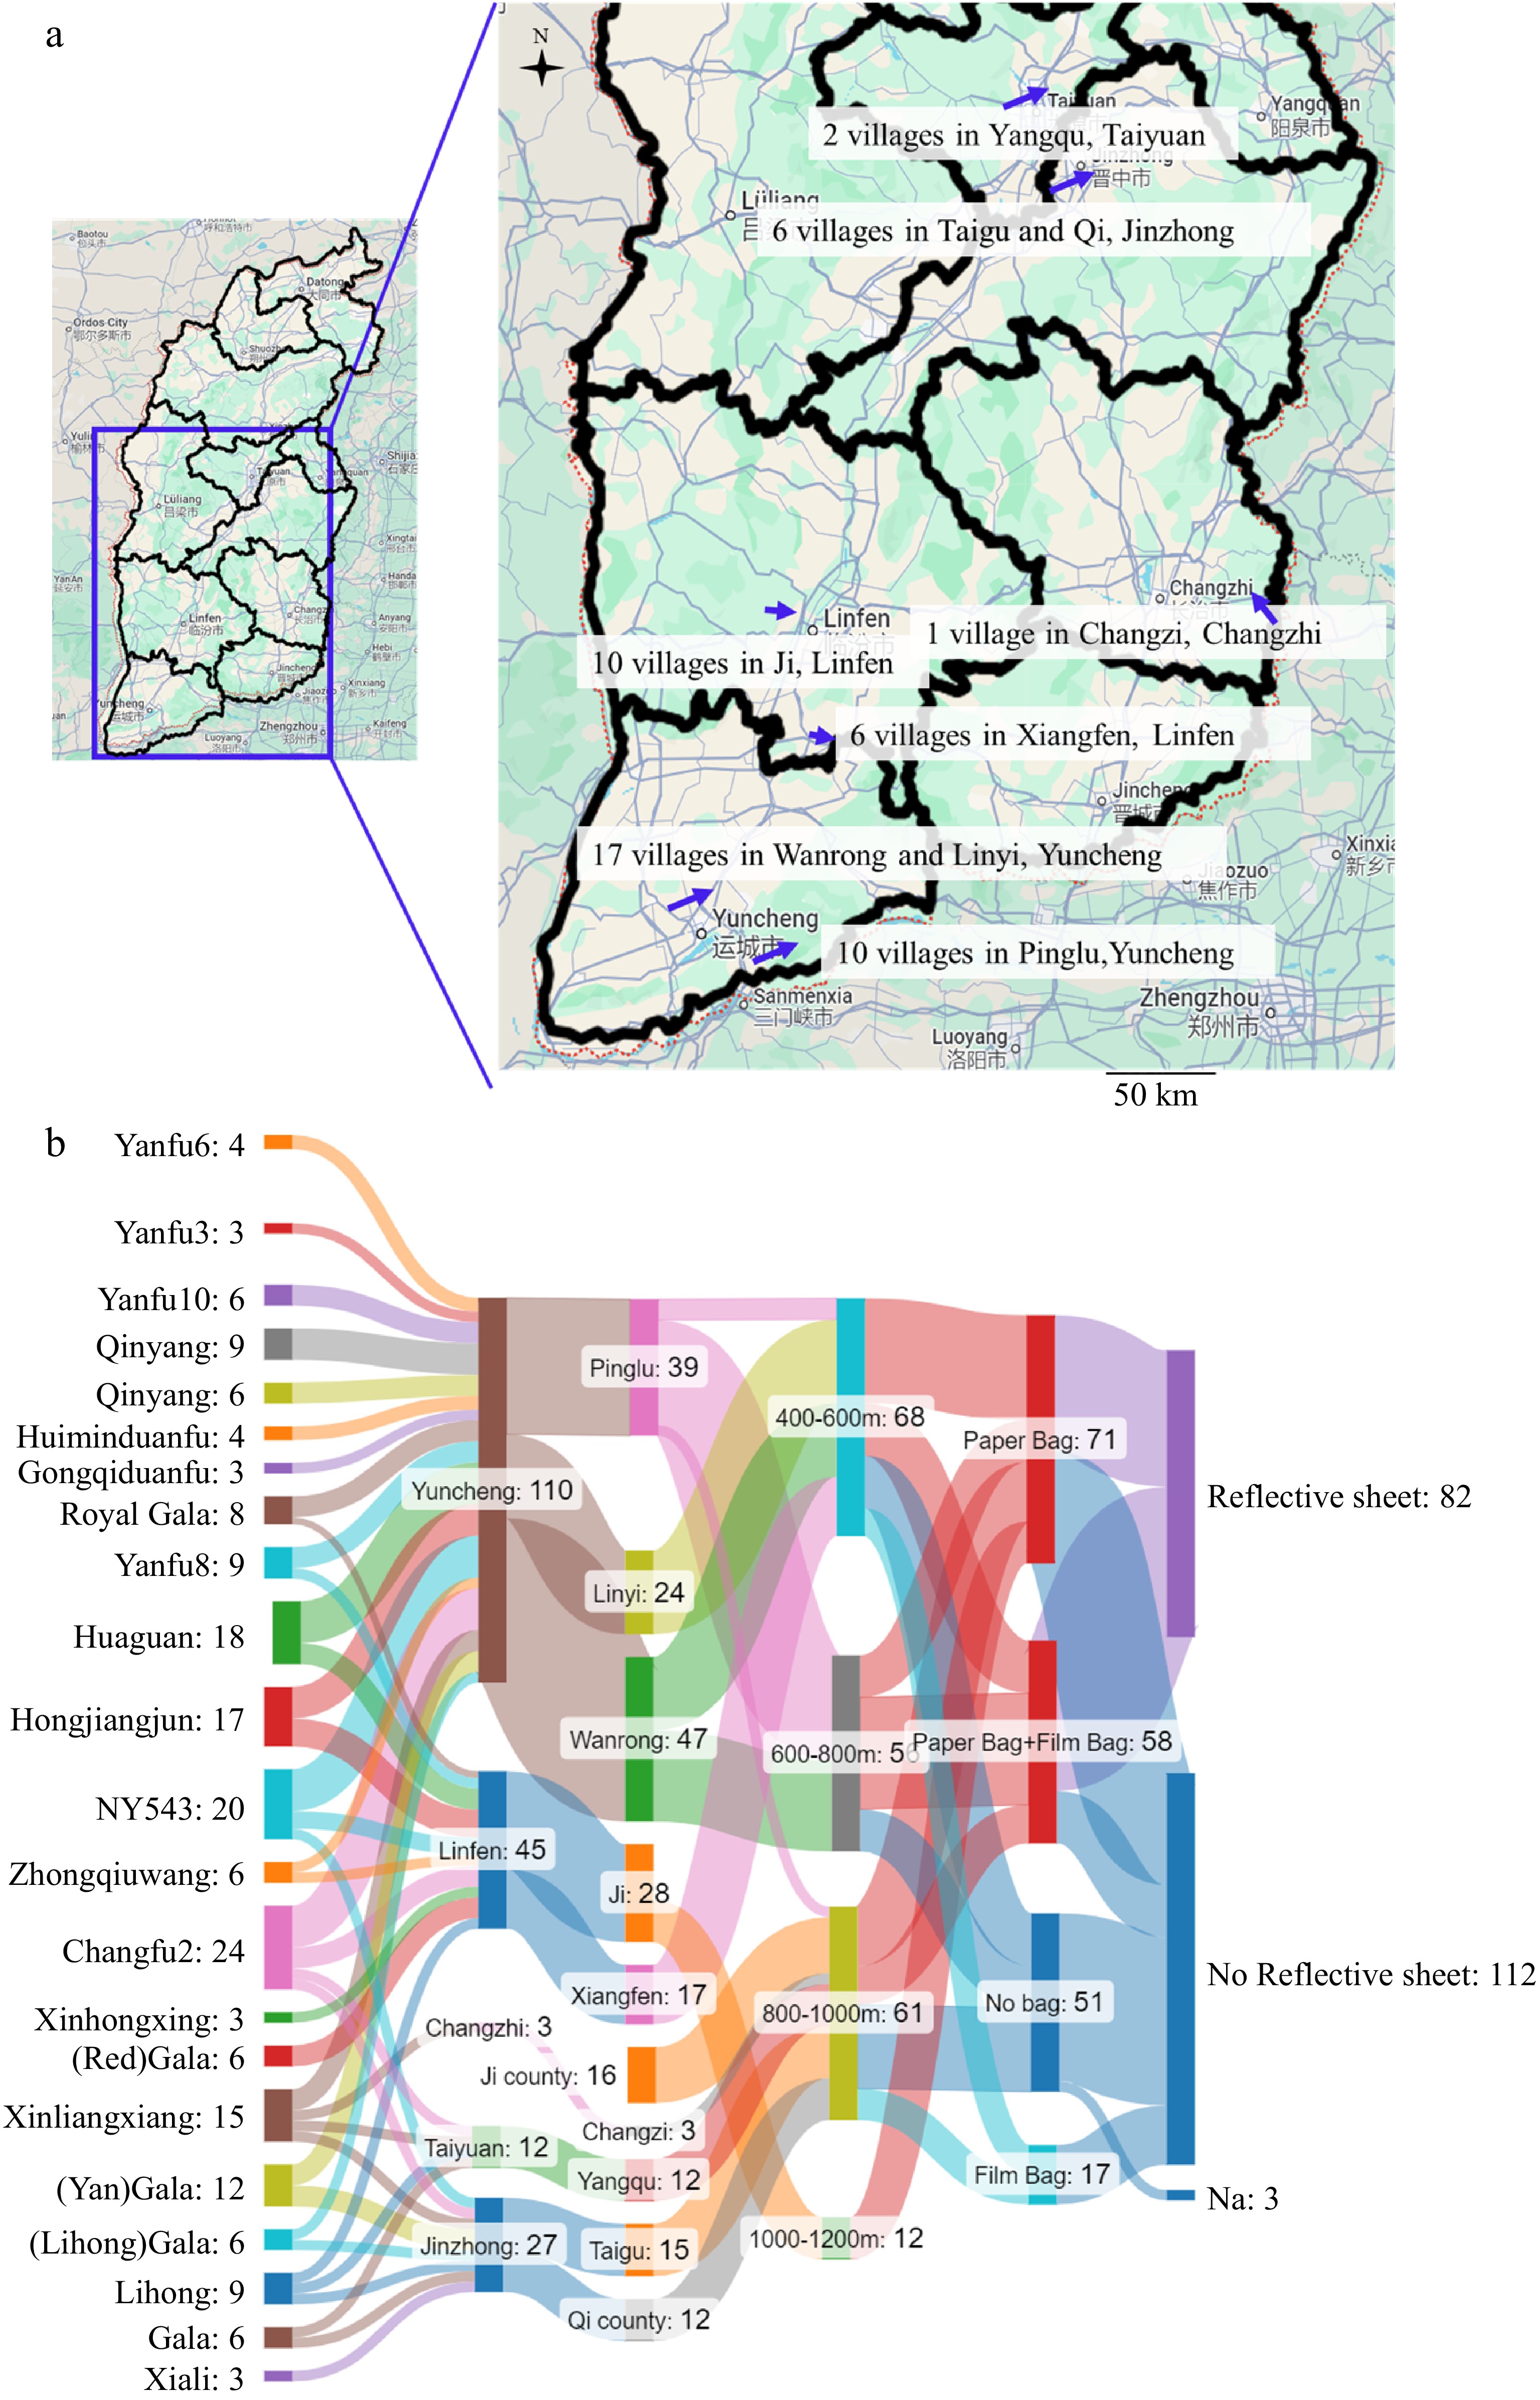
Figure 1.
(a) Geological locations of sampling in Shanxi province, China. (b) Flow diagram demonstrating different sample grouping categories. Na indicates no information.
-
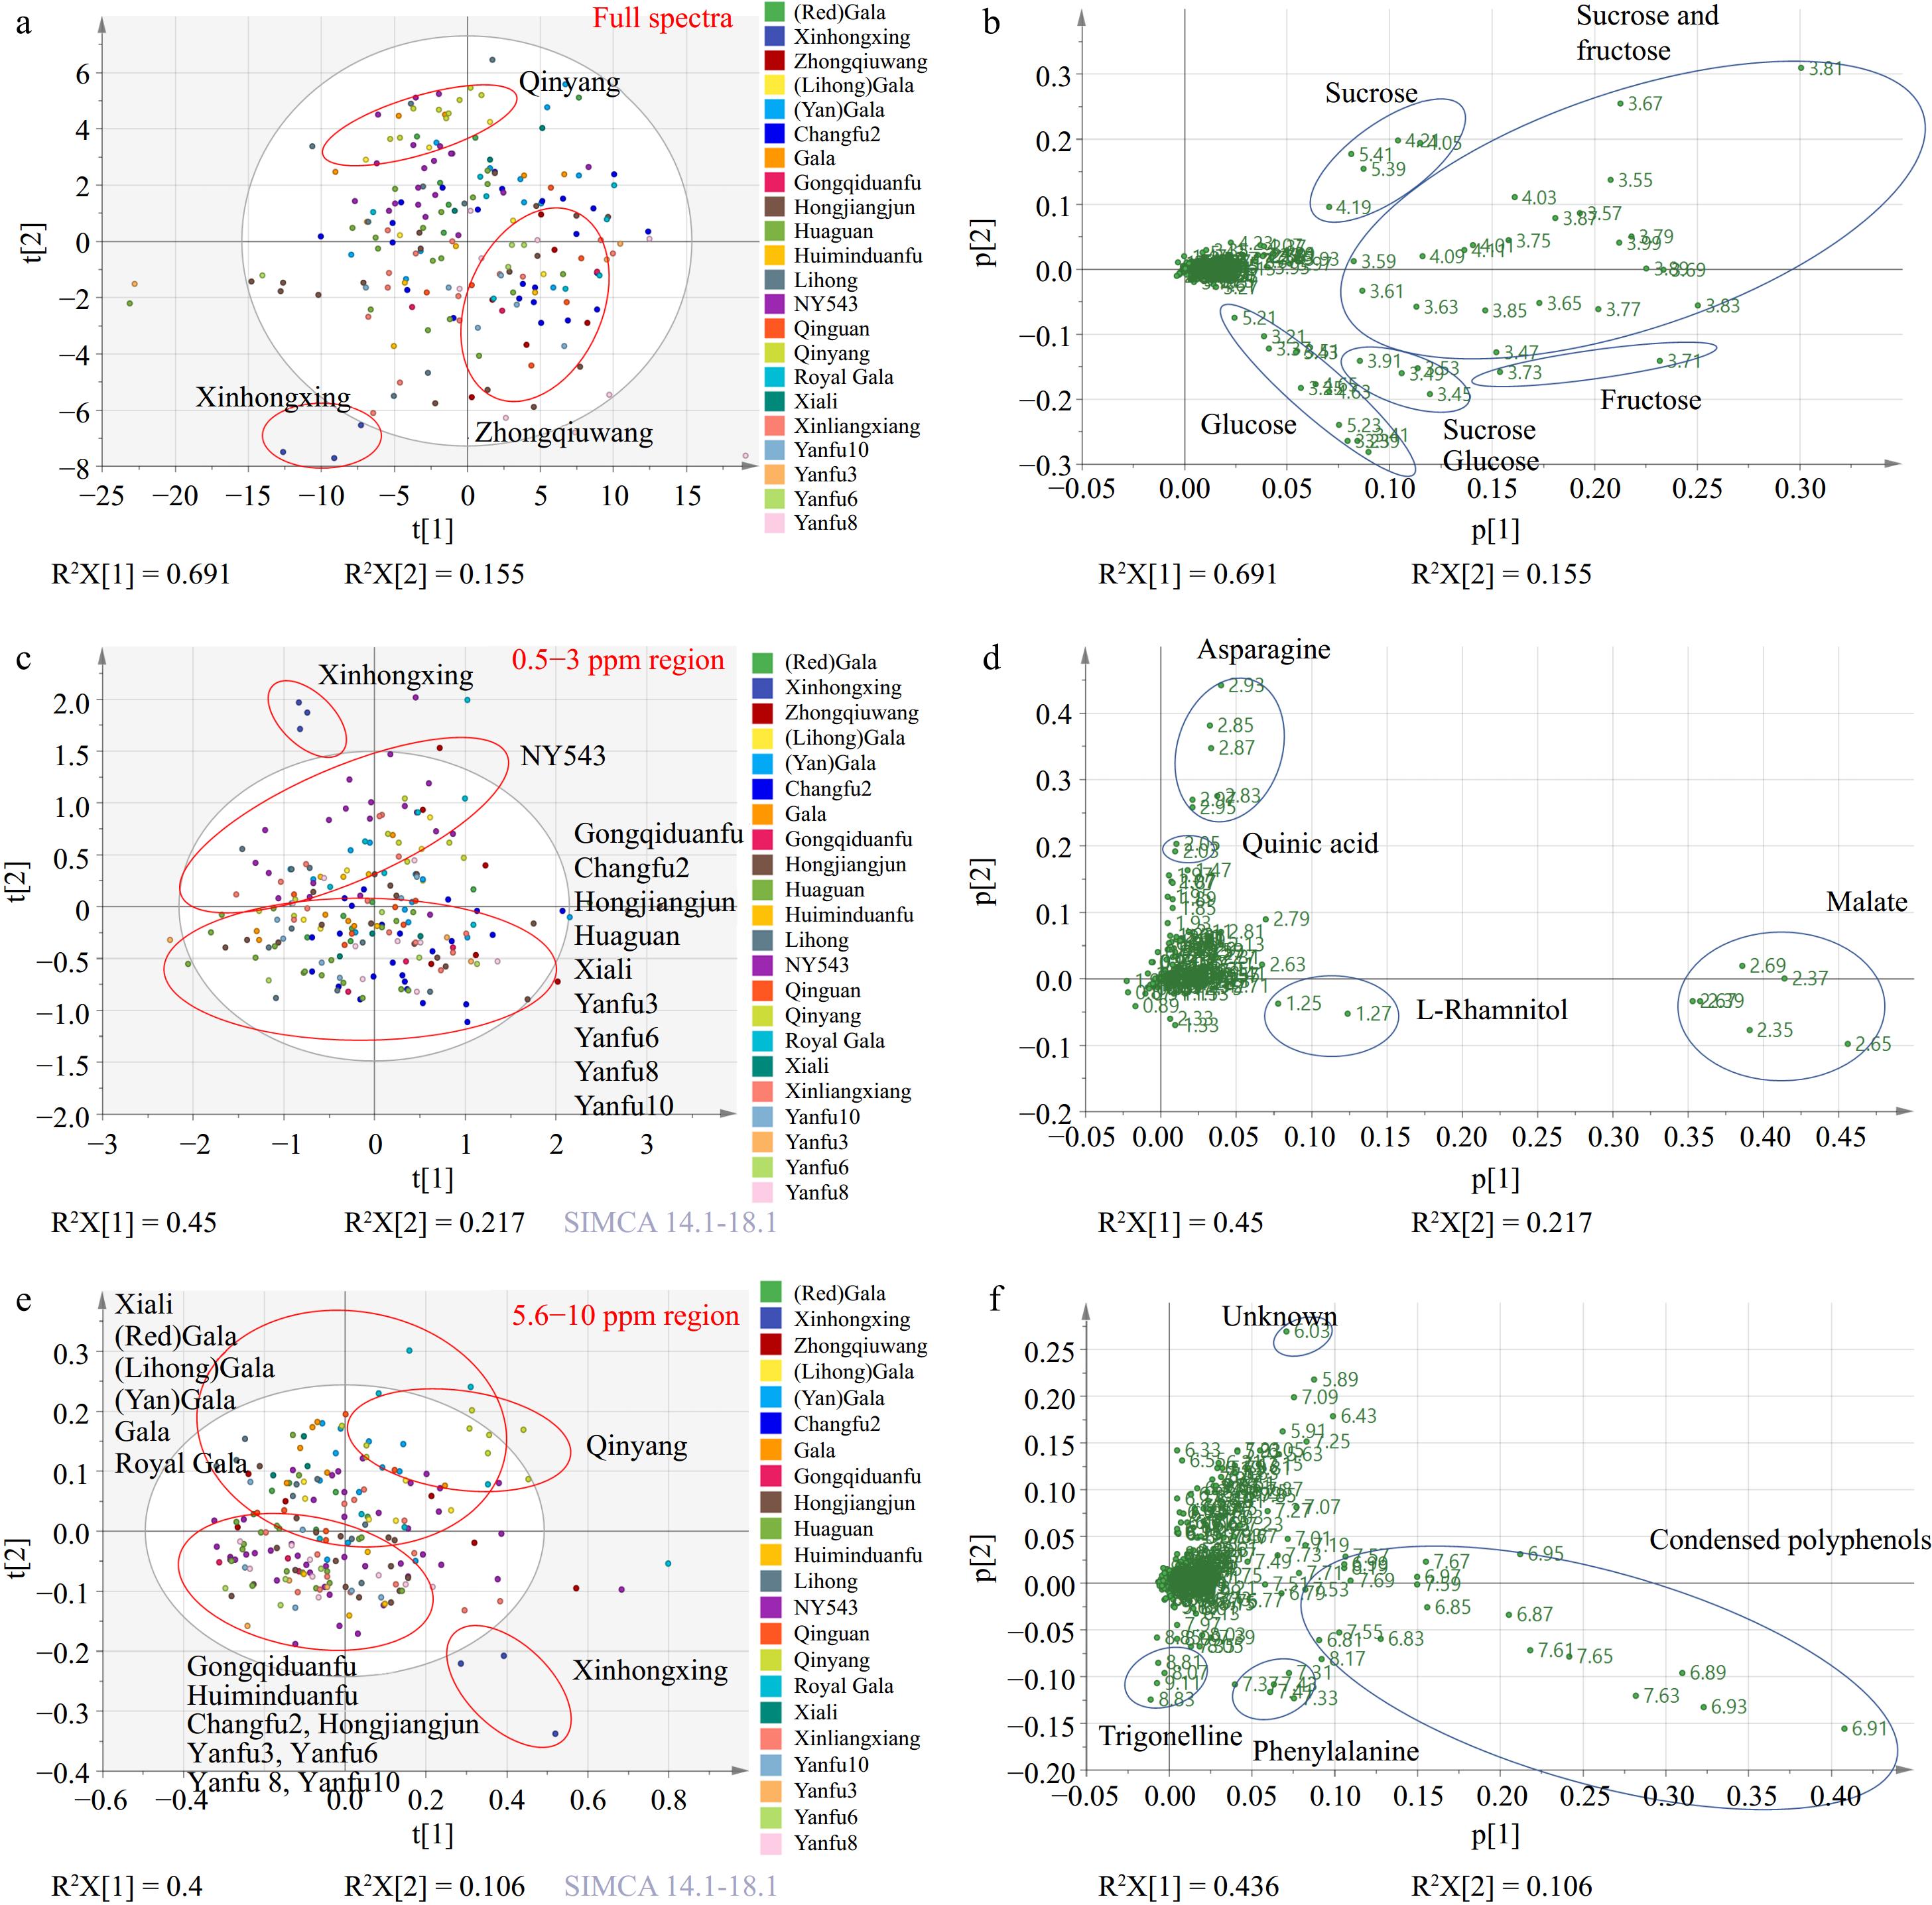
Figure 2.
(a) PCA score plot and (b) corresponding loading plot generated from full spectra of 1H NMR metabolomics. (c) PCA score plot and (d) corresponding loading plot derived from 0.5−3 ppm region. (e) PCA score plot and (f) corresponding loading plot created from 5.6−10 ppm region.
-
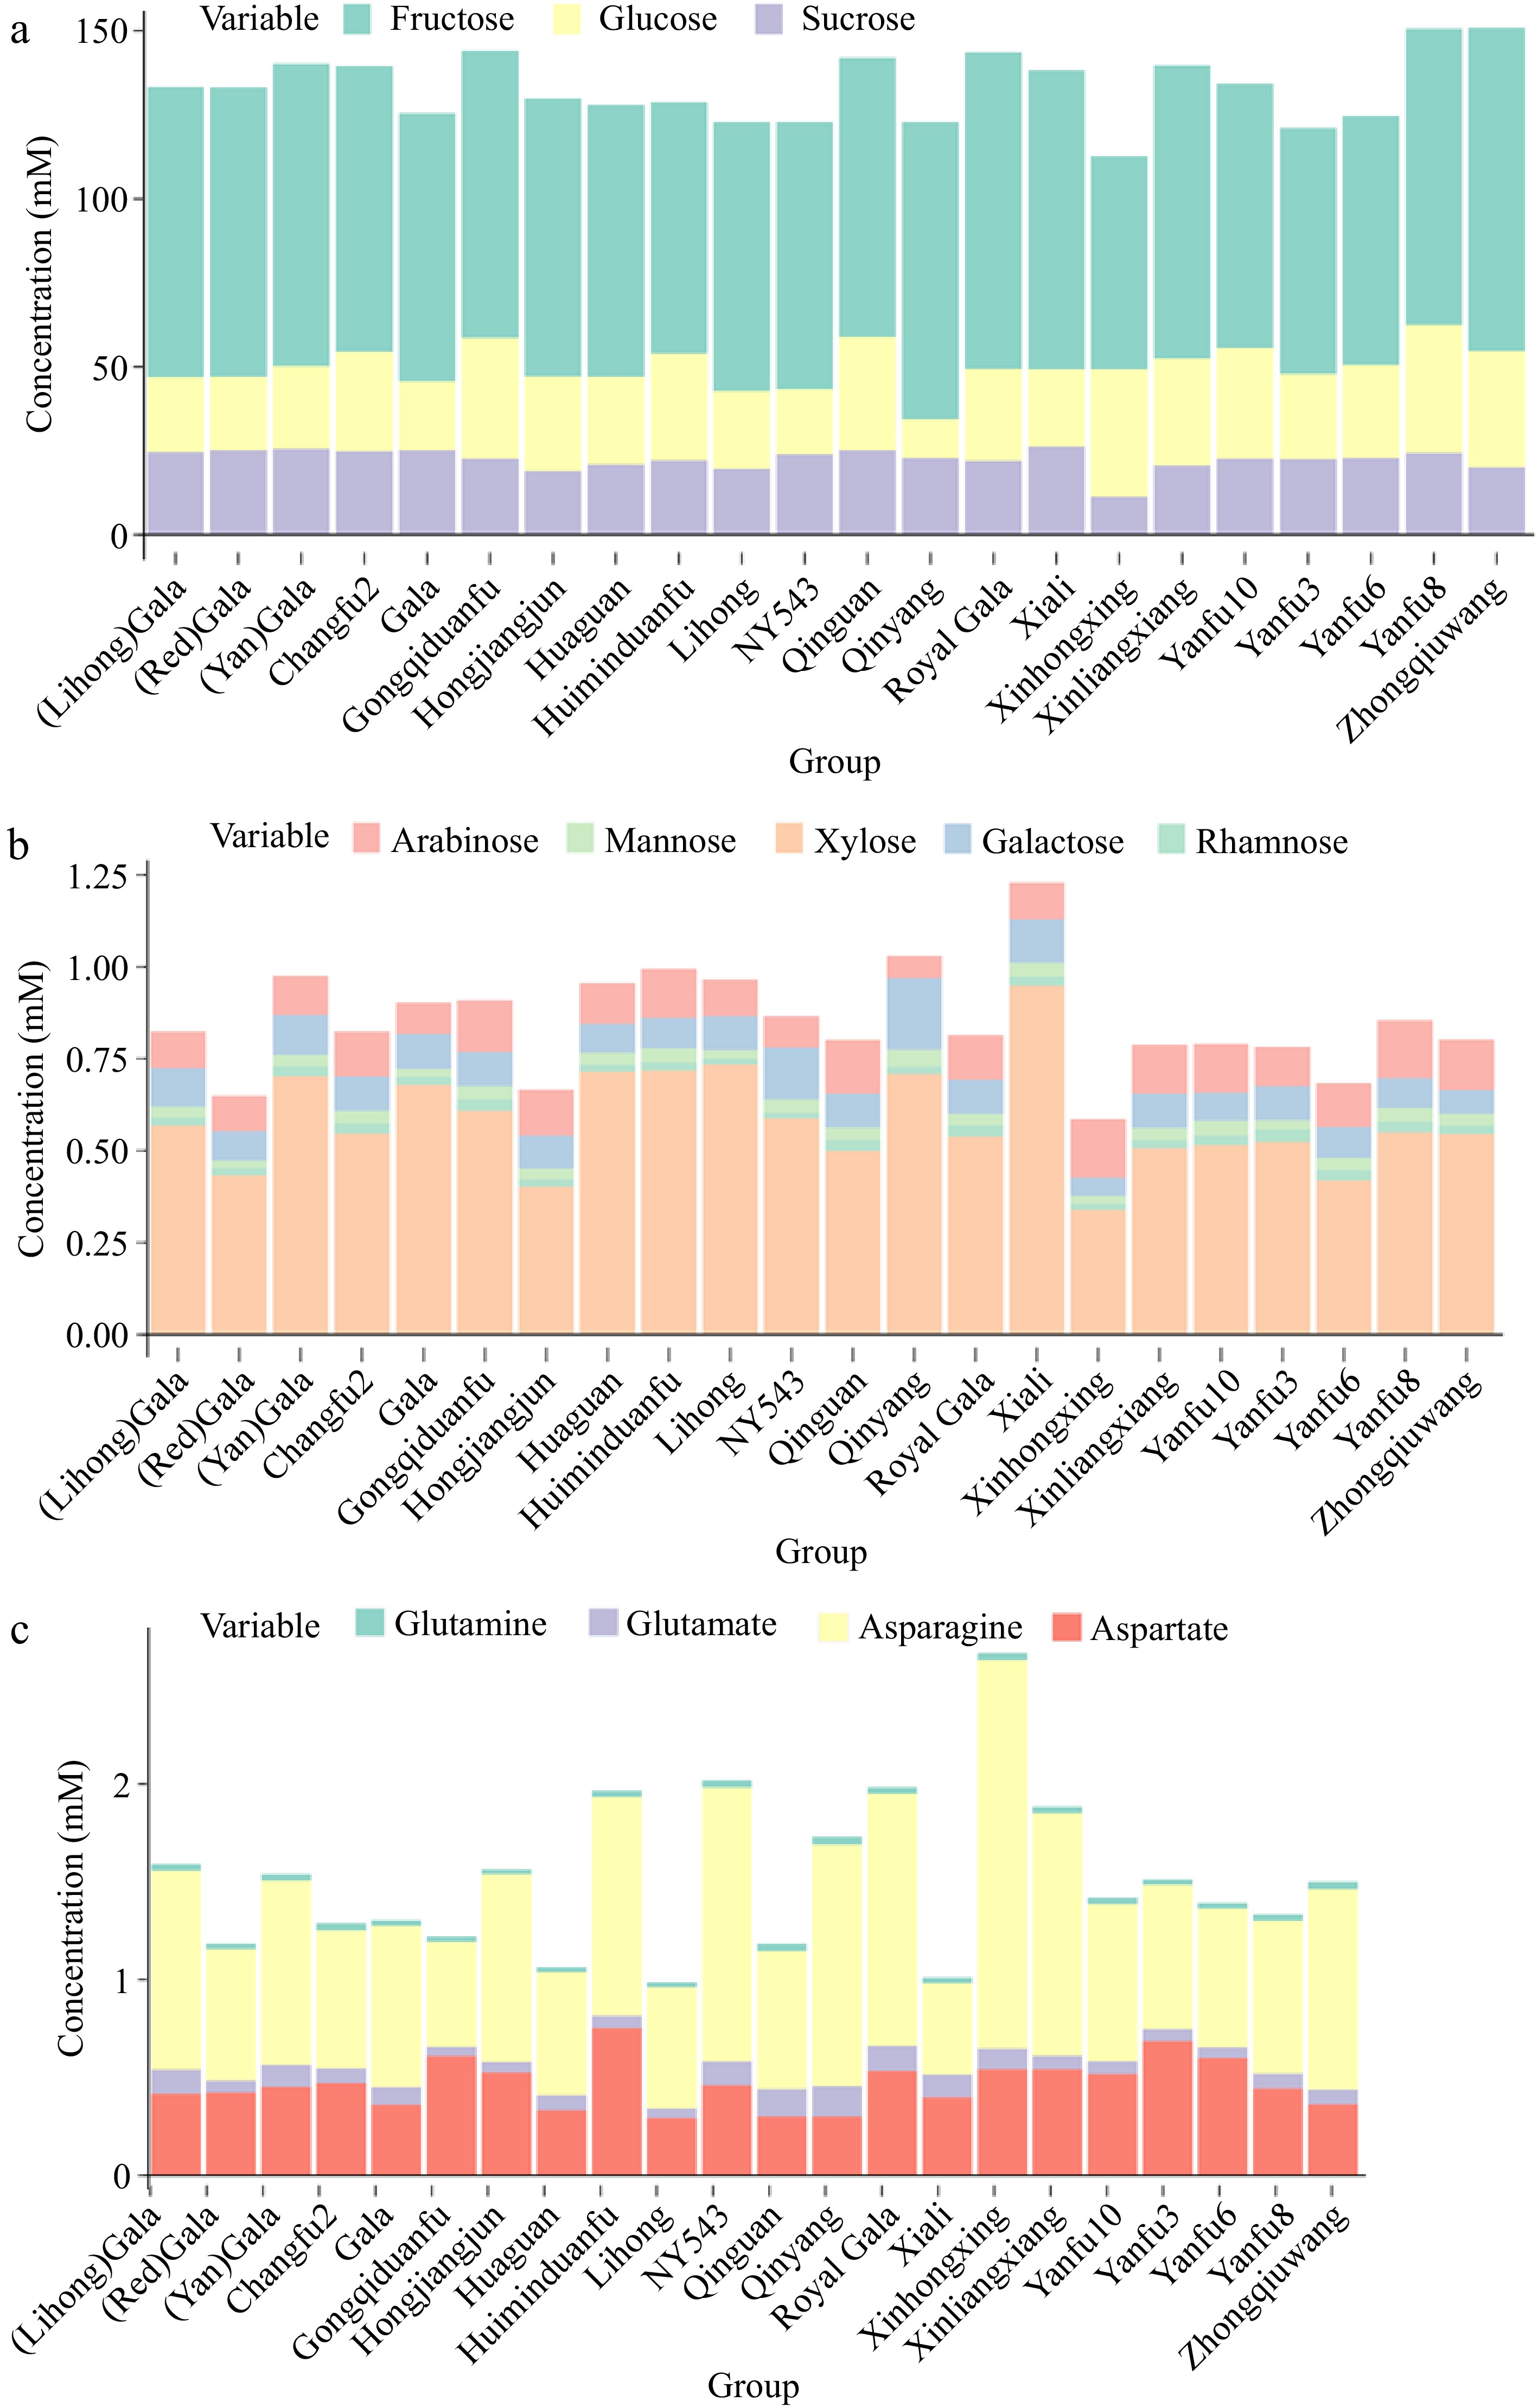
Figure 3.
Stacking plot of (a) fructose, glucose, and sucrose, (b) other sugars, and (c) initial amino acids associated with primary ammonium assimilation in apple cultivars.
-
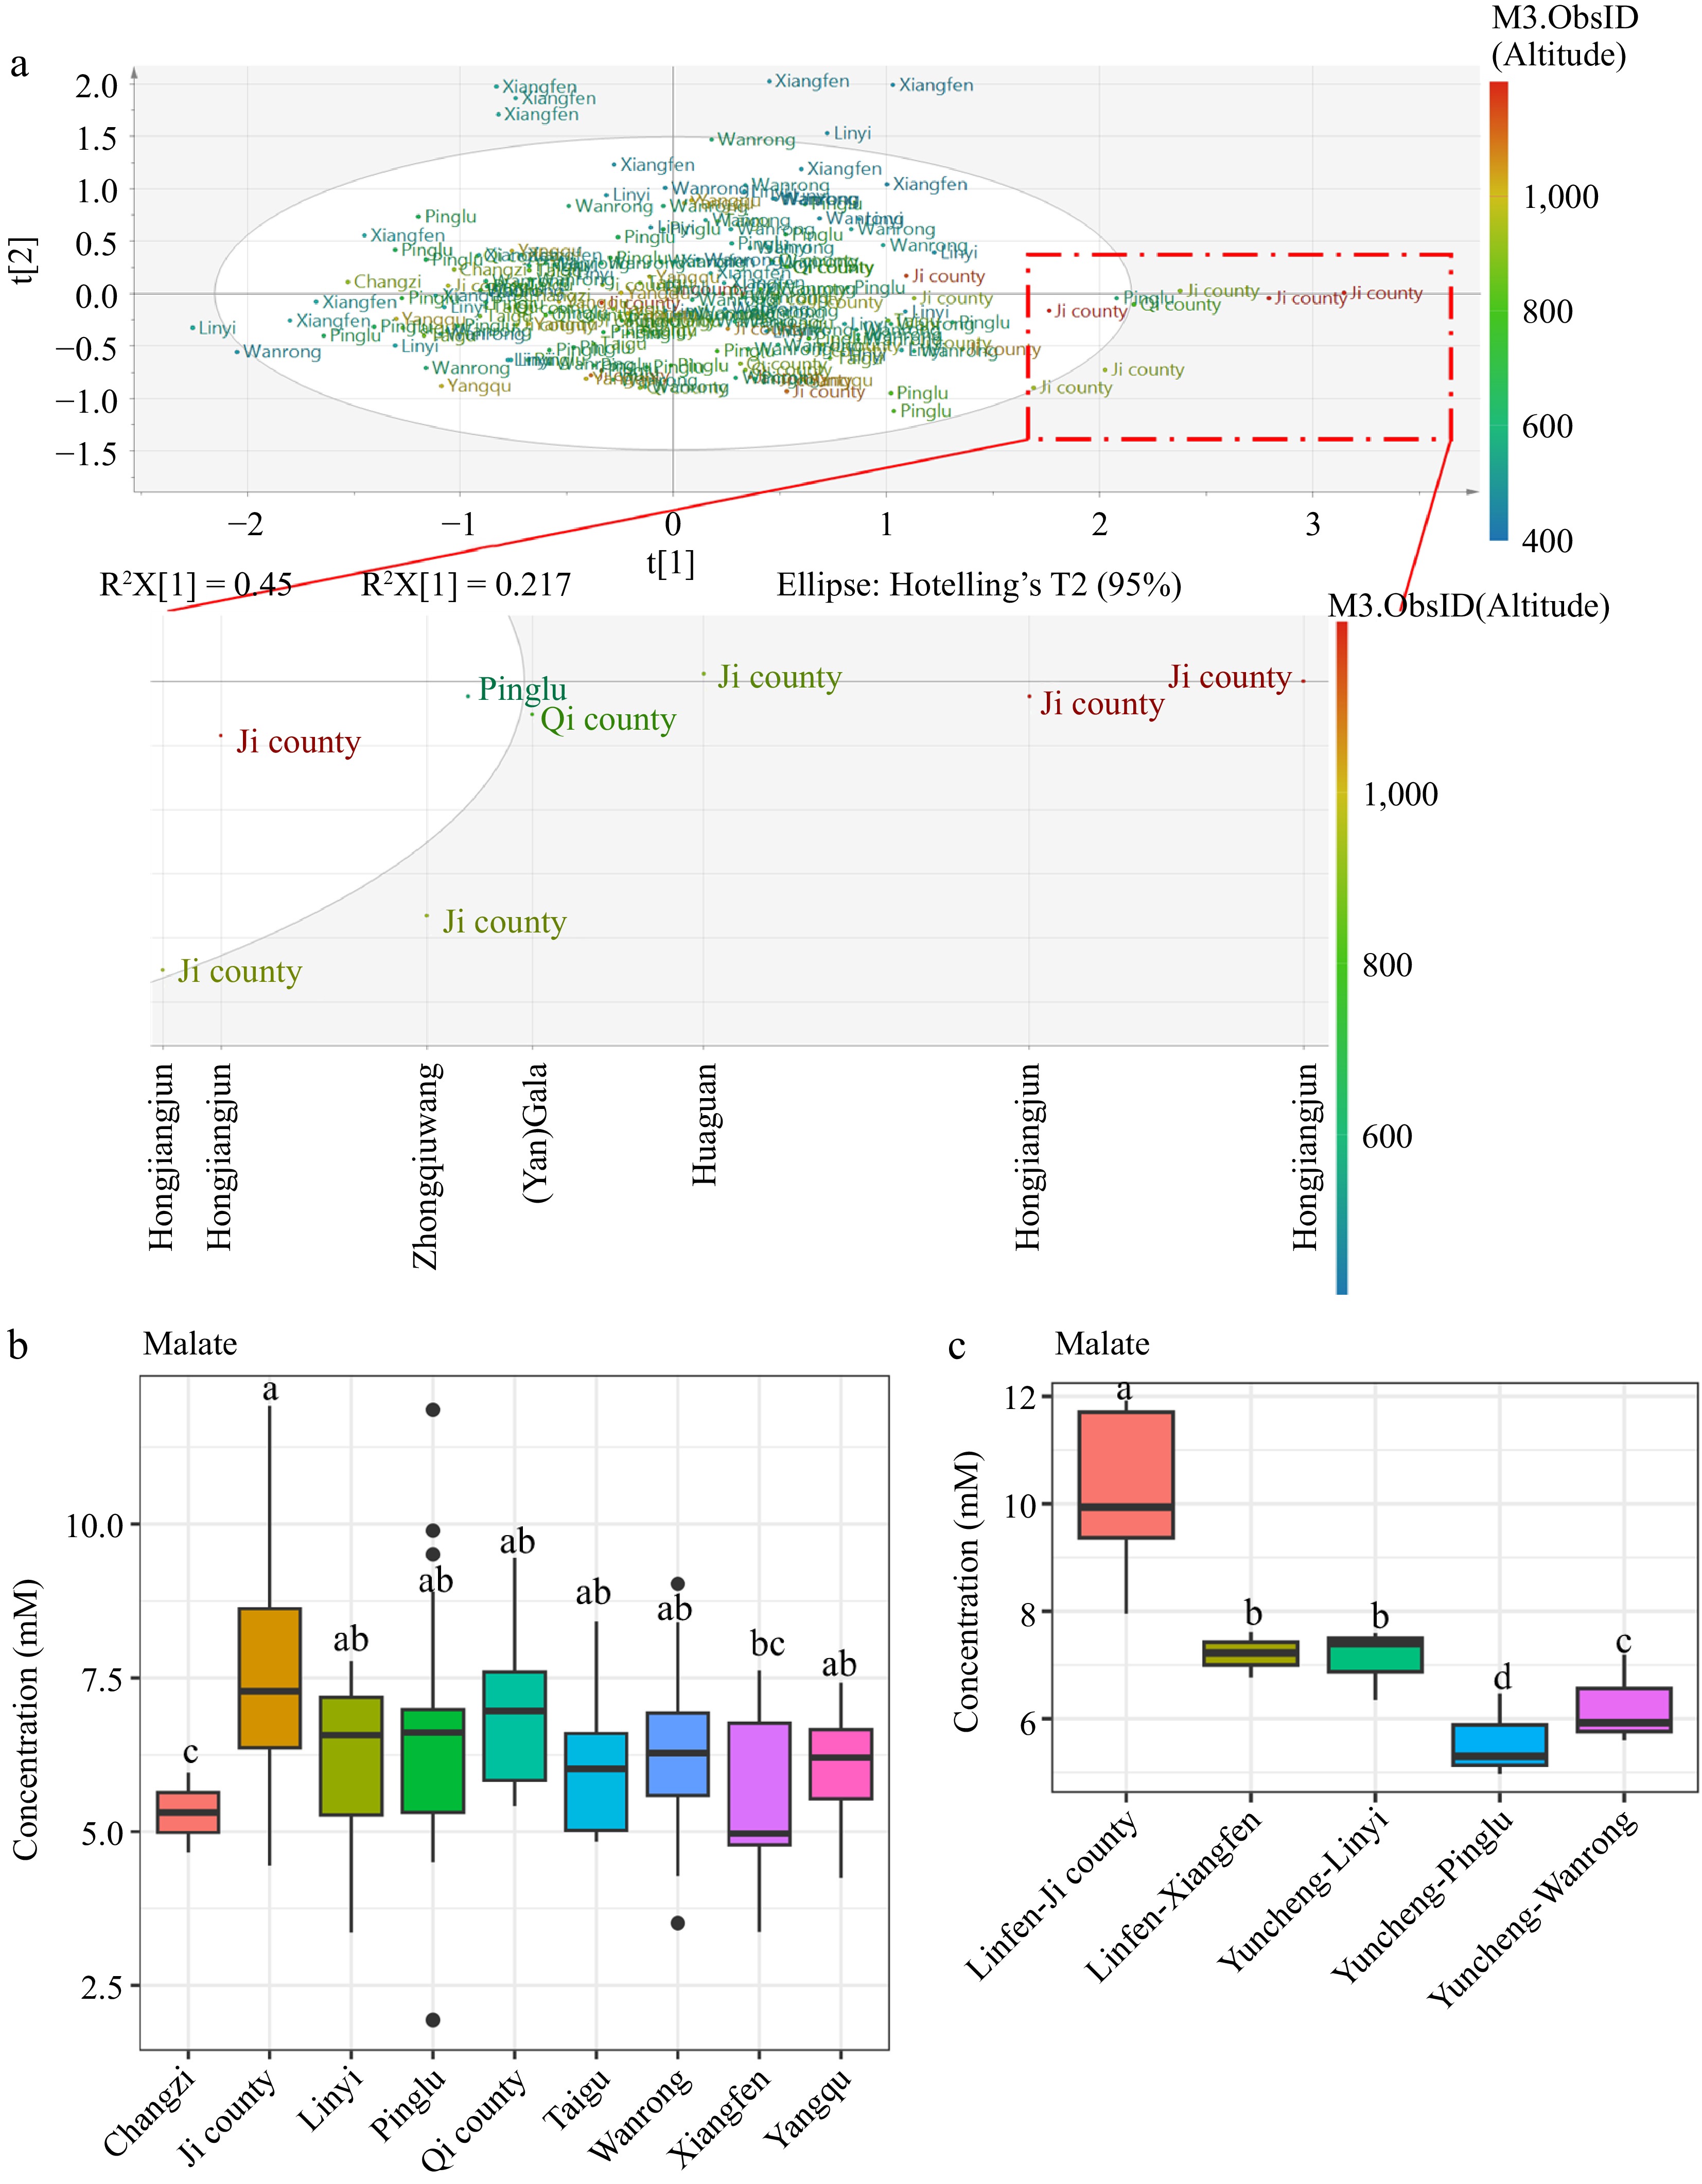
Figure 4.
PCA score plot generated from full spectra and labeled with (a) county information. (b) Concentration of malate in different counties. (c) The concentration of malate in 'Hongjiangjun' cultivars cultivated in different counties. Different letters above the bars indicate statistically significant differences at p < 0.05 (one-way ANOVA).
-
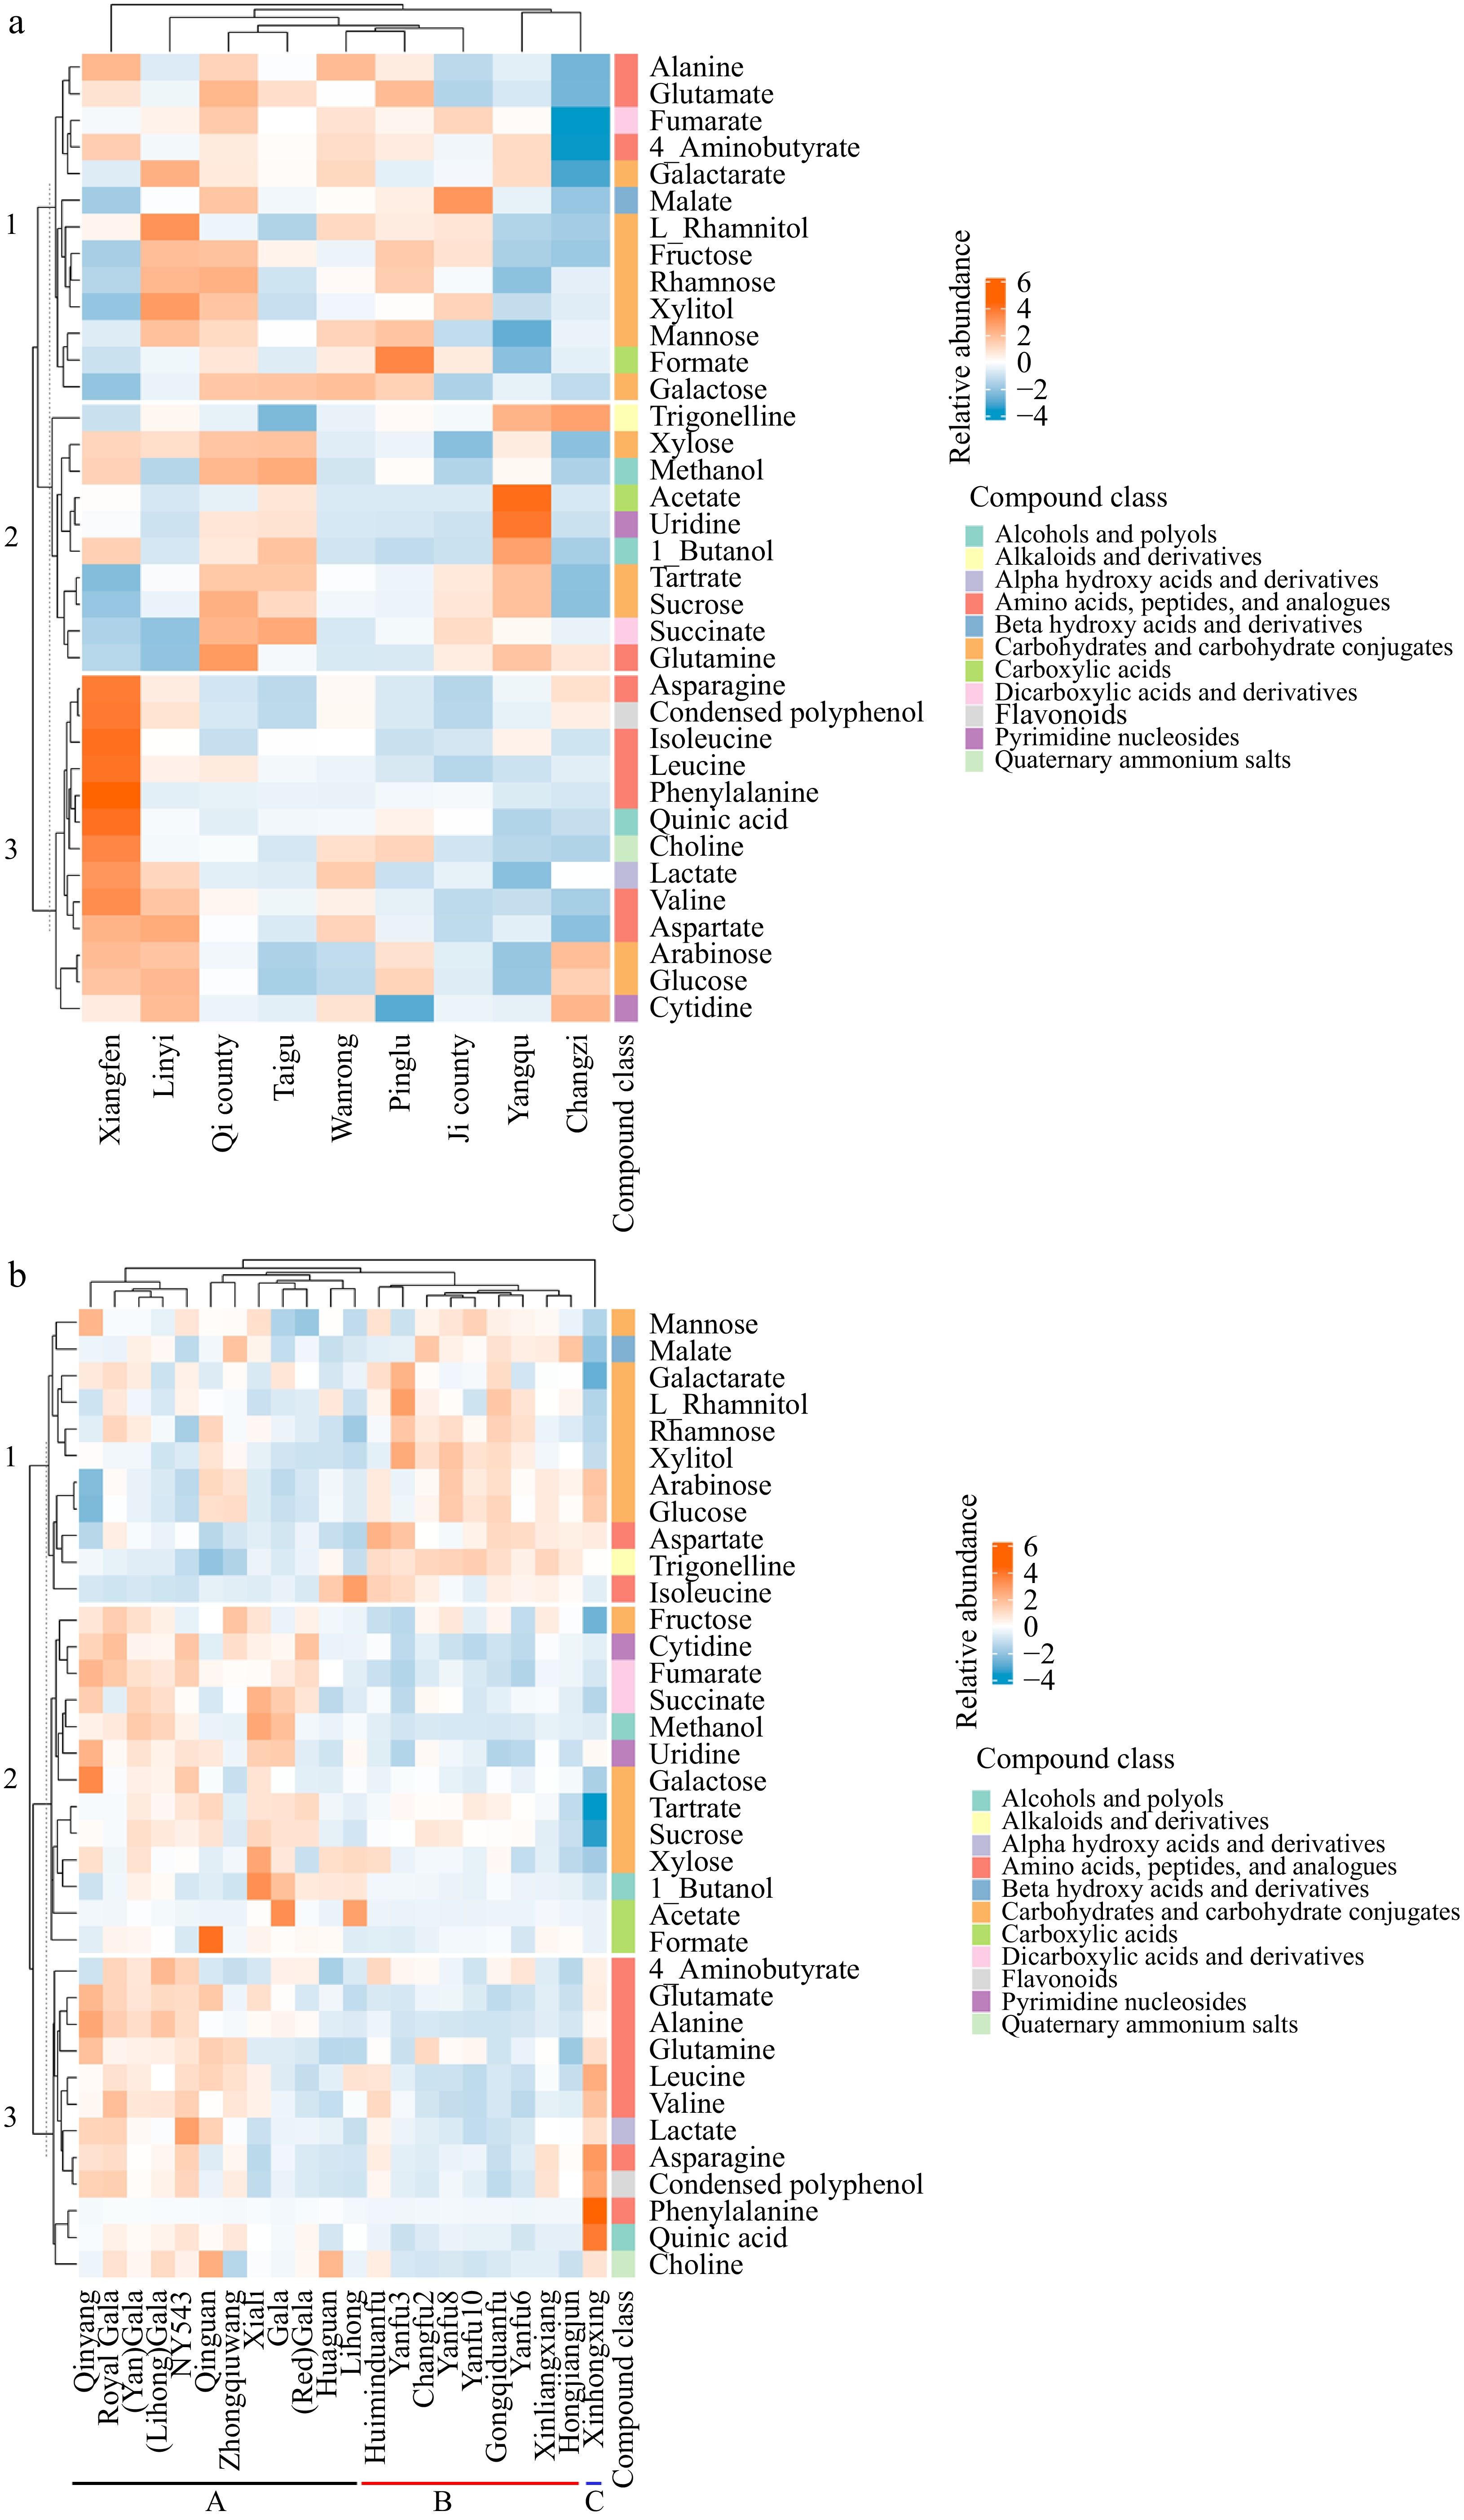
Figure 5.
K means clustering heatmaps generated from profiling metabolite data based on (a) growth location, and (b) cultivar.
-
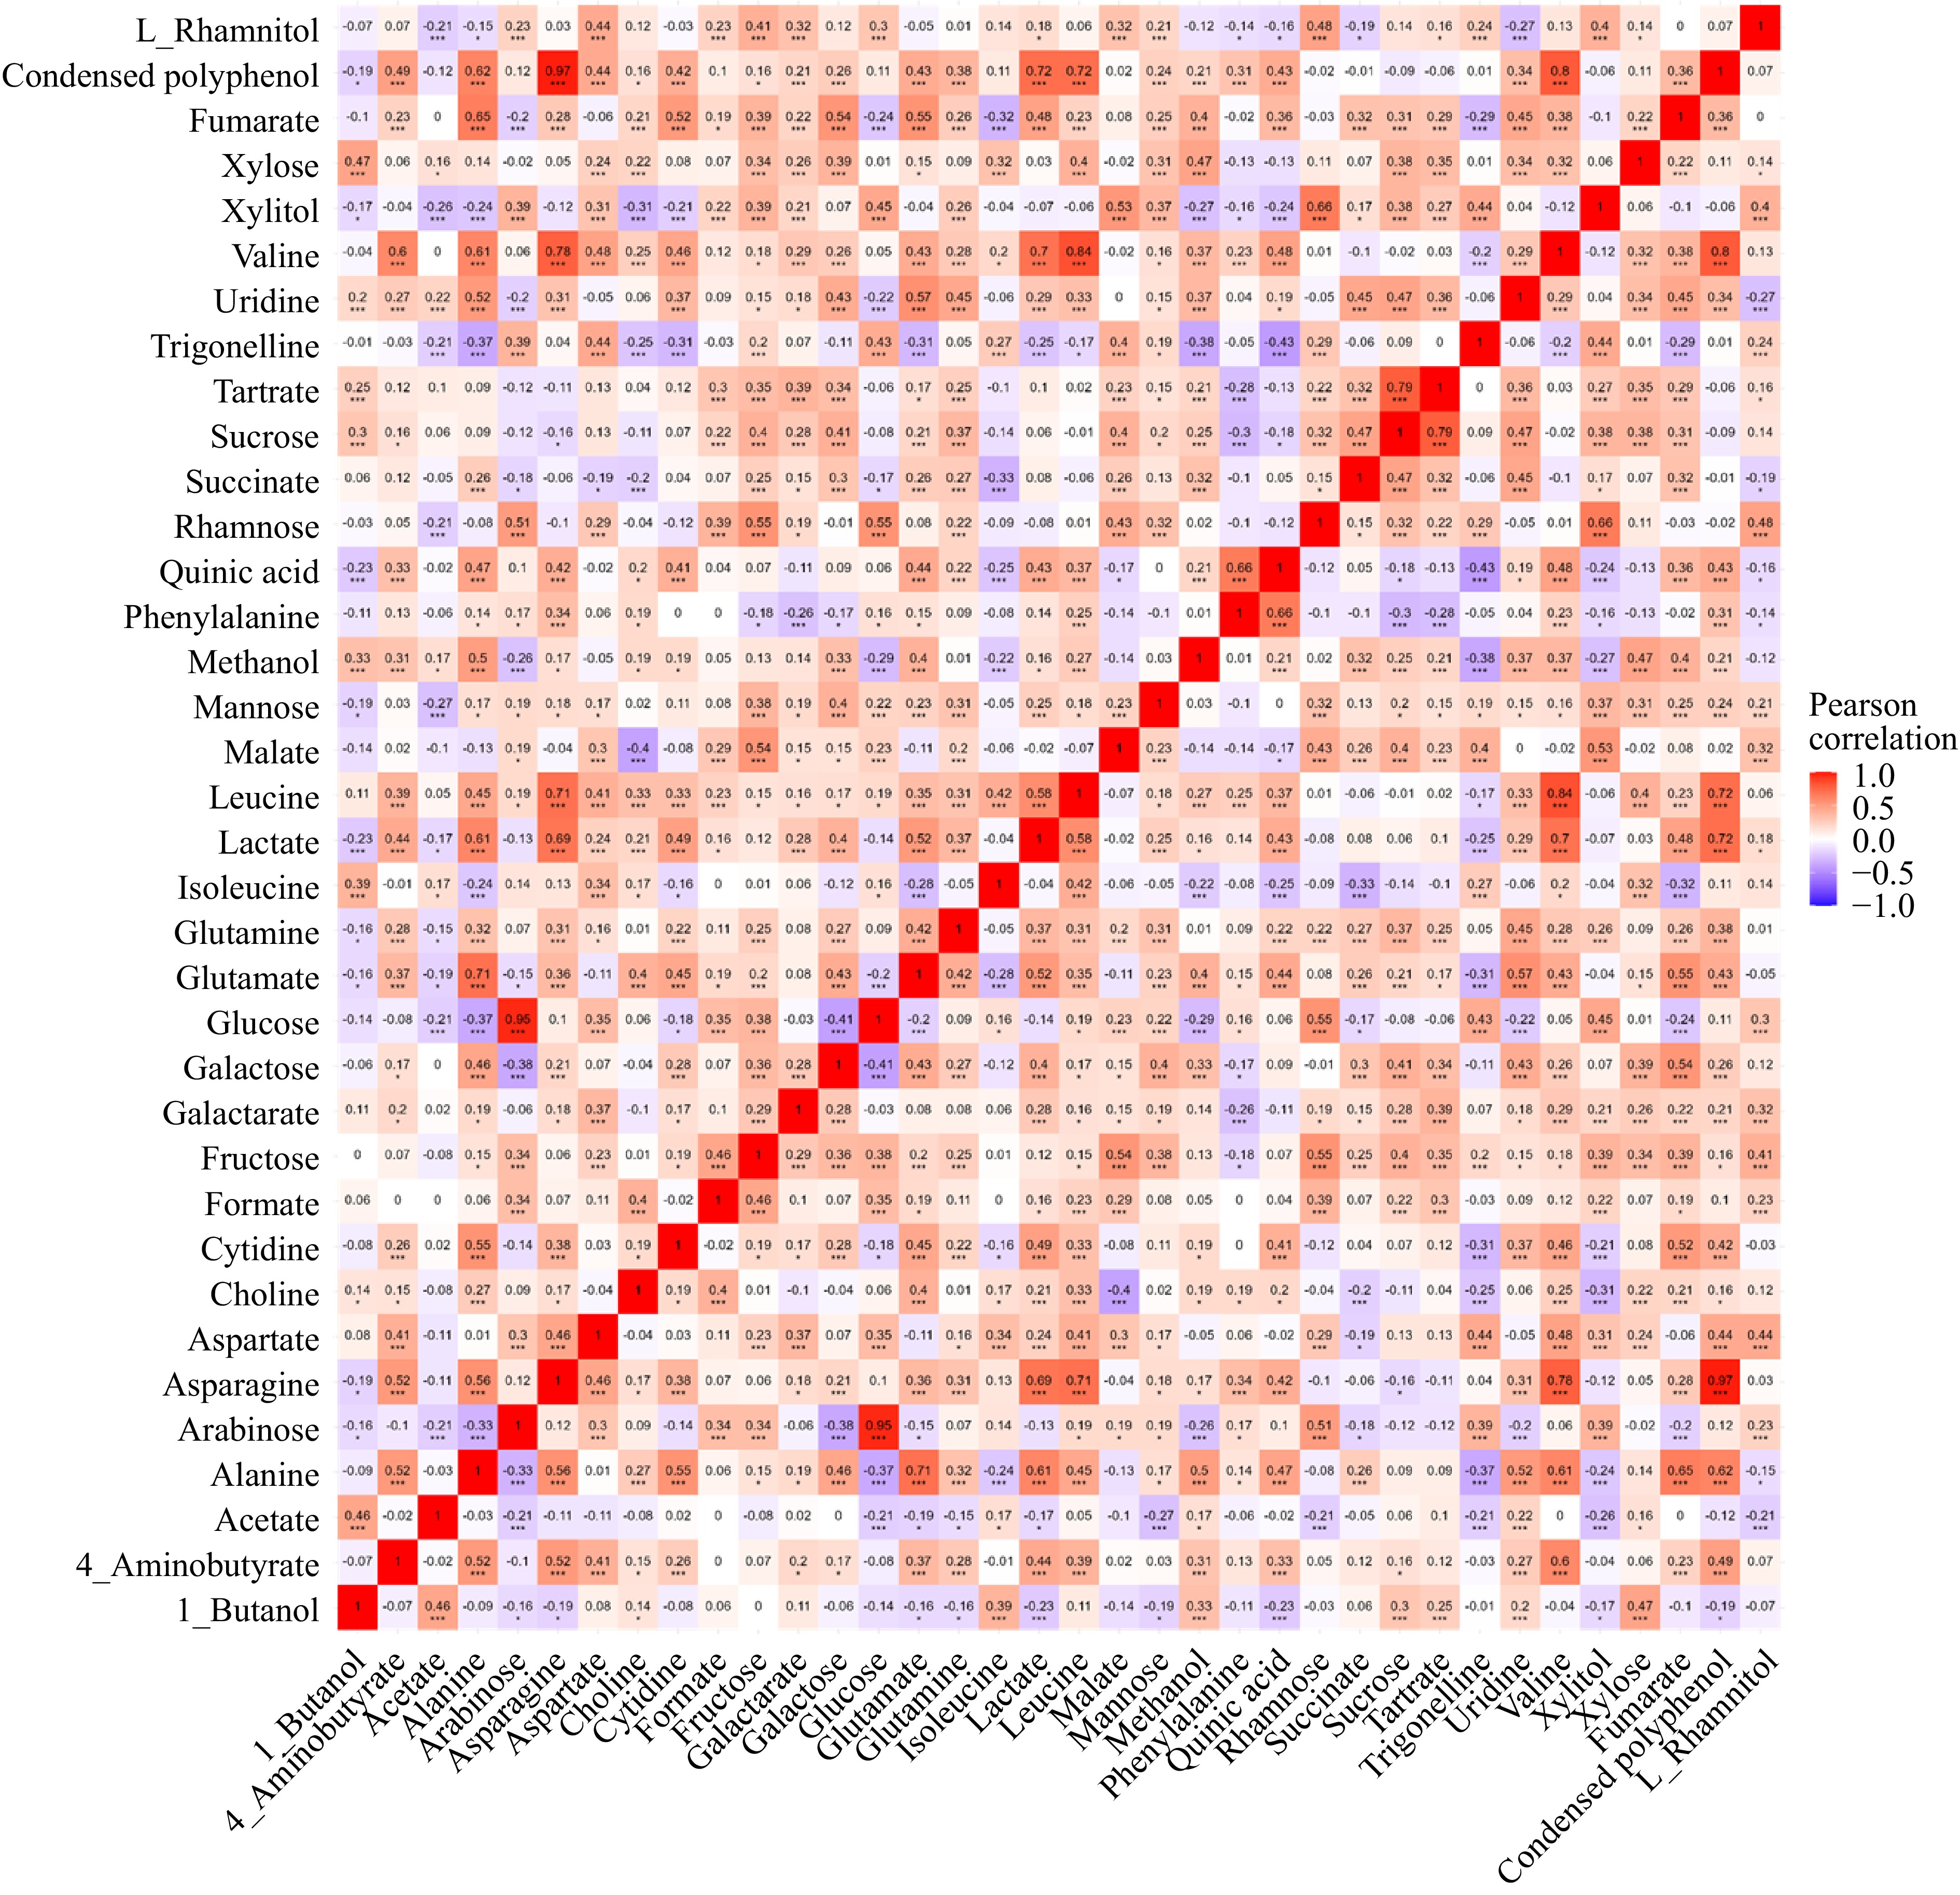
Figure 6.
Correlation plot of identified metabolites in apples.
Figures
(6)
Tables
(0)