-
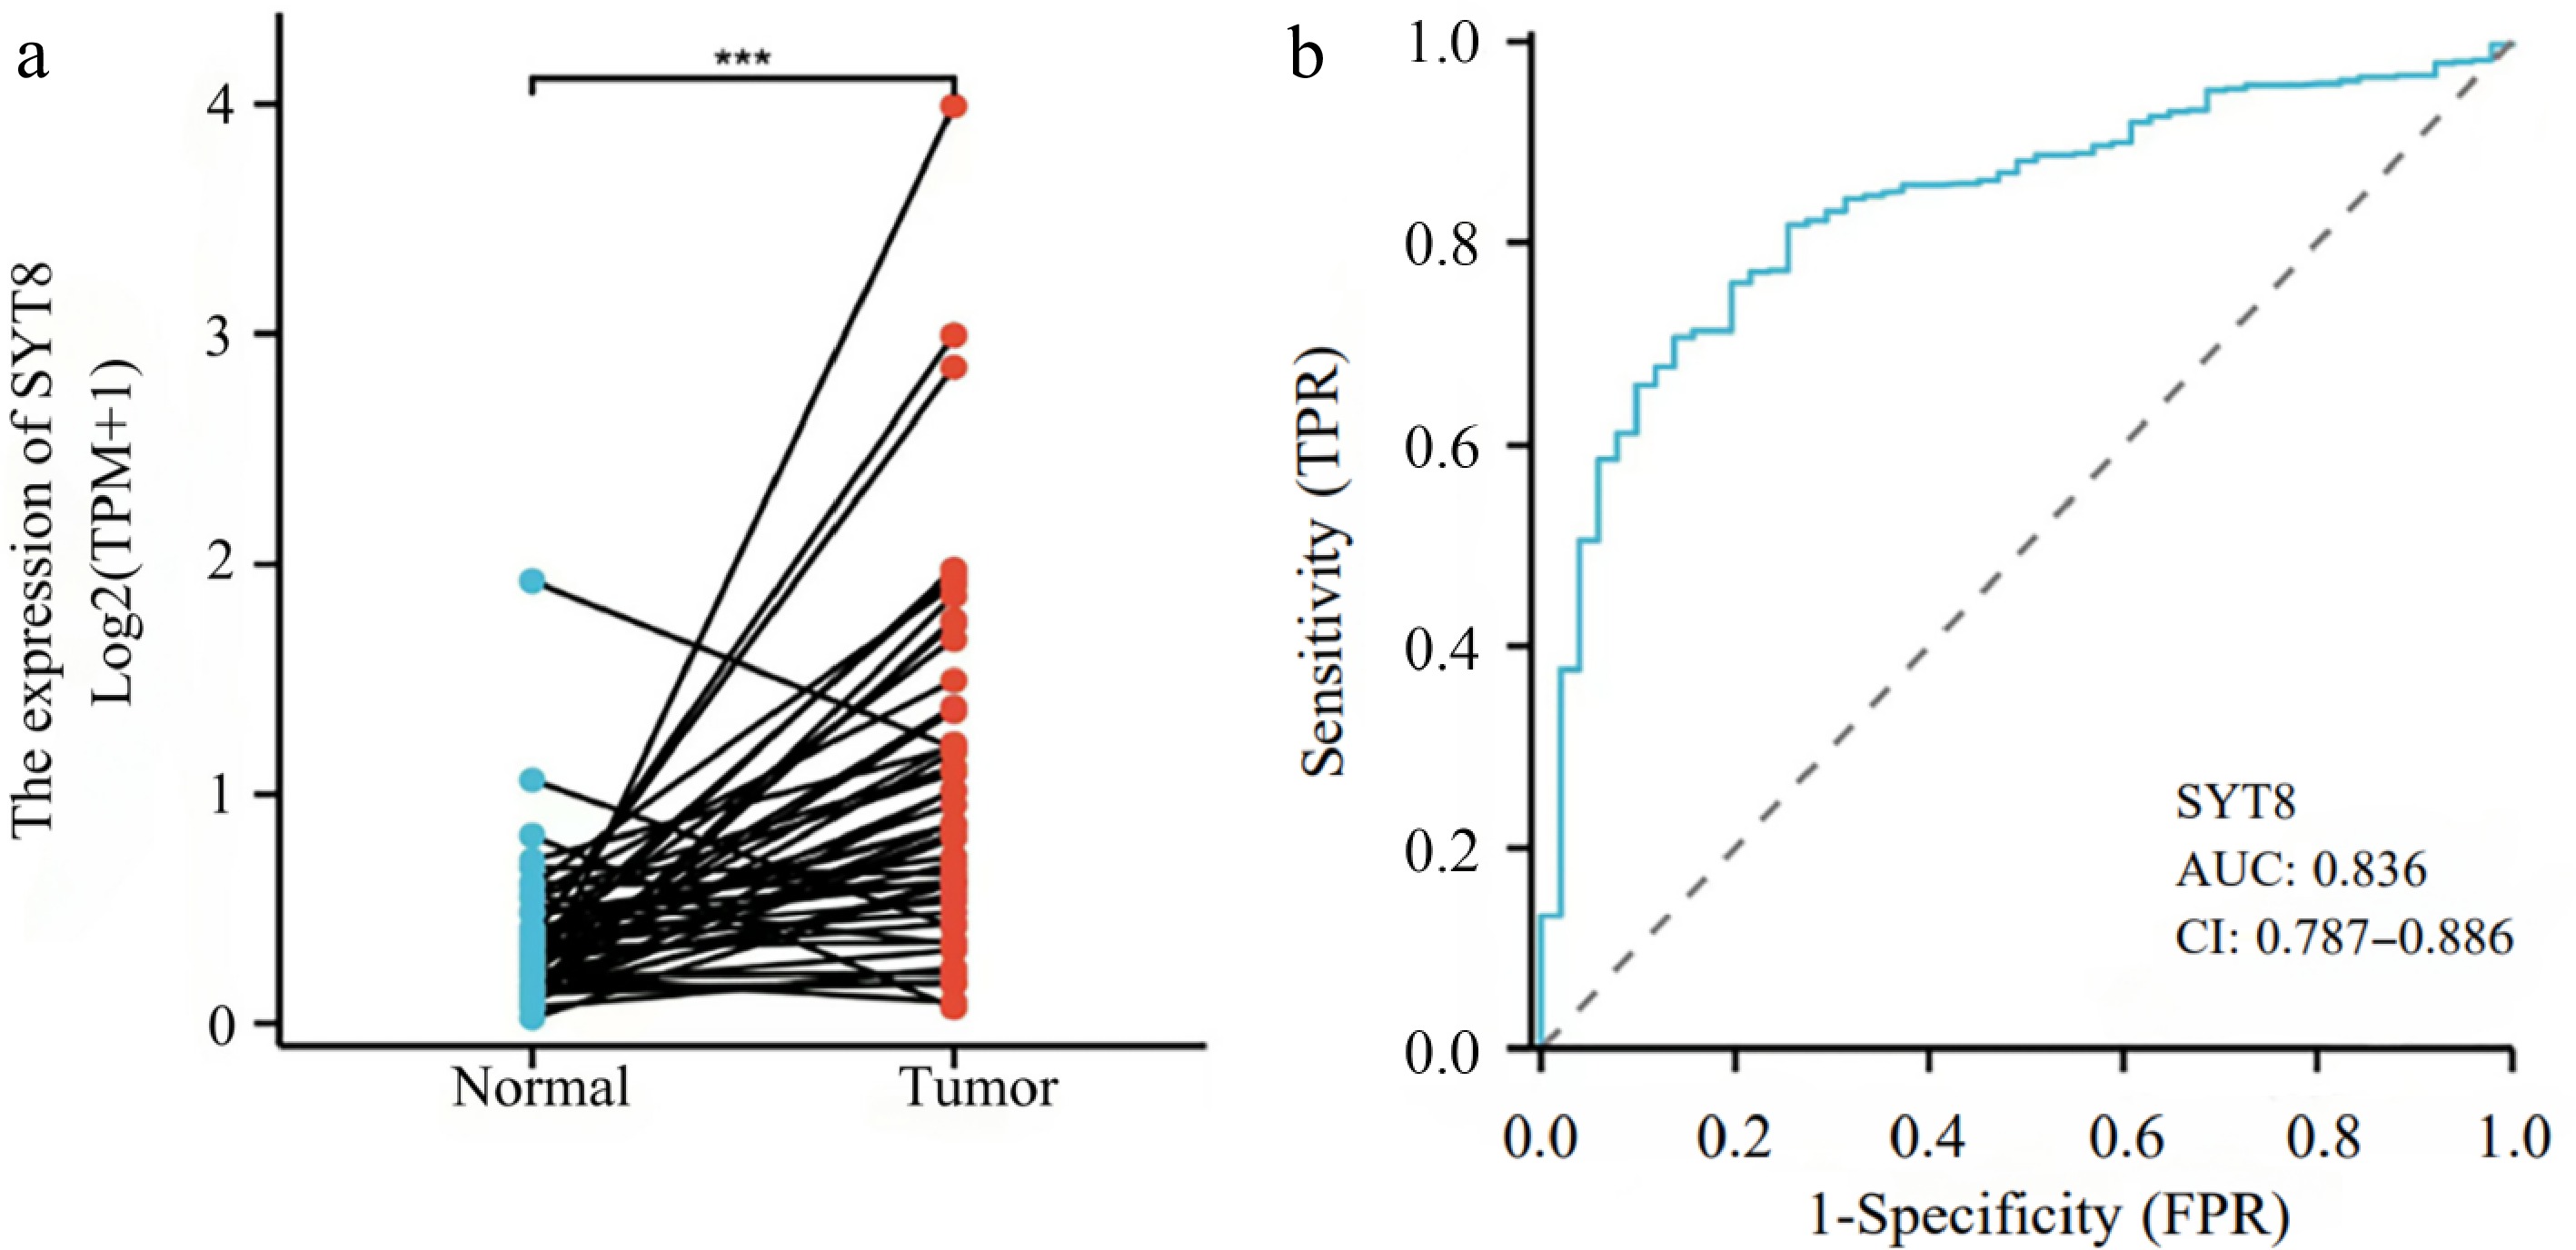
Figure 1.
Expression and diagnostic role of SYT8 in CRC. (a) SYT8 expression assessed by Wilcoxon signed rank test. (b) Diagnostic value analyzed by ROC curve.
-
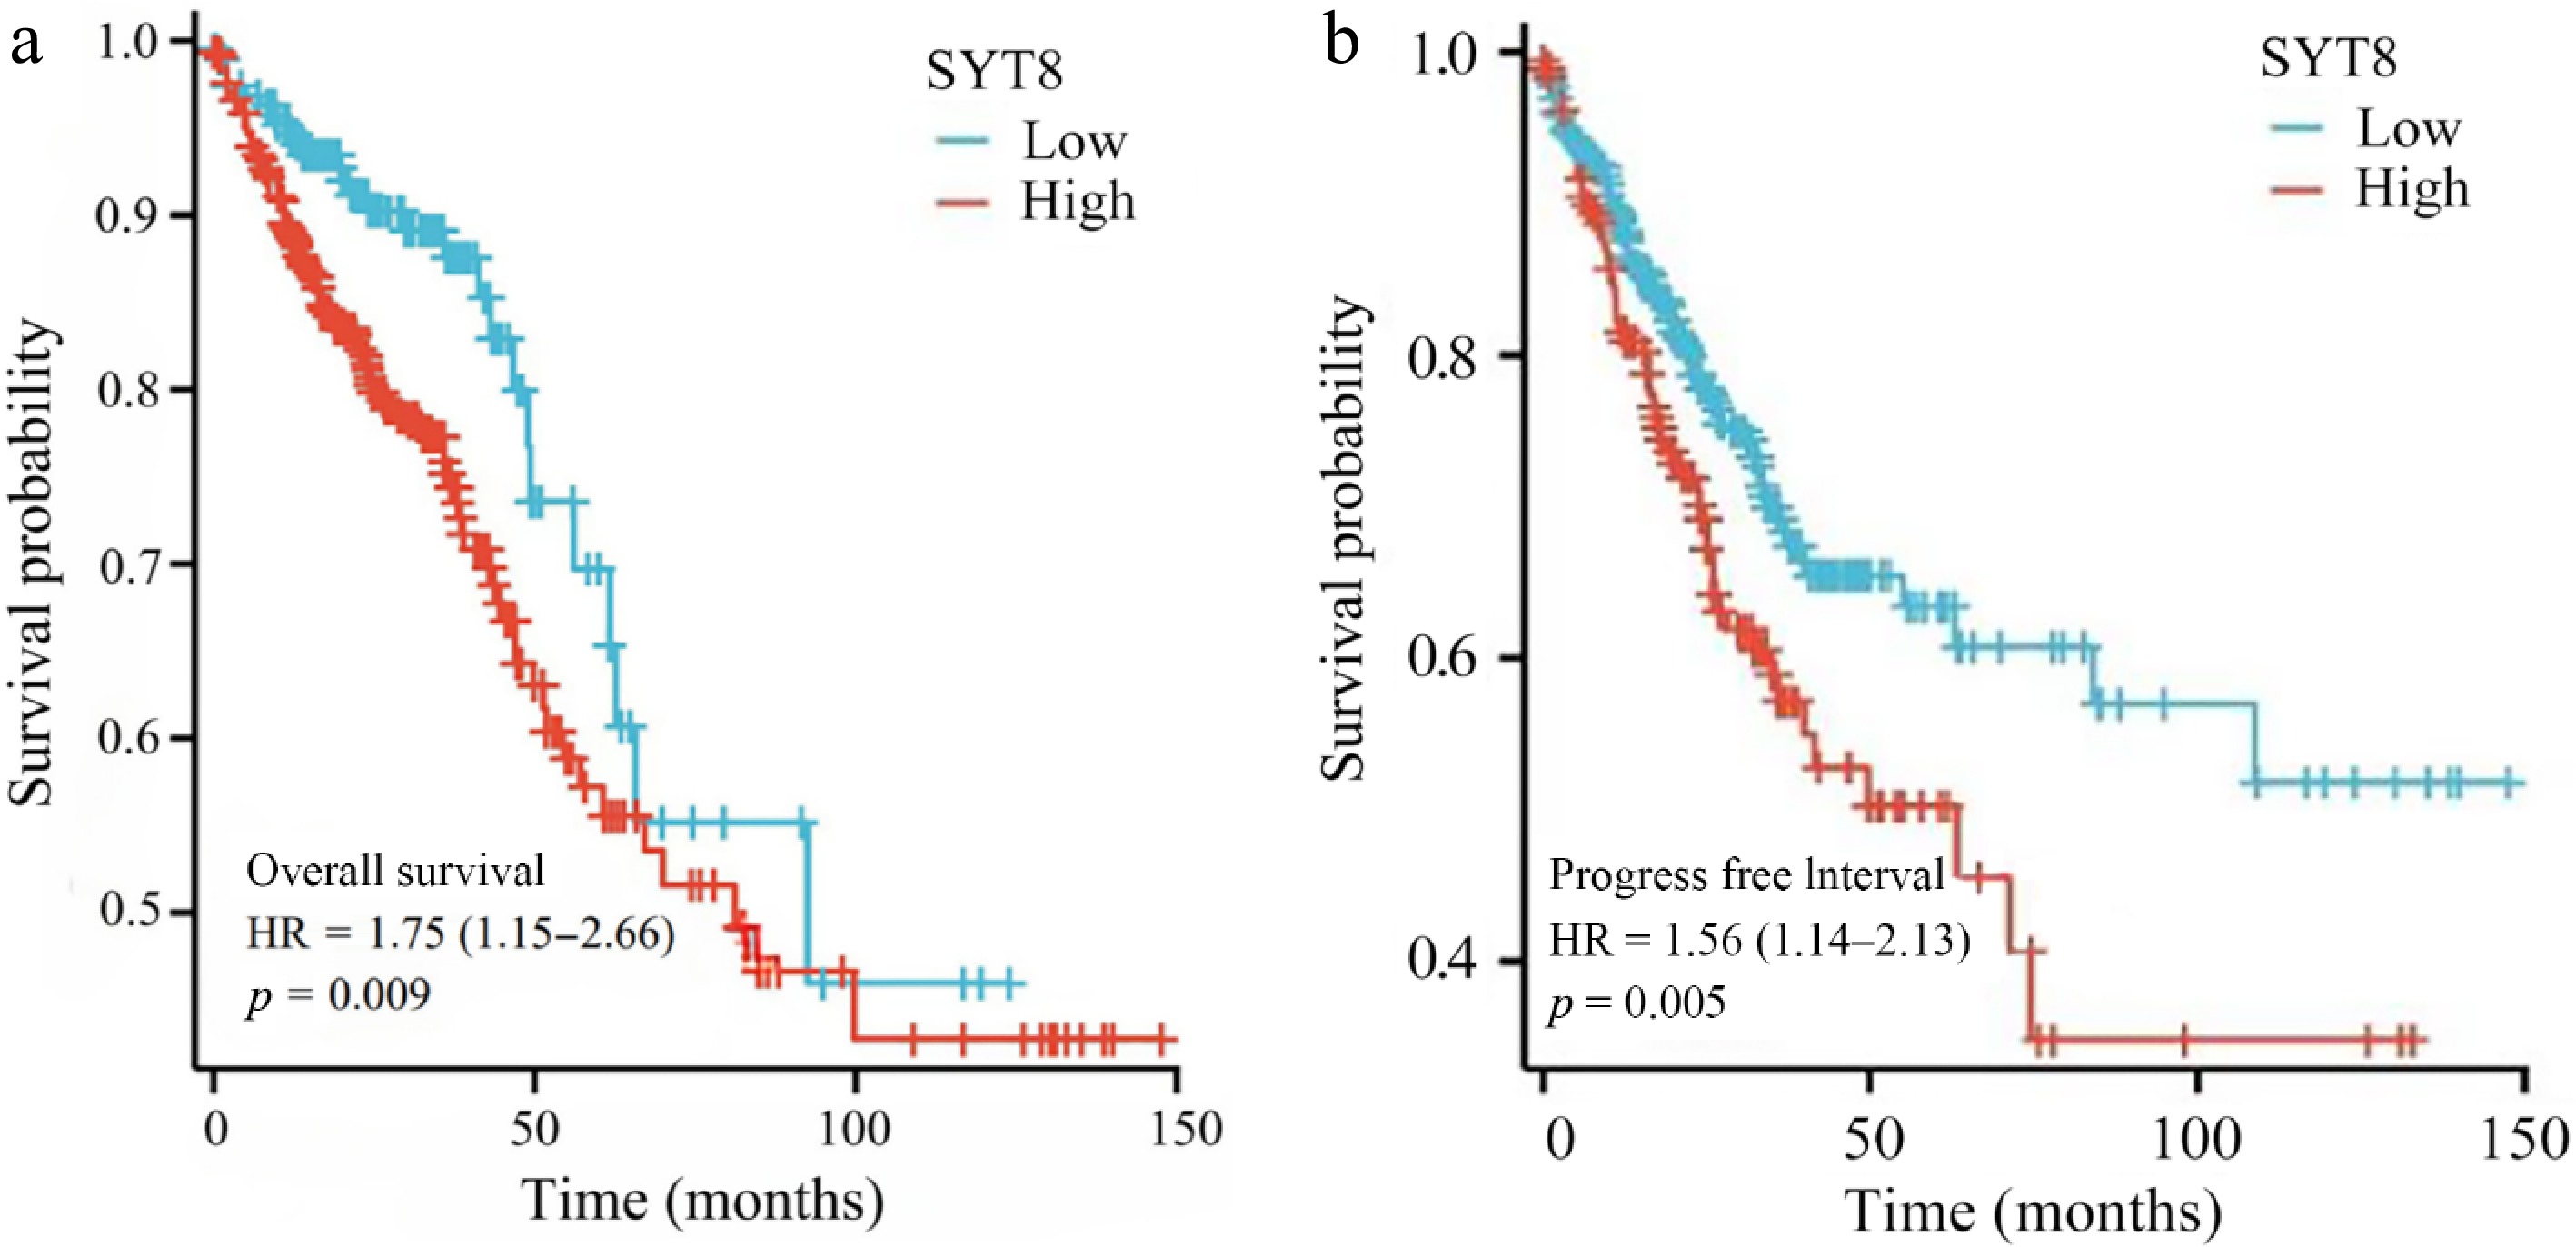
Figure 2.
Survival analysis assessed by Kaplan-Meier analysis. (a) The SYT8-high group was more likely to have a worse overall survival compared with that of the SYT8-low group. (b) The SYT8-high group was more likely to have a worse progress free interval compared with that of the SYT8-low group.
-
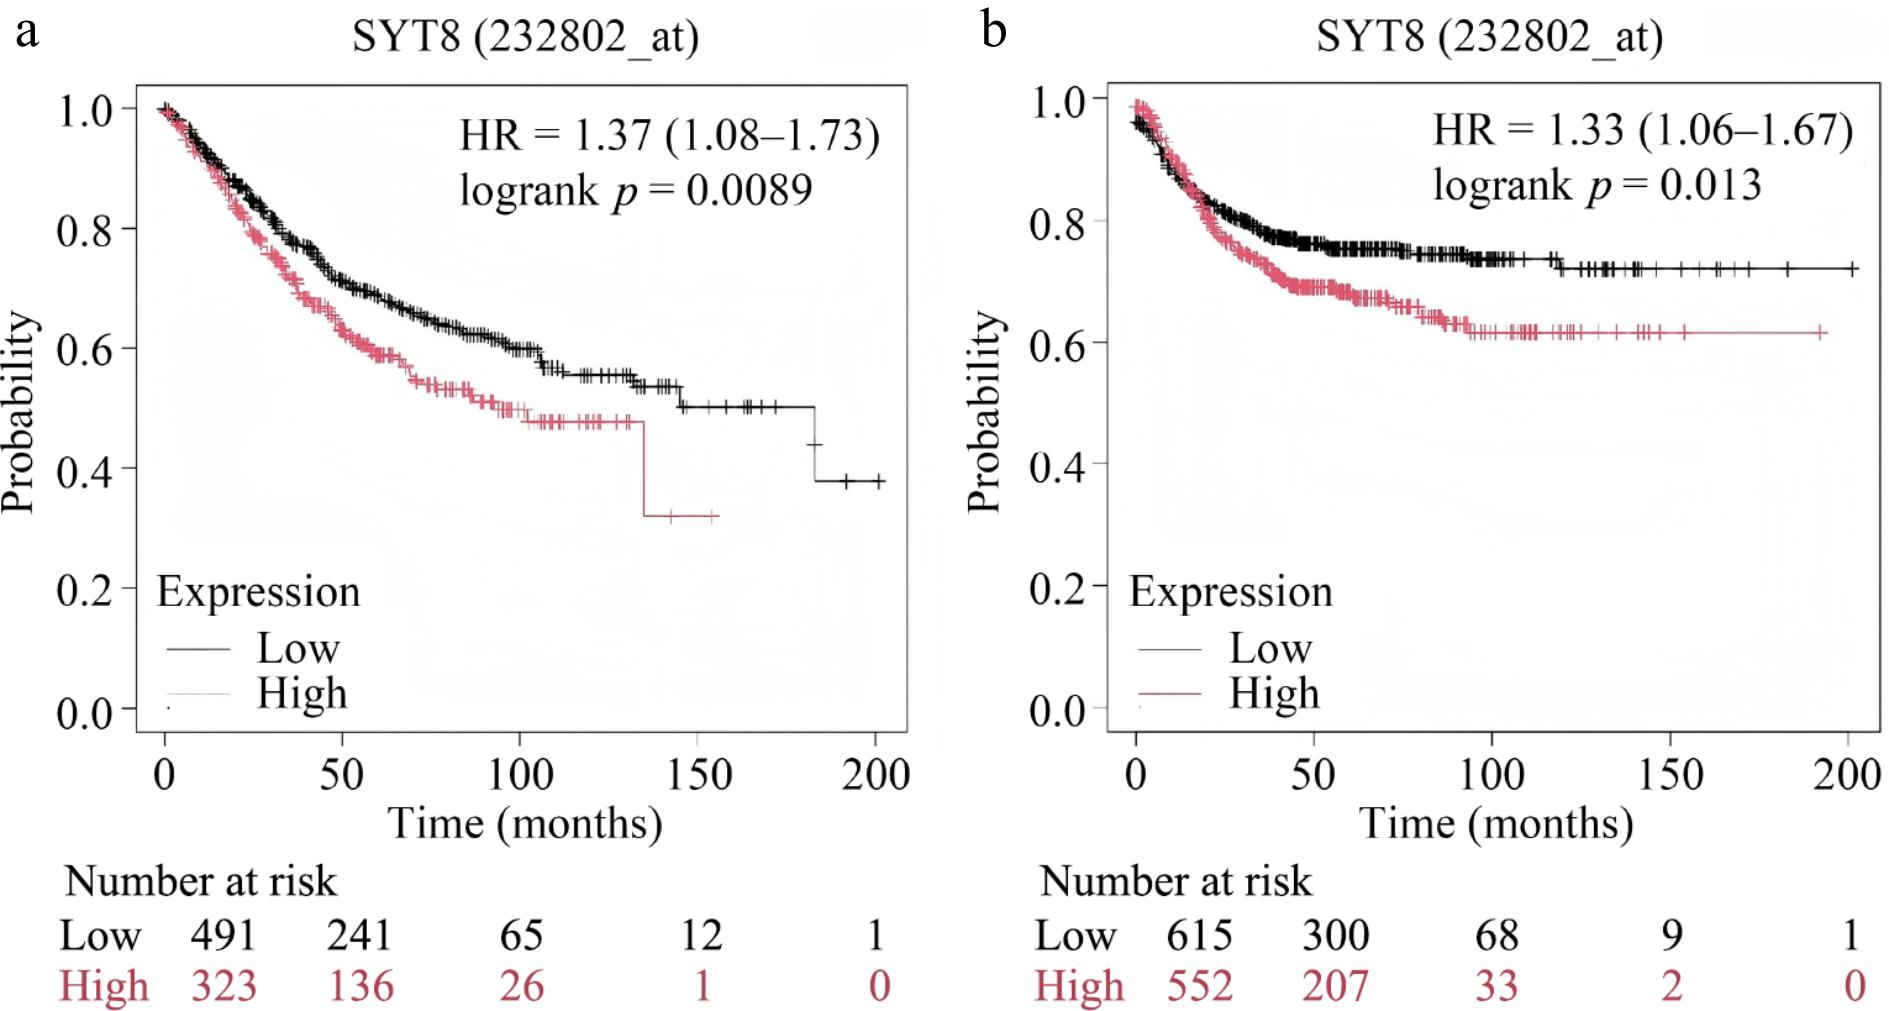
Figure 3.
Survival analysis based on the Kaplan-Meier Plotter database. The Kaplan-Meier curves of patients with SYT8 high expression and SYT8 low expression are shown. (a) OS. (b) PFS.
-
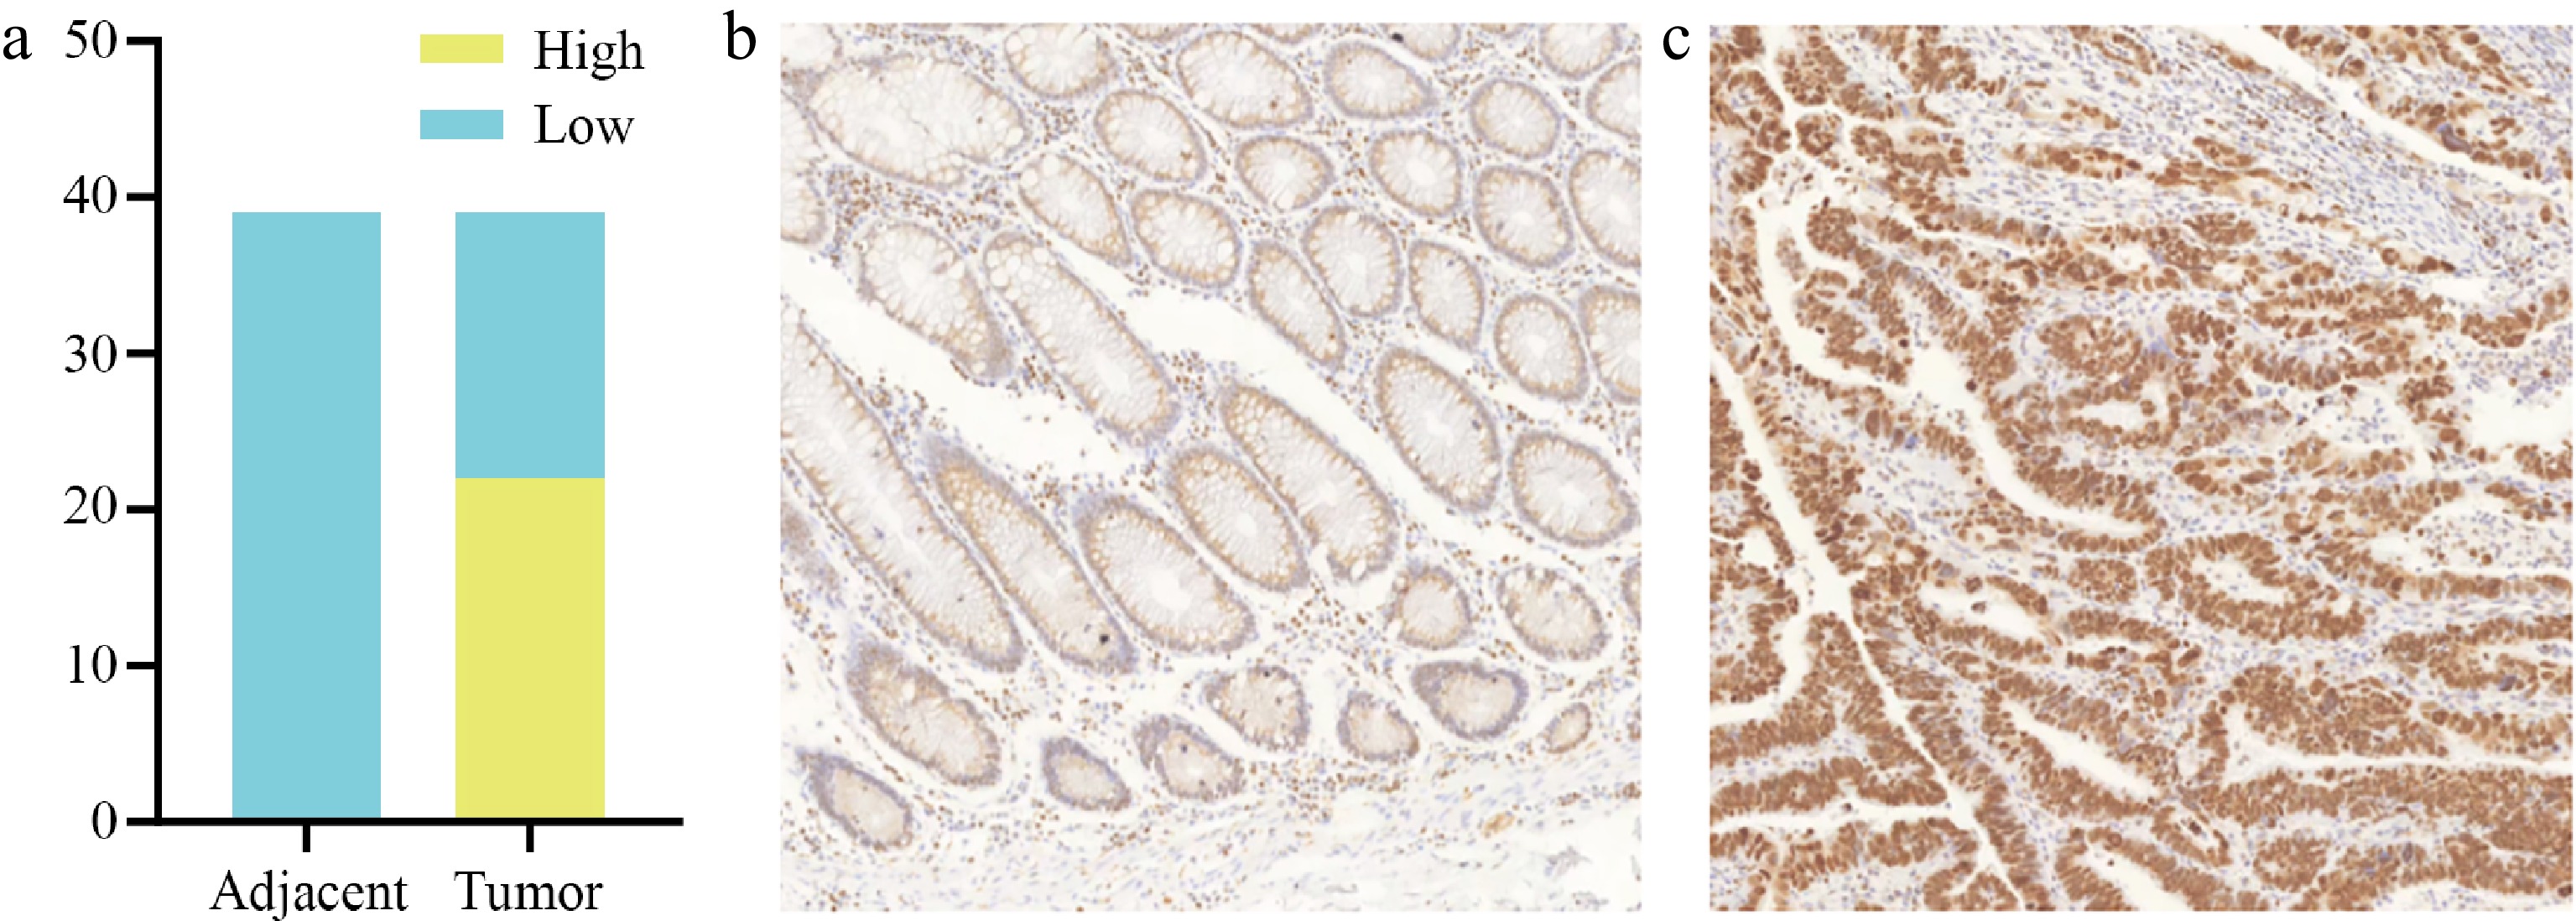
Figure 4.
SYT8 expression in tumor tissues and adjacent tissues of CRC patients. (a) SYT8 expression levels in CRC tissues was higher than adjacent tissues. (b) Immunohistochemical images of CRC adjacent tissue with low SYT8 expression. (c) Immunohistochemical images of CRC adjacent tissue with high SYT8 expression.
-
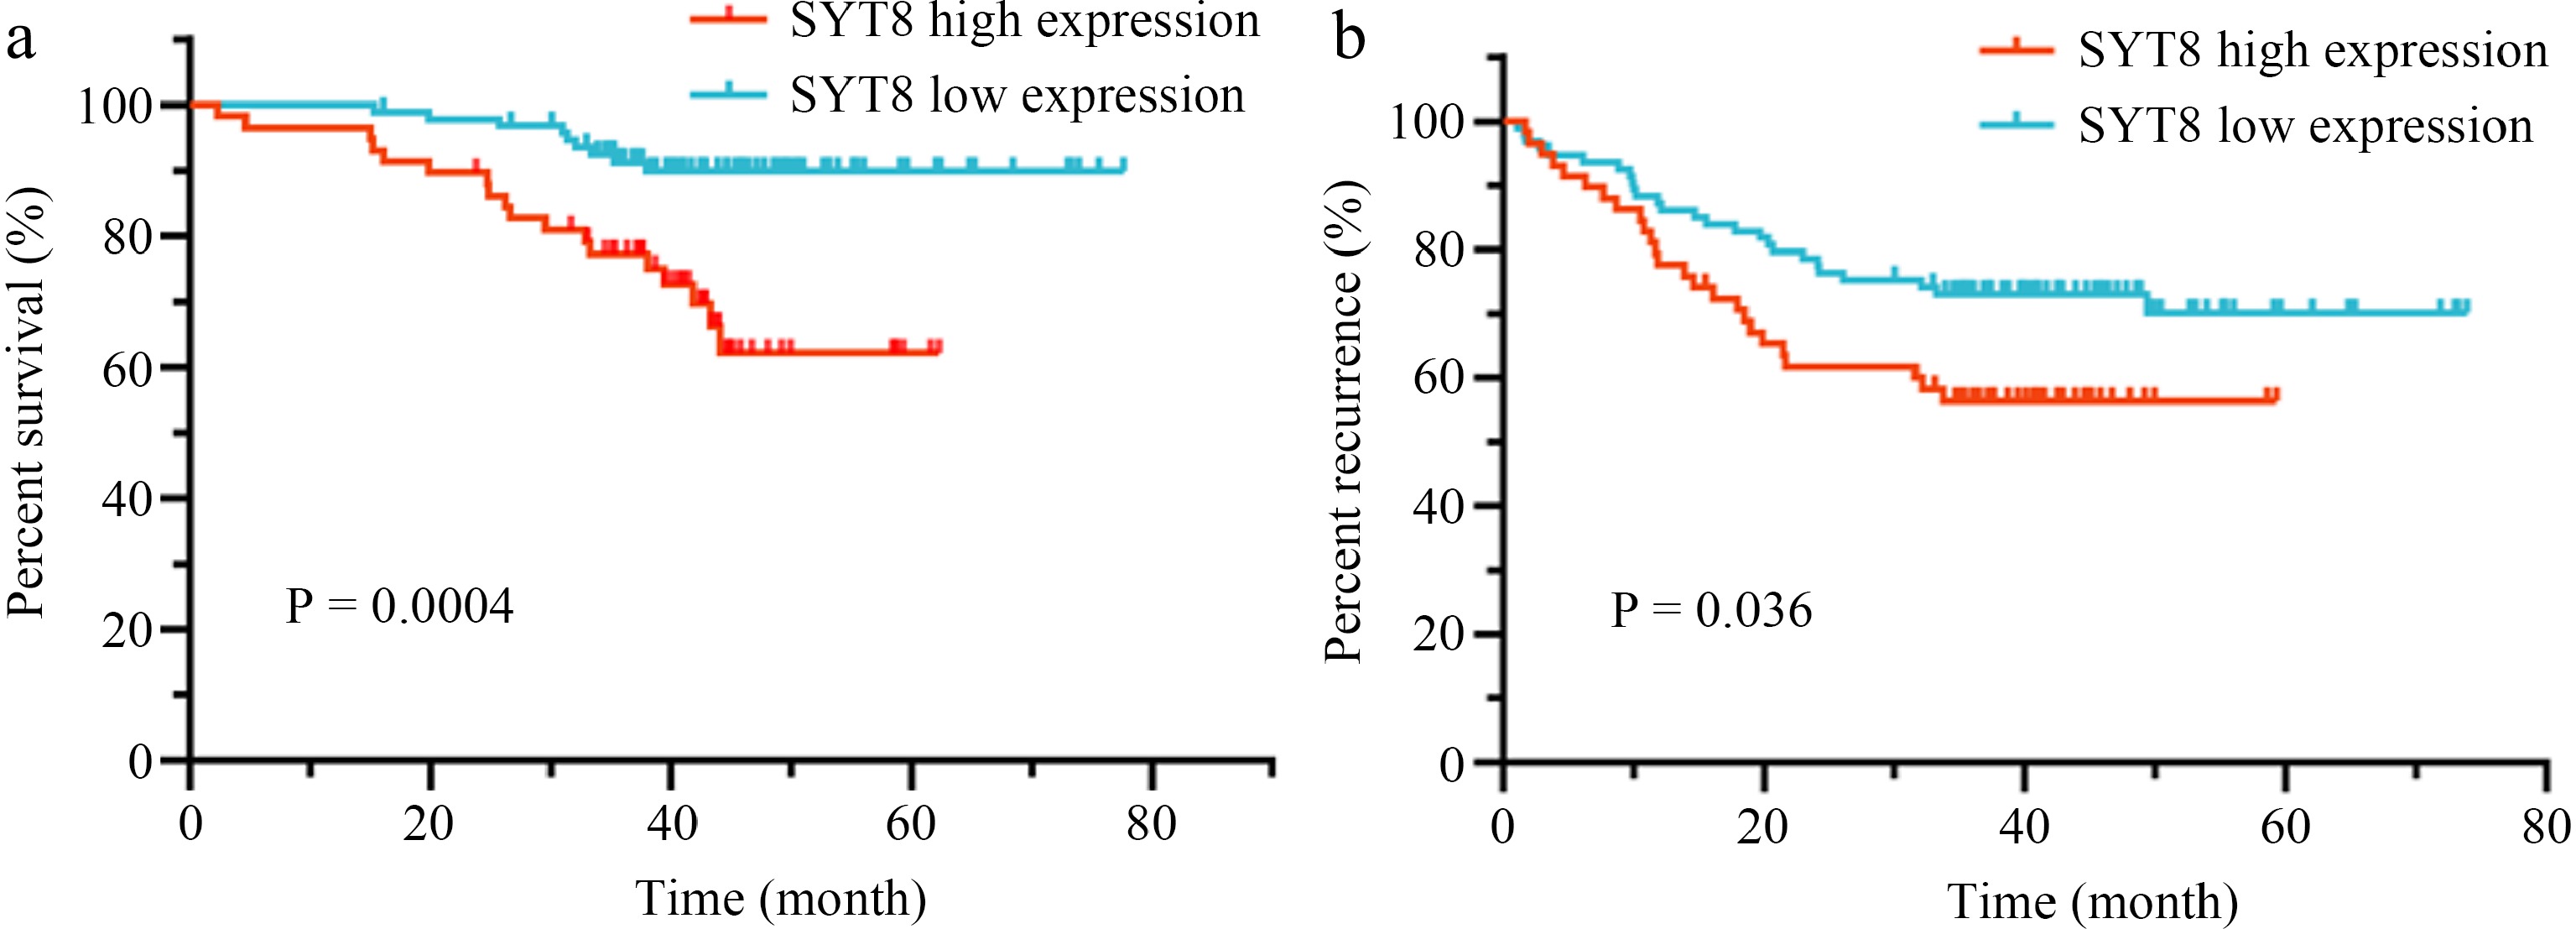
Figure 5.
Survival analysis assessed by Kaplan–Meier analysis in the retrospective validation cohort. (a) The SYT8-high group had a worse overall survival compared with that of the SYT8-low group. (b) The SYT8-high group had a worse disease free survival compared with that of the SYT8-low group.
-
Characteristics Total Low expression of SYT8 (%) High expression of SYT8 (%) p-value n 644 322(50) 322(50) Gender, n (%) 0.477 Female 301 155 (51.5) 146 (48.5) Male 343 167 (48.7) 176 (51.3) Race, n (%) 0.649 White 313 175 (55.9) 138 (44.1) Asian and black or African American 81 43 (53.1) 38 (46.9) Unknown 250 104 (41.6) 146 (58.4) Age, n (%) 0.633 ≤ 65 276 141 (51.1) 135 (48.9) > 65 368 181 (49.2) 187 (50.8) Pathologic T stage, n (%) 0.046 T1 & T2 131 55 (42) 76 (58) T3 & T4 510 264 (51.8) 246 (48.2) Unknown 3 3 (100) 0 (0) Pathologic N stage, n (%) 0.767 N0 368 181 (49.2) 187 (50.8) N1 & N2 272 137 (50.4) 135 (49.6) Unknown 4 4 (100) 0 (0) Pathologic M stage, n (%) 0.107 M0 475 228 (48) 247 (52) M1 89 51 (57.3) 38 (42.7) Unknown 80 43 (53.7) 37 (46.3) BMI, n (%) 0.358 ≤ 25 107 54 (50.5) 53 (49.5) > 25 222 124 (55.9) 98 (44.1) Unknown 315 144 (45.7) 171 (54.3) CEA level, n (%) 0.279 ≤ 5 261 128 (49) 133 (51) > 5 154 84 (54.5) 70 (45.5) Unknown 229 110 (48) 119 (52) Values in bold are statistically significant. Table 1.
Correlation analysis of clinicopathologic parameters and expression of SYT8.
-
Characteristics Total (N) Univariate analysis Multivariate analysis Hazard ratio (95% CI) p Hazard ratio (95% CI) p Gender (male/female) 643 1.217 (0.892−1.660) 0.216 Race (Asian and black or African American/white) 394 1.547 (0.992−2.412) 0.054 1.322 (0.807−2.168) 0.268 Age (> 65/≤ 65) 643 1.006 (0.737−1.371) 0.972 Pathologic T stage 640 T1 & T2 131 Reference Reference T3 & T4 509 3.198 (1.814−5.636) < 0.001 2.073 (0.871−4.933) 0.099 Pathologic N stage 639 N0 367 Reference Reference N1 & N2 272 2.624 (1.916−3.592) < 0.001 0.963 (0.591−1.570) 0.881 Pathologic M stage (M1/M0) 563 5.577 (3.945−7.884) < 0.001 6.018 (3.596−10.069) < 0.001 SYT8 (high/low) 643 1.135 (0.836−1.541) 0.418 Values in bold are statistically significant. Table 2.
COX regression analysis to assess prognostic factors for PFI.
-
Characteristics Total (N) Univariate analysis Multivariate analysis Hazard ratio (95% CI) p Hazard ratio (95% CI) p Gender (male/female) 643 1.054 (0.744−1.491) 0.769 Race (Asian and black or African American/white) 394 1.072 (0.622−1.848) 0.802 Age (> 65/≤ 65) 643 1.939 (1.320−2.849) < 0.001 2.583 (1.667−4.002) < 0.001 Pathologic T stage 640 T1 & T2 131 Reference Reference T3 & T4 509 2.468 (1.327−4.589) 0.004 2.277 (1.034−5.011) 0.041 Pathologic N stage 639 N0 367 Reference Reference N1 & N2 272 2.627 (1.831−3.769) < 0.001 1.842 (1.164−2.916) 0.009 Pathologic M stage (M1/M0) 563 3.989 (2.684−5.929) < 0.001 3.105 (1.949−4.948) < 0.001 SYT8 (high/low) 643 1.356 (0.956−1.923) 0.087 1.666 (1.130−2.455) 0.010 Values in bold are statistically significant. Table 3.
COX regression analysis to assess prognostic factors for OS.
-
Characteristics Total Positive Negative P value n 153 58(38) 95(62) Age, n (%) 0.386 ≥ 60 58 37(63.8) 21(36.2) < 60 95 67(70.5) 28(29.5) Gender, n (%) 0.64 Male 94 37(39.4) 57(60.6) Female 59 21(35.6) 38(64.4) Margins 0.201 Present 1 1(100) 0(0) Absent 152 57(37.5) 95(62.5) N stage 0.008 N1 74 36(48.6) 38(51.3) N0 79 22(27.8) 57(72.2) Vascular invasion 0.192 Present 56 25(44.6) 31(55.4) Absent 97 33(34) 64(66) Nerve invasion 0.221 Present 49 22(44.9) 27(55.1) Absent 104 36(34.6) 68(65.4) T stage 0.283 T1 2 0(0) 2(100) T2 11 3(27.3) 8(72.7) T3 122 45(36.9) 77(36.1) T4 18 10(55.6) 8(44.4) Differentiation 0.41 Low 34 16(47.1) 18(52.9) Middle 108 39(36.1) 69(63.9) High 11 3(27.3) 8(72.7) M stage 0.571 M1 5 3(60) 2(40) M0 148 55(37.2) 93(62.8) Values in bold are statistically significant. Table 4.
Clinicopathologic parameters and demographic features in CRC patients with or without SYT8 expression in the retrospective validation cohort.
-
Characteristics Univariate analysis Multivariate analysis Hazard ratio (95% CI) p Hazard ratio (95% CI) p SYT8 (low/high) 3.811 (1.710−8.494) 0.001 3.256 (1.427−7.426) 0.005 Gender (male/female) 1.265 (0.568−2.815) 0.561 Age (≥ 60/< 60) 2.006 (0.759−5.298) 0.160 N stage (N1/N0) 1.460 (0.683−3.120) 0.329 M stage (M0/M1) 0.139(0.041−0.467) 0.001 0.150 (0.042−0.532) 0.003 Margins (absent/present) 0.047 (0.006−0.384) 0.004 Vascular invasion (absent/present) 0.405 (0.190−0.867) 0.020 Nerve invasion (absent/present) 0.376 (0.177−0.802) 0.011 T stage 0.035 T1/T4 0.980 T2/T4 0.166 (0.020−1.357) 0.094 T3/T4 0.286 (0.119−0.684) 0.005 Differentiation 0.197 Low/high 1.534 (0.331−7.108) 0.584 Middle/high 0.723 (0.166−3.145) 0.665 Values in bold are statistically significant. Table 5.
COX regression analysis to assess prognostic factors for OS in the retrospective validation cohort.
-
Characteristics Univariate analysis Multivariate analysis Hazard ratio (95% CI) p Hazard ratio (95% CI) p SYT8 (low/high) 1.790 (1.031−3.108) 0.039 1.571 (0.891−2.770) 0.119 Gender (male/female) 1.246 (0.696−2.230) 0.459 Age (≥ 60/< 60) 1.623 (0.833−3.164) 0.155 N stage (N1/N0) 1.723 (0.986−3.011) 0.056 M stage (M1/M0) 4.603 (1.643−12.892) 0.004 3.713 (1.304−10.574) 0.014 Margins (absent/present) 0.143 (0.019−1.064) 0.057 Vascular invasion (absent/present) 0.805 (0.461−1.407) 0.447 Nerve invasion (absent/present) 0.523 (0.300−0.910) 0.022 T stage 0.068 T1/T4 T2/T4 0.111 (0.014−0.870) 0.036 T3/T4 0.466 (0.233−0.932) 0.031 Differentiation 0.217 Low/high 0.989 (0.325−3.011) 0.985 Middle/high 0.594 (0.210−1.678) 0.326 Values in bold are statistically significant. Table 6.
COX regression analysis to assess prognostic factors for DFS in the retrospective validation cohort.
Figures
(5)
Tables
(6)