-
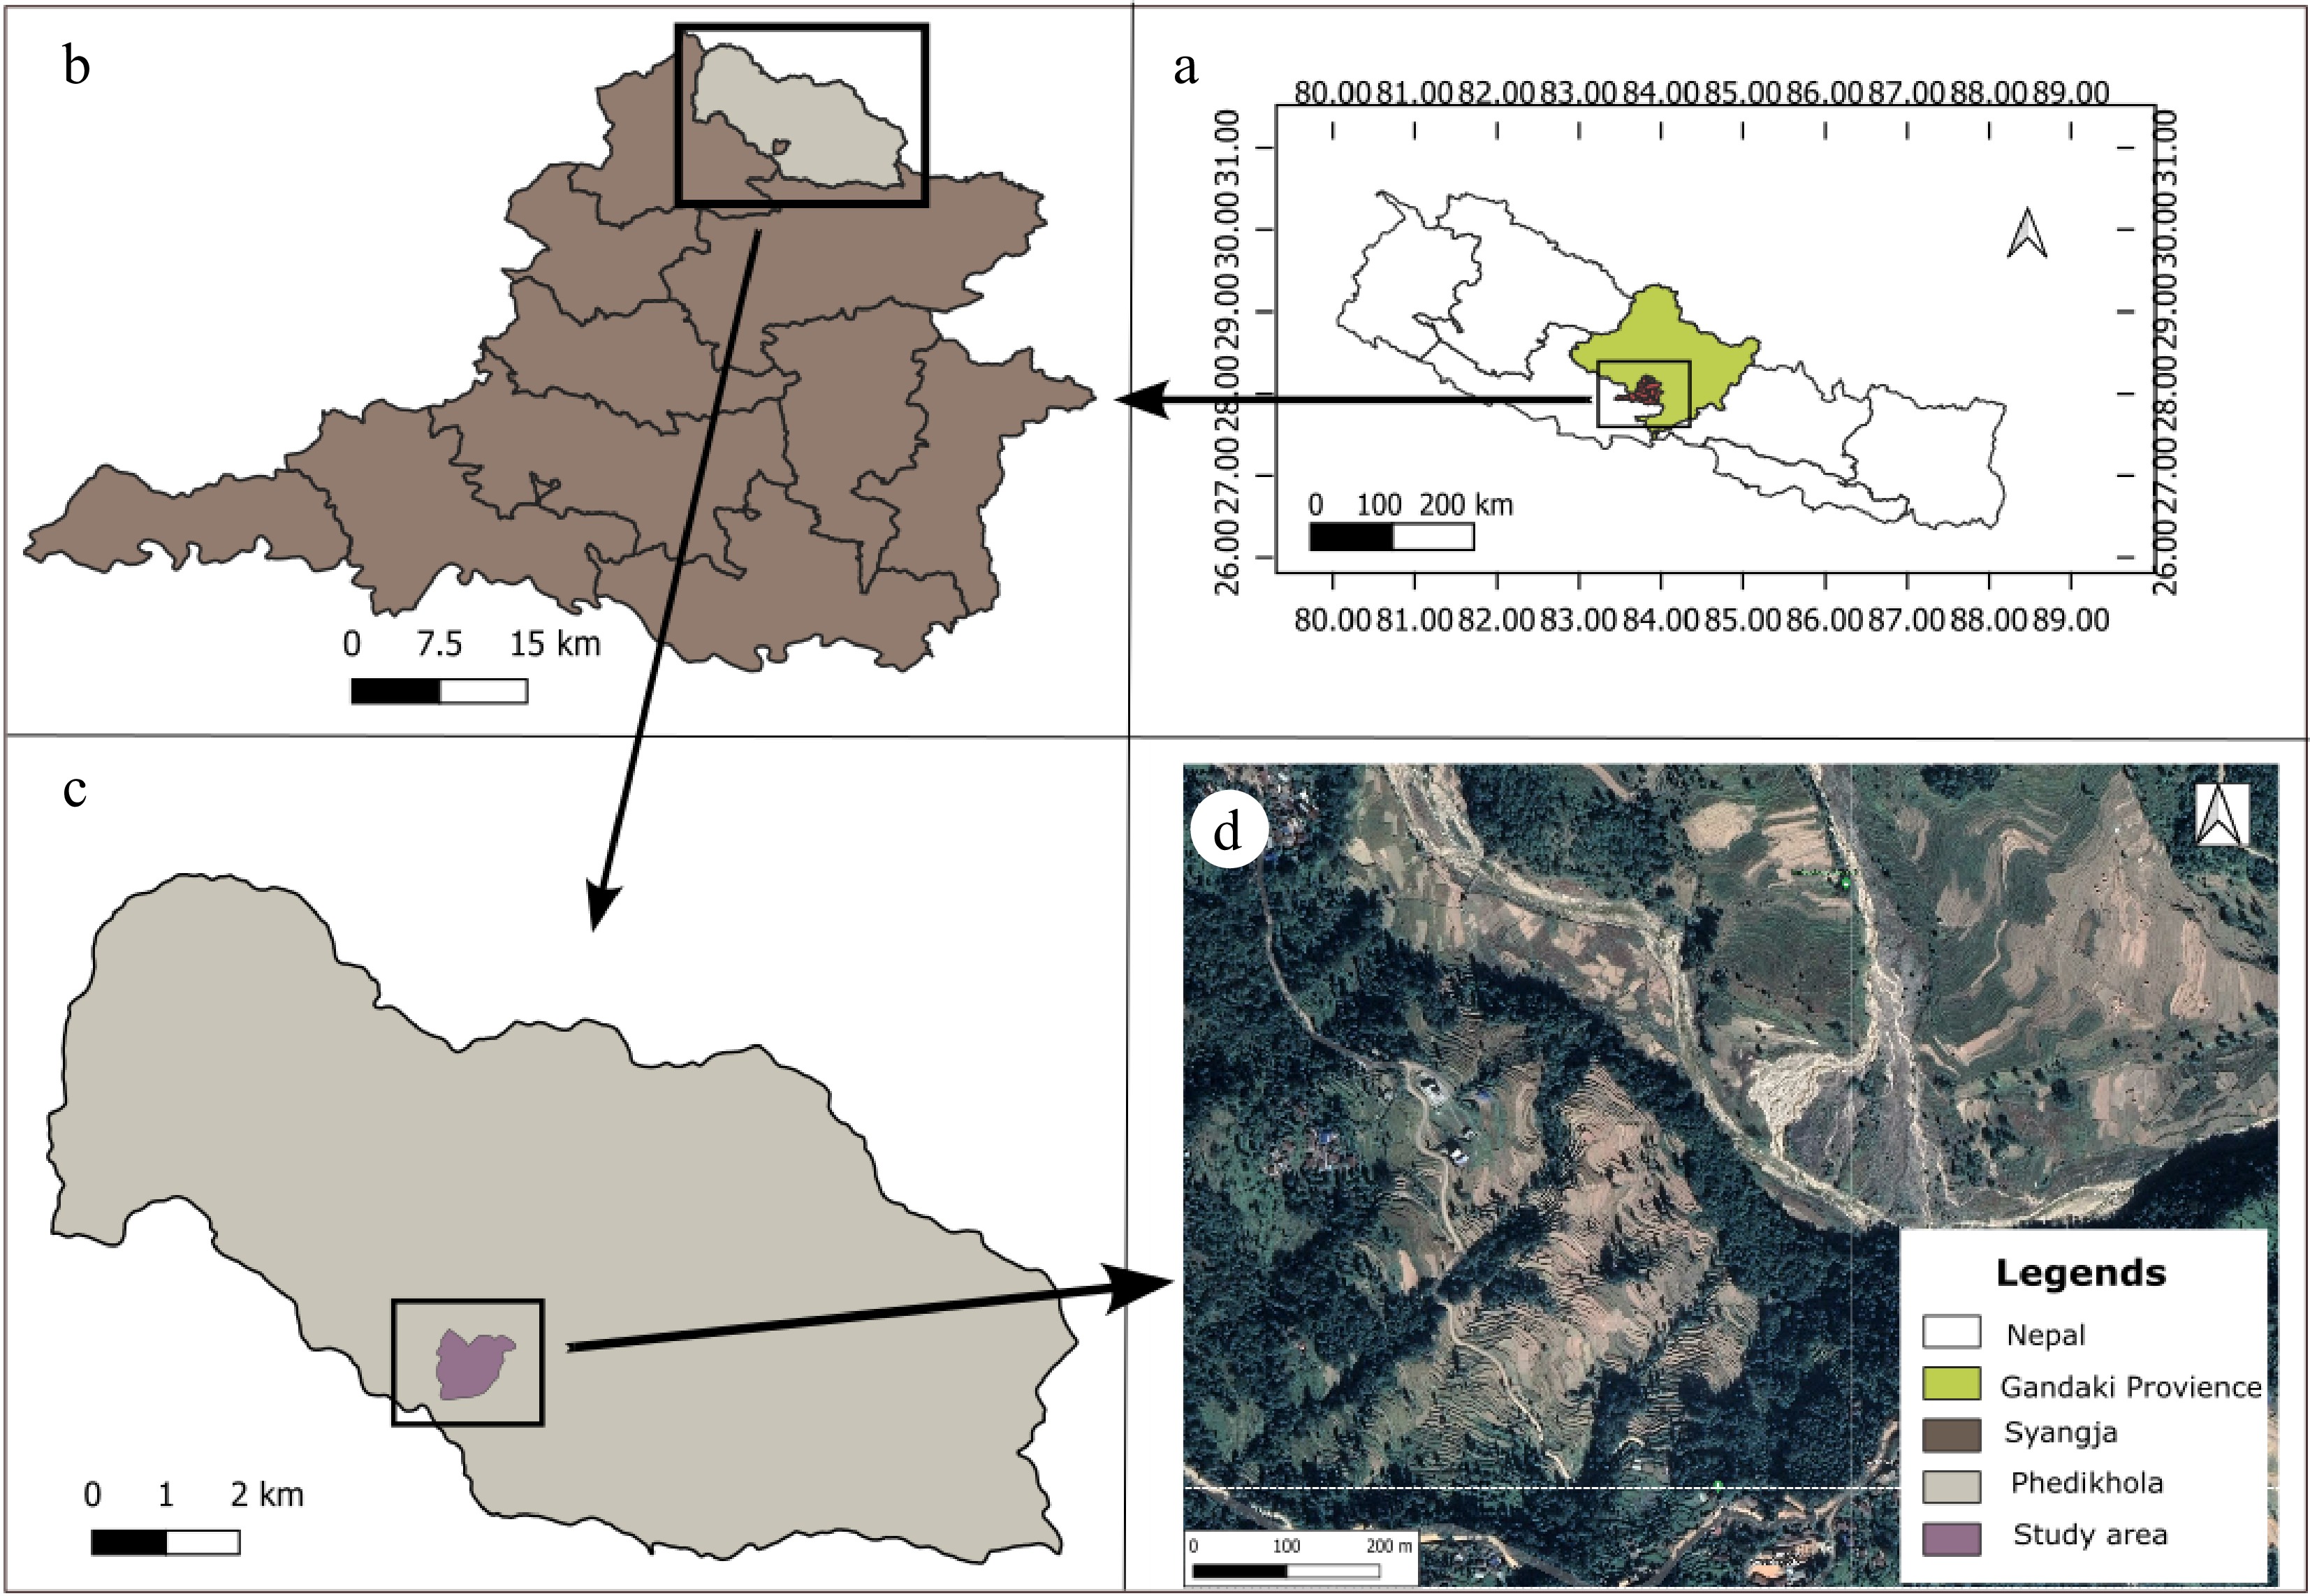
Figure 1.
(a) Map of Nepal showing Gandaki Province and Syangja district. (b) Map of Syangja district showing Phedikhola Rural Municipality. (c) Phedikhola Rural Municipality showing Kramdi village. (d) Satellite view of study area (Google hybrid, Qgis, accessed on 12/04/2022).
-
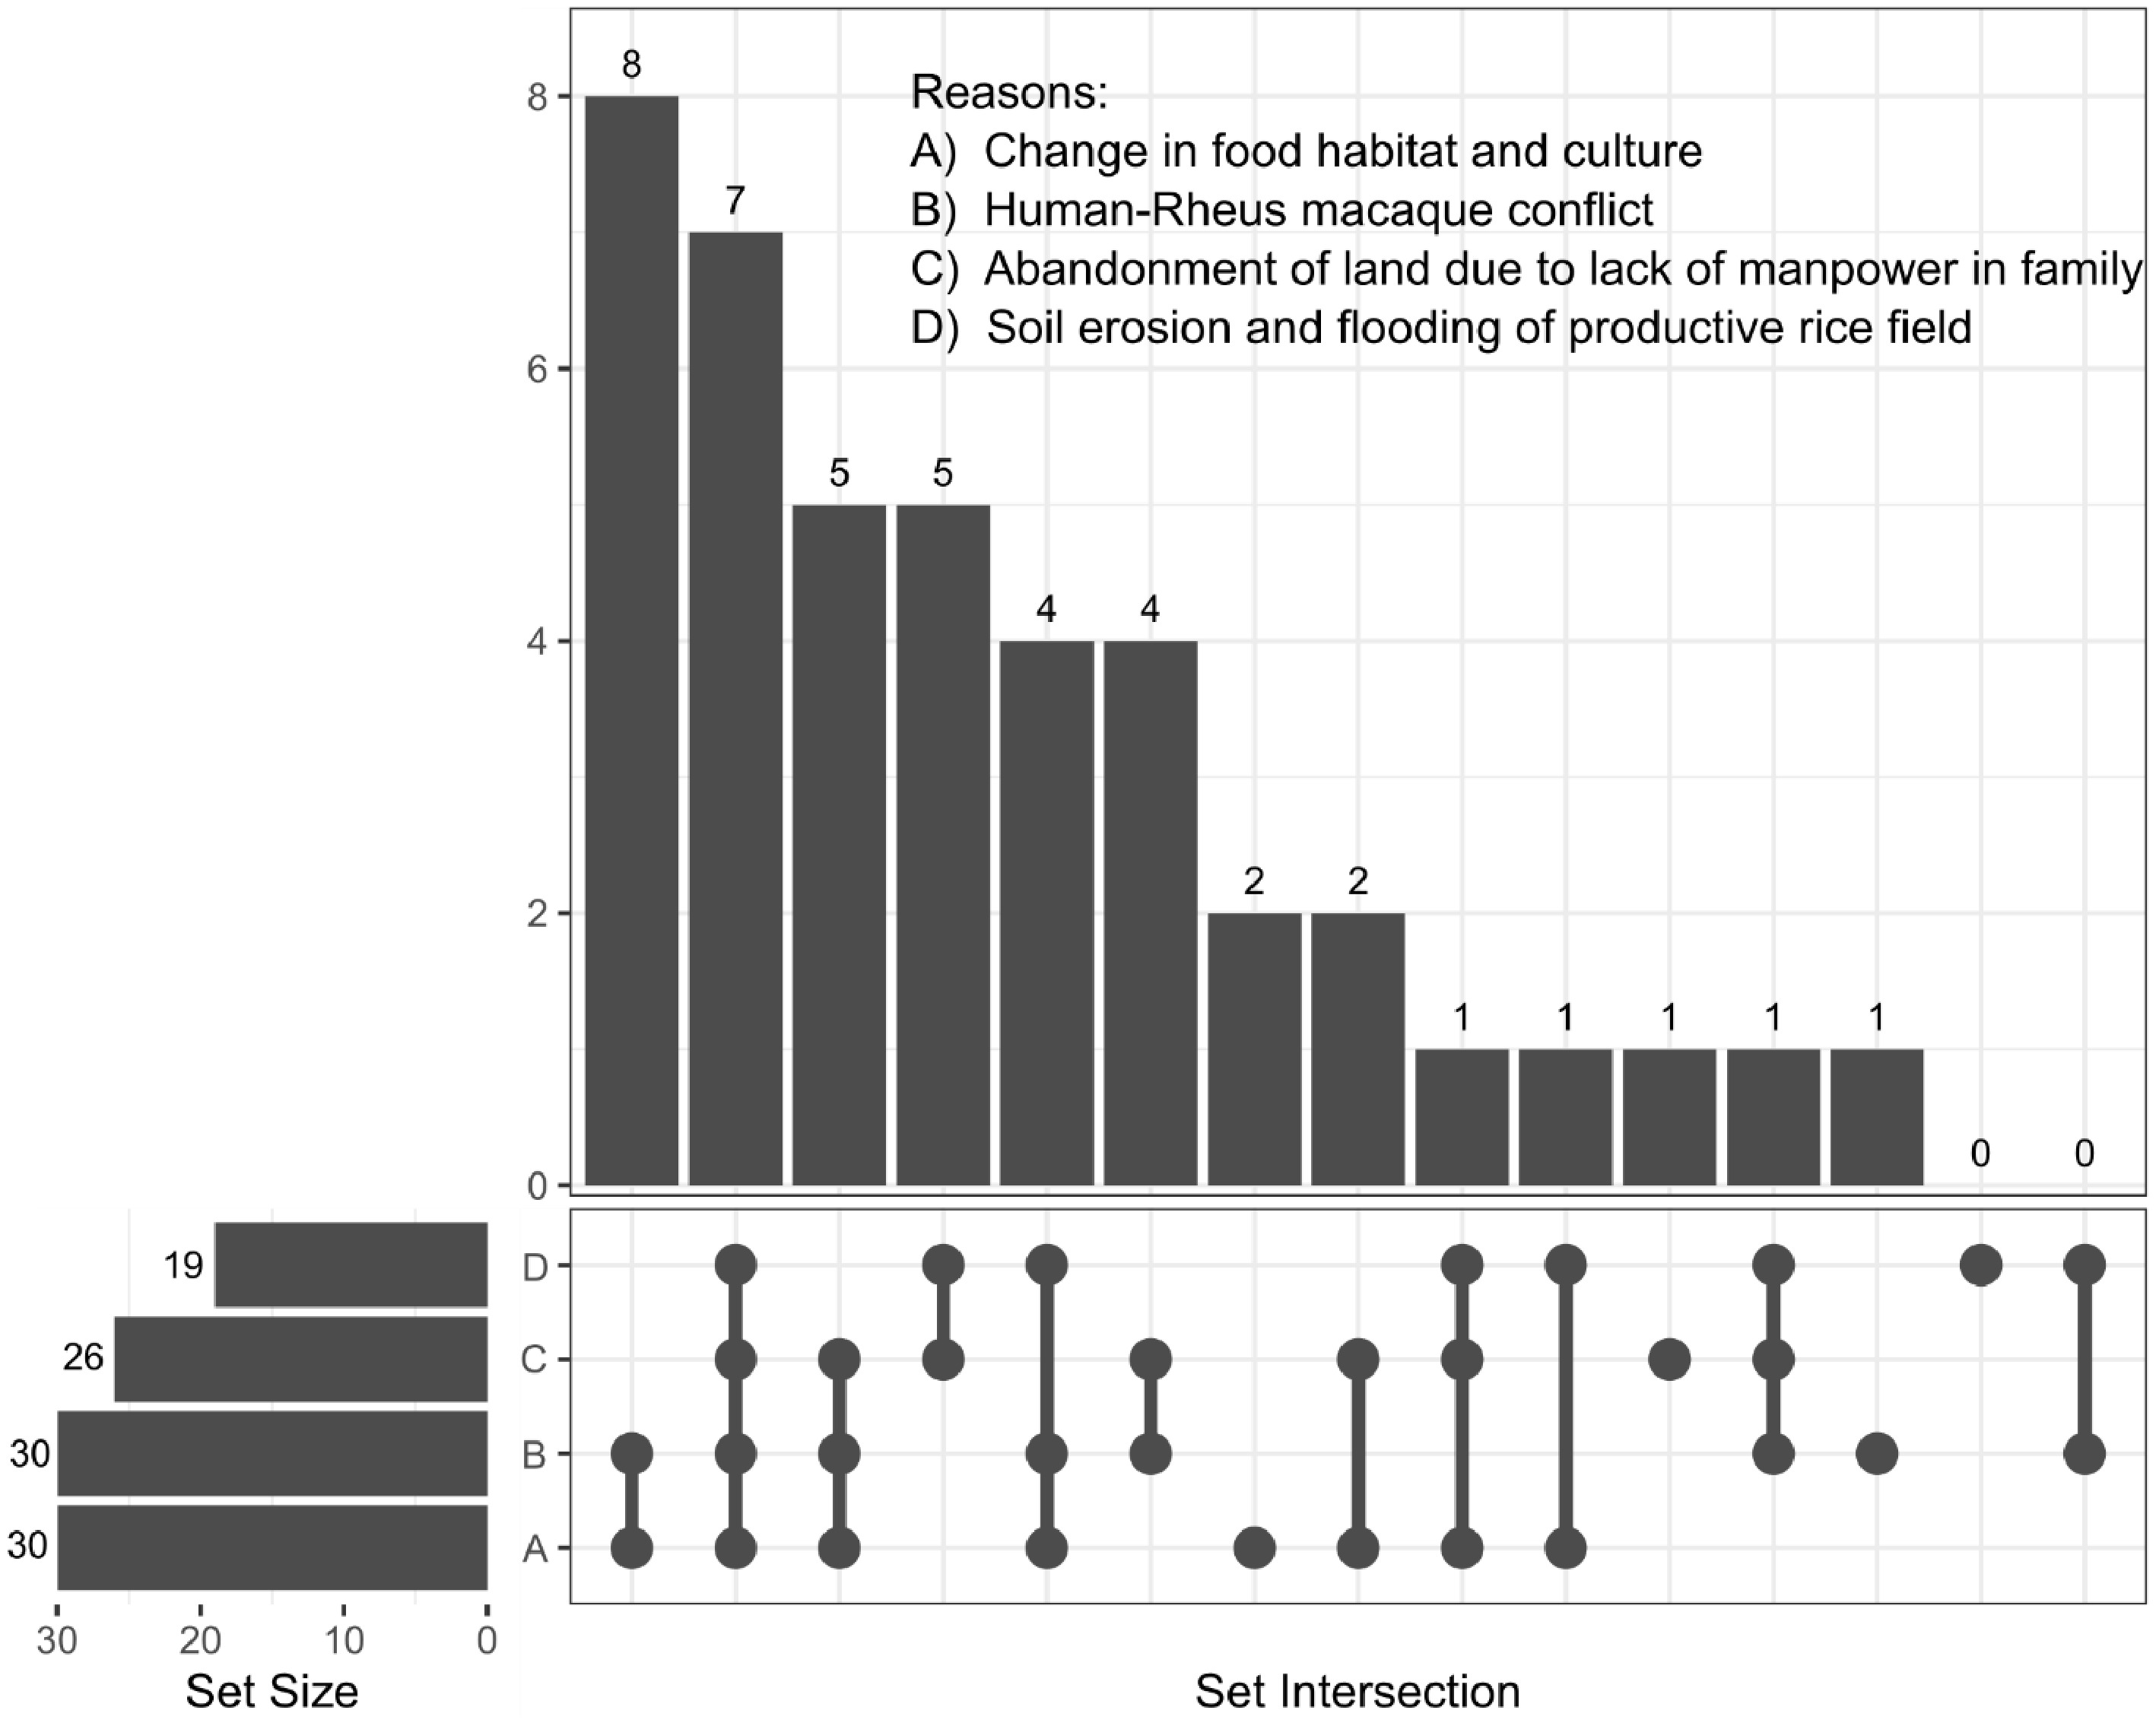
Figure 2.
Upset plot depicting the frequency of farmers citing reasons for rice insufficiency in the study area based on their perceptions. Only rice-growing households were surveyed for this question.
-
Existing variety Varieties no longer cultivated
(extinct from studied locality)Landraces Improved Pahale Bikase-3 Aaga Khole-Jarpani Radha-7 Thimaha Gola Kafal Tade Rbijado Gudura Kode-Gudura Mansara Koili-Dhan Gurdi Marshi Kalo-Anadi Pakhe-Jarpani Table 1.
List of existing varieties and those cultivated in the past but no longer cultivated.
-
Varieties Frequency pi ln(pi) −pi ×
ln(pi)Household
(%)Bikase-3 2 0.02532 −3.6763 0.09307 4.26 Gudura 2 0.02532 −3.6763 0.09307 4.26 Gurdi 2 0.02532 −3.6763 0.09307 4.26 Kafal Tade 2 0.02532 −3.6763 0.09307 4.26 Pakhe Jarpani 2 0.02532 −3.6763 0.09307 4.26 Radha-7 2 0.02532 −3.6763 0.09307 4.26 Kalo Anadi 3 0.03797 −3.2708 0.12421 6.38 Mansara 3 0.03797 −3.2708 0.12421 6.38 Gola 11 0.13924 −1.9716 0.27452 23.4 Khole-Jarpani 15 0.18987 −1.6614 0.31546 31.91 Pahele 35 0.44304 −0.8141 0.36068 74.47 Shannon_winner diversity 1.76 100 Table 2.
Rice variety preference for cultivation in the study area and varietal diversity.
-
Name of variety No. of households Cultivated land area (ha) Total production (tons) Yield (tons/ha)
± SELandraces Gola 11 1.8288 3.2 1.824 ± 0.112 1.827 ± 0.008 Gudura 2 0.2032 0.498 2.454 ± 0.129 Gurdi 2 0.2032 0.525 2.583 ± 0 Kalo-Anadi 3 0.0254 0.0131 0.516 ± 0 Khole-Jarpani 15 2.286 4.41 1.831 ± 0.15 Mansara 3 0.1778 0.236 1.205 ± 0.172 Pahele 35 6.0452 11.76 1.973 ± 0.089 Pakhe-Jarpani 2 0.1016 0.052 0.775 ± 0.258 Improved Bikase-3 2 0.2032 0.525 2.842 ± 0.465 2.440 ± 0.090 Kafal Tade 2 0.2032 0.525 2.583 ± 0.103 Radha-7 2 0.254 0.472 1.894 ± 0.172 Total 47 11.5316 22.2161 1.862 ± 0.150 Table 3.
Rice cultivated land area, production, and yield of different varieties.
-
Df Sum of square Mean square F-value p-value Variety 10 9.12 0.8287 1.052 0.413 Residuals 63 49.62 0.7876 Table 4.
Analysis of Variance (ANOVA) for production among rice varieties.
-
State of rice subsistence No. of households % Fully insufficient (non-farming households) 5 10.64 Partially sufficient Enough for < 6 months 7 14.89 Enough for 6−9 months 13 27.66 Enough for > 9 months 10 21.28 Subtotal: 30 63.83 Sufficient Sufficient of family substance
(whole year)9 19.15 More than enough (selling) 3 6.38 Subtotal 12 25.53 Total 47 Table 5.
State of rice subsistence in the studied households.
-
Total import Total household Total cost Average import per household 47.75 quintal 47 NRs. 343,800 101.6 kg Table 6.
Status of rice import in the study area.
Figures
(2)
Tables
(6)