-
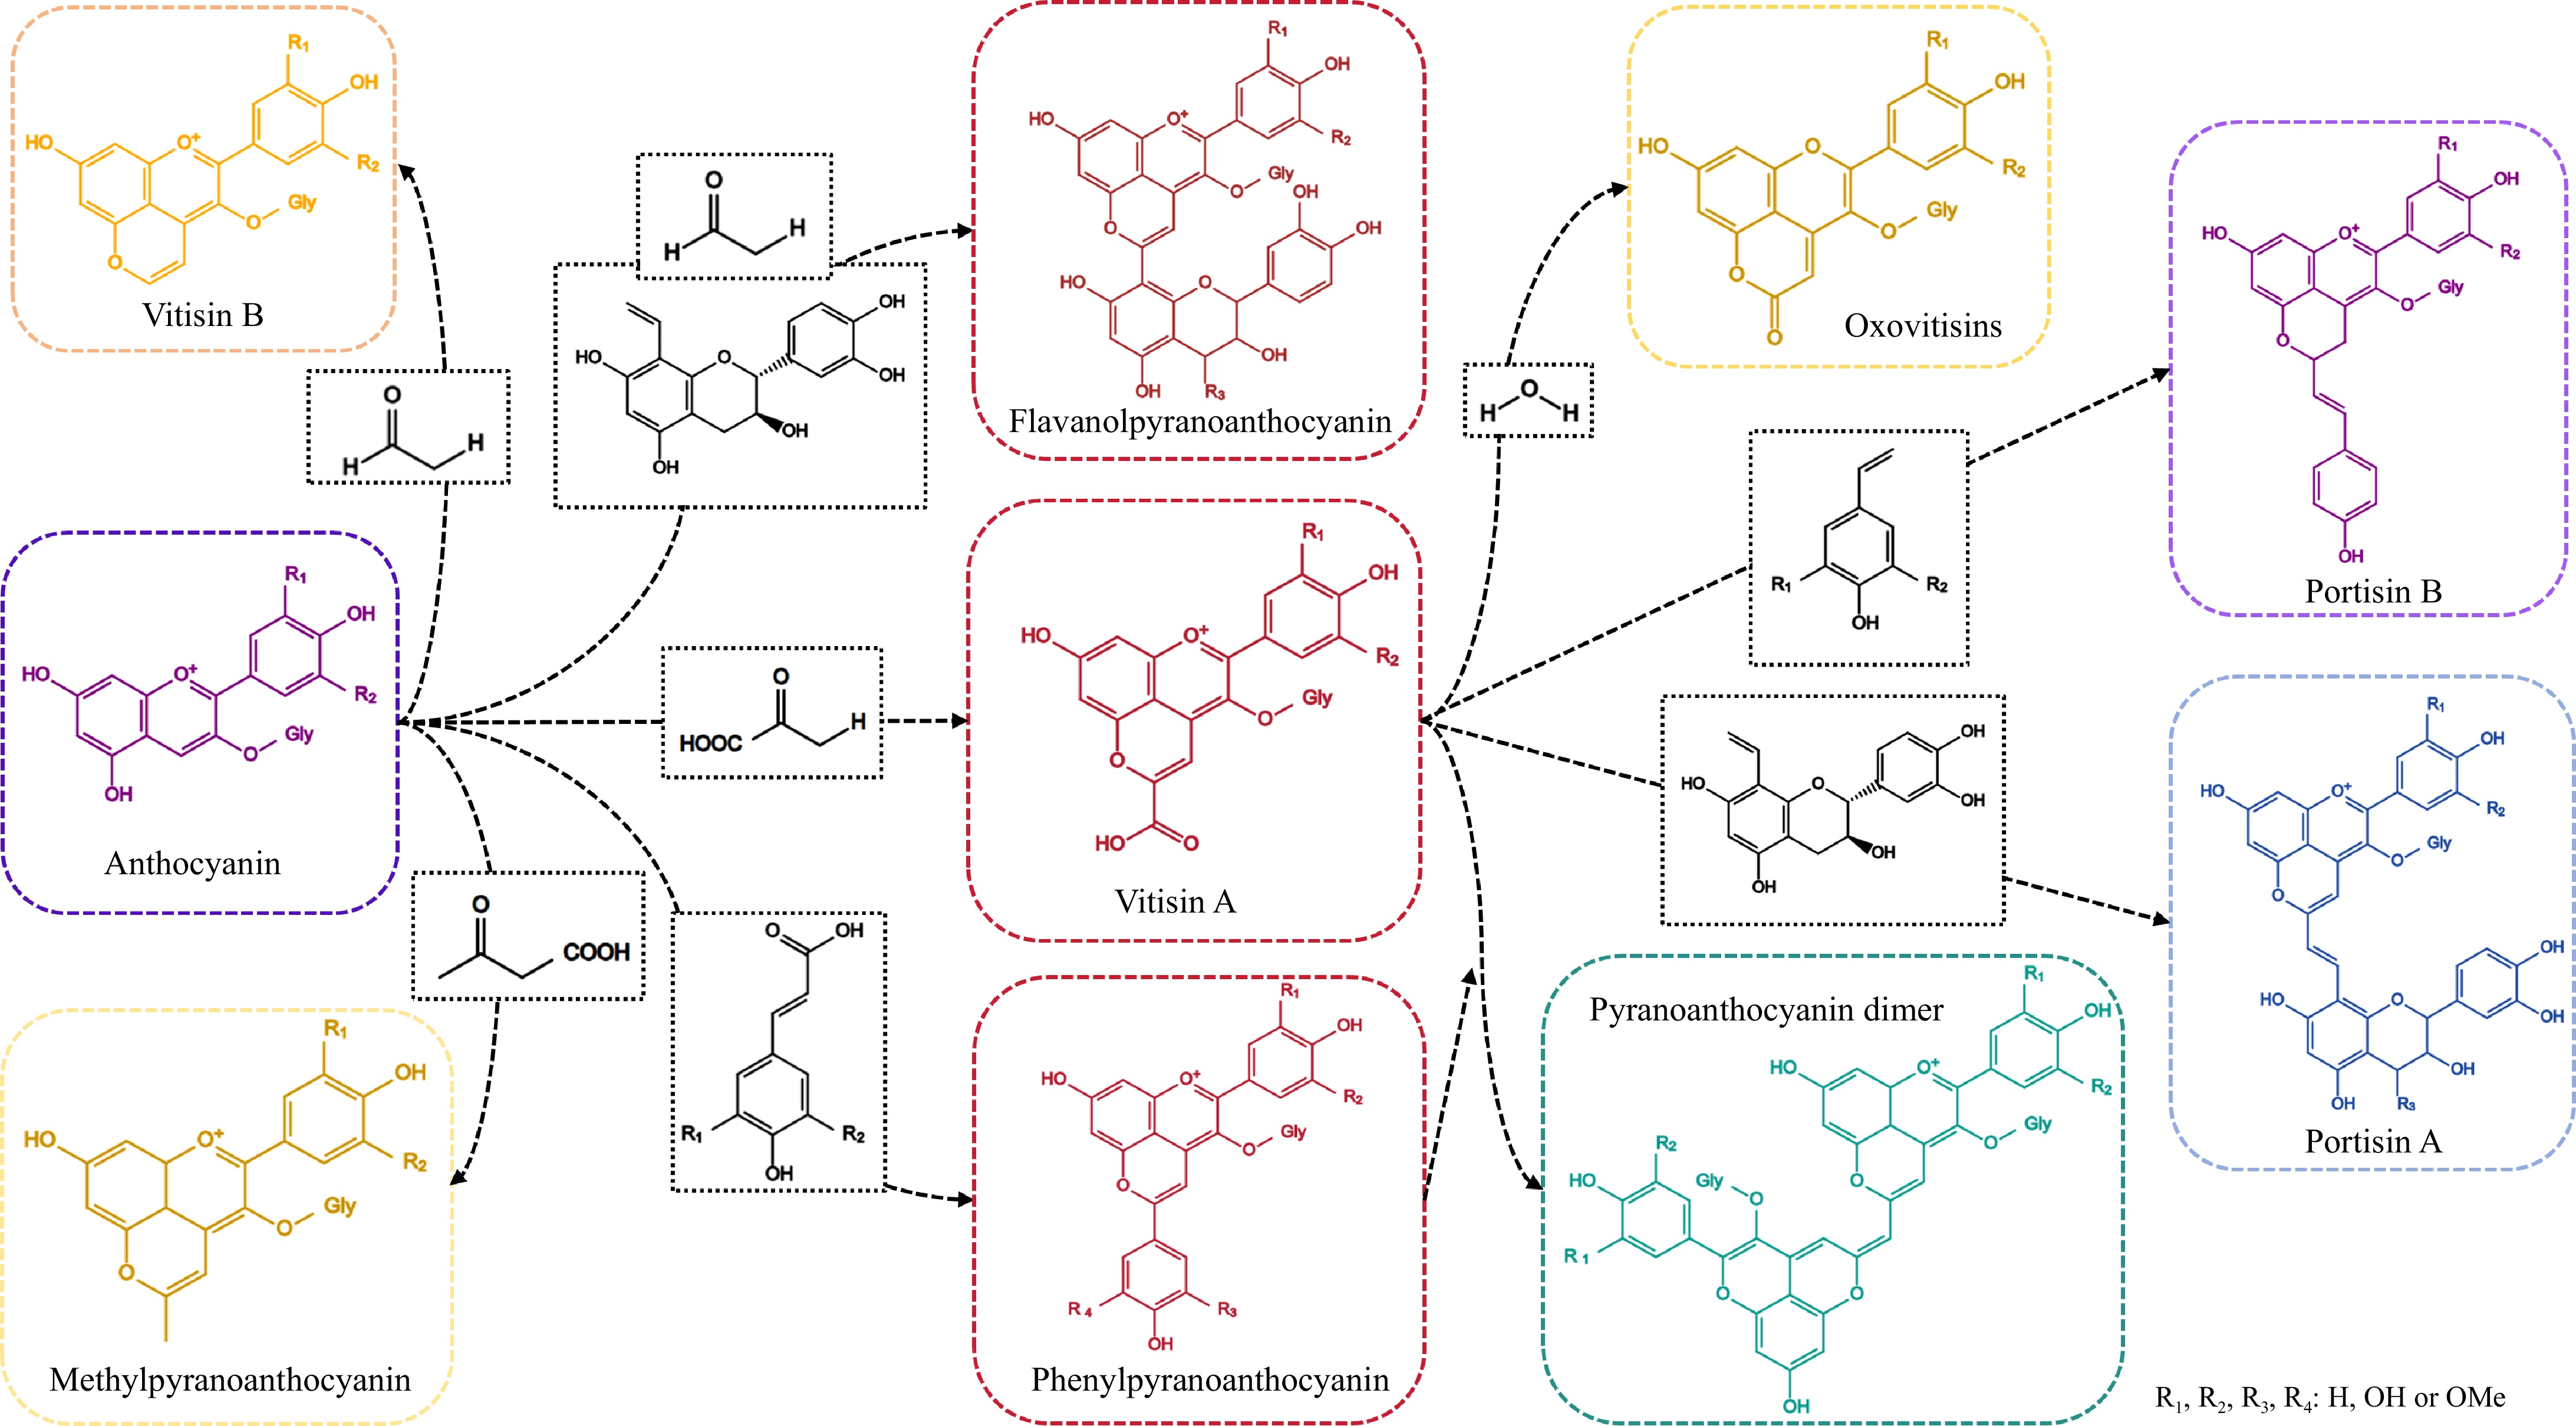
Figure 1.
The structure of pyranoanthocyanins.
-
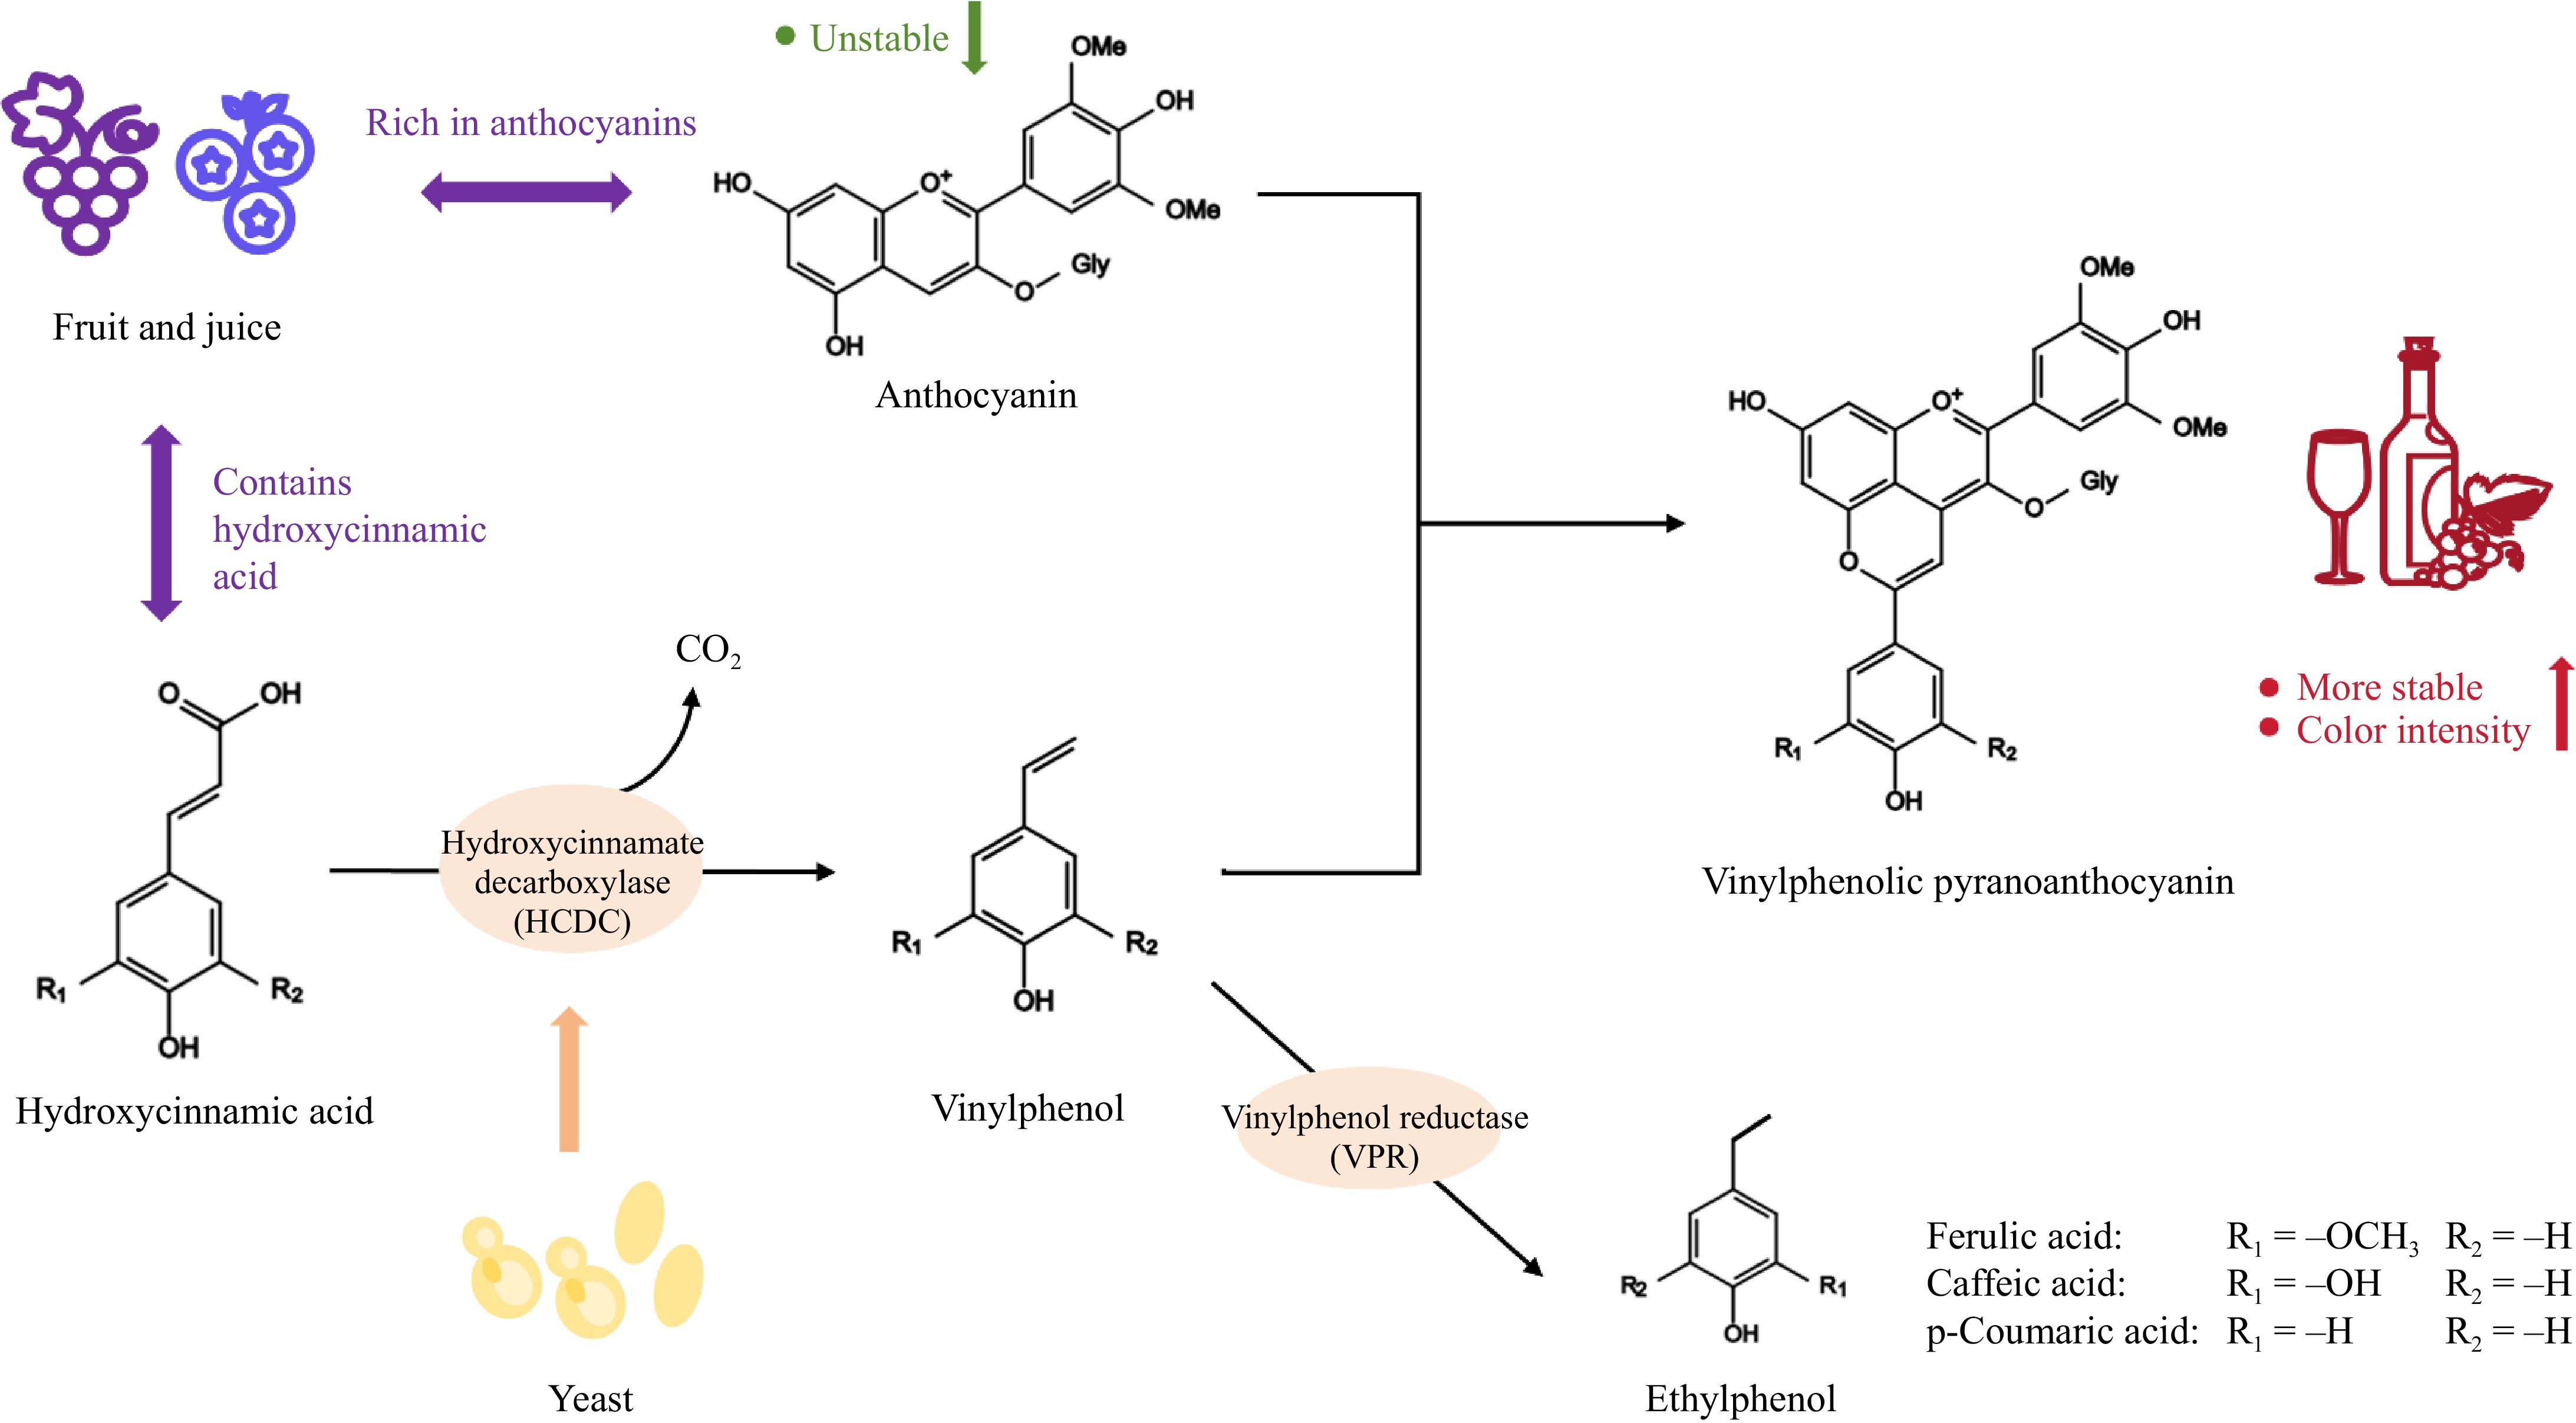
Figure 2.
Schematic diagram of the action mechanism of HCDC.
-
Table 1.
The main VPAs formed by yeast fermentation in wine.
-
Method Characteristic Experimental scheme Ref. Solid medium colorimetric method (1) Detection and analysis of results are quick and easy;
(2) Pre-treatment for the preparation of enzyme extracts is more complicated;
(3) Color variations may be influenced by a range of factors, such as temperature, pH levels, and the specific composition of the medium.LB agar plates were prepared containing 0.01% (w/v) bromocresol violet and supplemented with 0.145% (w/v) of ferulic, p-coumaric, or caffeic acids, with the pH adjusted to 5.25 using 5% isopropanol. Subsequently, 10 μL aliquots of cellular extracts, which were prepared in a 50 mM phosphate buffer (pH = 6.0), were incubated for 1−2 h at 37−45 °C, and the color change from yellow to purple indicated the presence of HCDC activity. [59] Cellular extracts cultured for 24 h in a 10 mM phosphate buffer (pH = 7.0) were aliquoted (10 μL) and subsequently spread onto YPD plates containing 0.01% (w/v) bromocresol violet, 0.145% (w/v) ferulic acid, or p-coumaric acid. The plates were then incubated at 37 °C for a duration of 1−2 h. [16,62] Yeast was inoculated at the center of YPD plates that contained 0.01% (w/v) bromocresol violet and were supplemented with 0.145% (w/v) p-coumaric acid. The plates were subsequently incubated for 24 h at 37 °C. [50] A 5 mM solution of ferulic acid, supplemented with 0.1% (w/v) bromocresol violet, was utilized for the experiment. Yeast pre-cultures were introduced to the solution, and samples were collected at intervals of 0, 5, 10, 20, 40, and 60 min. The enzymatic activity was assessed by observing the color change from yellow (pH = 5.2) to purple (pH = 6.8). [60] HPLC analytical method (1) Accurately determining and comparing enzyme activity sizes;
(2) Suitable for large-scale sieving of bacteria;
(3) Better control of the consistency of bacterial inoculum;
(4) Saving reagents;
(5) Higher costs.1 mL of yeast (108 cfu/mL) was inoculated in 10 mL of YEPD medium containing 115 mg/L p-coumaric acid in test tubes. Following a fermentation period of 10 d, the supernatant was filtered through a 0.45 μm filter and then analyzed by HPLC. [15,48] Yeast (108 cfu/mL) was inoculated with 1 mL of yeast (108 cfu/mL) in 10 mL of YEPD medium supplemented with 50 mg/L p-coumaric acid. Following a fermentation period of 10 d at 25 °C, the supernatant was filtered through a 0.45 μm filter and then analyzed by HPLC. [63] A sterile medium was prepared consisting of 0.67% (w/v) commercial yeast nitrogen base (YNB), 2% (w/v) glucose, and 100 mg/L p-coumaric acid. A total of 1.35 mL of this medium was dispensed into deep-well microtiter plates and inoculated with 150 μL of yeast pre-culture (OD600 = 1). After a 10-d incubation period, the samples were centrifuged at 5000 rpm for 10 min to obtain the supernatant, which was analyzed by HPLC. [10,64] YPD liquid screening medium utilized in this study comprised 1% yeast extract, 2% peptone, and 2% glucose, supplemented with 0.145% p-coumaric acid, ferulic acid, and caffeic acid, respectively. Yeast precultures were inoculated into the screening medium at a concentration of 1% and incubated at 30 °C with shaking at 200 rpm for 72 h. Following incubation, the cultures were centrifuged at 5,000 rpm and 4 °C for 5 min. The resulting supernatant was filtered through a 0.22 μm filter and then analyzed by HPLC. [65] The YPD liquid medium was prepared with 0.01% (w/v) bromocresol violet and supplemented with 0.145% (w/v) of caffeic acid, p-coumaric acid, and ferulic acid. Subsequently, 0.1% (v/v) of yeast was inoculated into the YPD medium and incubated for 72 h at 30 °C, 200 rpm before centrifugation at 5,000 g for 5 min and the supernatant was filtered through a 0.45 μm filter, followed by HPLC for analysis. [50] Ultraviolet–visible spectrophotometry (1) More complex to handle, but require time-consuming sample processing or purification;
(2) Only the amount of phenolic acid consumption can be measured, not the amount of vinylphenol produced;
(3) It is used more in lactic acid bacteria to determine enzyme activity and less in yeast.The assay mixture consisted of 25 mM phosphate buffer (whole cell pH = 5.0, protein extract
pH = 6.0) and 1.2 mM substrate (different phenolic acids). The samples were incubated at 30 °C, diluted 20-fold with 25 mM Tris buffer containing 0.3% SDS to block activity and absorbance was measured using the supernatant.[42] Bacteria were grown in MRS broth for 18−24 h at OD = 1.0. Cells were harvested by centrifugation and resuspended in 70 mM sodium phosphate buffer (pH = 6.0) containing 100 μg/mL of ferulic acid or p-coumaric acid to an OD = 1.0. The cells were incubated for 8 h at 30 °C, with centrifugation performed hourly. The supernatant was maintained on ice until further analysis. The concentration of p-coumaric acid was derived by measuring the absorbance at 286 nm, while the concentration of ferulic acid was derived by measuring absorbance at 284 and 312 nm. [45] Determination of the enzymatic activity of cell-free extracts: The standard condition was an assay mixture containing 1.2 mM p-coumaric acid and 100 μL of cell extract (final volume of 1.5 mL sodium phosphate buffer, pH = 6.0). After adding the cell-free extract and incubating at 37 °C for 26 h, 20 μL of the sample was diluted 20-fold in 380 μL of termination buffer (25 mM Tris buffer containing 0.3% sodium dodecyl sulfate) to terminate the enzyme activity, and the concentration of p-coumaric acid was derived by measuring the absorbance at 286 nm. [66] Determination of the enzymatic activity of resting cell suspensions: standard conditions were assay mixtures containing 1.2 mM p-coumaric acid and 109 cfu/mL (final volume of 1.5 mL McIlvaine buffer, ph = 4.0). After adding washed cells and incubating for 22 h at 30 °C, 40 μL of the sample was diluted 20-fold in 760 μL of termination buffer and centrifuged at 12,000 g for
2 min, and the absorbance was determined using the supernatant.CDM medium was used: 0.1% K2HPO4, 0.1% KHPO4, 0.5% yeast extract, 0.025% MgSO4, 0.0005% NaCl, 500 mg/L p-coumaric acid, and 0.5% glucose. Bacteria were incubated in MRS broth overnight (32 °C), centrifuged at 8000 g for 10 min at 4 °C, cultures were collected and washed twice with sterile saline (0.085% NaCl, pH = 7.0) and reconstituted, and inoculated with CDM in 96-well plates and incubated at 32 °C for 36 h. The 96-well plates were centrifuged at 4,000 g for 30 min at room temperature and the supernatants were collected immediately and frozen. The supernatant was immediately collected and frozen, and the absorbance was measured after dilution with buffer solution. [38] Table 2.
Methods of HCDC activity assessment.
-
Yeast species Strains code HCDC activity (%) Ref. S. cerevisiae CL1 49.66 ± 0.91 [61] CL7 17.81 ± 2.29 CL34 14.49 ± 1.11 I34 69.20 ± 2.07 I42 69.99 ± 1.97 I43 78.49 ± 0.14 I56 66.41 ± 11.62 B42 63.35 ± 0.50 B43 63.70 ± 0.56 C9 13.46 ± 1.17 H50 44.32 ± 1.62 H44 4.80 ± 1.29 H63 10.15 ± 1.65 H66 4.58 ± 2.83 F30 75.81 ± 0.50 LH21 9.49 ± 1.08 D35 18.17 ± 1.14 D37 11.95 ± 0.25 D41 14.48 ± 0.70 E35 12.80 ± 0.35 E37 11.74 ± 0.68 FS10 13.58 ± 0.48 FS14 13.09 ± 0.36 YTH41 33.23 ± 0.02 A1 4.29 ± 1.49 A2 14.53 ± 0.10 A4 15.19 ± 1.17 7VA 69.9 [63] 4CV 62.3 TP2A16 81.3 VR5 73.3 AWRI 1503 99.8 71B 65.8 EC1118 97.2 M29 67.9 ZIM2180 66 [64] FPC 5.1 I. terricola FS27 2.62 ± 1.92 [61] FS5 4.96 ± 3.01 H5 5.80 ± 1.21 W. anomalus D6 78.71 ± 0.05 S138 91.1 [64] Y5 14.32 [50] M. pulcherrima B18 18.19 ± 2.11 [61] B19 18.20 ± 5.44 B20 15.67 ± 2.83 B40 34.88 ± 0.01 E28 8.88 ± 0.58 C14 14.32 ± 0.05 Y1 3.52 [50] Y2 3.35 Y3 2.56 Y4 6.46 MC1 − [16] MC4 − MC6 − M. reukaufii Sut85 86 [64] Z. bailii I20 6.64 ± 0.51 [61] I29 7.98 ± 0.57 D. hansenii Sut116RT 41.3 [64] P. manshurica M49 66.9 P. guilliermondii ZIM624 88.6 C. fabianii Y6 3.13 [50] Y7 2.75 Y8 4.07 Y9 2.85 T. delbrueckii Y10 8.41 The demonstration of HCDC activity (%) through the utilization of p-coumaric acid indicates that a value of "−" signifies the absence of a specific activity value reported in the literature. Table 3.
Comparison of HCDC activities in different yeast.
Figures
(2)
Tables
(3)