-
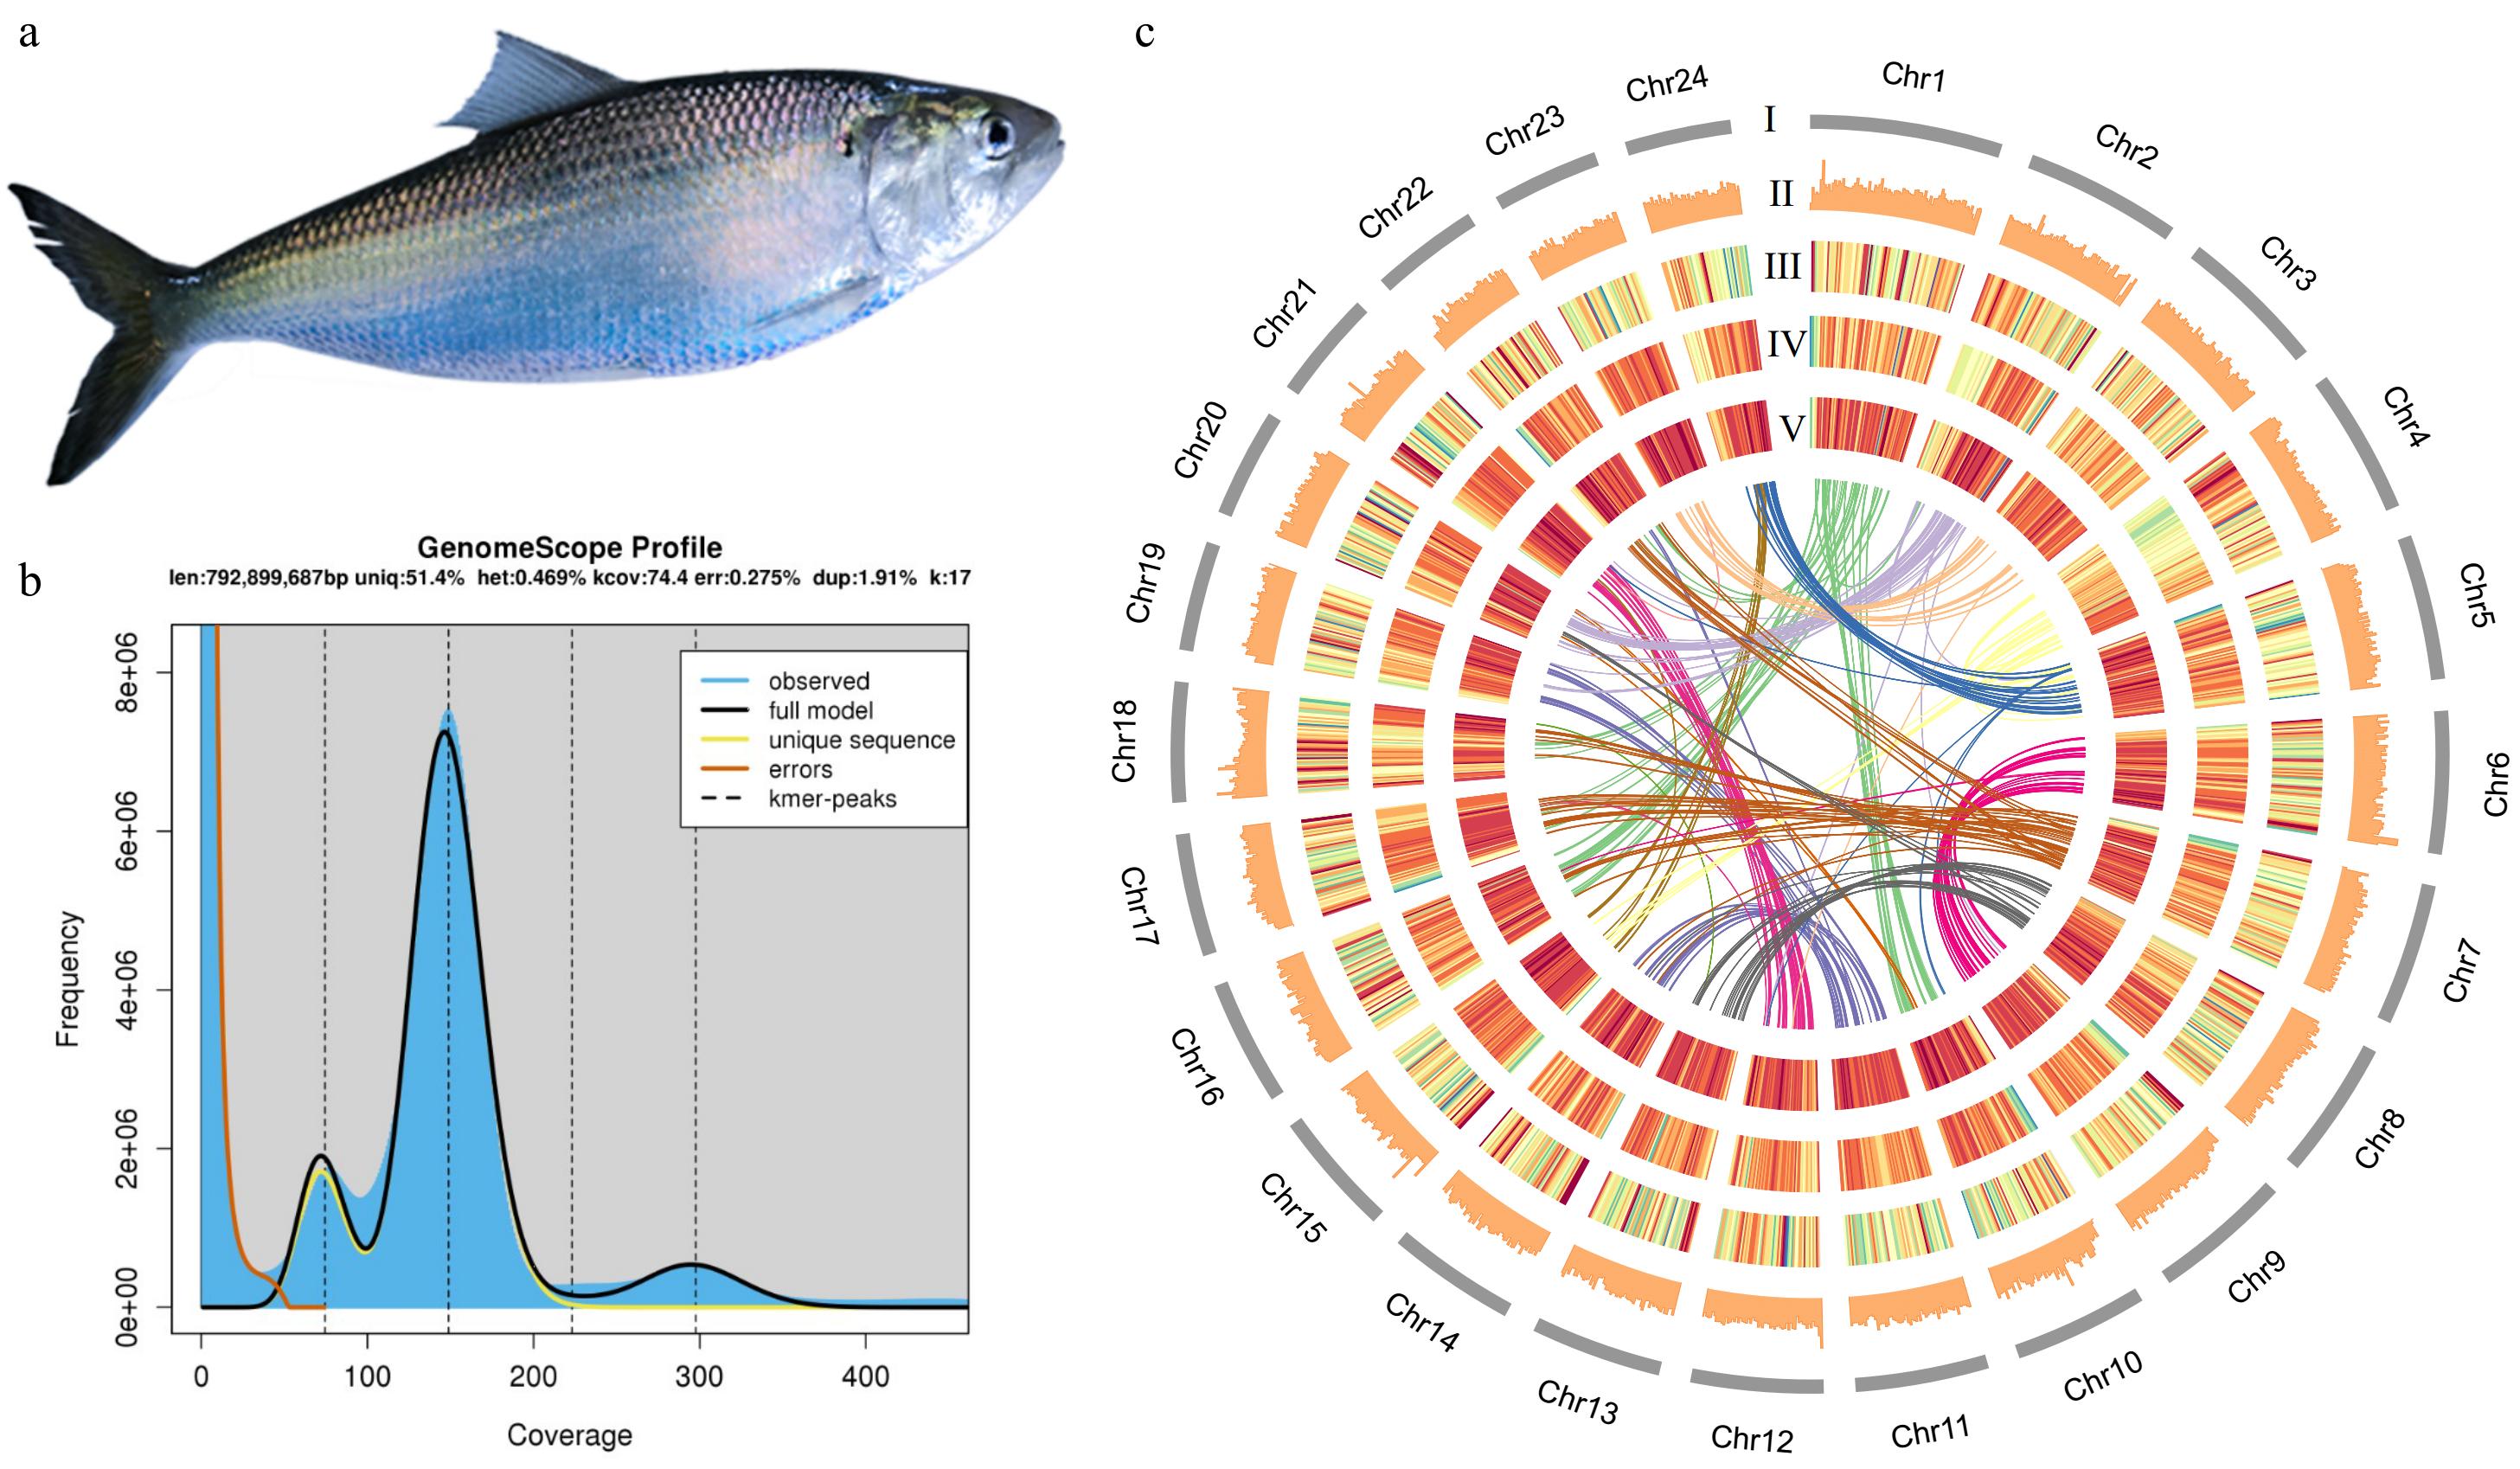
Figure 1.
(a) American shad. (b) Genome scope profile for size prediction. (c) Circos plot features for each chromosome. len: inferred total genome length; uniq: percent of the genome that is unique (not repetitive); het: overall rate of heterozygosity; kcov: mean kmer coverage for heterozygous bases. Note the top of the peak will not intersect the kcov line because of the over dispersion in real data; dup: average rate of read duplications; err: error rate of the reads. (I) Karyotype. (II) GC content. (III) Gene intensity. (IV) The intensity of transposable elements. (V) The intensity of long tandem repeats. The innermost ribbon plot shows the collinearity between chromosomes. The warmer colour indicates higher intensity.
-
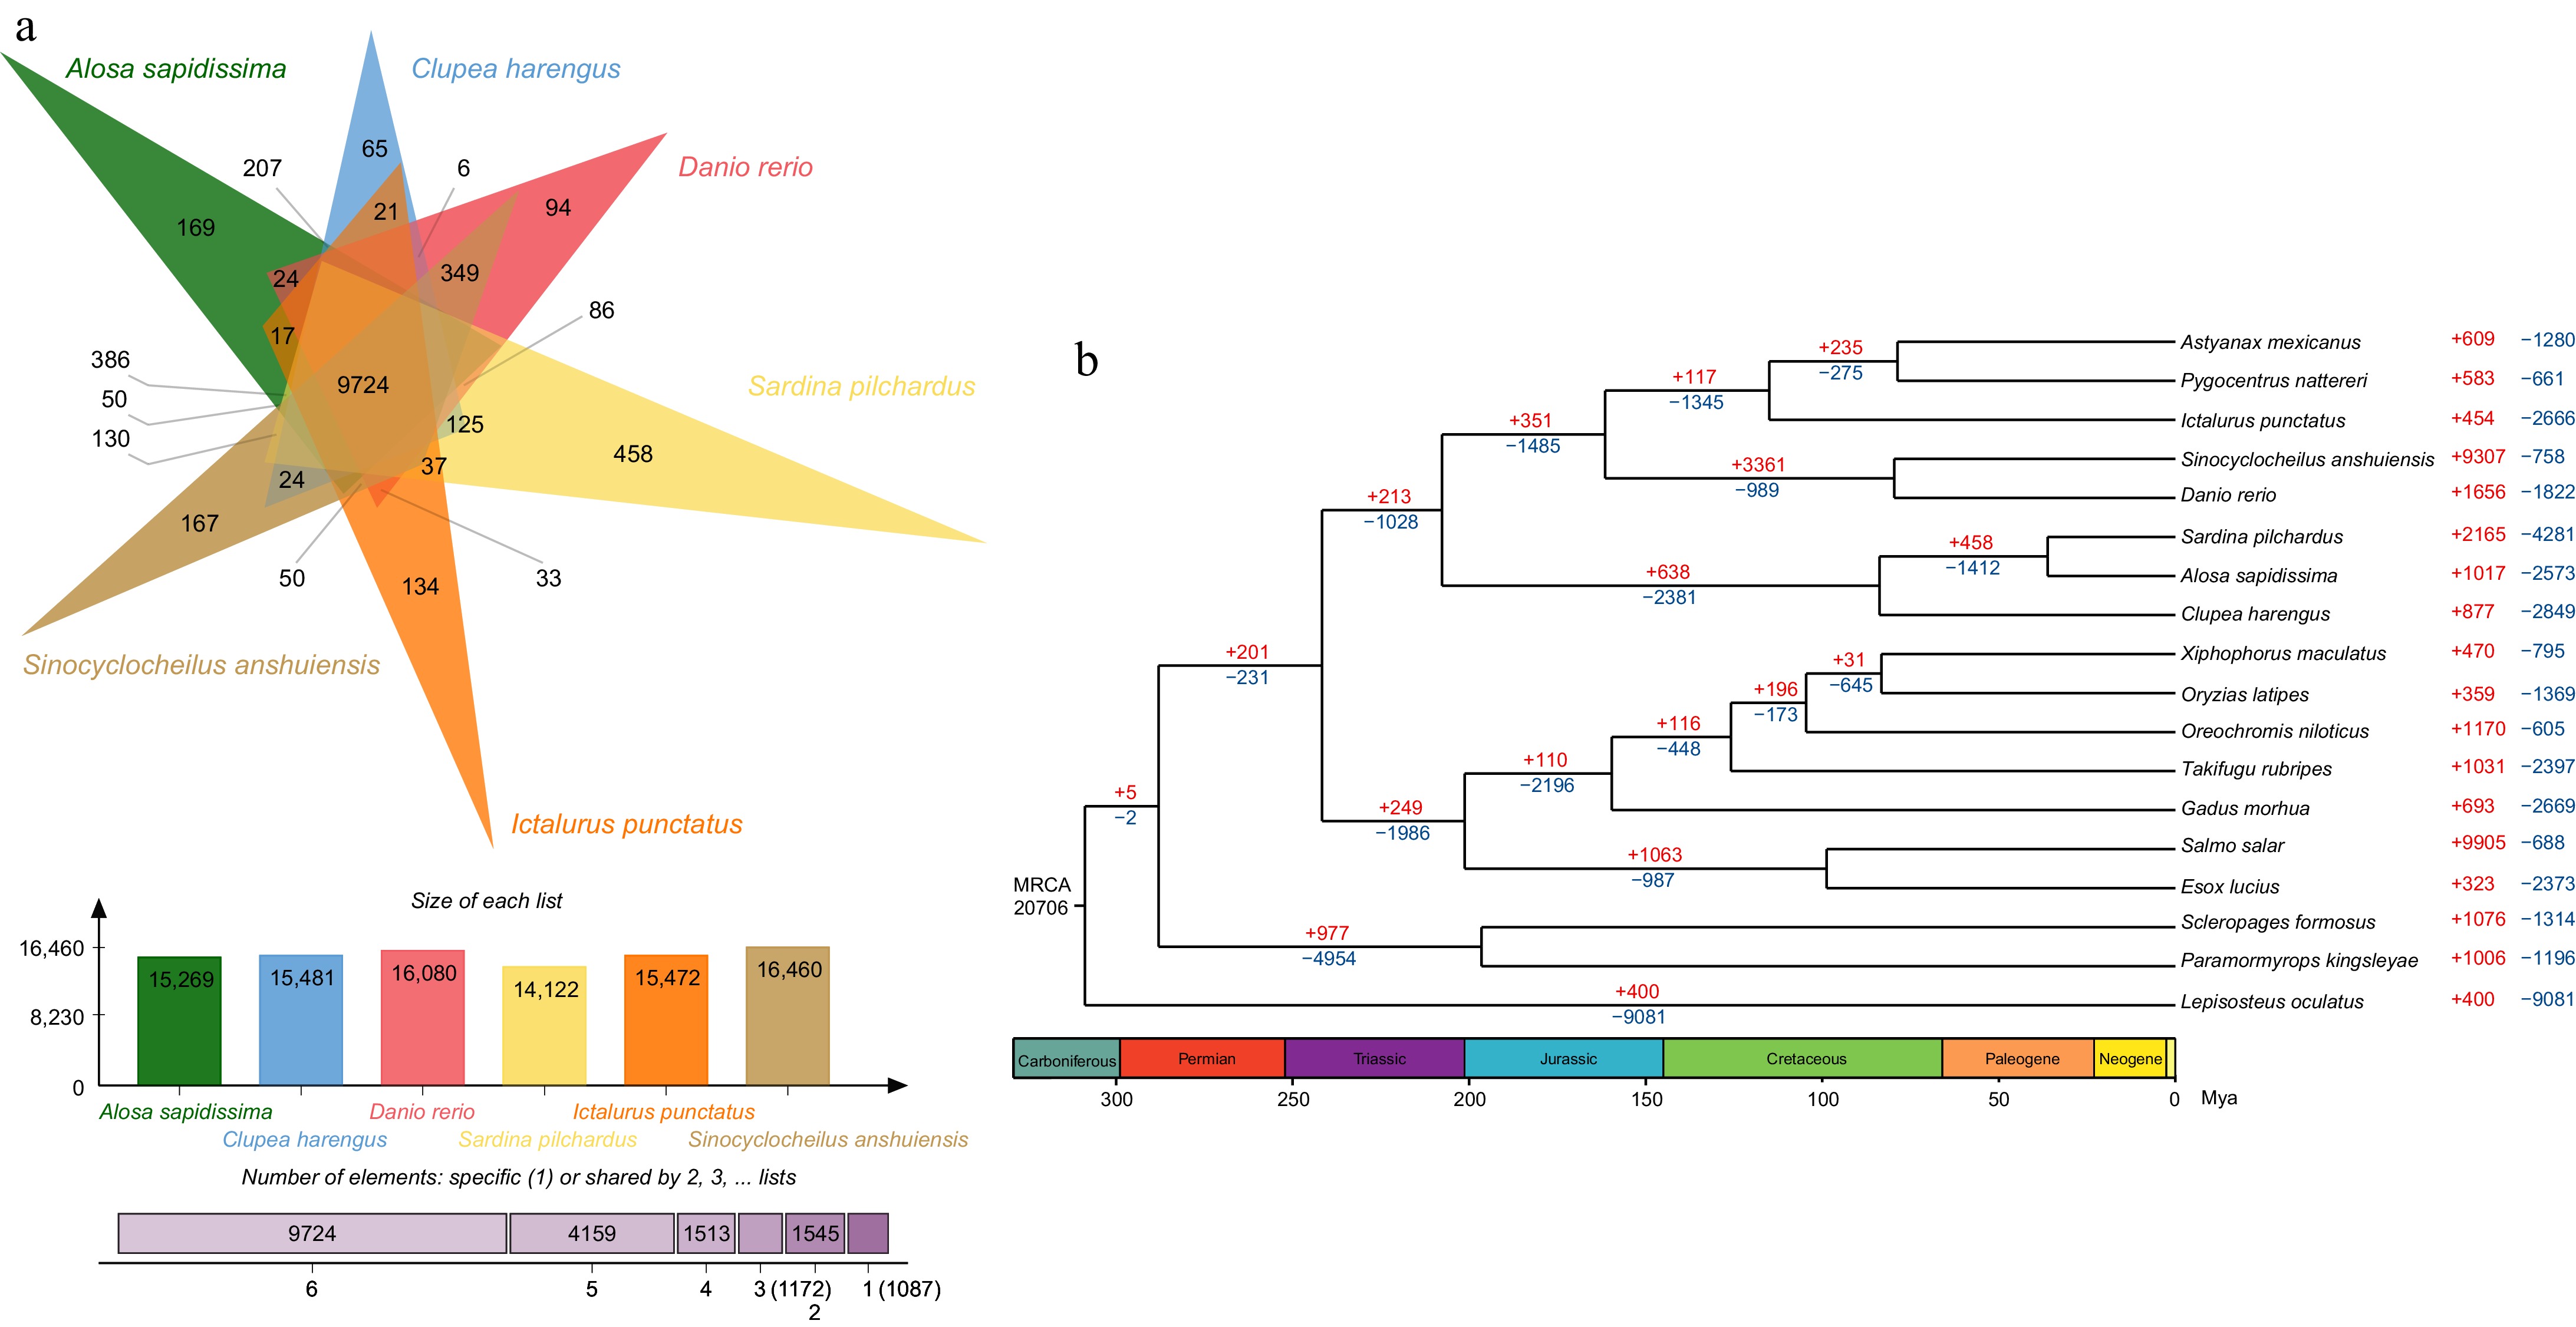
Figure 2.
Phylogenetic tree, gene family expansion and contraction analysis and venn diagram for common and unique genes in American shad genome. (a) Top: the diagram shows the number of common and unique gene families of six species; Middle: the number of gene families of six species; and Bottom: the number of gene families shared by the six species. (b) Phylogenetic analyses indicated by a time divergent tree and gene family expansion and contraction analysis (red numbers = expansion; blue numbers = contraction; black numbers = the estimated divergence time).
-
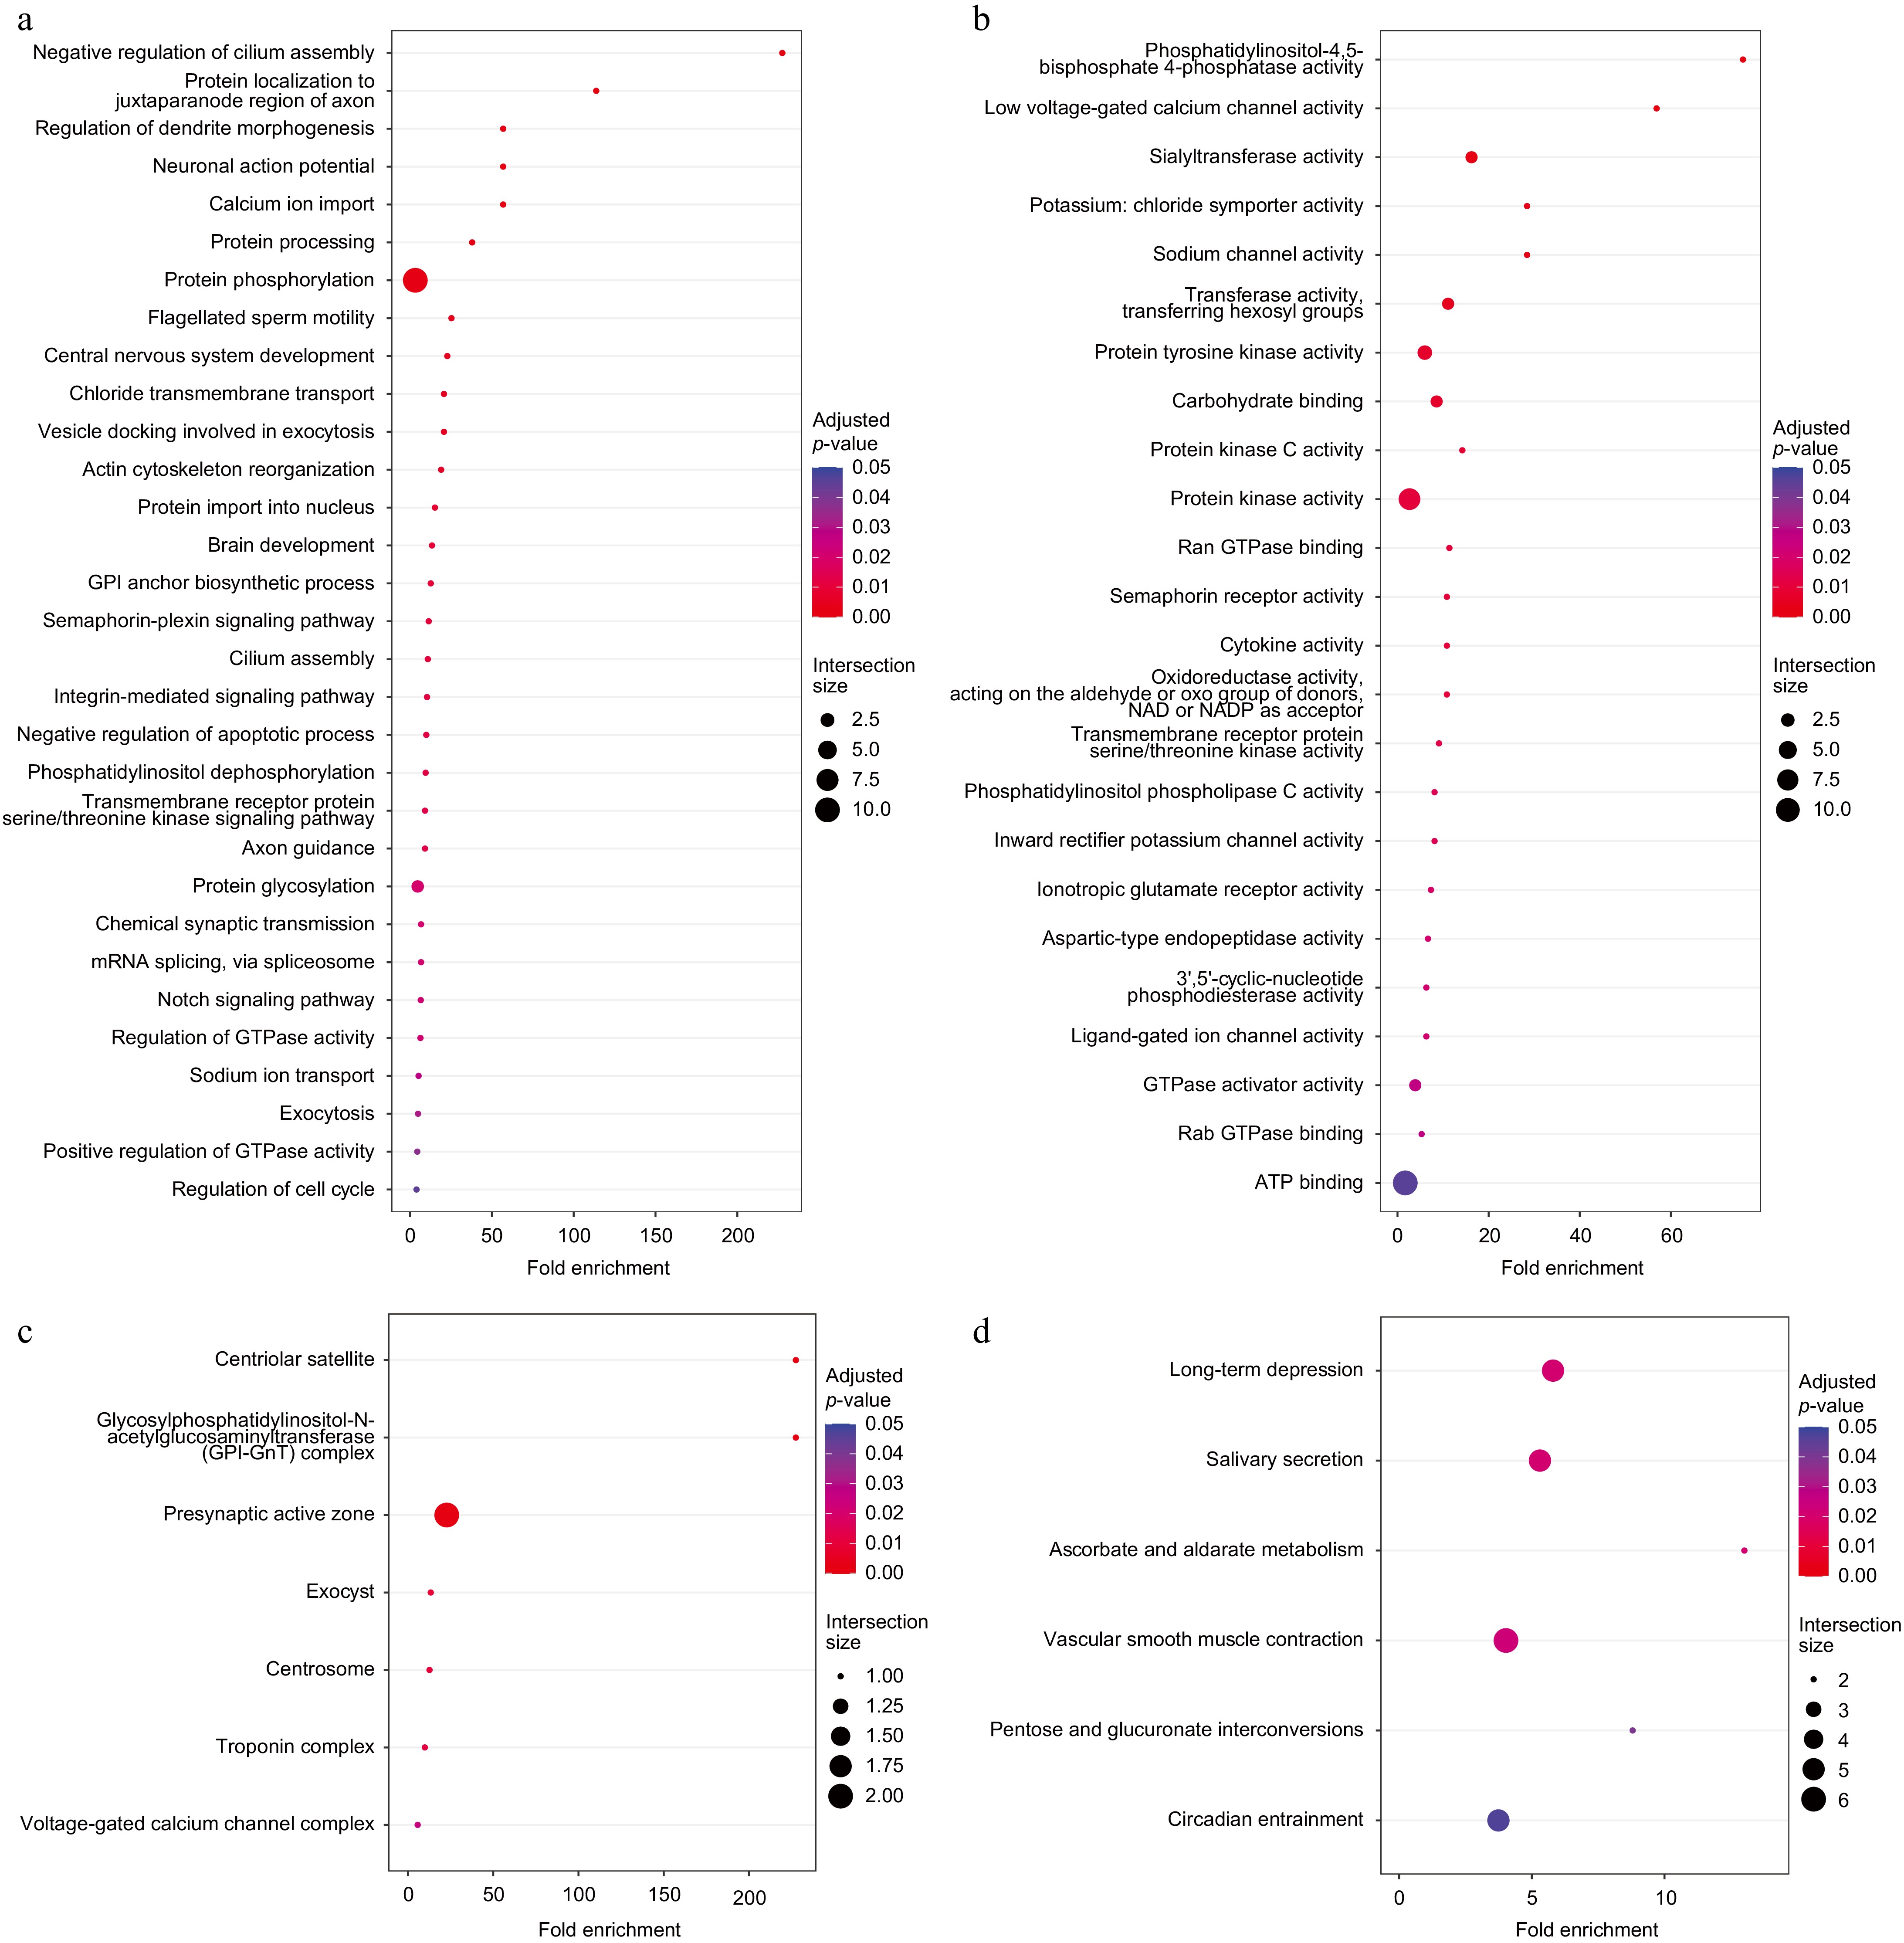
Figure 3.
Functional enrichment analysis of 169 specific gene families. (a) Enriched GO BP terms. (b) Enriched GO MF terms. (c) Enriched GO CC terms. (d) Enriched KEGG pathways.
-
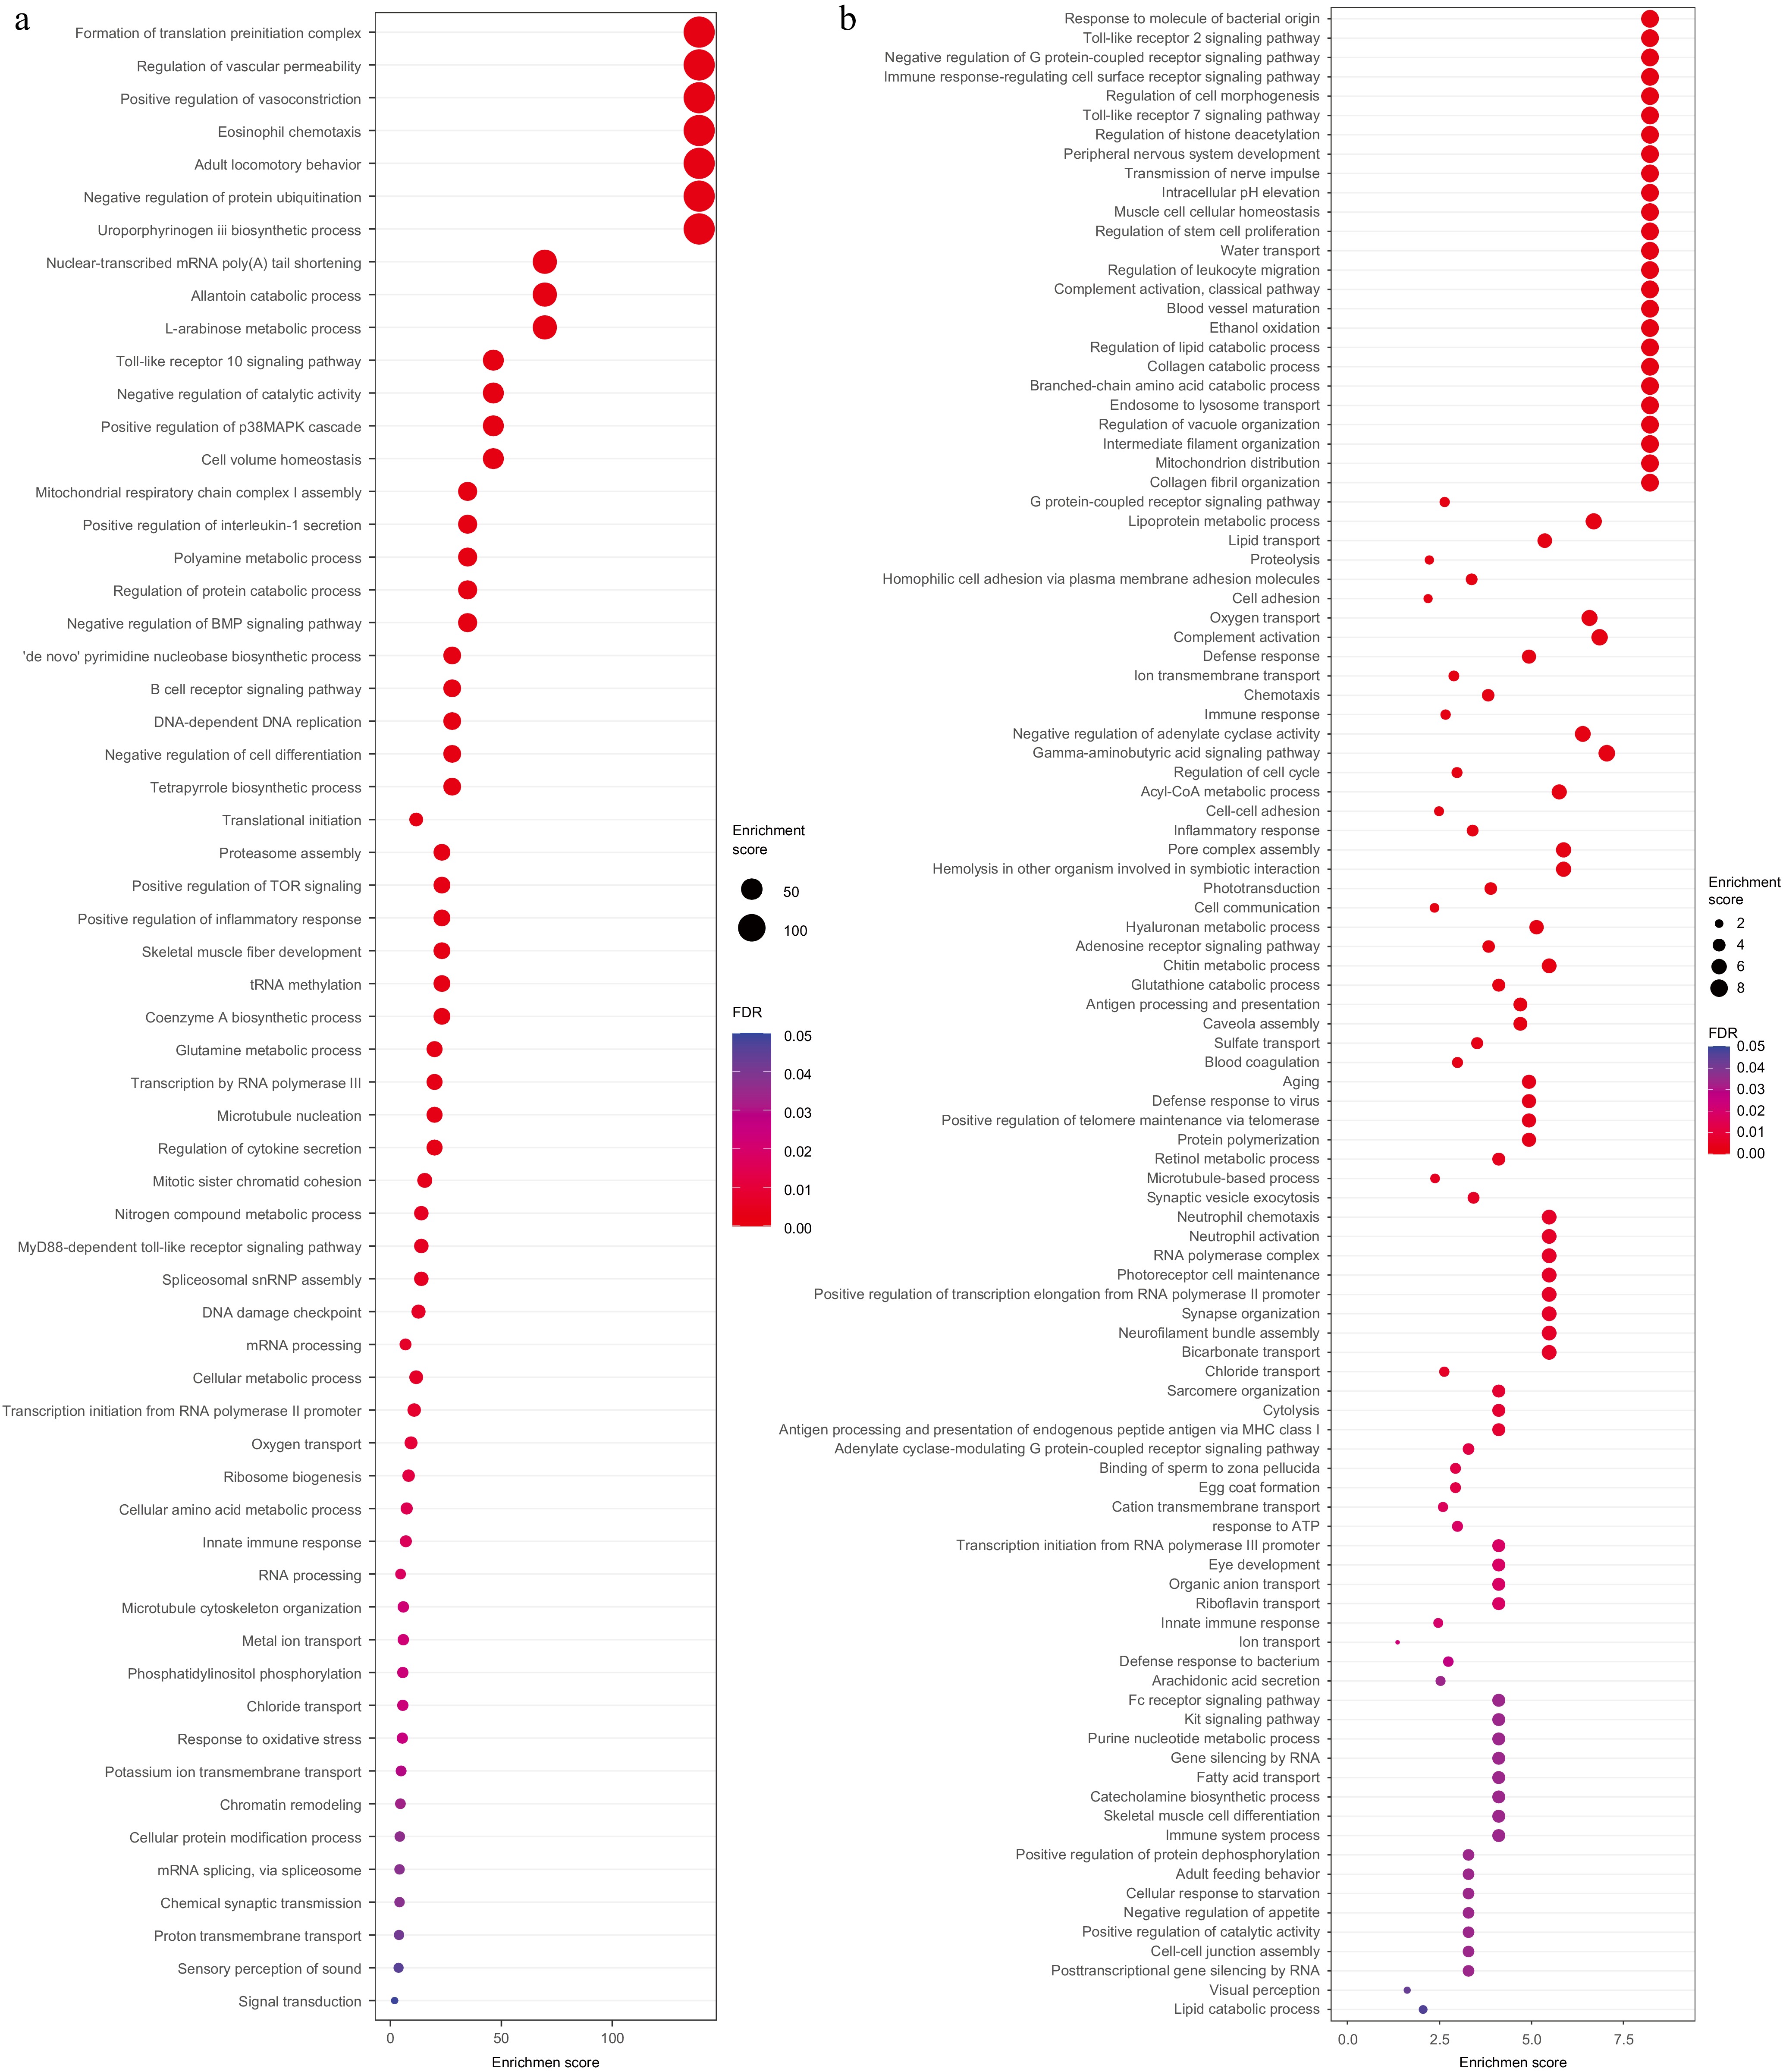
Figure 4.
GO enrichment analysis for positive selected genes and tandem duplicated genes GO enrichment analysis for (a) positive selected genes, and (b) tandem duplicated genes.
-
Item Assembly statistics Total length (bp) 920,245,501 Number of contigs 2,302 Number of scaffolds 274 Contig N50 (bp) 1,152,427 Scaffold N50 (bp) 37,994,265 Maximum contig length (bp) 7,309,698 GC content (%) 43.19 Completely retrieved single-copy orthologs (%) 93.8 Complete and single-copy BUSCOs (%) 89.60 Complete and duplicated BUSCOs (%) 4.20 Partially retrieved single-copy orthologs (%) 2.5 Table 1.
Statistics of the American shad genome assembly.
-
Class Count Length (bp) Percentage DIRS 710 242765 0.03% DNA − − − DTA 508,133 116,314,889 12.64% DTC 225,315 31,080,936 3.38% DTH 26,565 5,057,458 0.55% DTM 138,994 22,287,764 2.42% DTT 7,397 1,097,116 0.12% Helitron 79,770 11,666,059 1.26% LINE 3,013 1,943,108 0.21% LTR − − − Copia 2,494 714,658 0.08% Gypsy 159,707 50,775,360 5.52% Unknown 302,822 65,763,801 7.15% MITE − − − DTA 46,637 5,802,613 0.63% DTC 5,594 551,629 0.06% DTH 4,346 371,579 0.04% DTM 92,139 14,049,594 1.53% DTT 418 31,172 0.00% Maverick 77 99,461 0.01% Penelope 830 867,362 0.09% TIR − − − Tc1-Mariner 470 99,441 0.01% Unknown 123,728 26,970,622 2.93% Total interspersed 1,729,159 355,787,387 38.66% Low complexity 74,138 6,172,731 0.67% Simple repeat 866,409 51,709,171 5.62% Total 2,669,706 413,669,289 44.95% DIRS, Dictyostelium intermediate repeat sequence; DTA, hAT superfamily; DTC, CACTA superfamily; DTH, PIF-Harbinger superfamily; DTM, Mutator superfamily; DTT, Tc1-Mariner superfamily; LINE, long interspersed nuclear elements; LTR, long terminal repeat; MITE, miniature inverted-repeat transposable elements; and TIR, terminal inverted repeats. Table 2.
Annotation of repeat sequences.
-
Chromosome Size (Mb) Gap no. GC% Gene Protein tRNA miRNA snRNA snoRNA lncRNA Chr1 54.79 70 43.00 1,841 1,927 108 19 412 36 97 Chr2 44.56 97 43.03 1,252 1,314 35 18 370 5 69 Chr3 42.16 90 42.79 1,212 1,246 63 8 5 24 50 Chr4 41.48 104 42.50 1,396 1,444 39 8 2 12 72 Chr5 41.39 59 43.14 1,477 1,527 66 14 5 28 90 Chr6 40.62 77 43.62 1,246 1,315 31 29 3 11 79 Chr7 40.49 73 42.80 1,369 1,423 1,108 23 89 15 90 Chr8 39.44 93 43.28 1,178 1,241 58 9 3 7 73 Chr9 39.36 54 42.85 1,258 1,301 89 16 284 9 95 Chr10 38.18 77 43.27 1,199 1,246 134 8 4 27 83 Chr11 37.99 73 43.11 1,240 1,299 65 18 7 19 86 Chr12 37.72 74 43.28 1,297 1,354 2,247 12 7 6 71 Chr13 37.34 80 43.05 1,143 1,189 89 13 9 33 81 Chr14 36.50 56 43.05 1,028 1,055 1,886 10 9 22 65 Chr15 35.68 108 43.60 1,054 1,096 1,111 9 2 2 73 Chr16 35.61 65 43.05 949 986 31 5 1 3 65 Chr17 34.99 96 43.28 1,073 1,106 102 15 1 9 68 Chr18 34.23 127 43.25 962 1,006 69 548 4 132 45 Chr19 31.23 117 43.33 858 873 99 10 214 3 50 Chr20 31.03 74 43.21 850 877 79 13 6 12 45 Chr21 30.88 101 43.27 994 1,027 33 8 4 15 59 Chr22 30.85 85 43.30 1,014 1,042 41 8 2 15 64 Chr23 30.44 76 43.47 1,021 1,085 89 3 2 12 81 Chr24 30.28 102 43.14 1,055 1,079 66 10 6 11 56 Unplaced 22.88 0 45.29 154 154 590 750 1,642 0 3 Total 920.24 2,028 43.19 28,120 29,212 8,328 1,584 3,093 468 1,710 Table 3.
Statistics of the American shad genome by chromosome.
-
Item Statistics Number of genes 479,036 Number of genes in orthogroups 453,950 Number of unassigned genes 25,086 Percentage of genes in orthogroups 94.8% Percentage of unassigned genes 5.2% Number of orthogroups 20,706 Number of species-specific orthogroups 286 Number of genes in species-specific orthogroups 1,204 Percentage of genes in species-specific orthogroups) 0.3% Mean orthogroup size 21.9 Median orthogroup size 19 G50 (assigned genes) 26 G50 (all genes) 23 O50 (assigned genes) 5,190 O50 (all genes) 5,701 Number of orthogroups with all species present 7,489 Number of single-copy orthogroups 250 Table 4.
Statistics of orthology genes in phylogenetic tree construction.
Figures
(4)
Tables
(4)