-
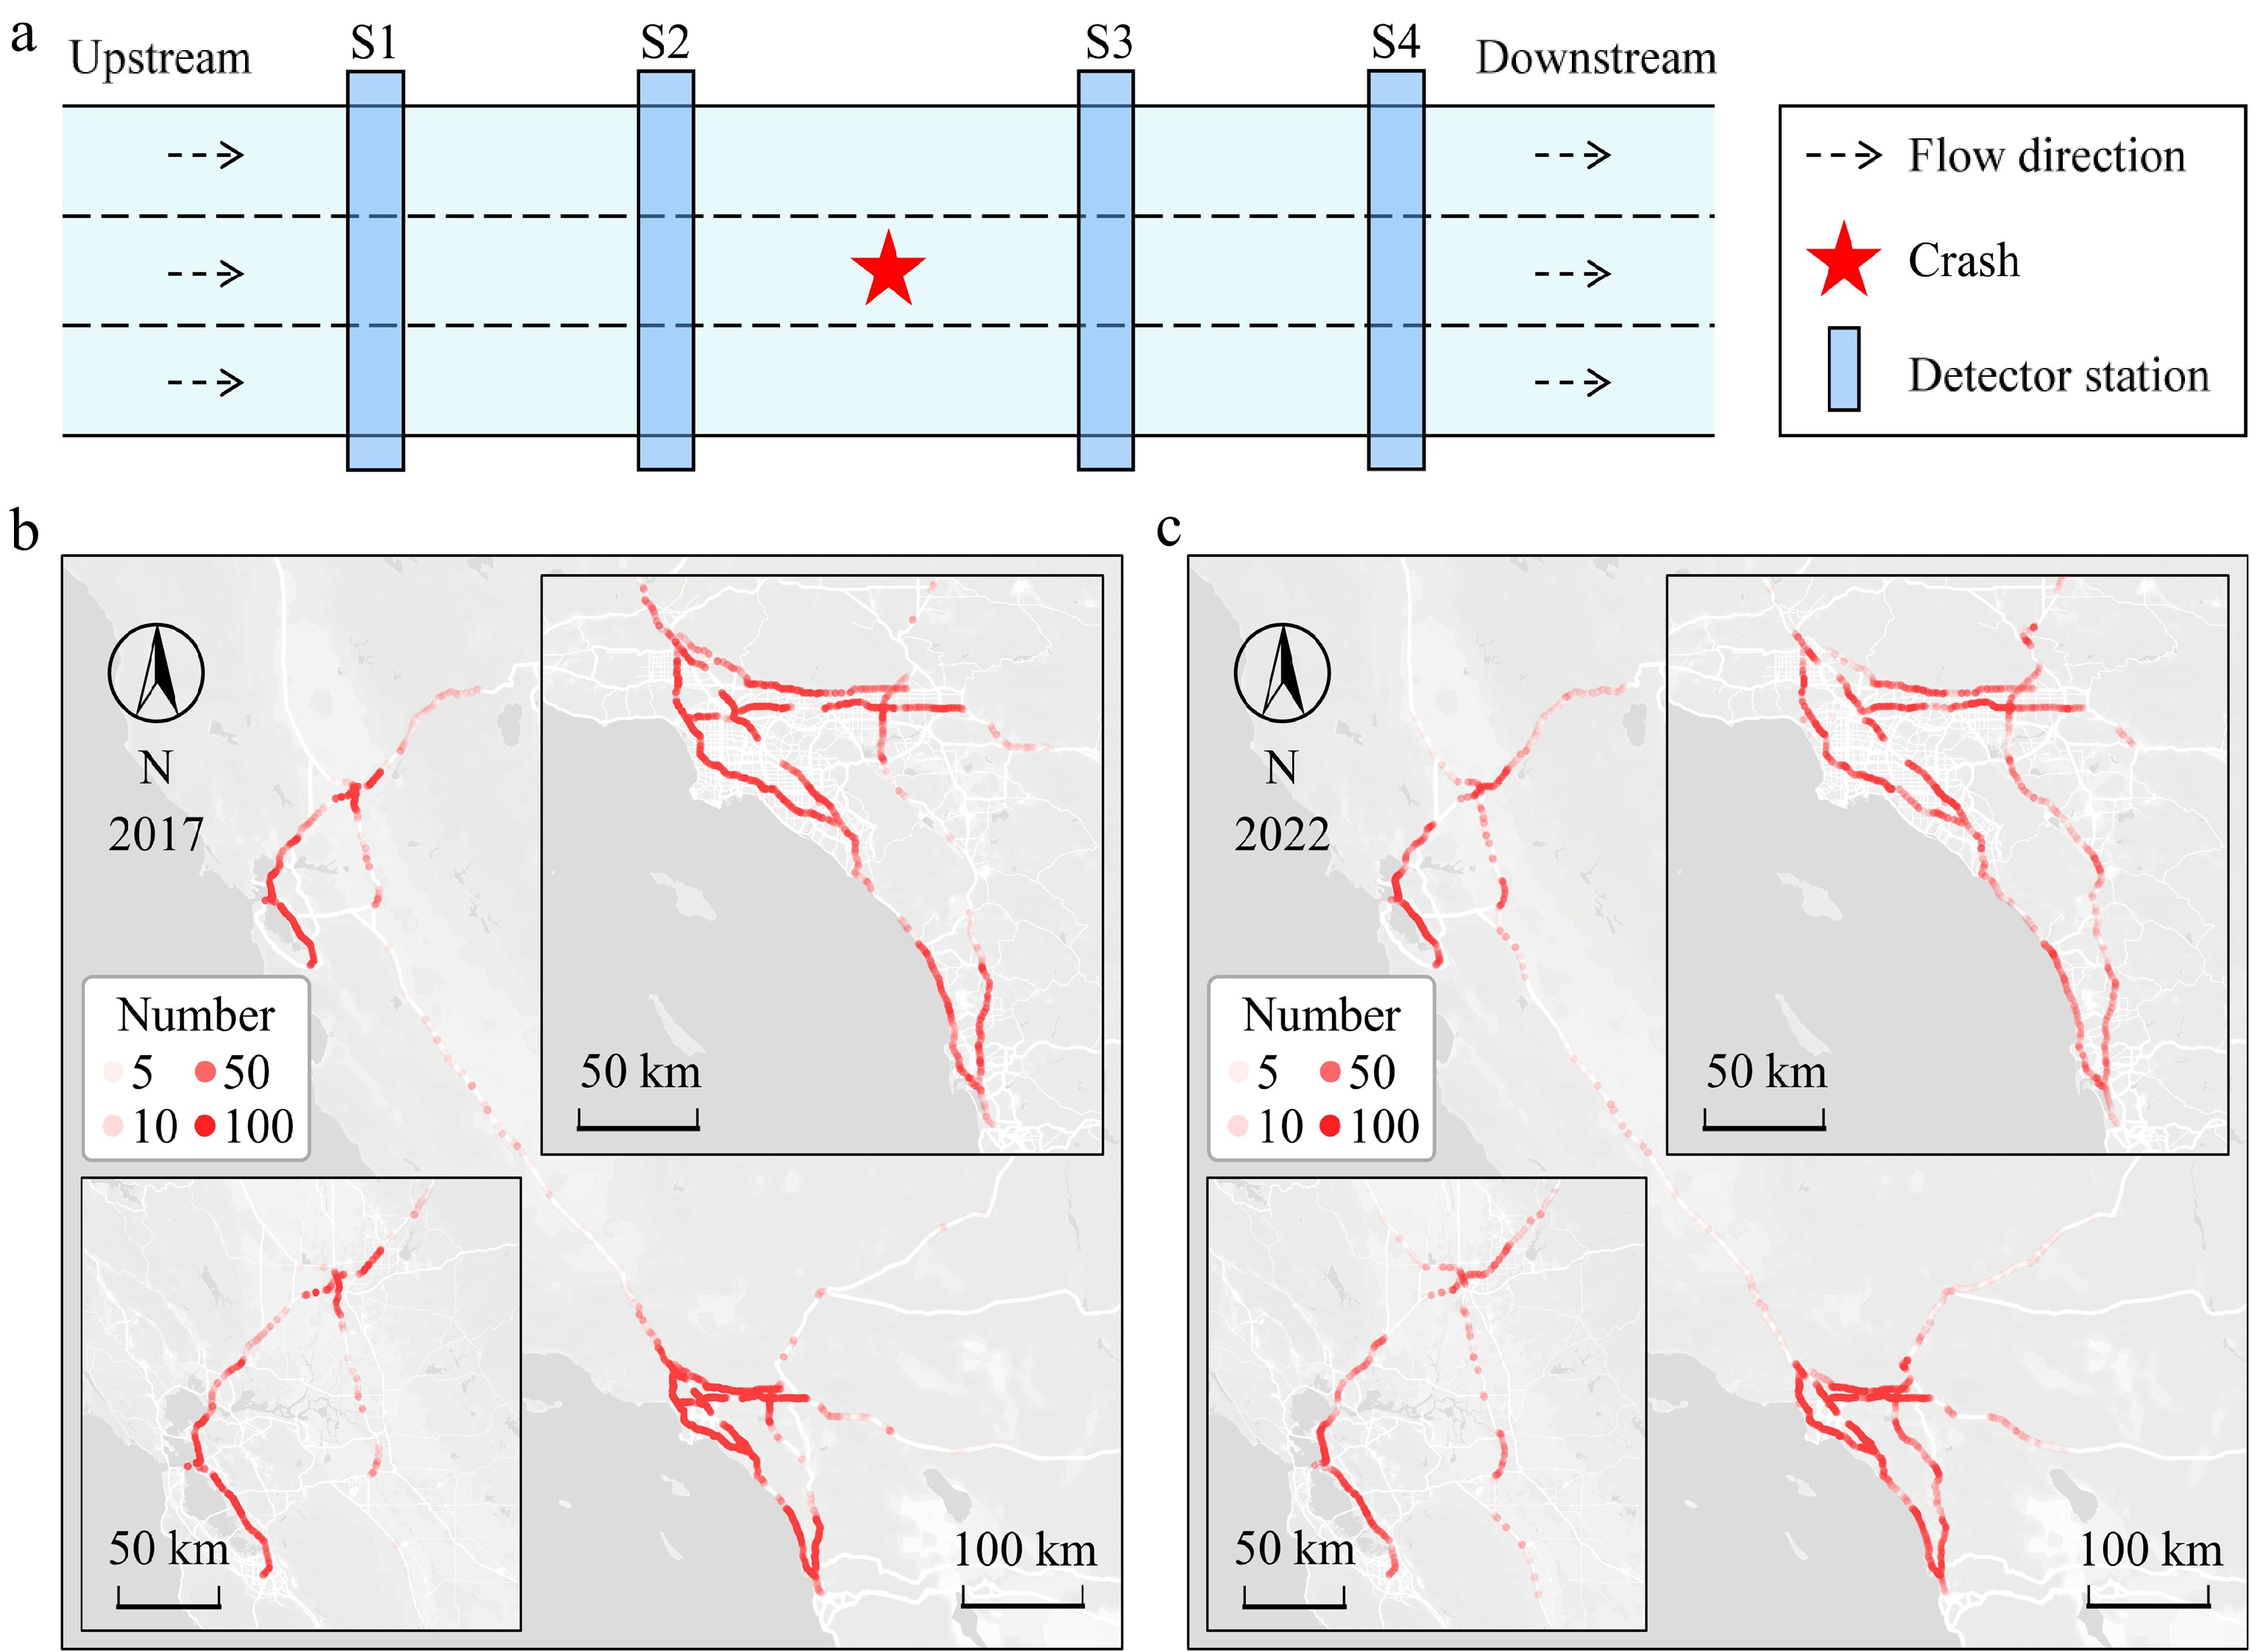
Figure 1.
Crash cases collection and preprocessing. (a) Traffic crash detection layout, (b) spatial dispersion of accidents in 2017, (c) spatial dispersion of accidents in 2022.
-
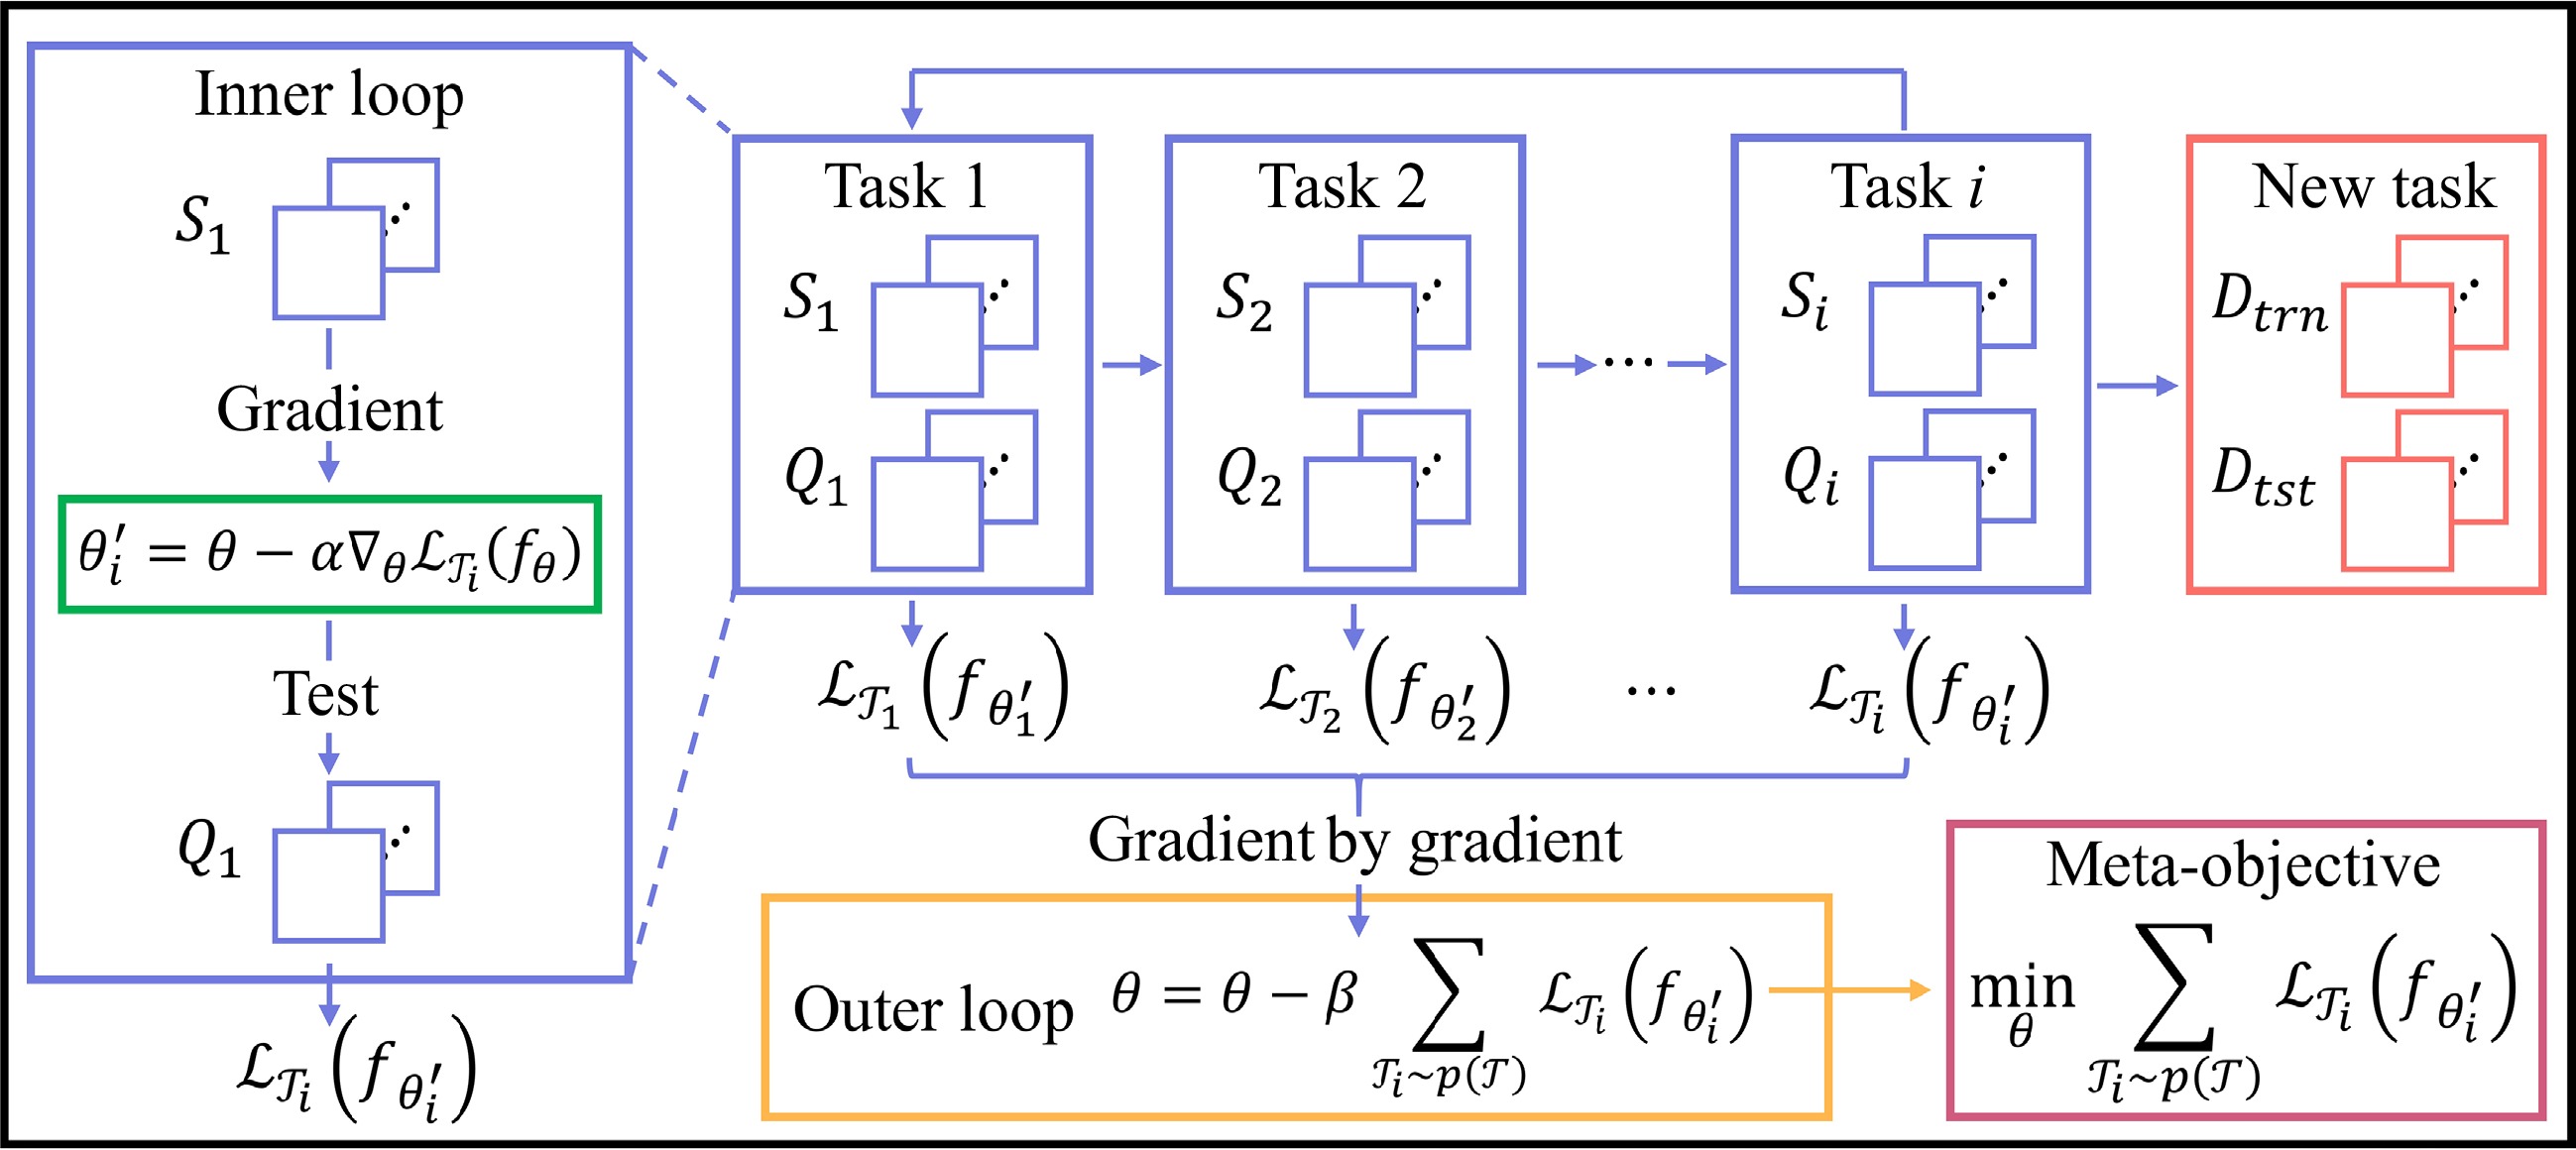
Figure 2.
Structure of MAML.
-
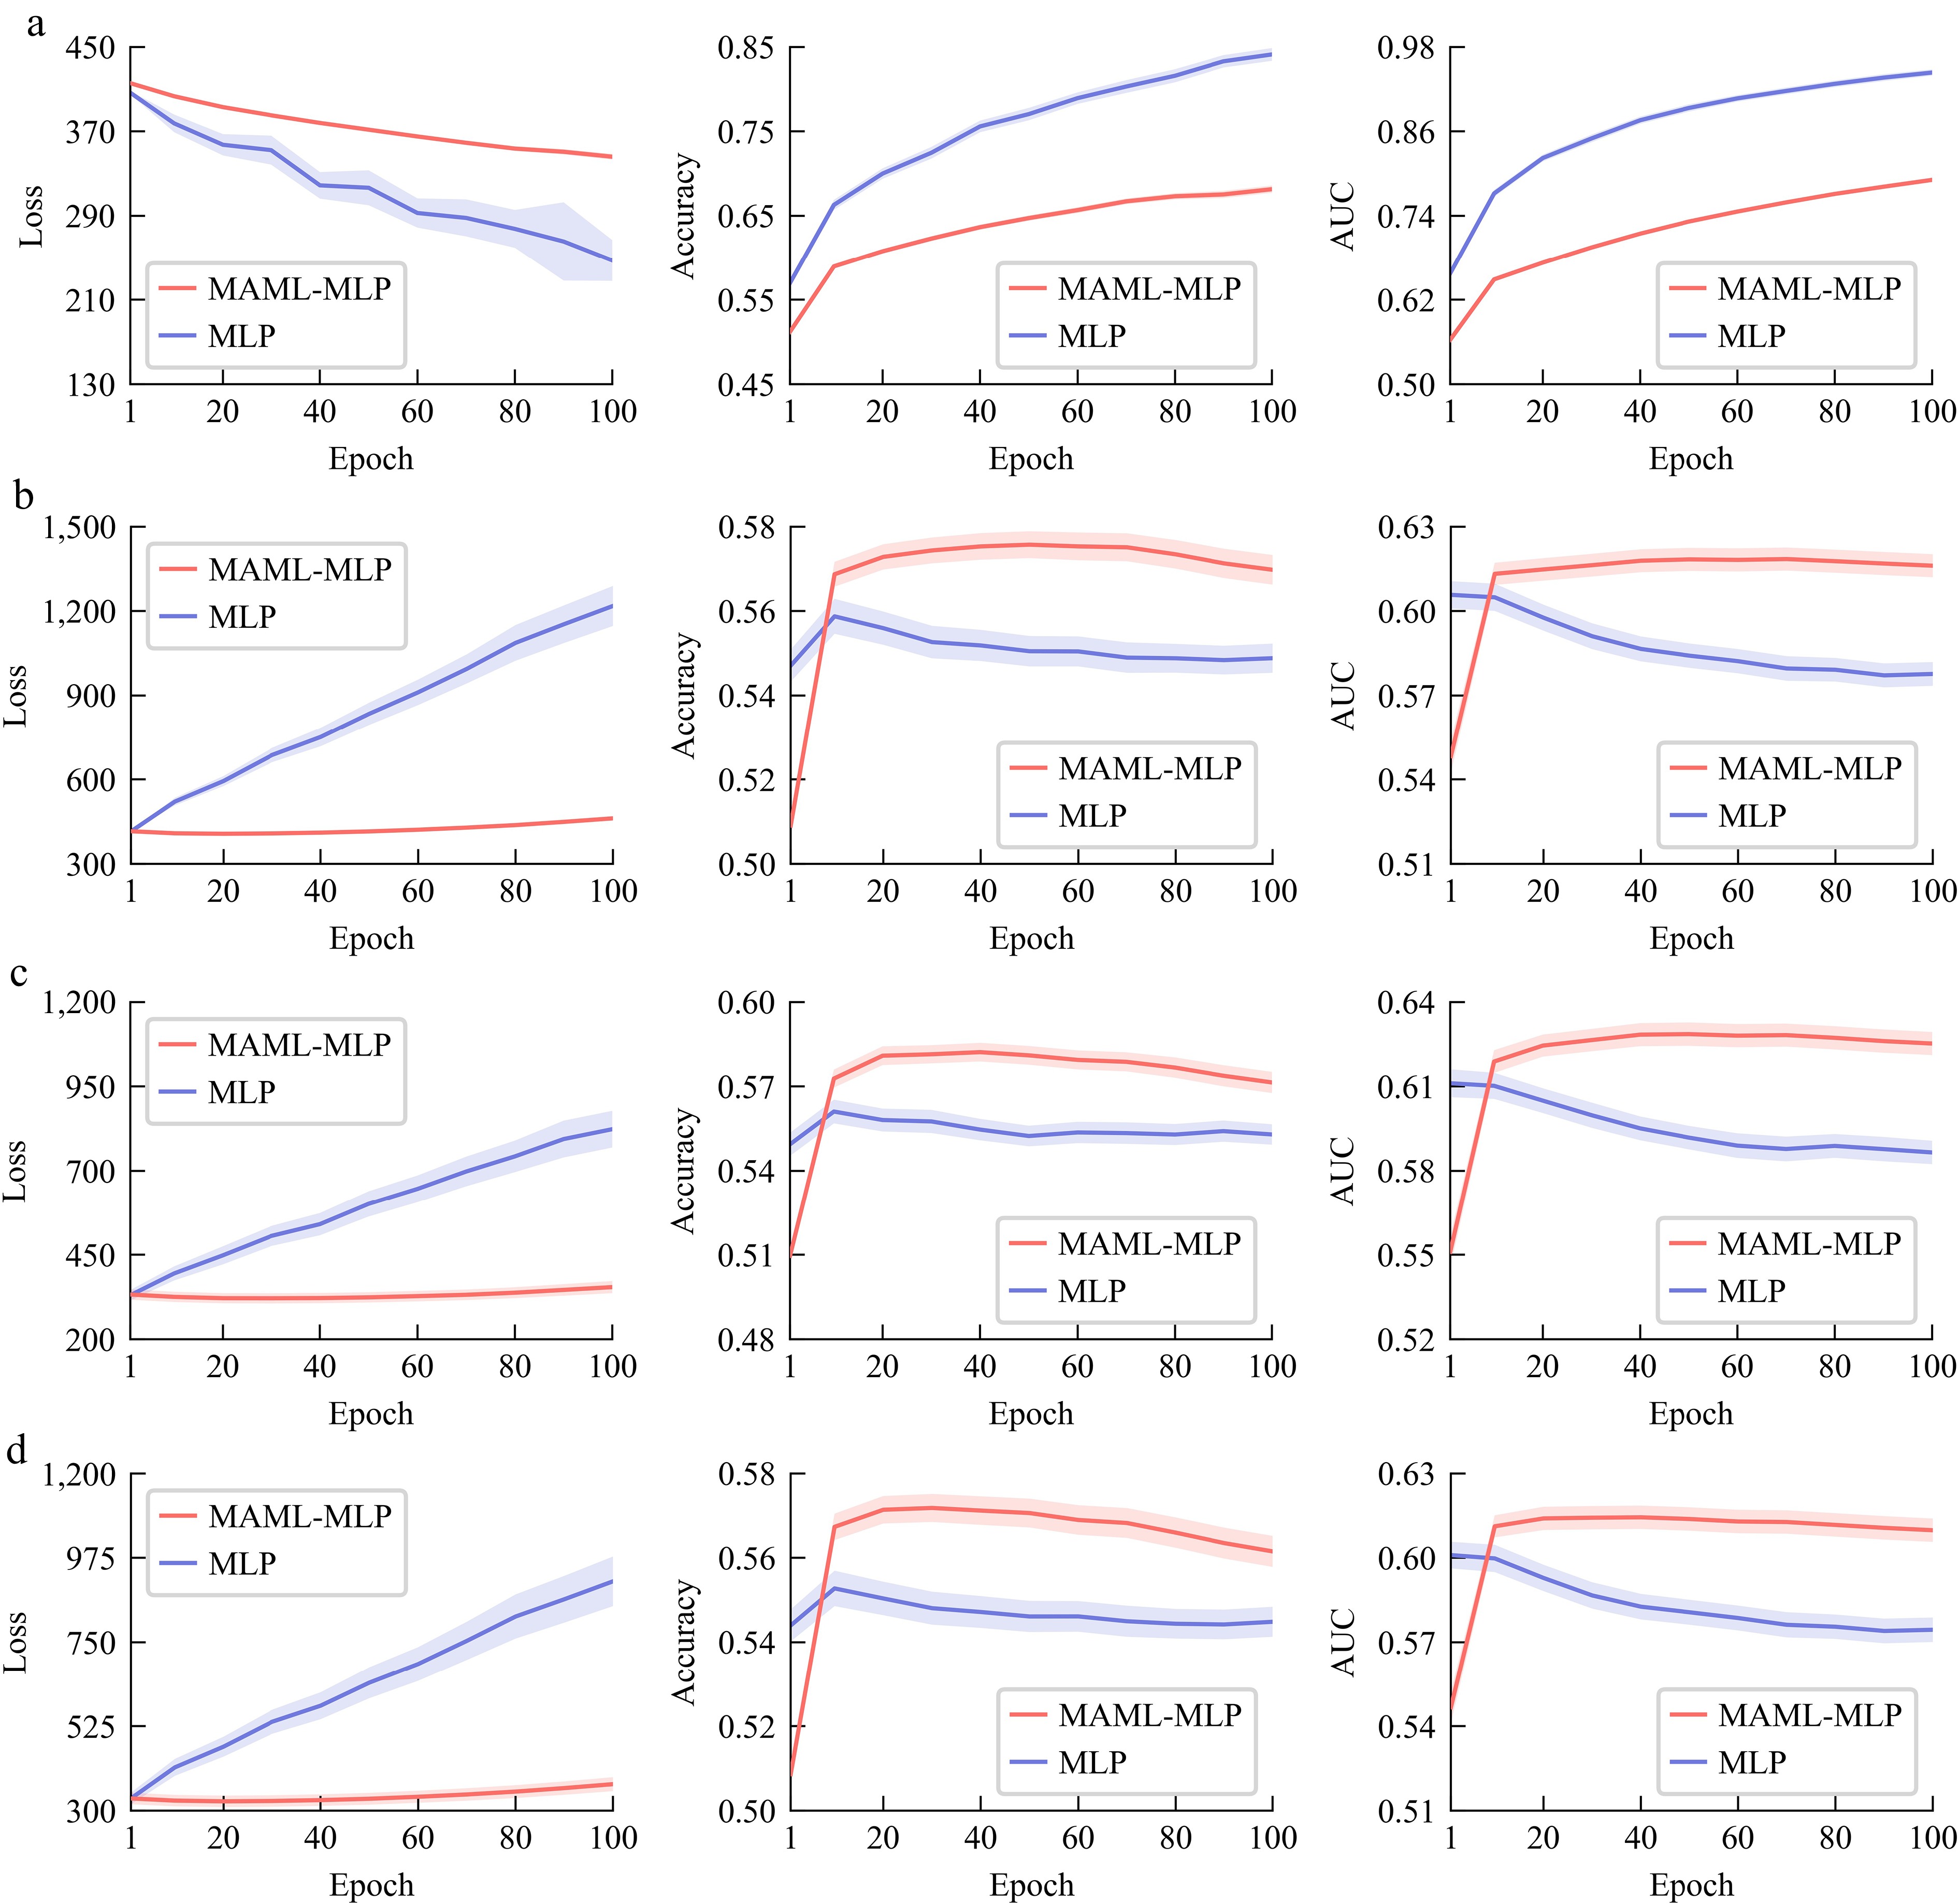
Figure 3.
The mean and
$ {10}^{-1} $ -
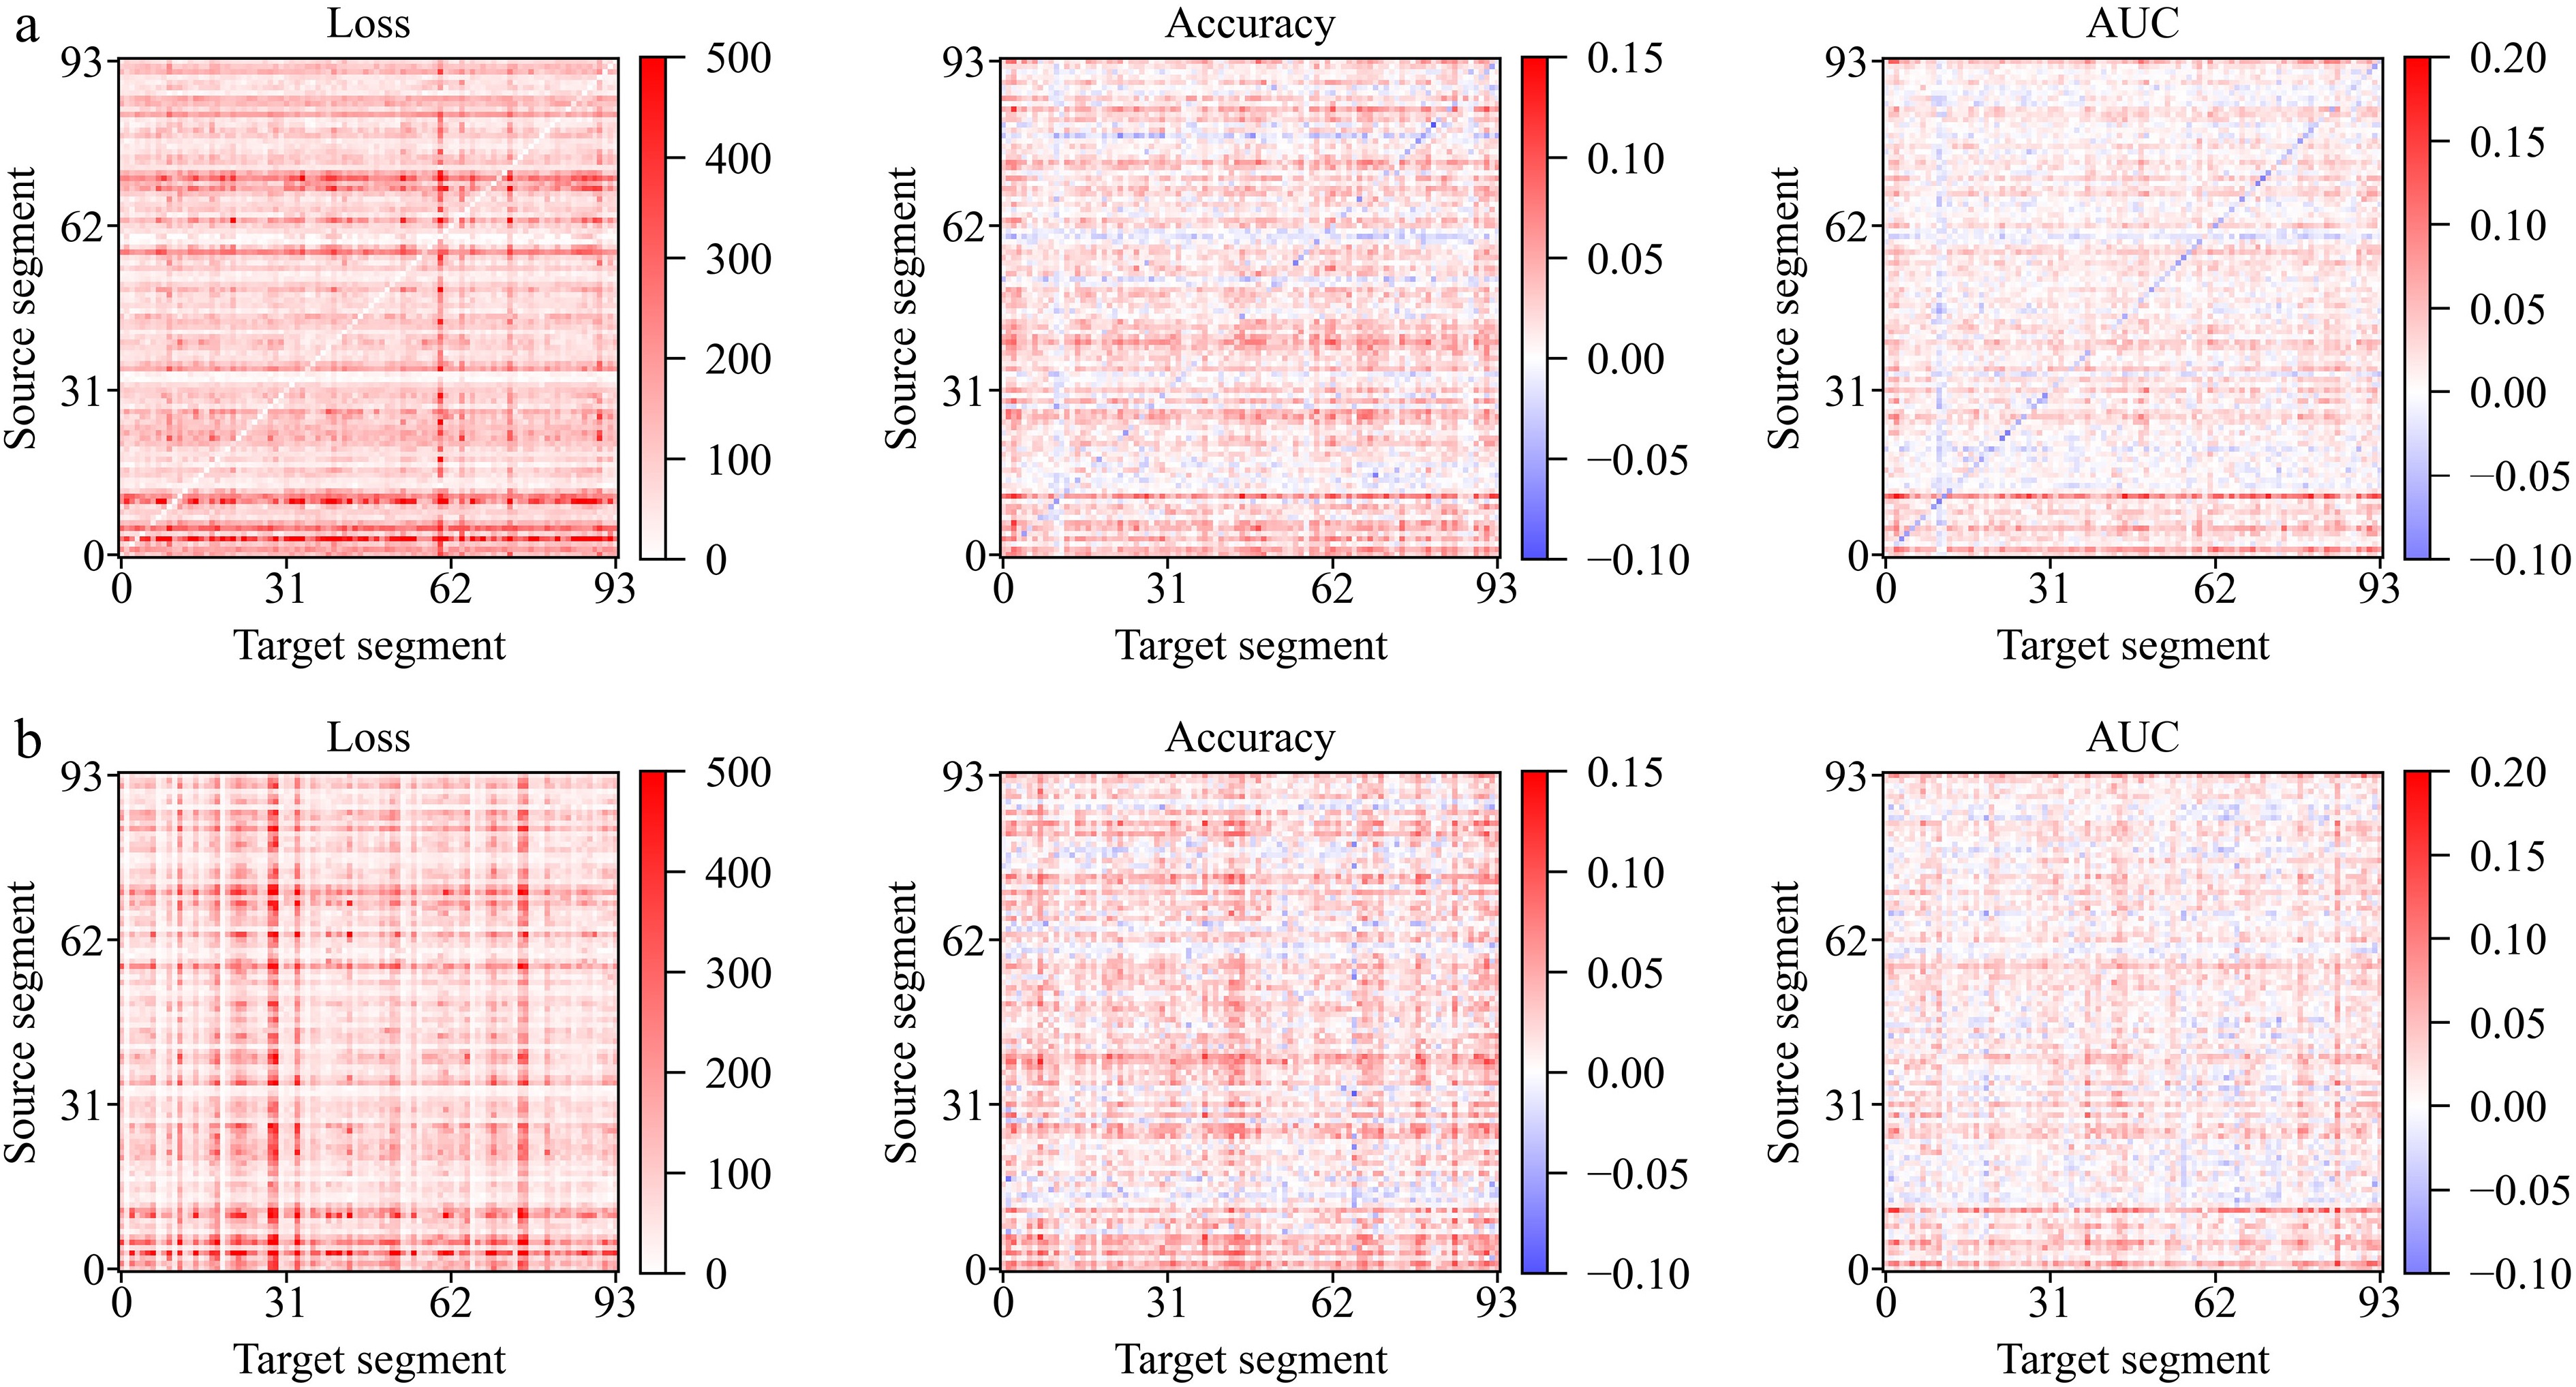
Figure 4.
Detailed improvement of loss, accuracy, and AUC. (a) Result tested on data in 2017, (b) result tested on data in 2022.
-
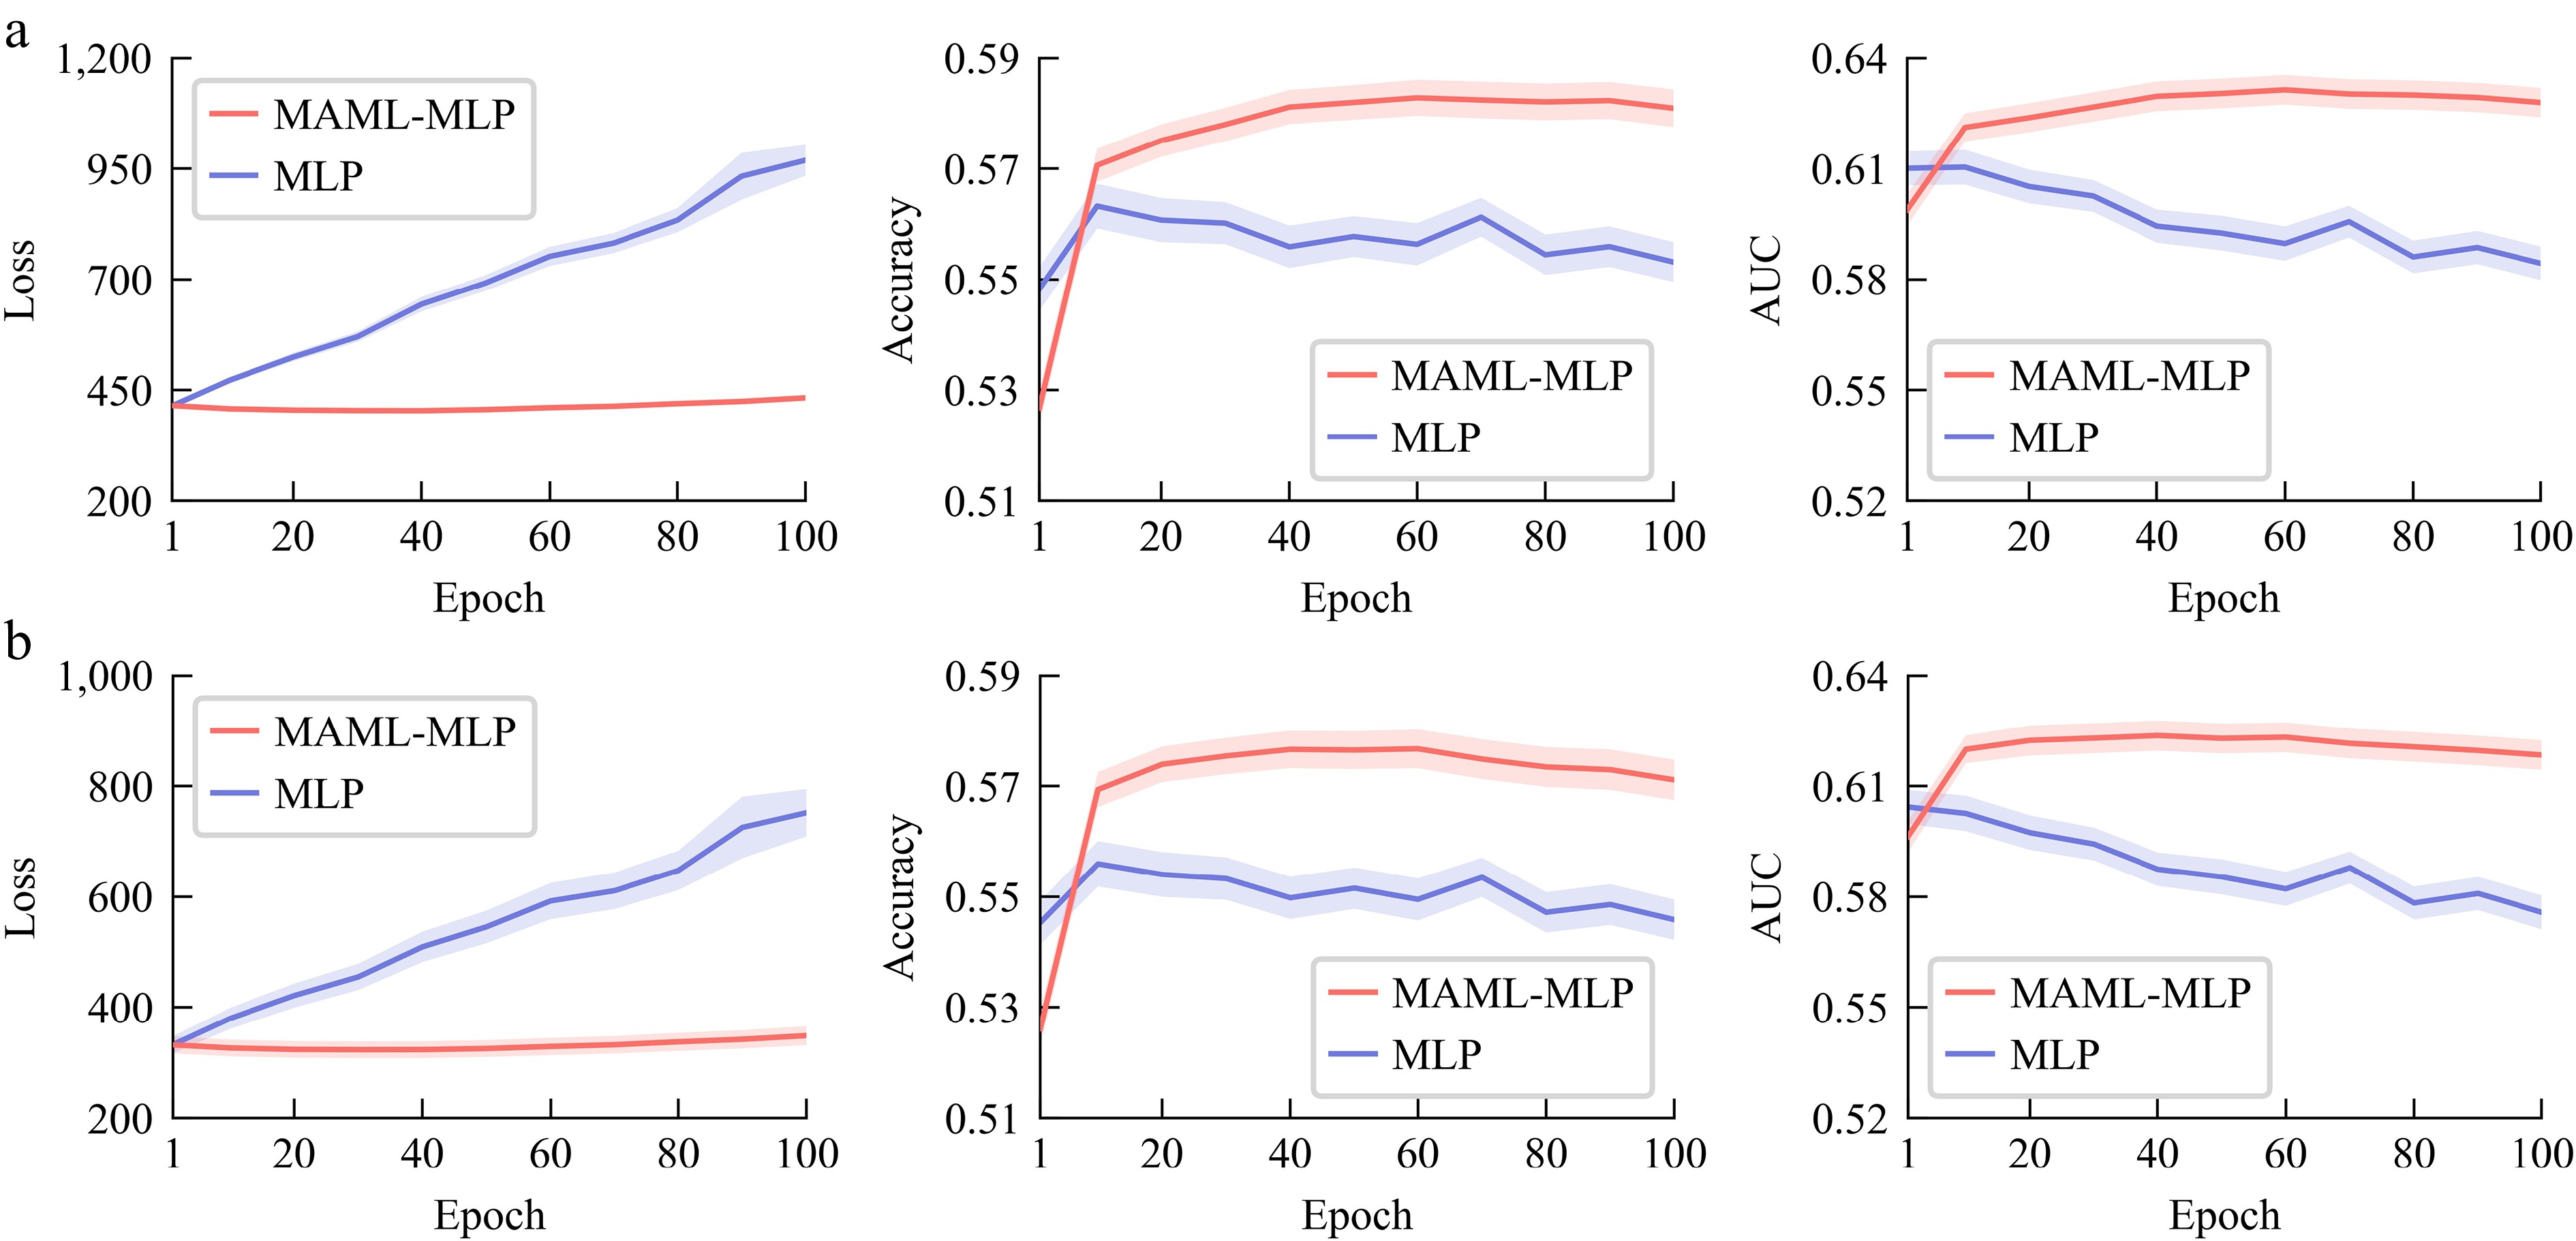
Figure 5.
Mean and 10−1 standard deviation of loss, accuracy, and AUC of MAML and benchmark model in multi-task learning. (a) Result tested on data in 2017, (b) result tested on data in 2022.
-
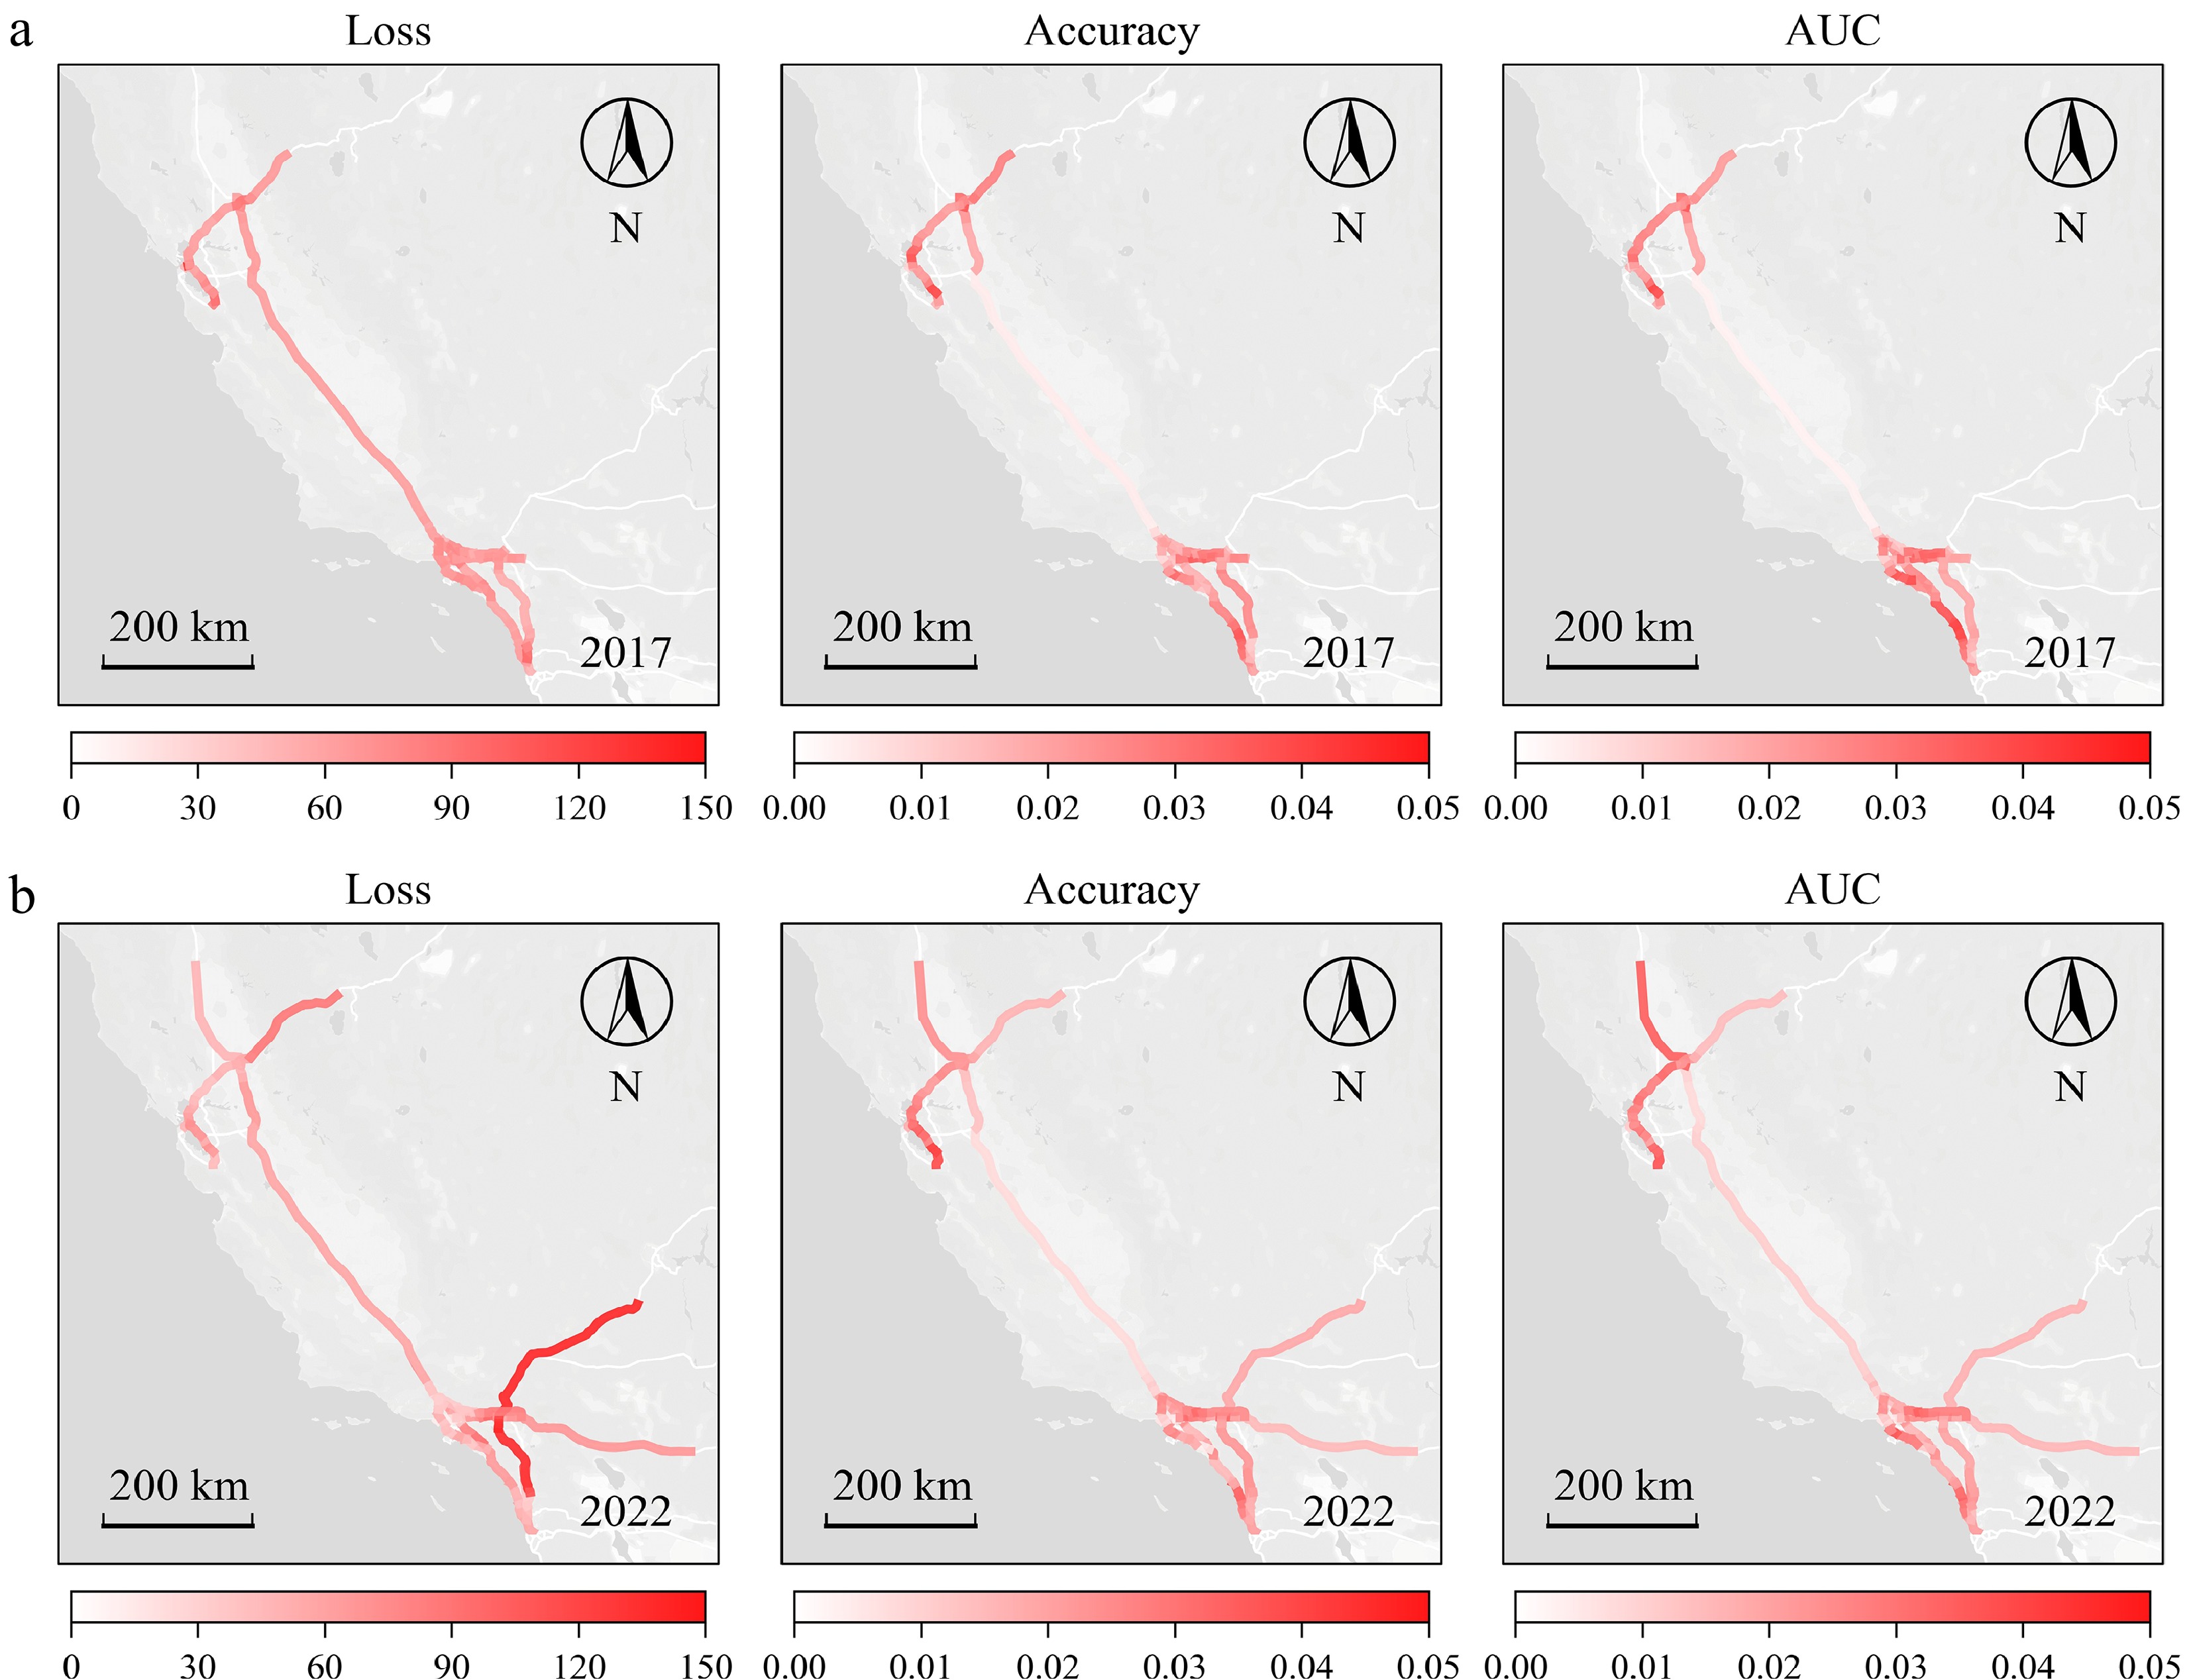
Figure 6.
Geographical distribution of loss, accuracy, and AUC improvement. (a) Result tested on data in 2017, (b) result tested on data in 2022.
-
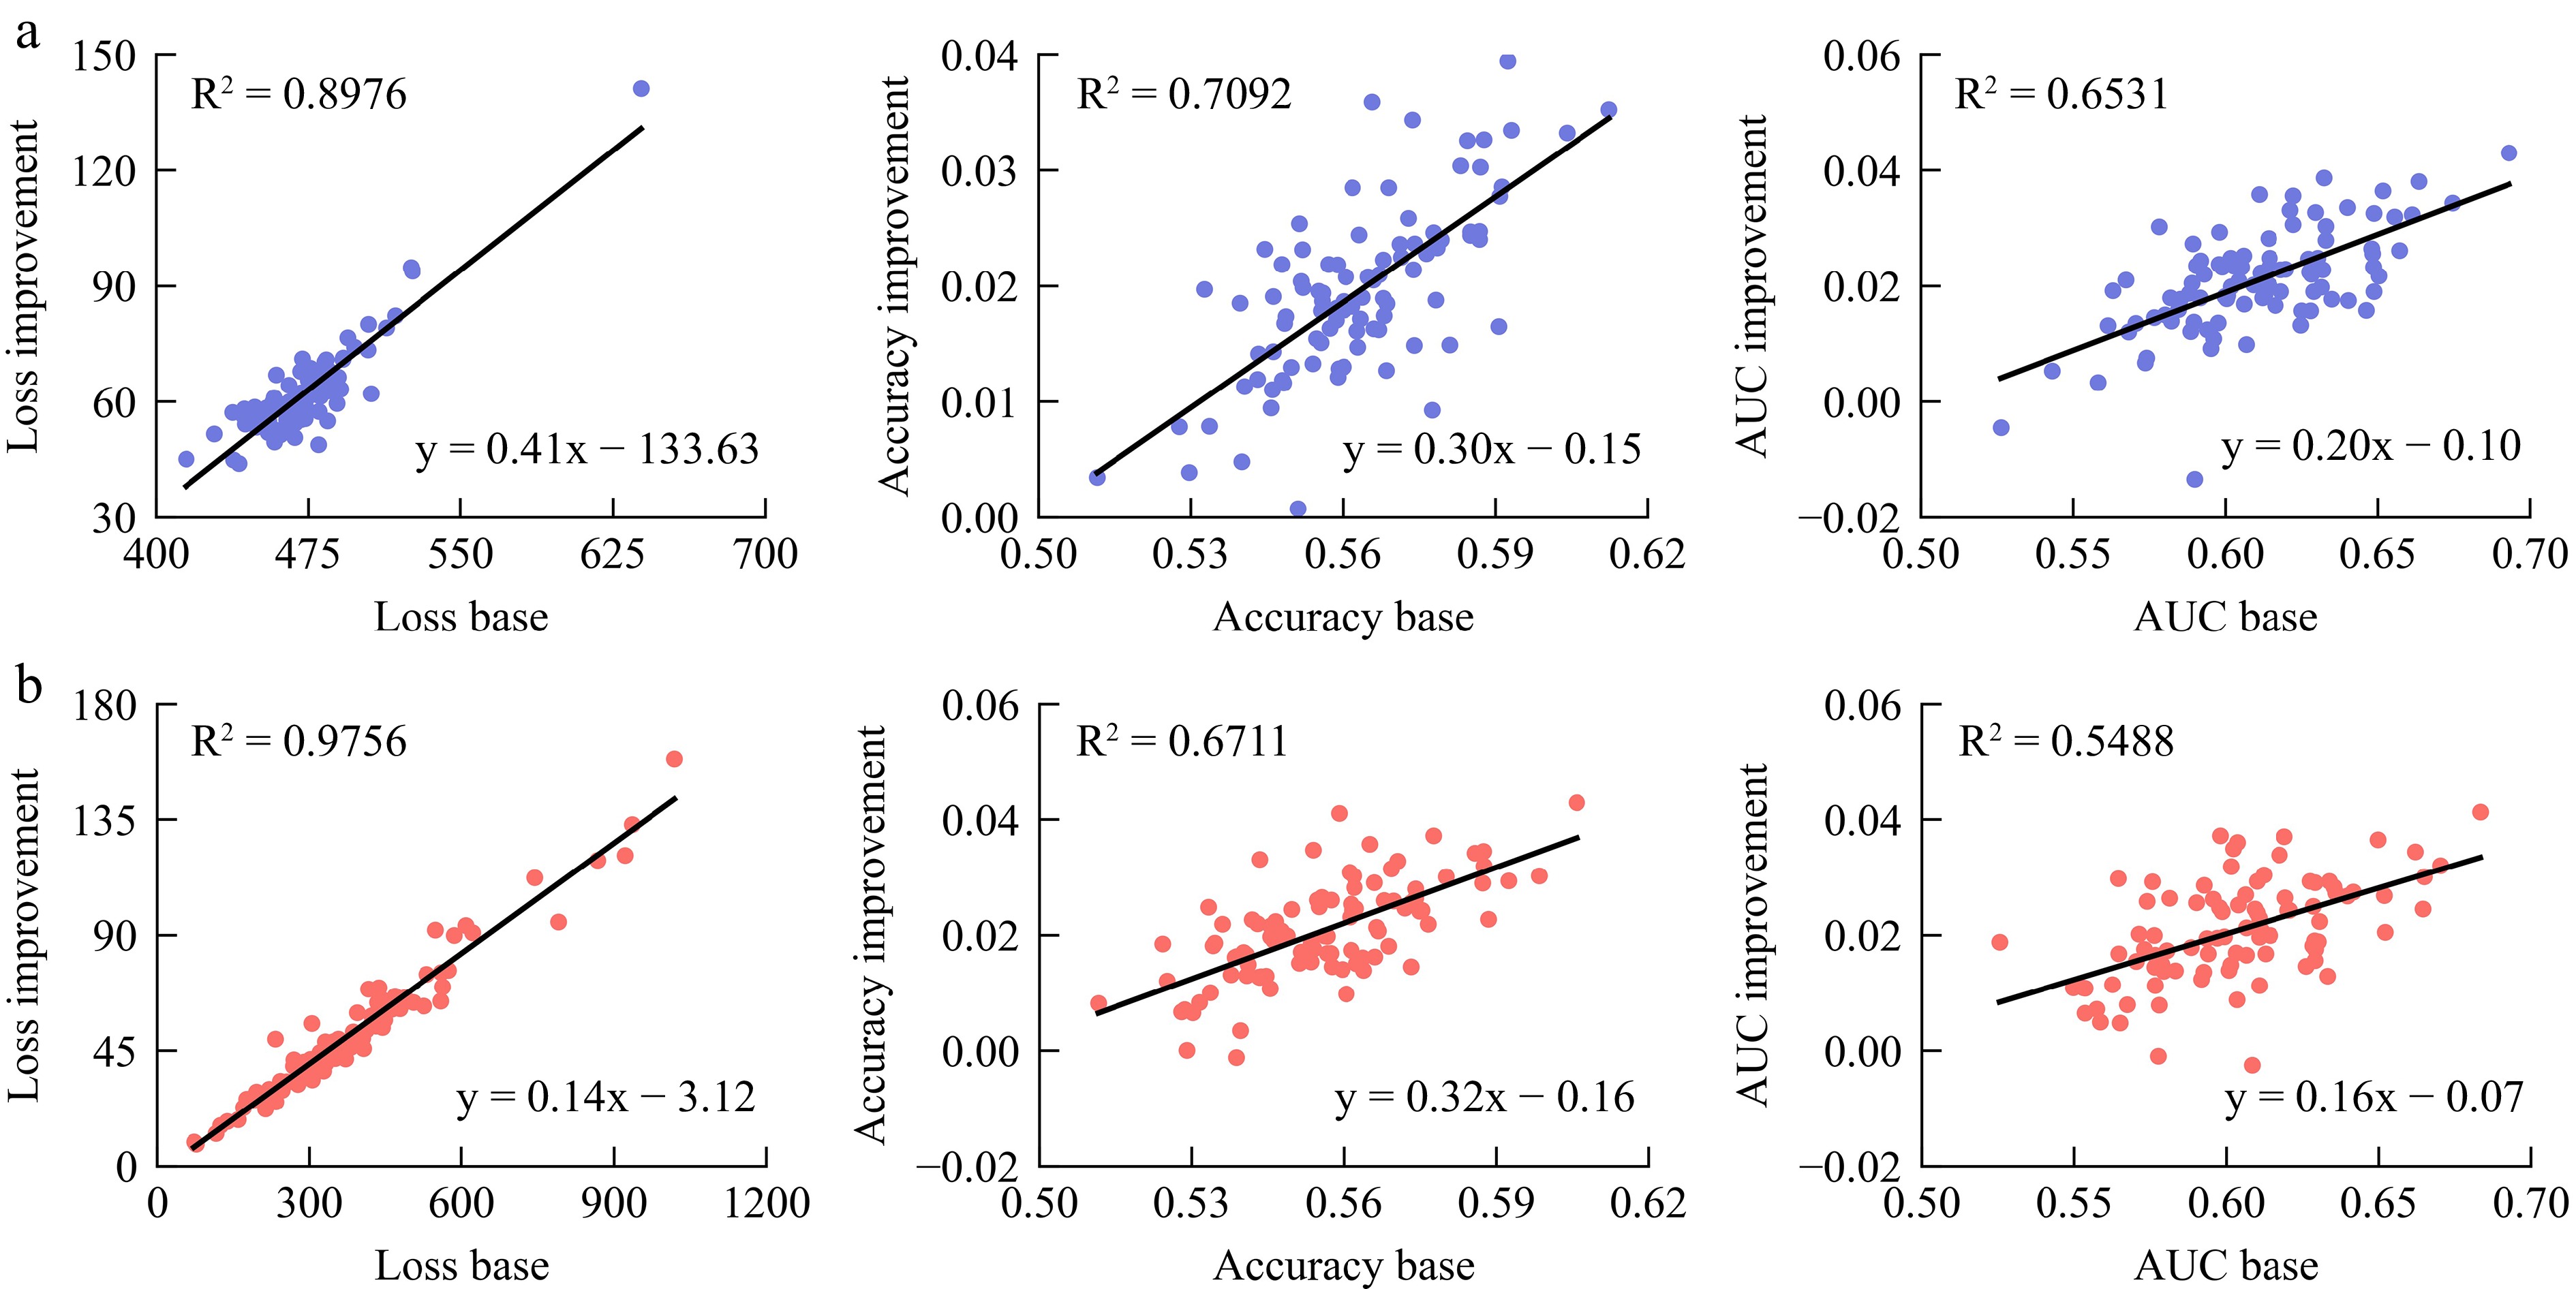
Figure 7.
Correlation analysis between MAML and inner models. (a) Result tested on data in 2017, (b) result tested on data in 2022.
-
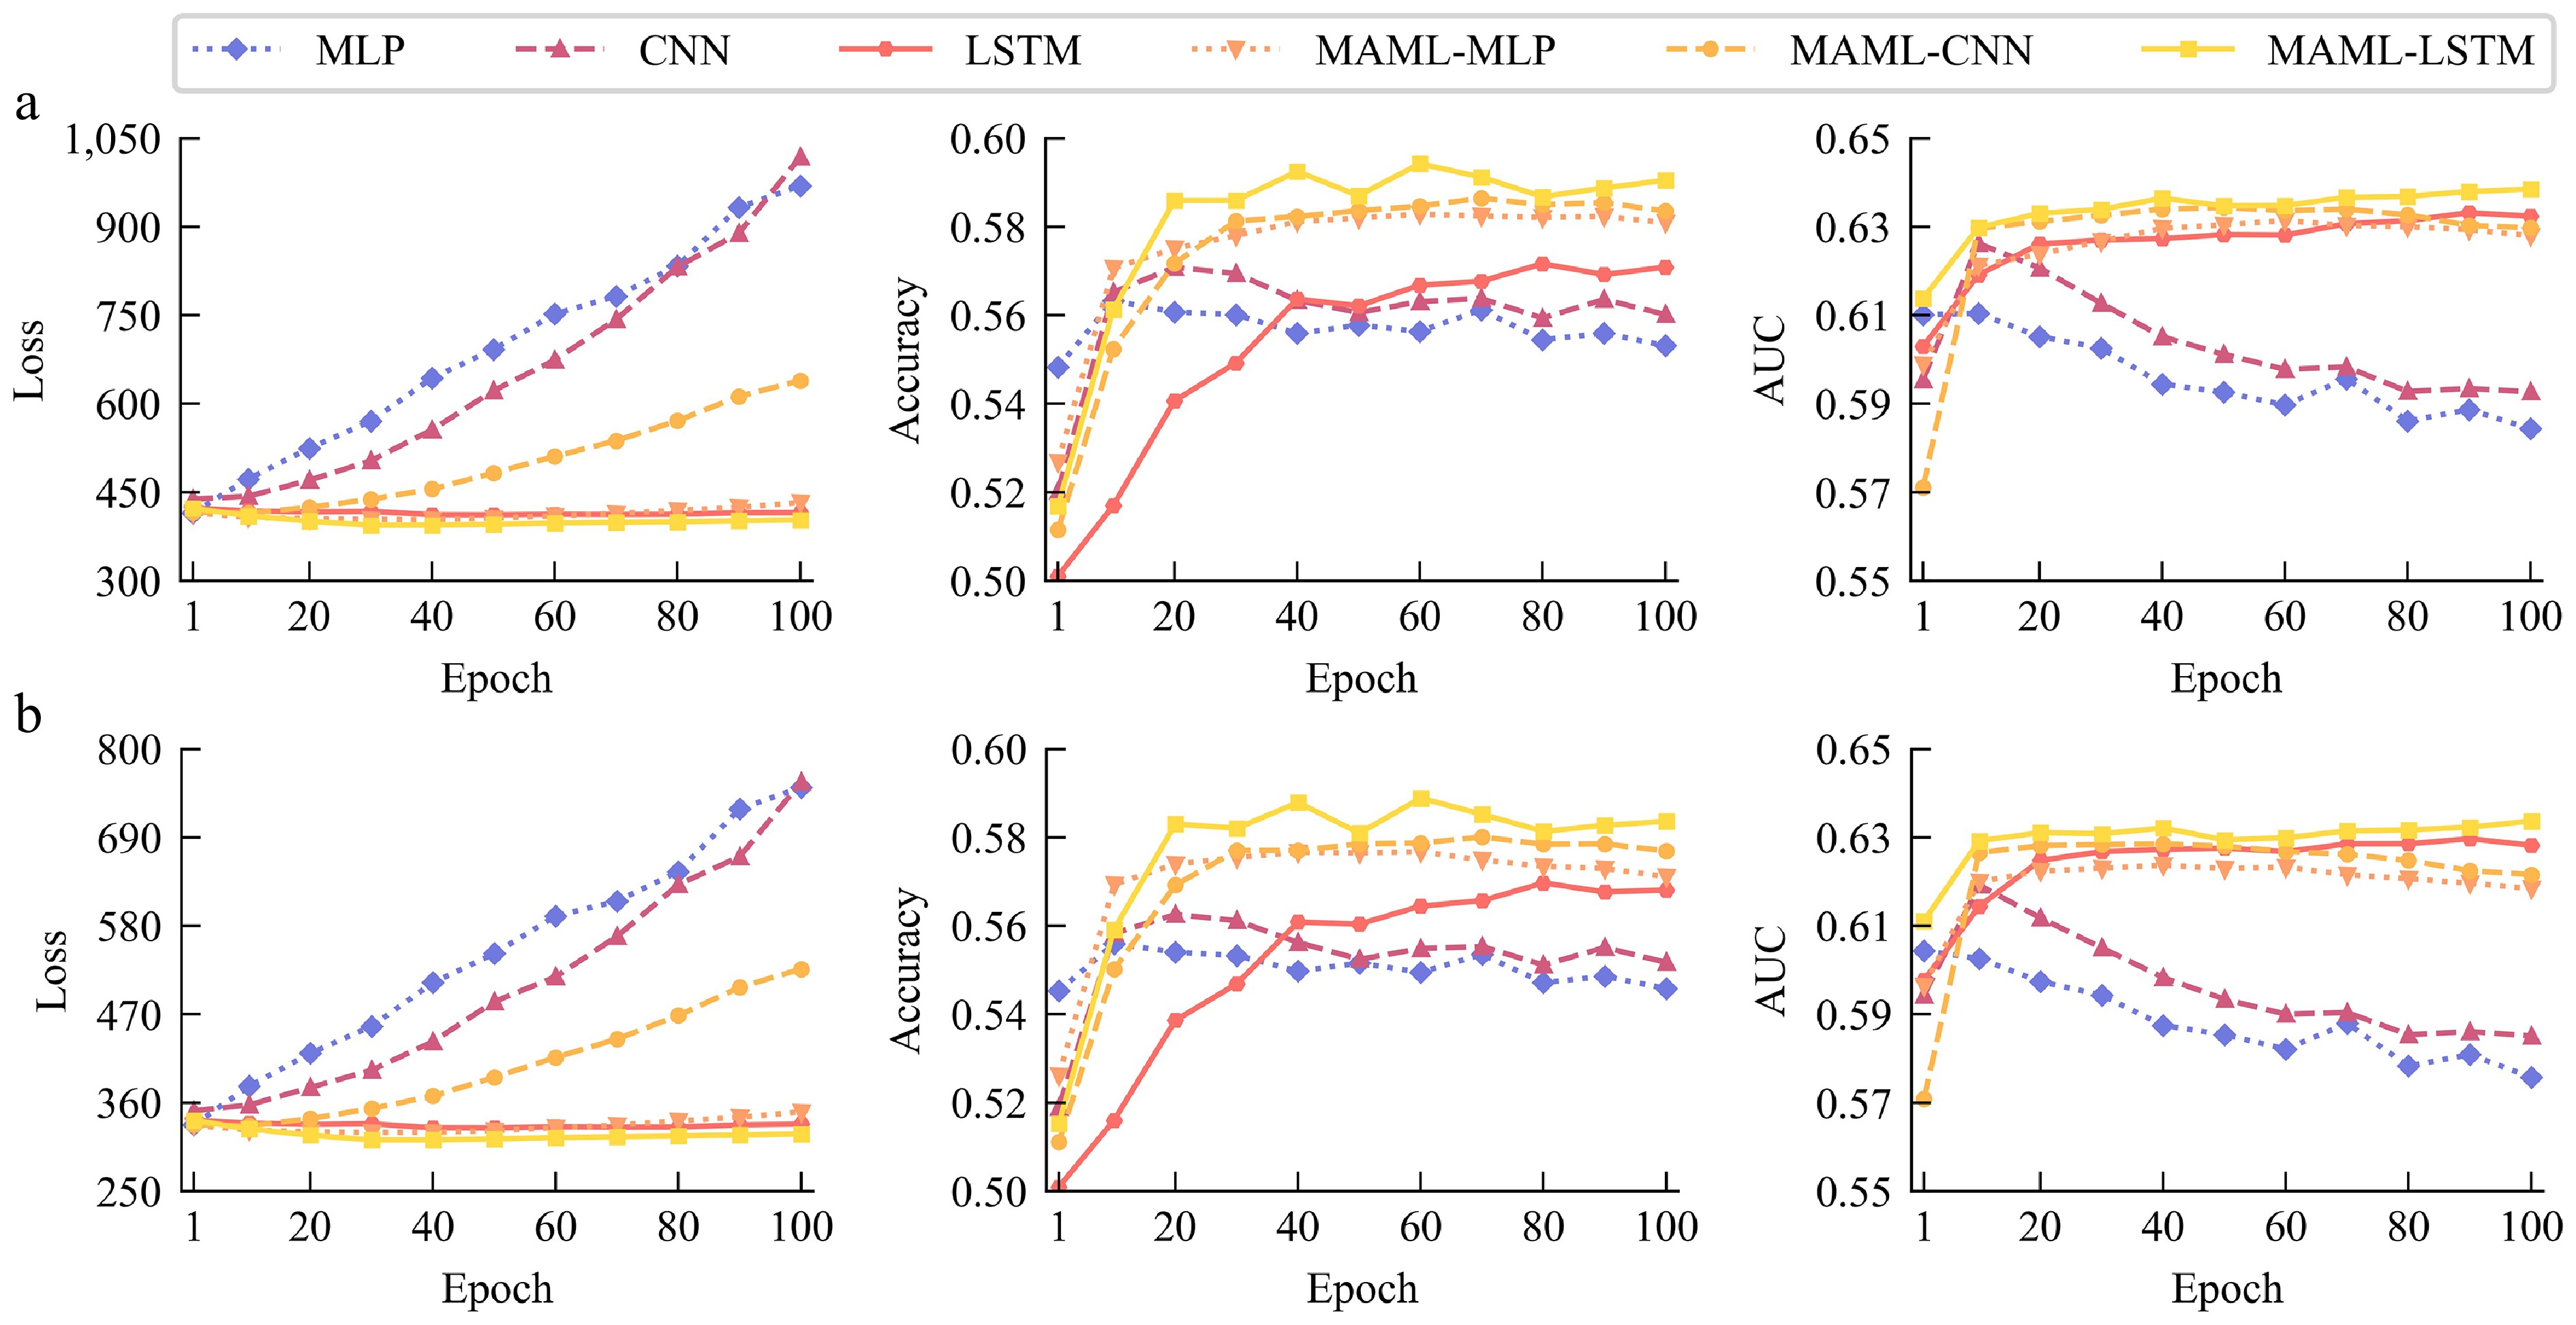
Figure 8.
Mean and 10−1 standard deviation of loss, accuracy, and AUC of MAML and all benchmark models in multi-task learning. (a) Result tested on data in 2017, (b) result tested on data in 2022.
Figures
(8)
Tables
(0)