-
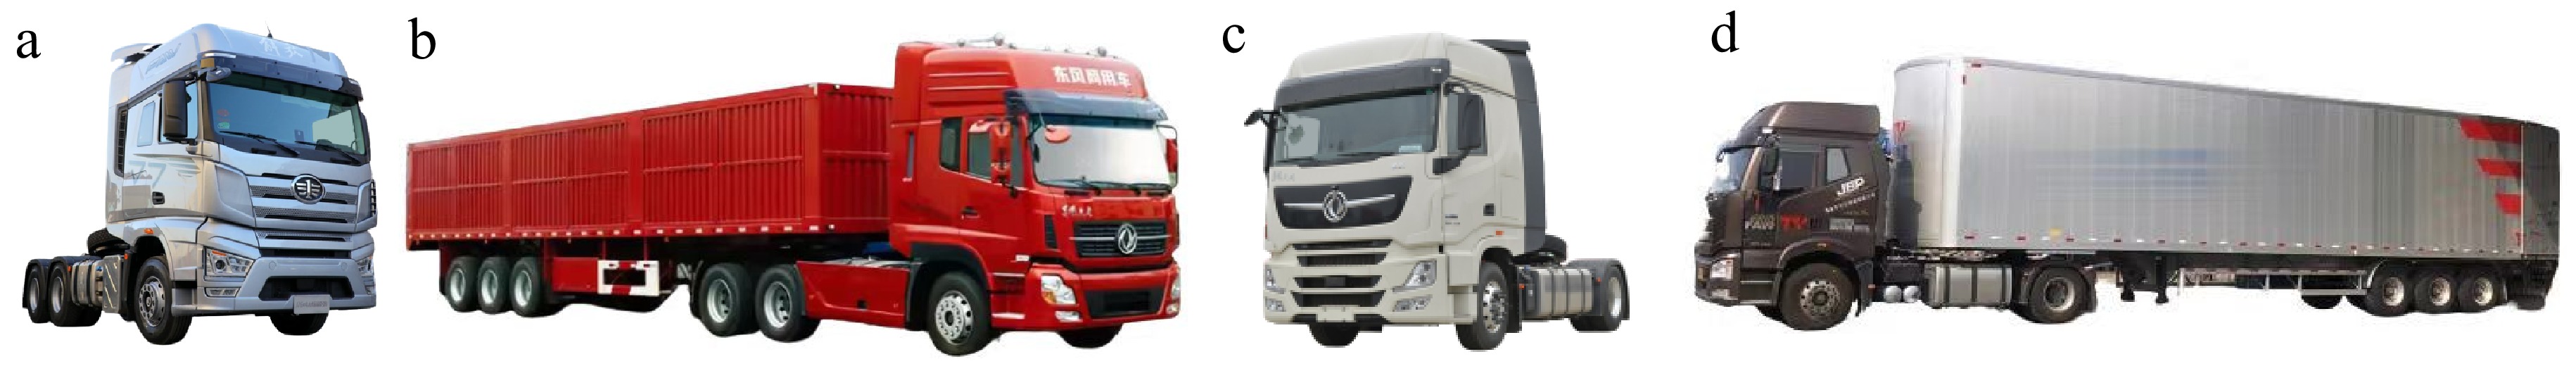
Figure 1.
Tractor cars with different axle types and articulated trains. (a) Three-axle tractor. (b) Six-axle articulated vehicle. (c)Two-axle tractor. (d) Five-axle articulated vehicle.
-
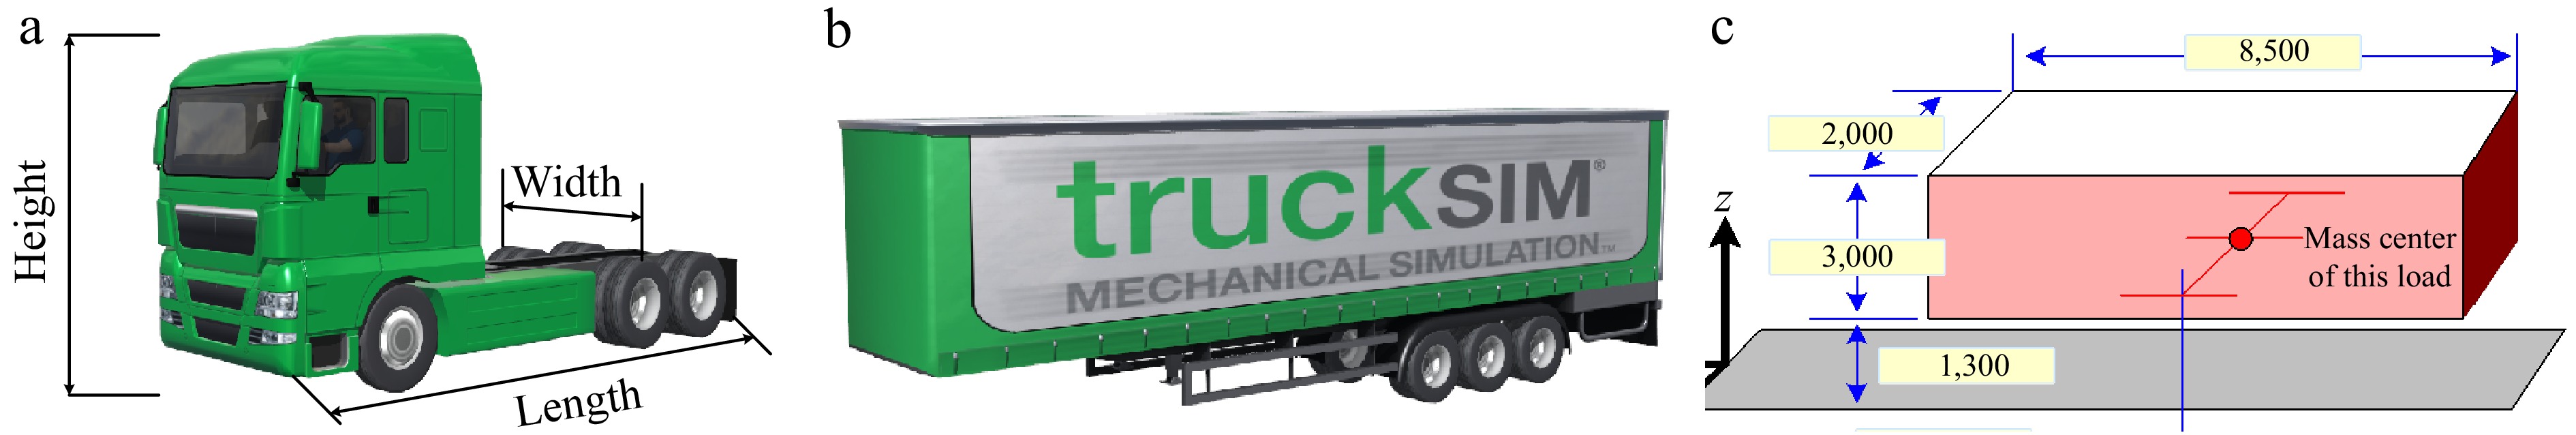
Figure 2.
Simulate vehicle models. (a) Tractor model. (b) Semi-trailer model. (c) Load model.
-
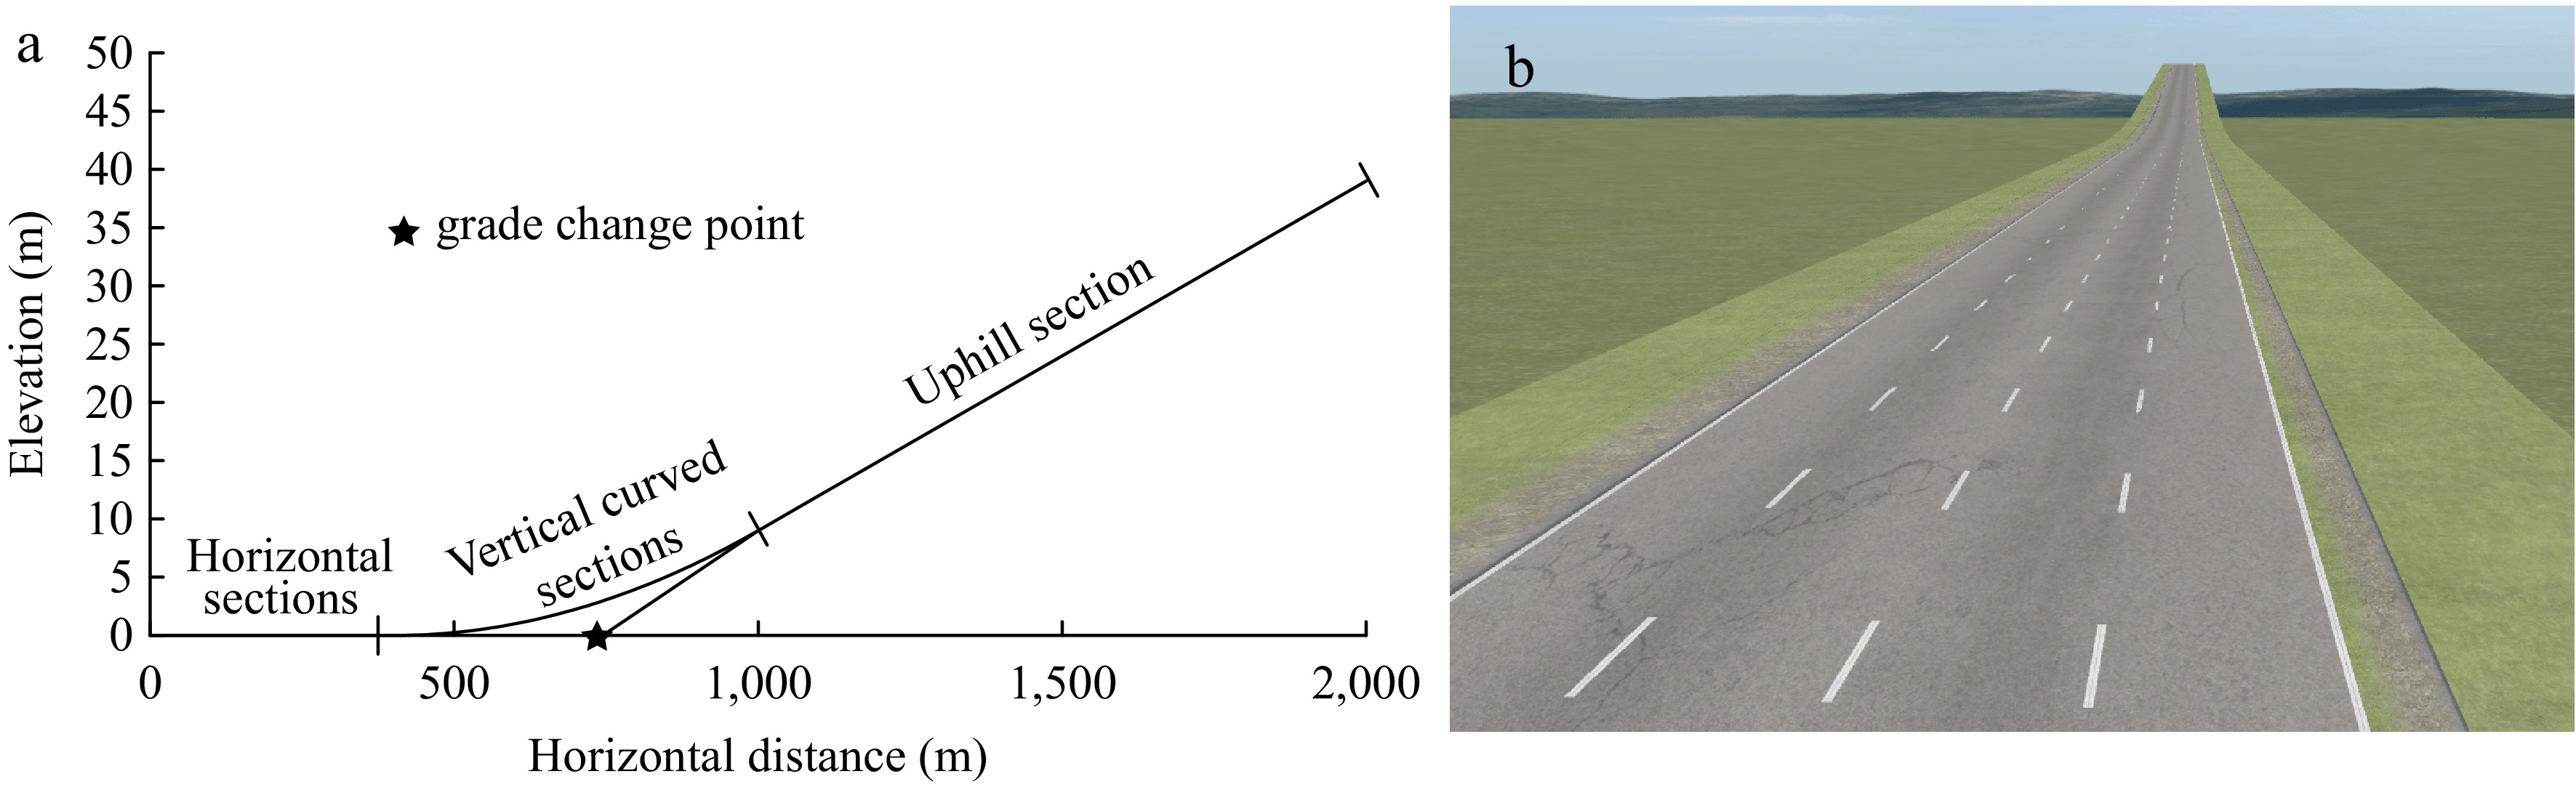
Figure 3.
Profile of the road model and its simulation effect. (a) Road profile. (b) Road simulation model.
-
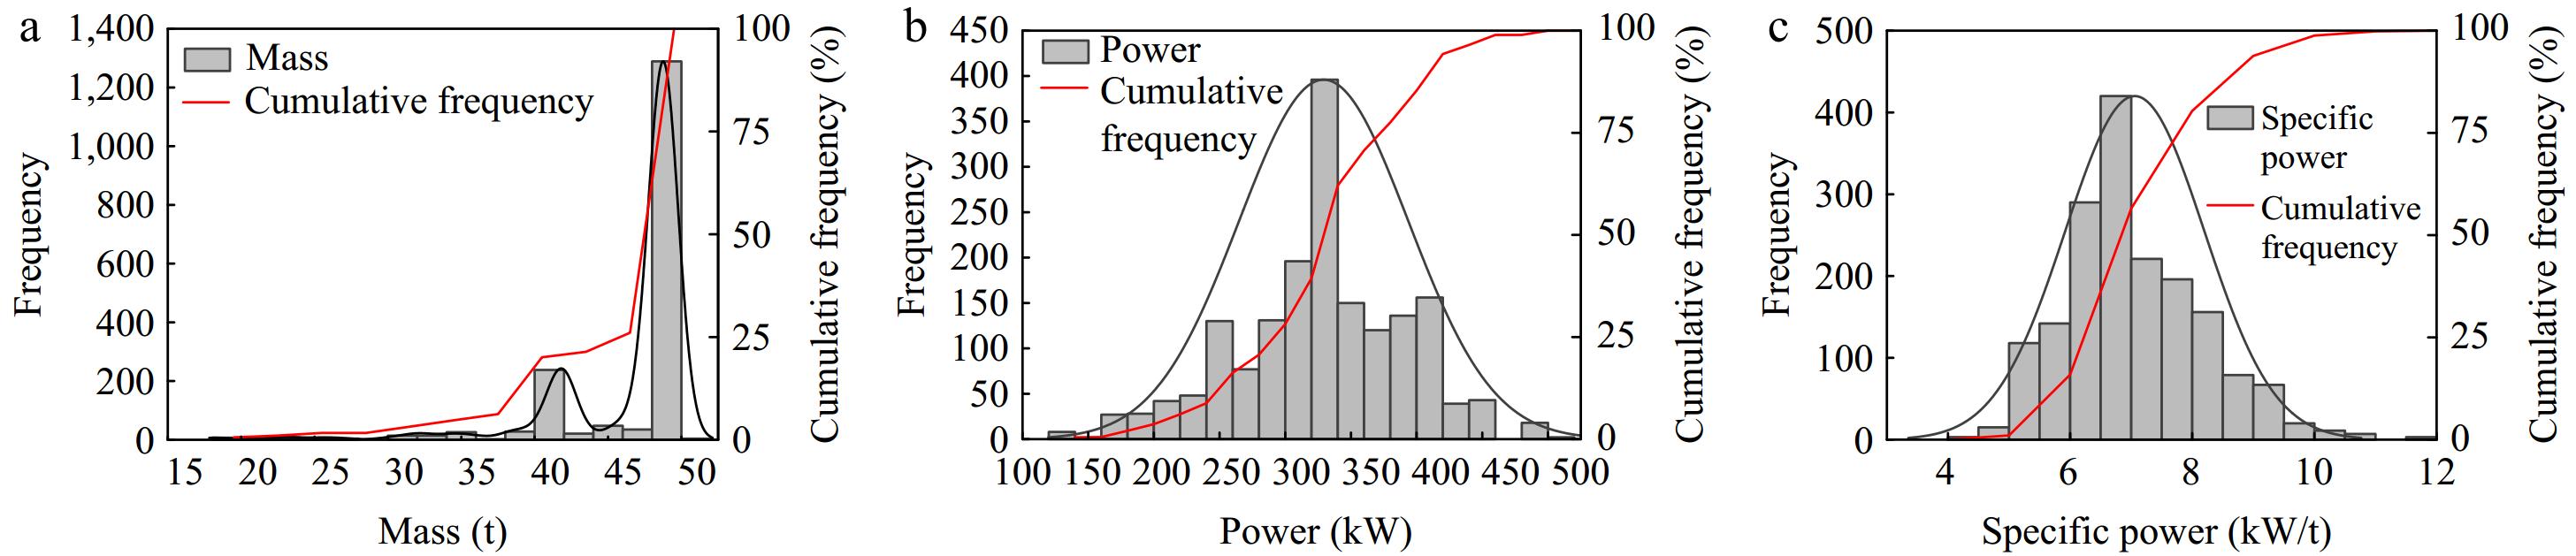
Figure 4.
Distribution of mass, power, and specific power. (a) Mass distribution. (b) Power distribution. (c) Specific power distribution.
-
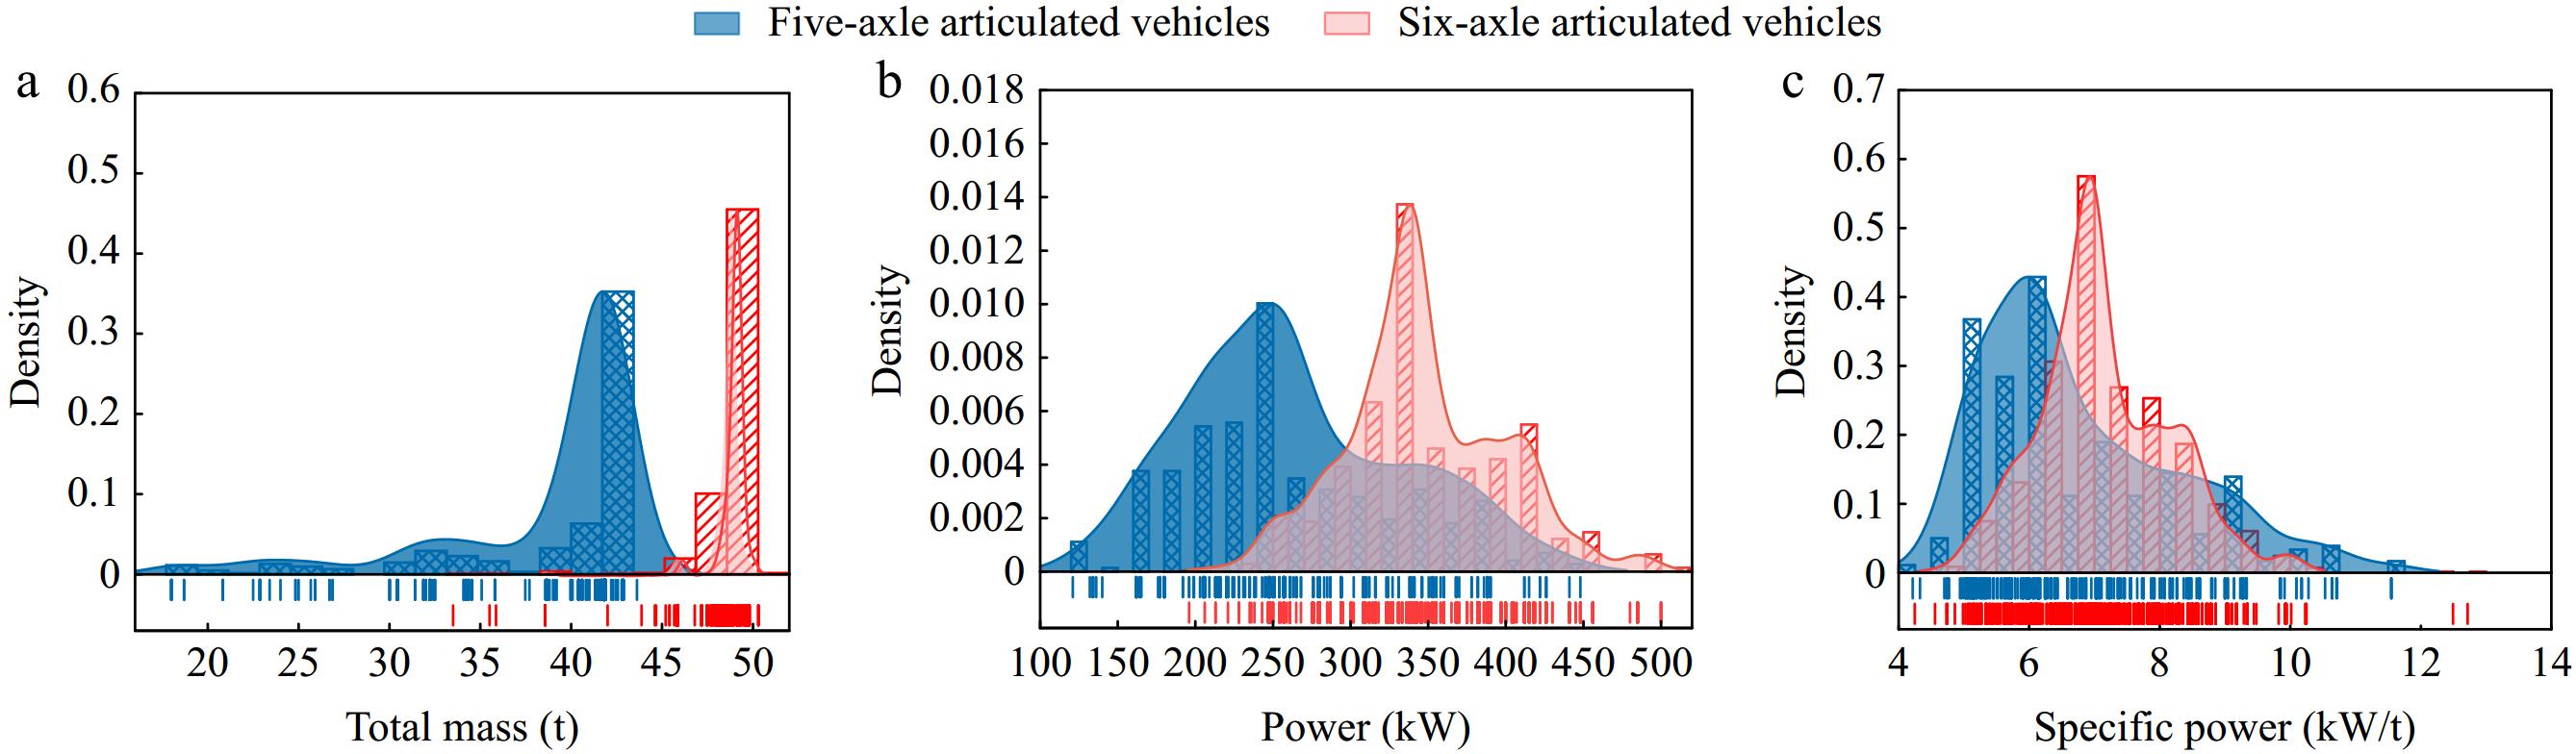
Figure 5.
Comparison of mass, power, and specific power distributions of five-axle and six-axle articulated trains. The higher the specific power, the better the climbing performance. (a) Total mass. (b) Power. (c) Specific power.
-
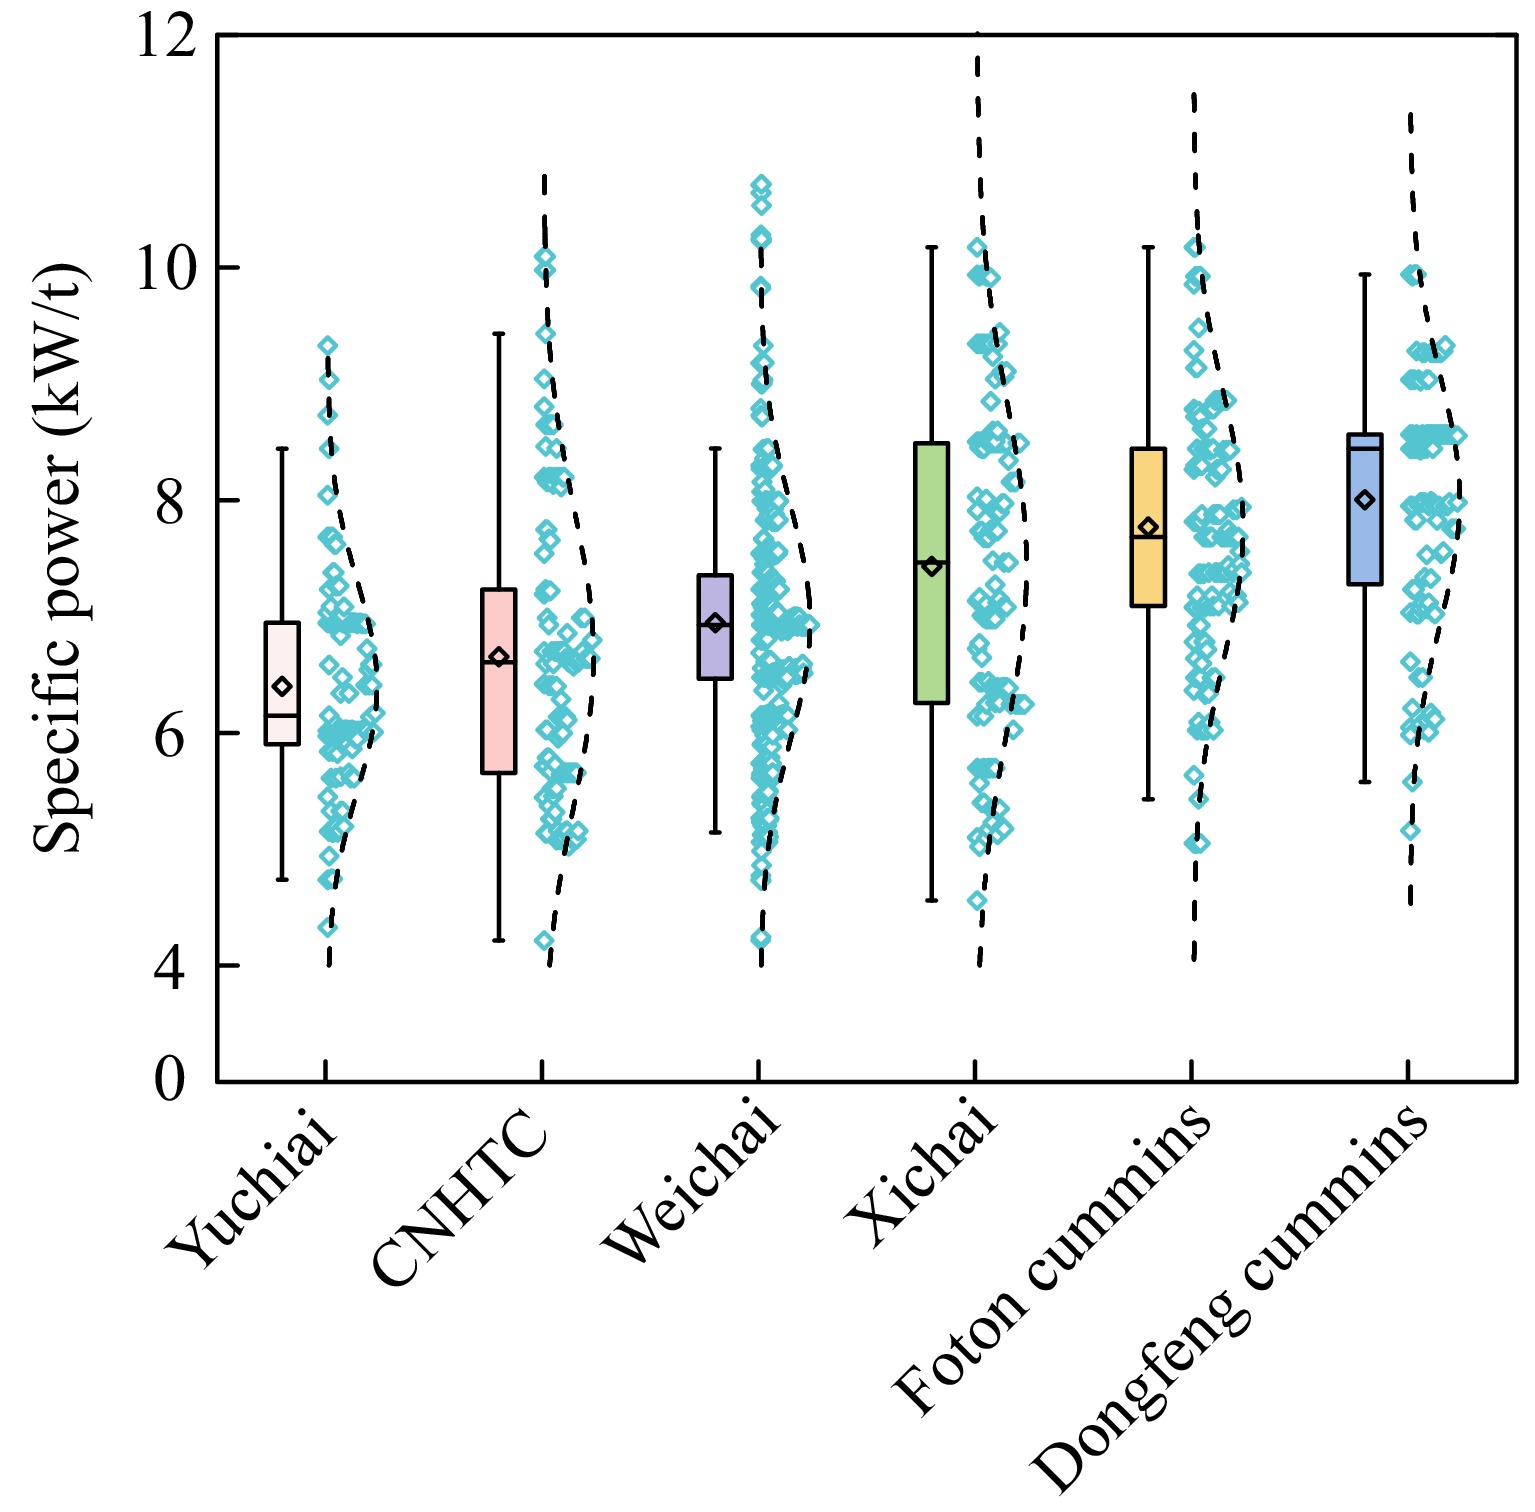
Figure 6.
Specific power boxplot and distribution characteristics.
-
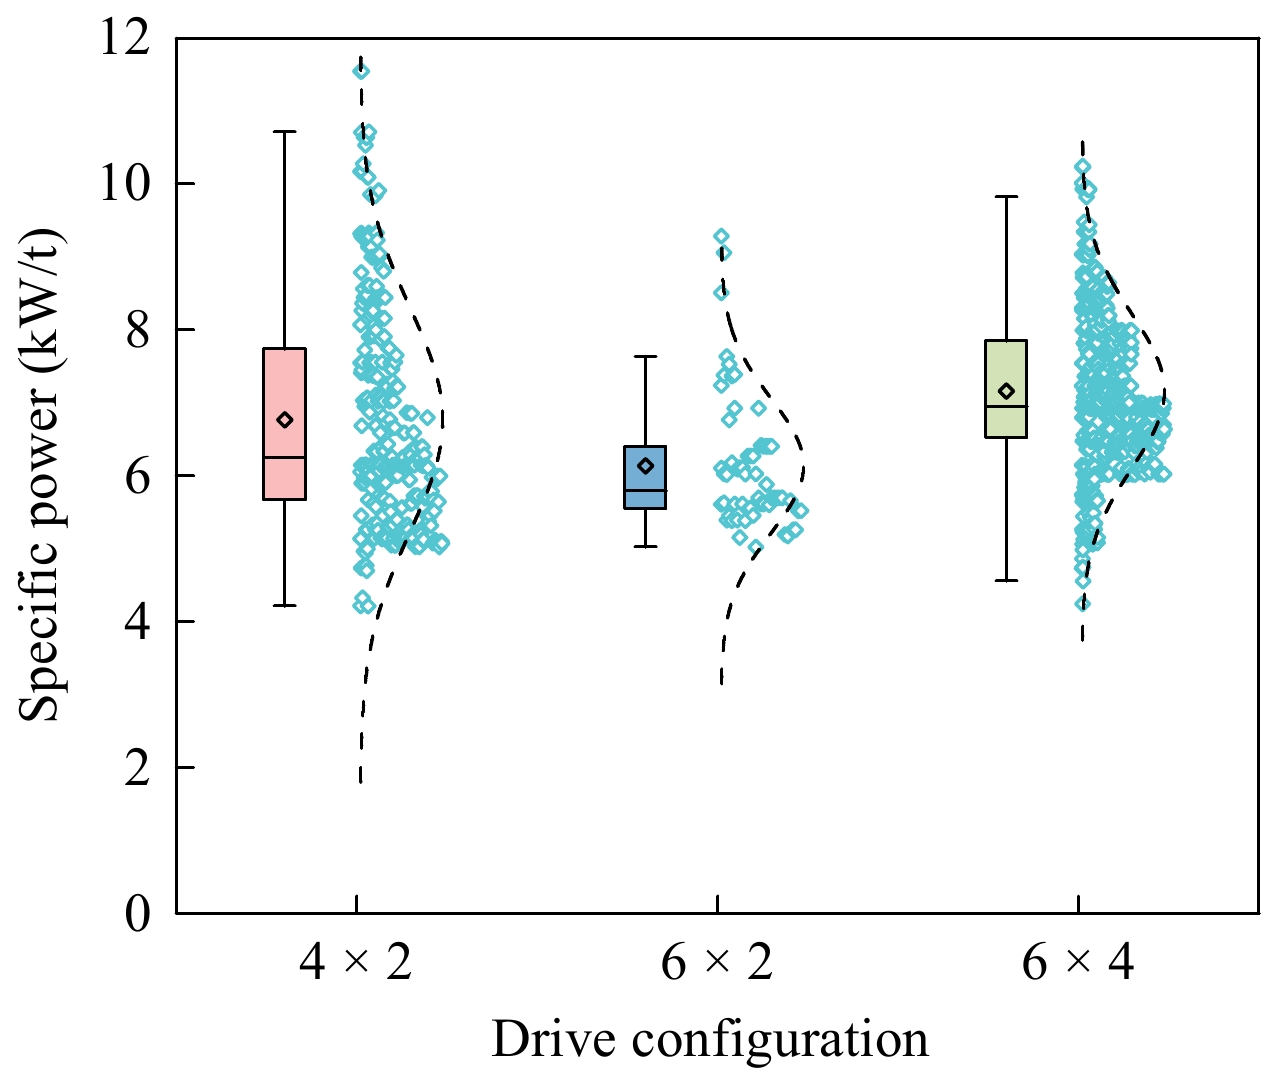
Figure 7.
Tractor drive configuration and specific power distribution of tractor vehicles.
-
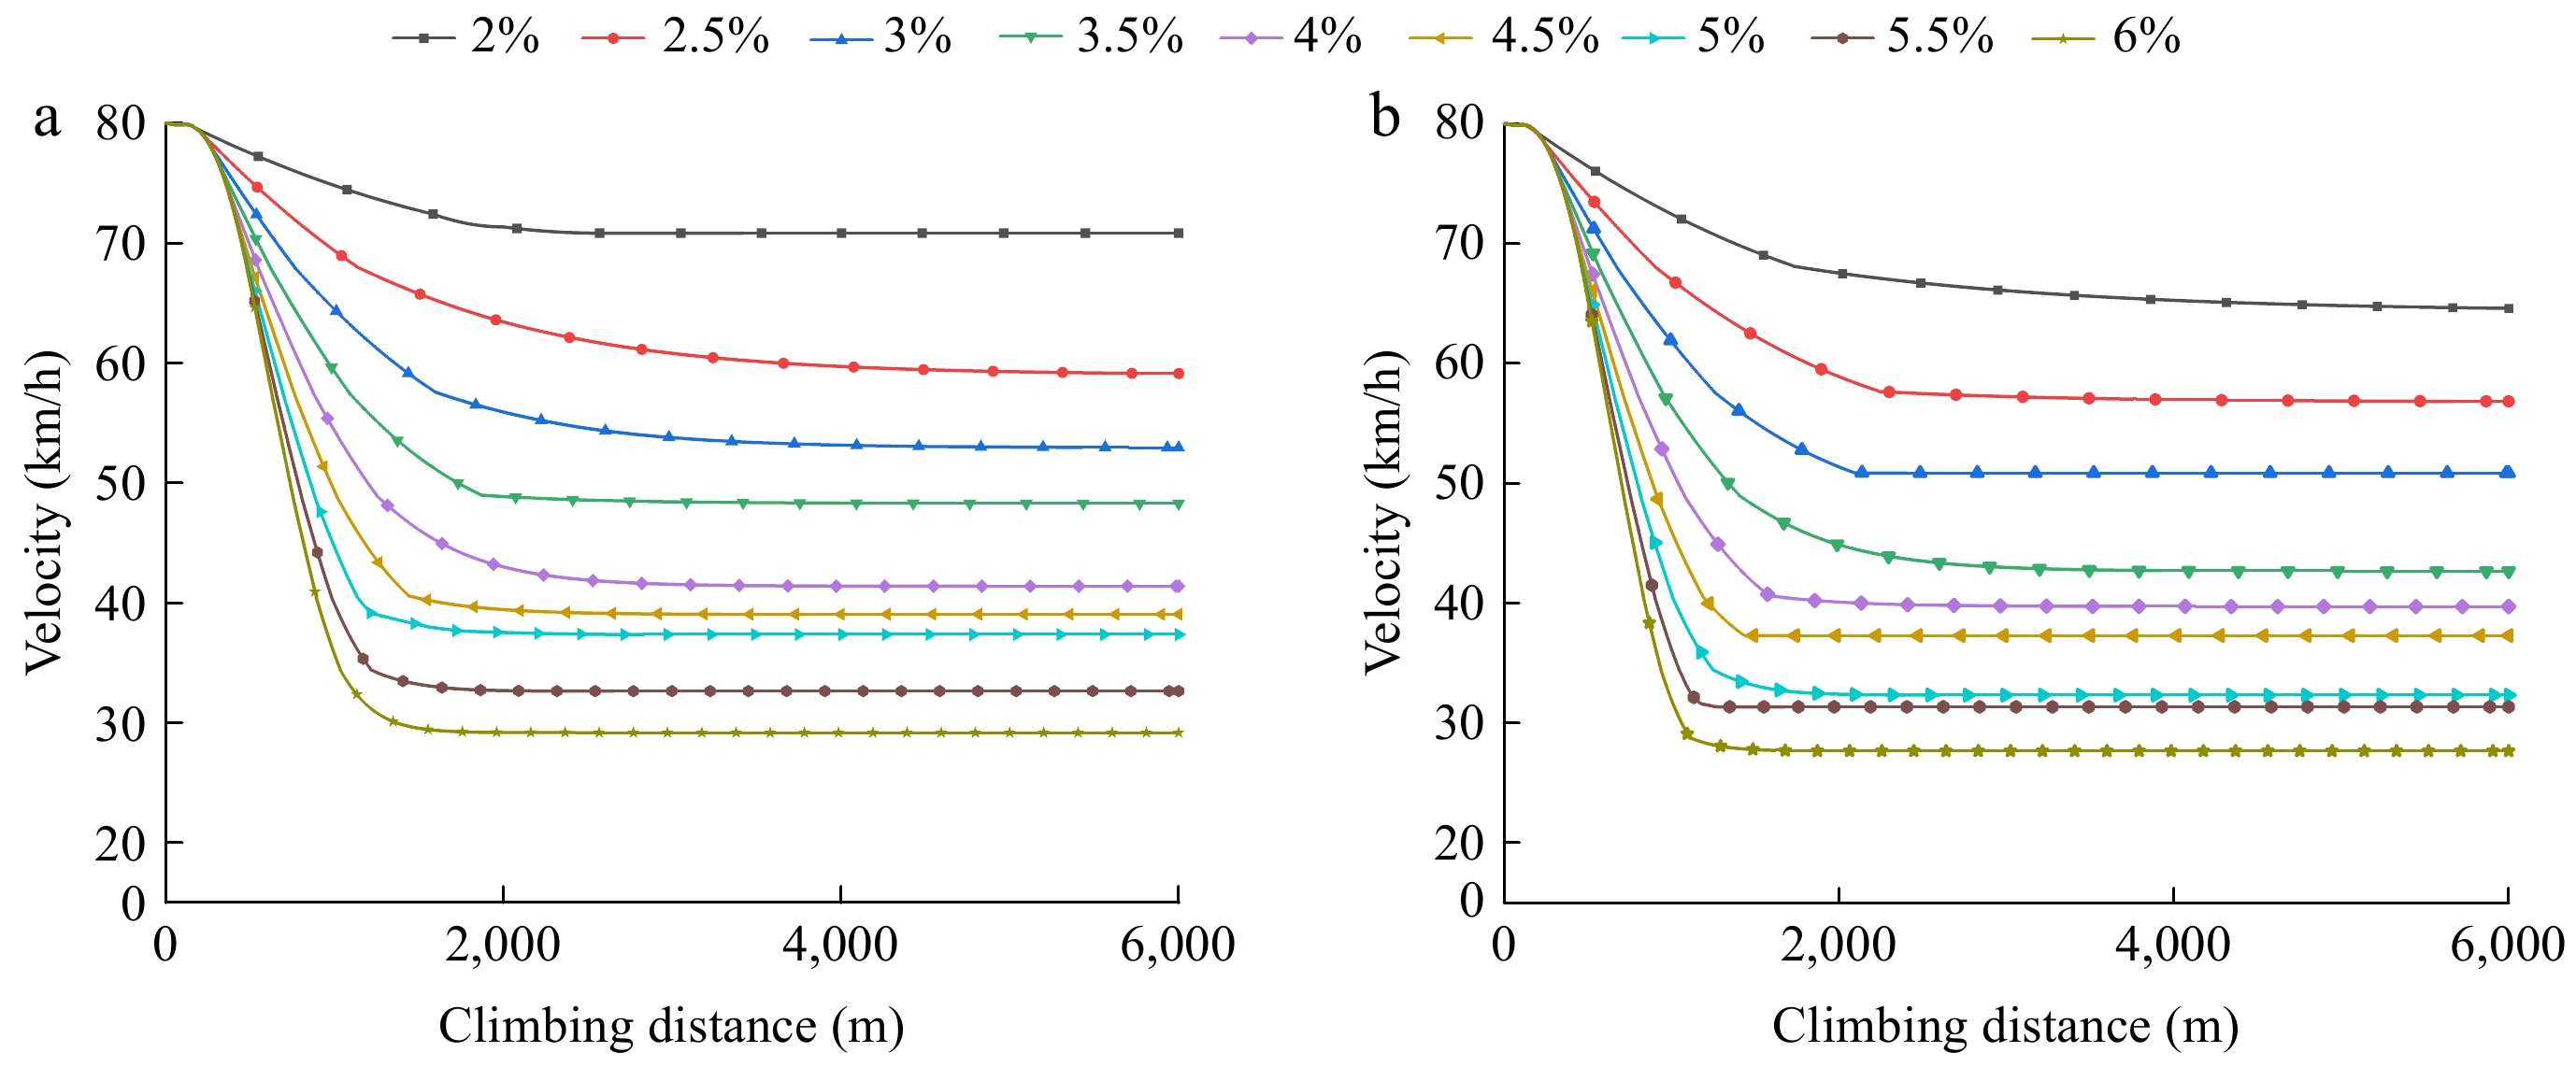
Figure 8.
Velocity decay curves for different longitudinal slope gradients. Specific power: (a) 6.94 kW/t, (b) 6.32 kW/t.
-
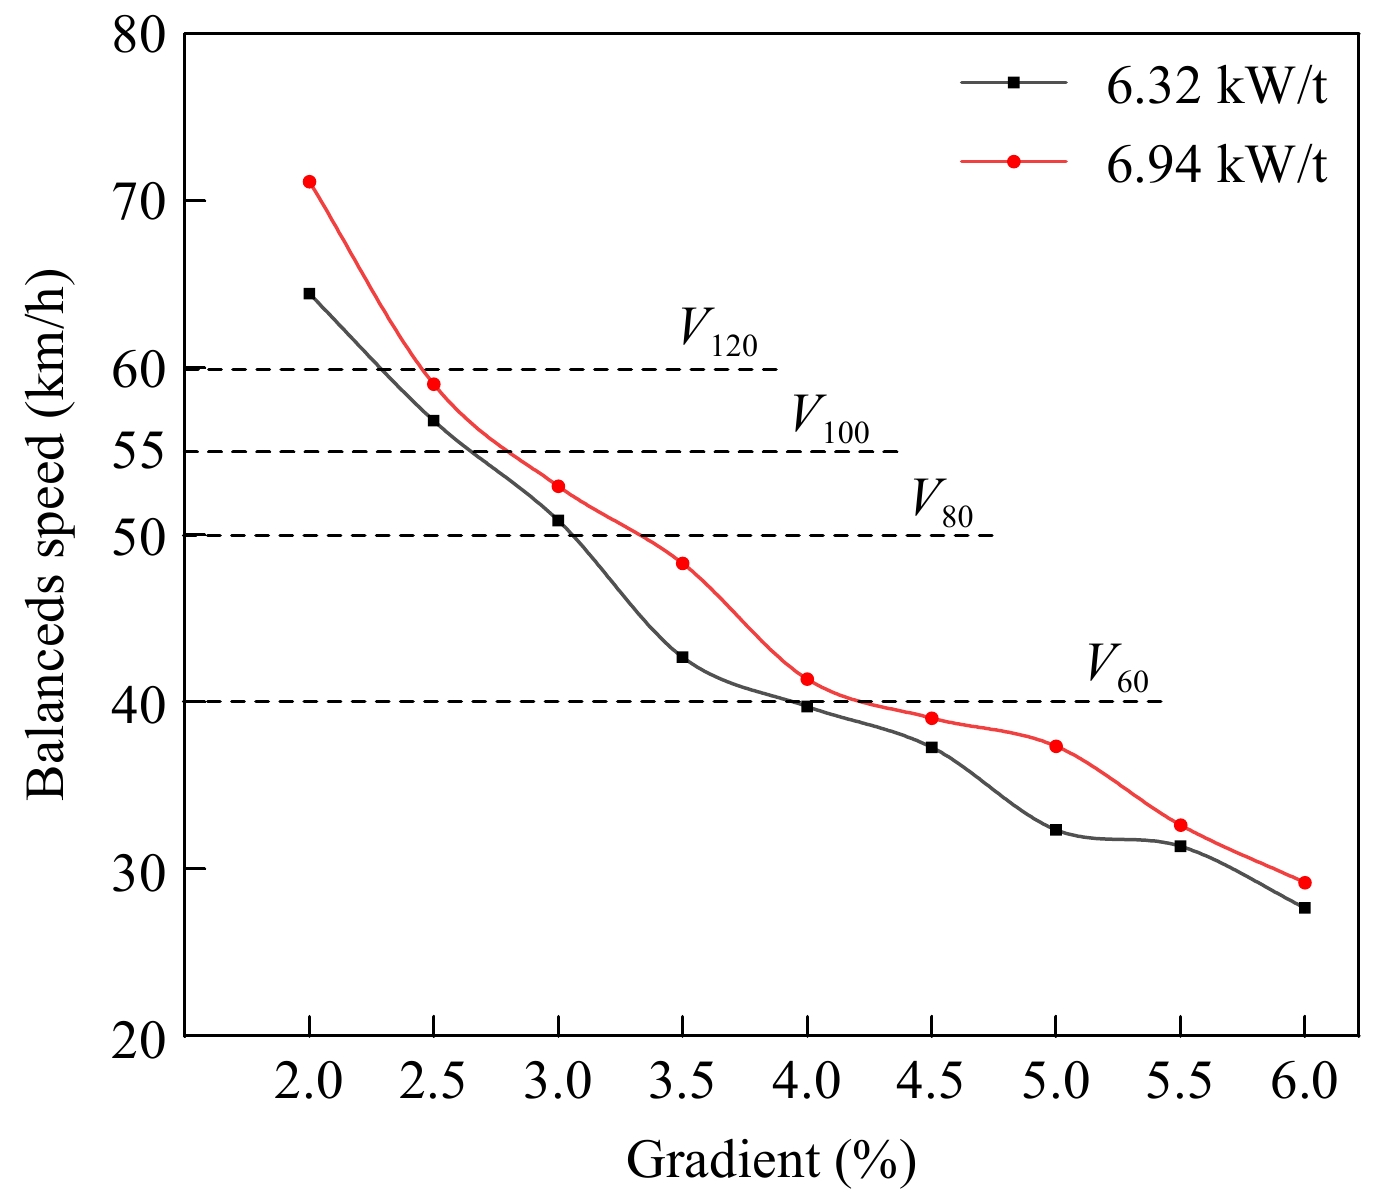
Figure 9.
Equilibrium speed with different specific powers and minimum allowable speed of vehicles.
-
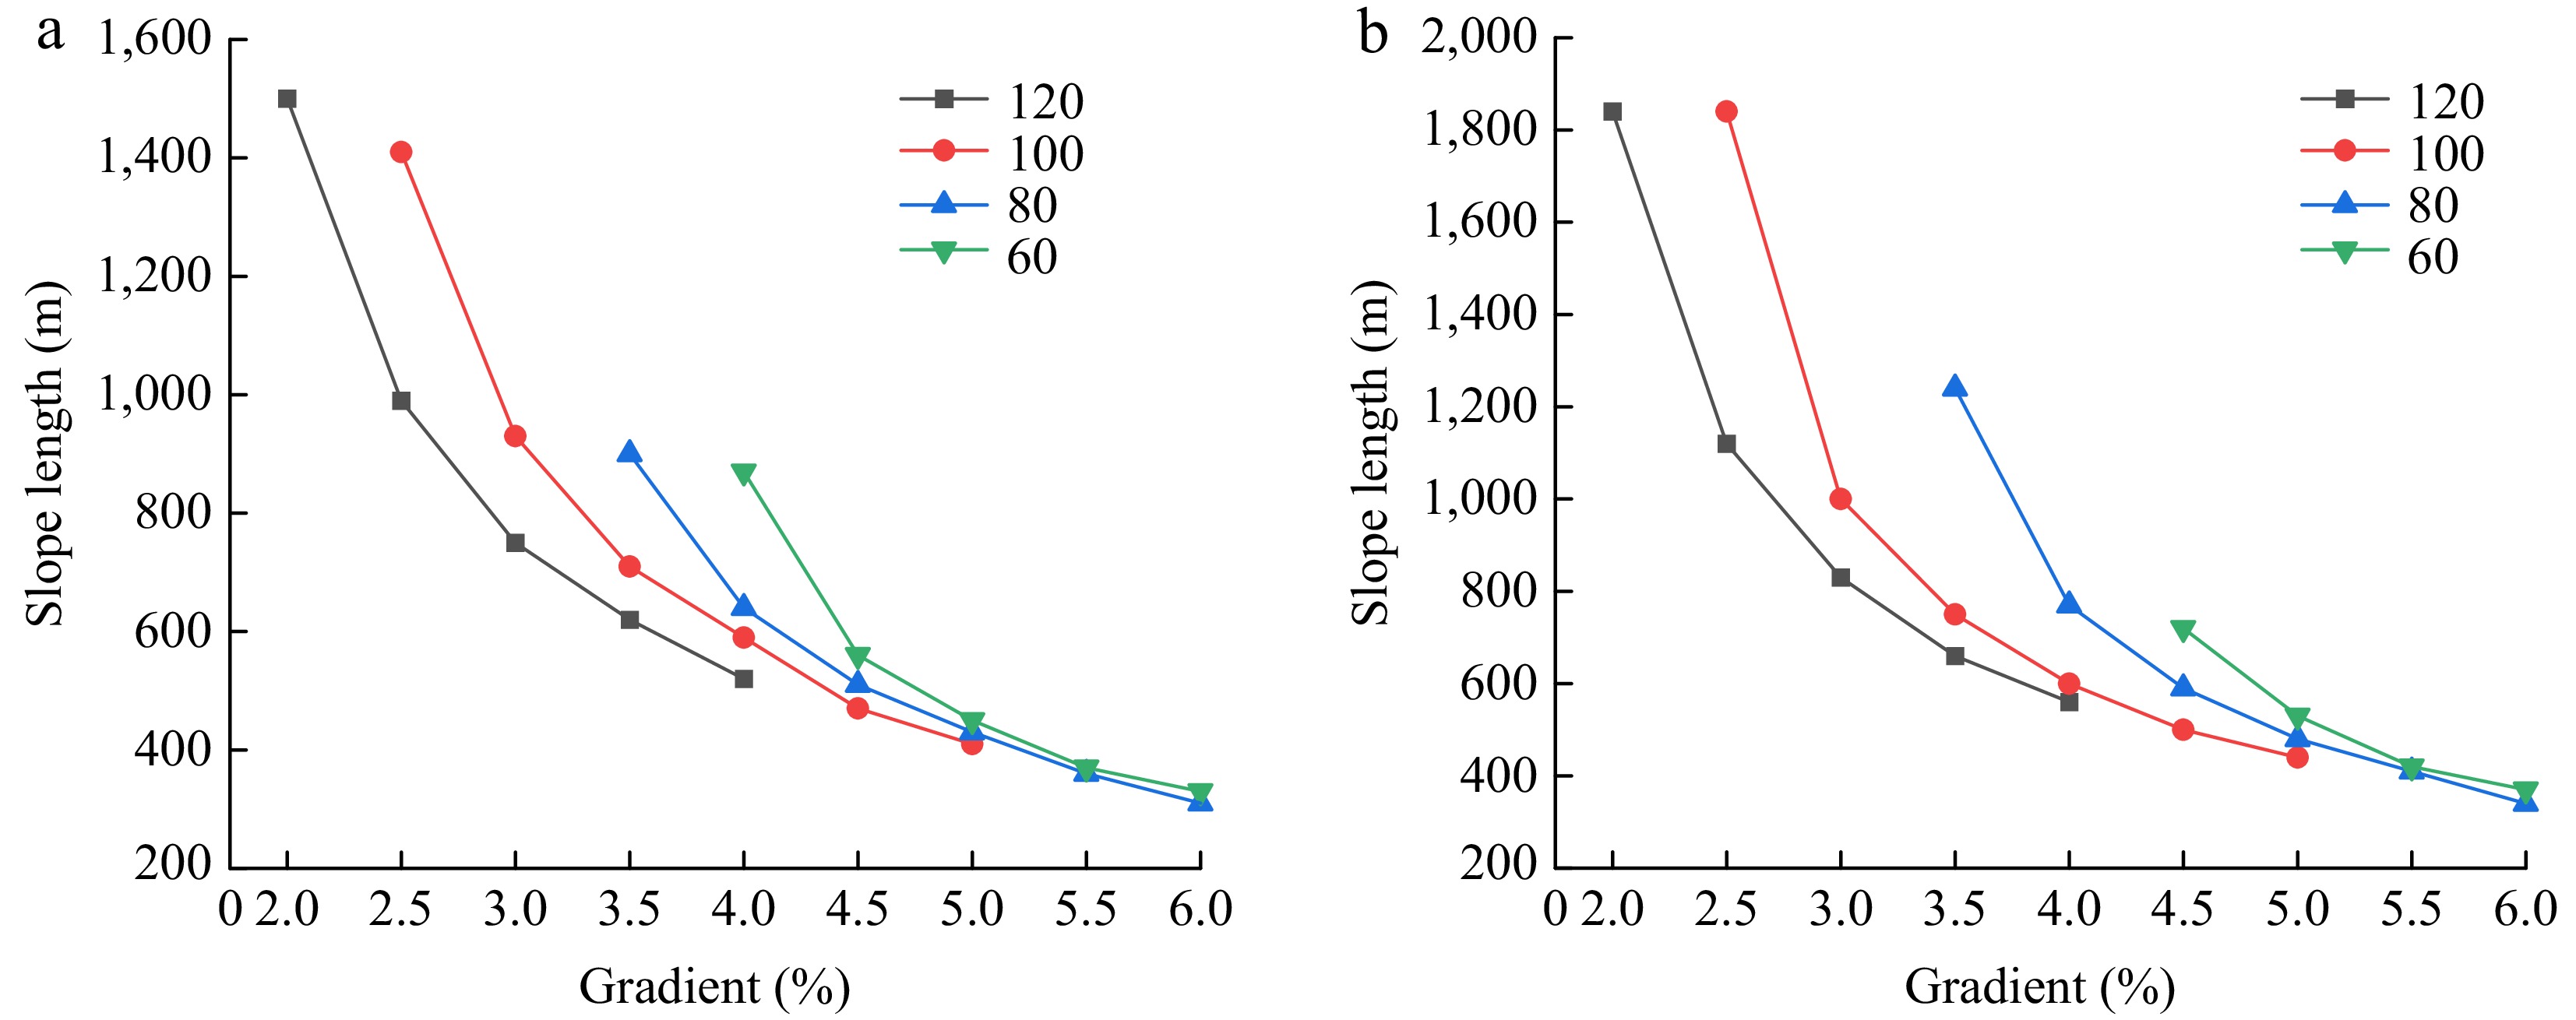
Figure 10.
The uphill slope length that simulated vehicles with different power ratios traverse when reaching speed attenuation at different design speeds and slopes. (a) 6.32 kW/t. (b) 6.94 kW/t.
-
Vehicle type Number of sample drawings Data accuracy (%) Two-axle tractor 37 100 Three-axle tractor 140 100 Semi-trailer 35 100 Table 1.
Verification of vehicle data accuracy.
-
Parameter Tractor Semi-trailer Load Mass (kg) 11,560 5,500 30,408/26,167 Height (mm) 3,680 3,068 3,000 Length (mm) 7,110 11,896 8,500 Width (mm) 2,530 2,565 2,000 Power (kW) 300 / / Specific power (kW/t) 6.32/6.94 / / Table 2.
Simulated parameter settings of the car model.
-
Indicators Area 15th 25th 50th 75th 85th Average Mass (t) China 41.81 47.72 48.80 48.81 48.87 46.54 Europe and America 38.03 39.51 42.01 45.00 45.01 42.09 Power (kW) China 257.00 294.00 338.00 368.00 397.00 329.25 Europe and America 364.15 368.00 411.50 473.75 522.70 427.50 Specific power (kW/t) China 5.94 6.32 6.94 7.81 8.29 7.05 Europe and America 8.82 9.11 9.83 10.53 11.73 10.12 Table 3.
Total mass, power, and specific power characteristic quantile.
-
Vehicle type D Z Asymptotic significance Five-axle articulated truck 0.36704 6.20021 5.829 × 10⁻³⁴ Six-axle articulated truck Table 4.
K-S test of specific power of five-axle and six-axle articulated trucks.
-
Tractor axle type Specific power (kW/t) Initial velocity (km/h) Gradient 6 × 4 6.32, 6.94 80 2.0%, 2.5%, 3.0%, 3.5%, 4.0%, 4.5%, 5.0%, 5.5%, 6.0% Table 5.
Equilibrium speed simulation conditions.
-
Design speed (km/h) Maximum longitudinal grade (%) 120 Simulative 2.0 Code 3.0 100 Simulative 2.5 Code 4.0 80 Simulative 3.0 Code 5.0 60 Simulative 3.5 Code 6.0 Table 6.
Maximum longitudinal slopes for different design speeds.
-
Design speed (km/h) Bottom slope velocity (km/h) Speed reduction (km/h) Gradient (%) 120 98 20 2~4 100 85 20 2~5 80 70 20 2~6 60 55 15 2~6 Table 7.
Simulation conditions for maximum slope length.
-
Gradient (%) Grade length control values under different design speeds (m) 120 km/h 100 km/h 80 km/h 60 km/h Simulative Code Simulative Code Simulative Code Simulative Code 2.0 1,840 / Not limited / Not limited / Not limited / 3.0 830 900 1,000 1,000 Not limited 1,100 Not limited 1,200 4.0 560 700 600 800 770 900 Not limited 1,000 5.0 / / 440 600 480 700 530 800 6.0 / / / / 340 500 370 600 Table 8.
Maximum slope lengths corresponding to different design speeds and longitudinal slopes.
Figures
(10)
Tables
(8)