-
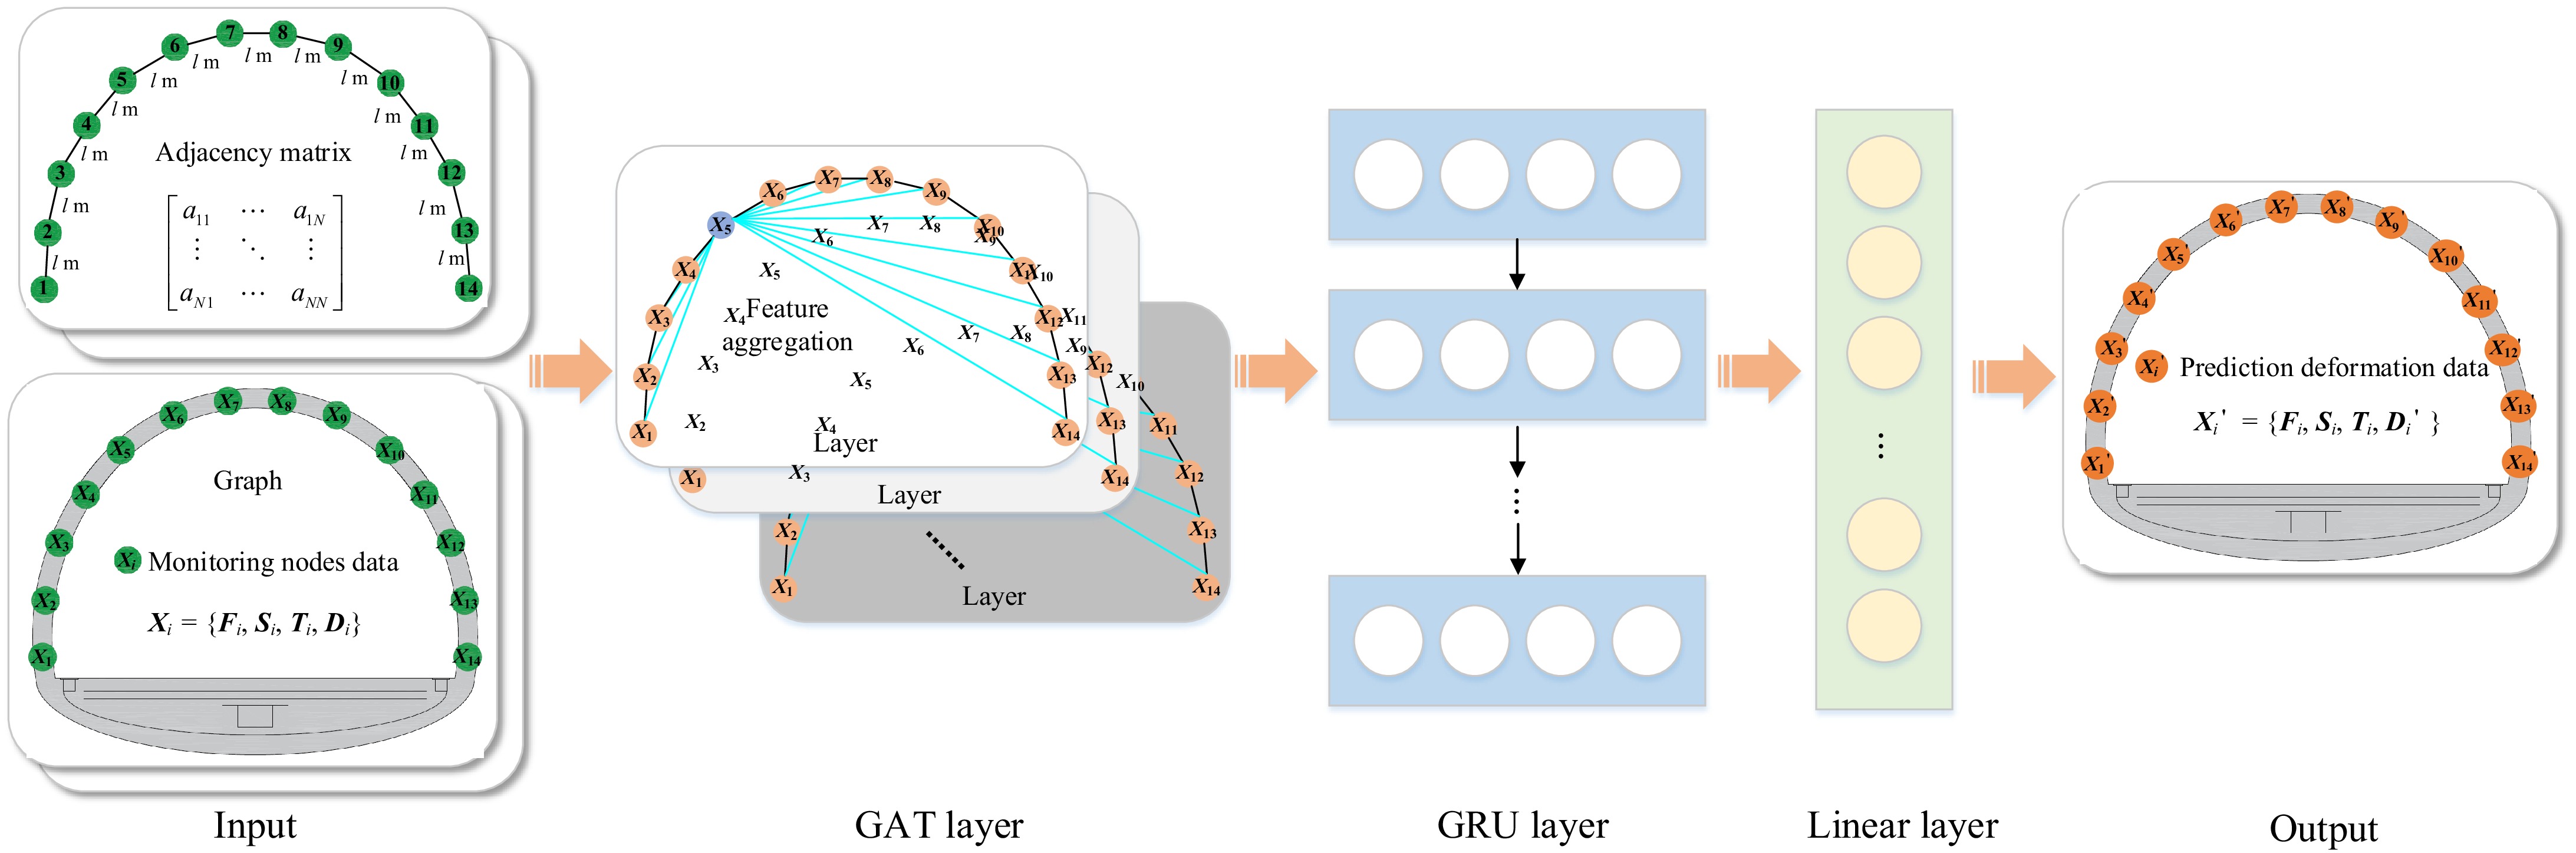
Figure 1.
The framework of the deformation prediction method.
-
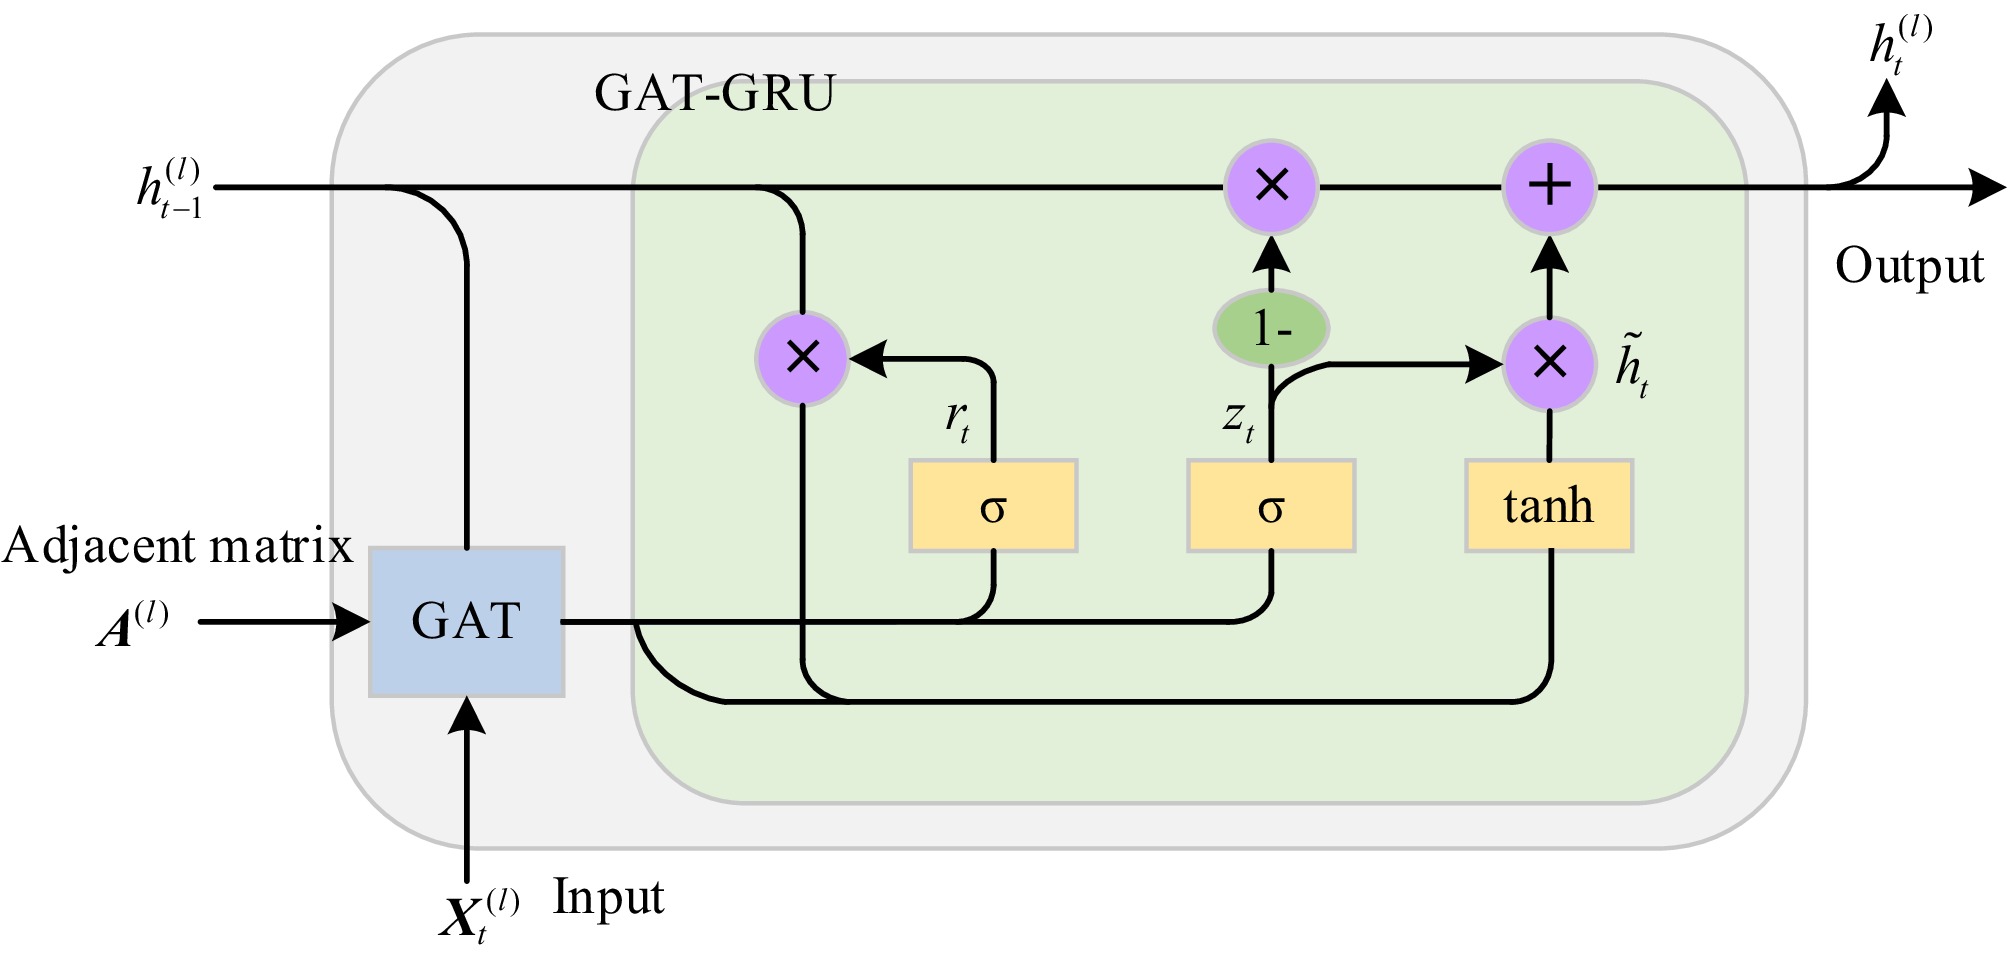
Figure 2.
Structure of the GAT-GRU network.
-
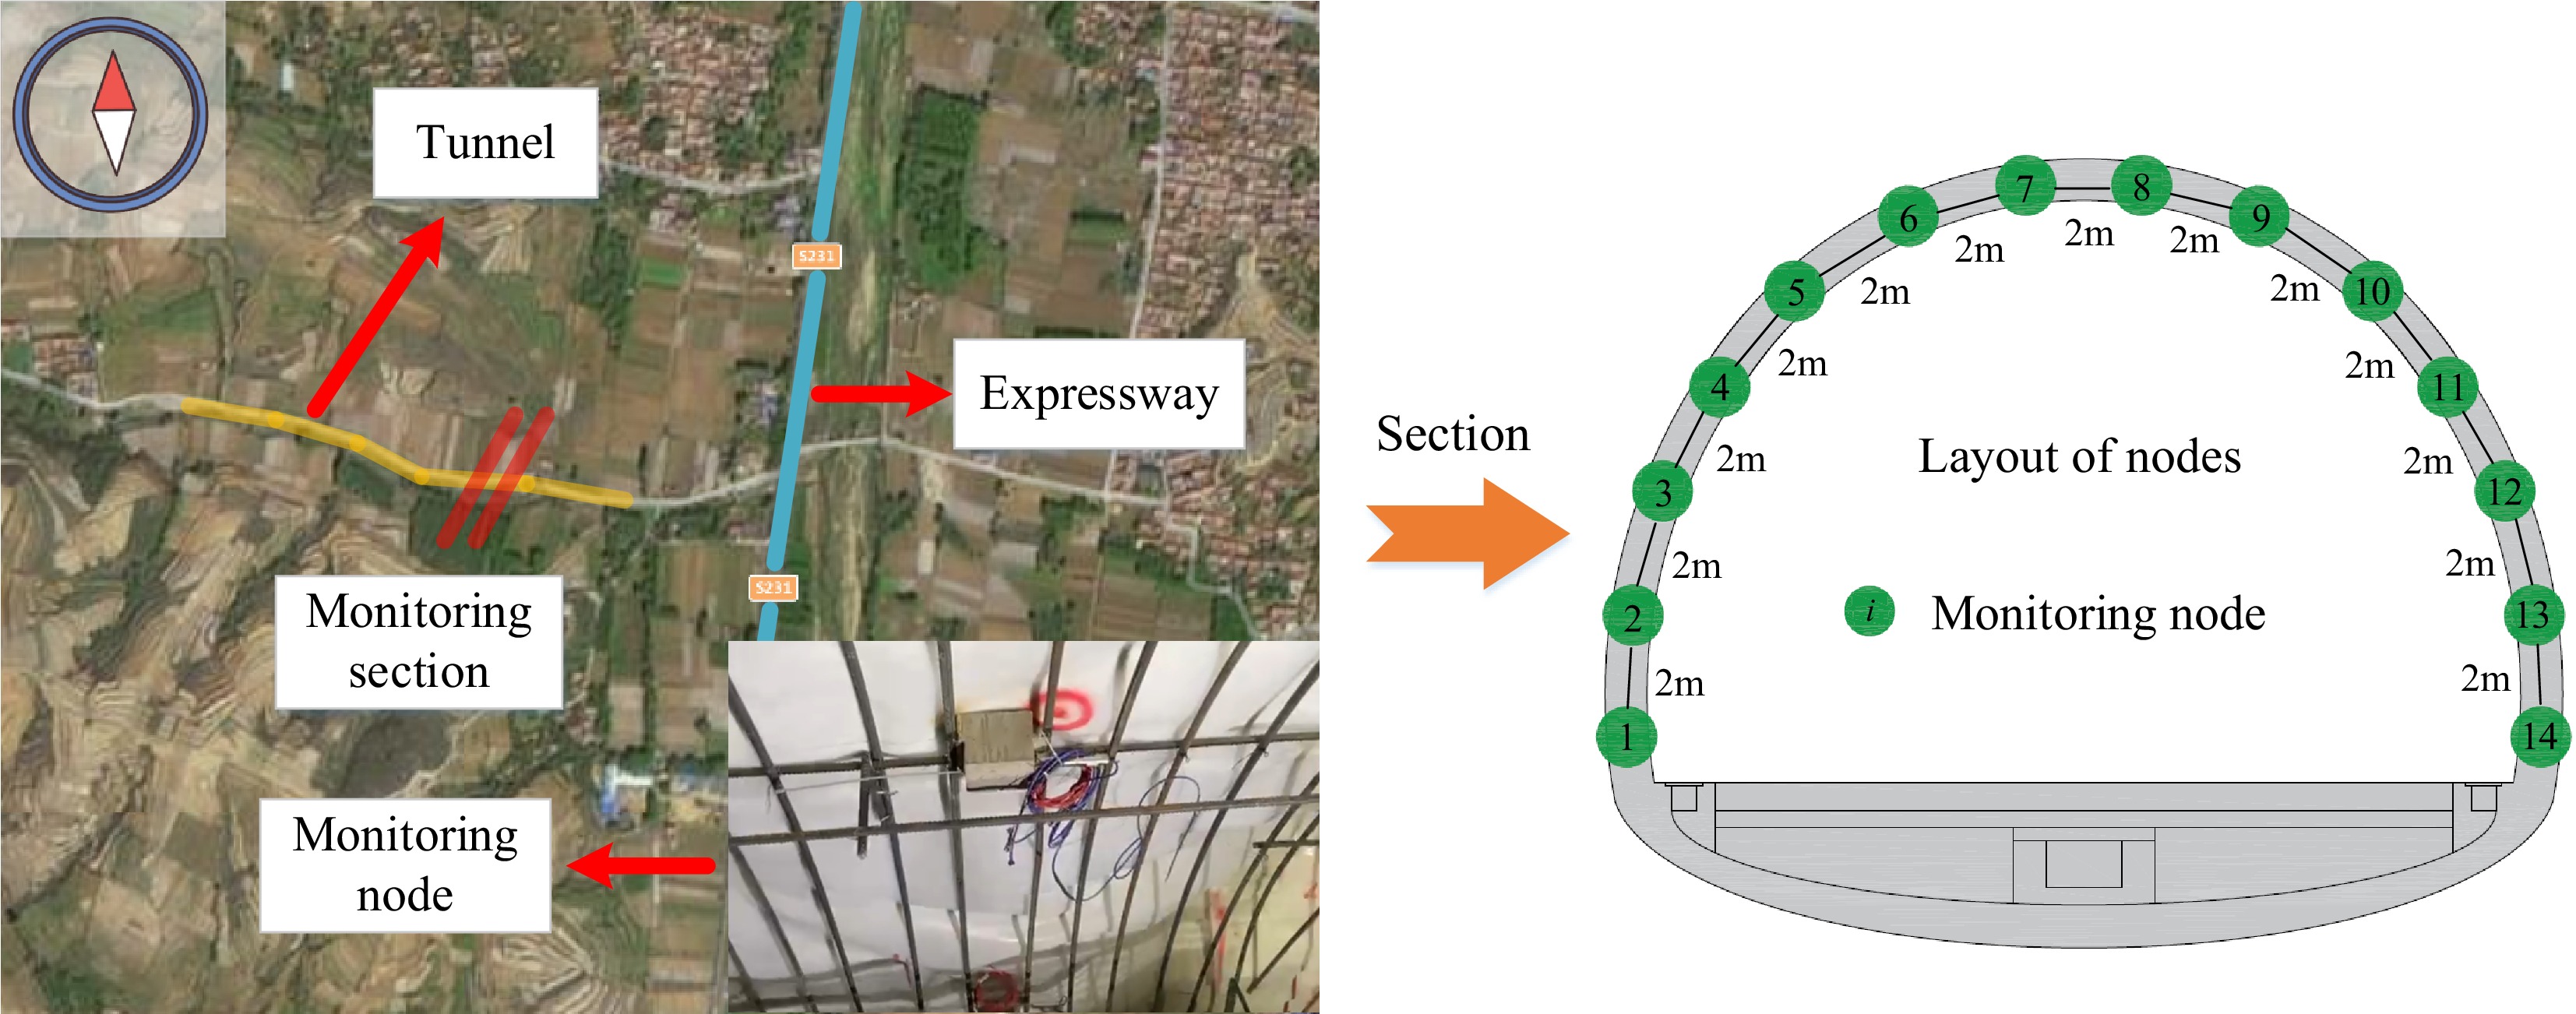
Figure 3.
Location and layout of the deformation monitoring system.
-
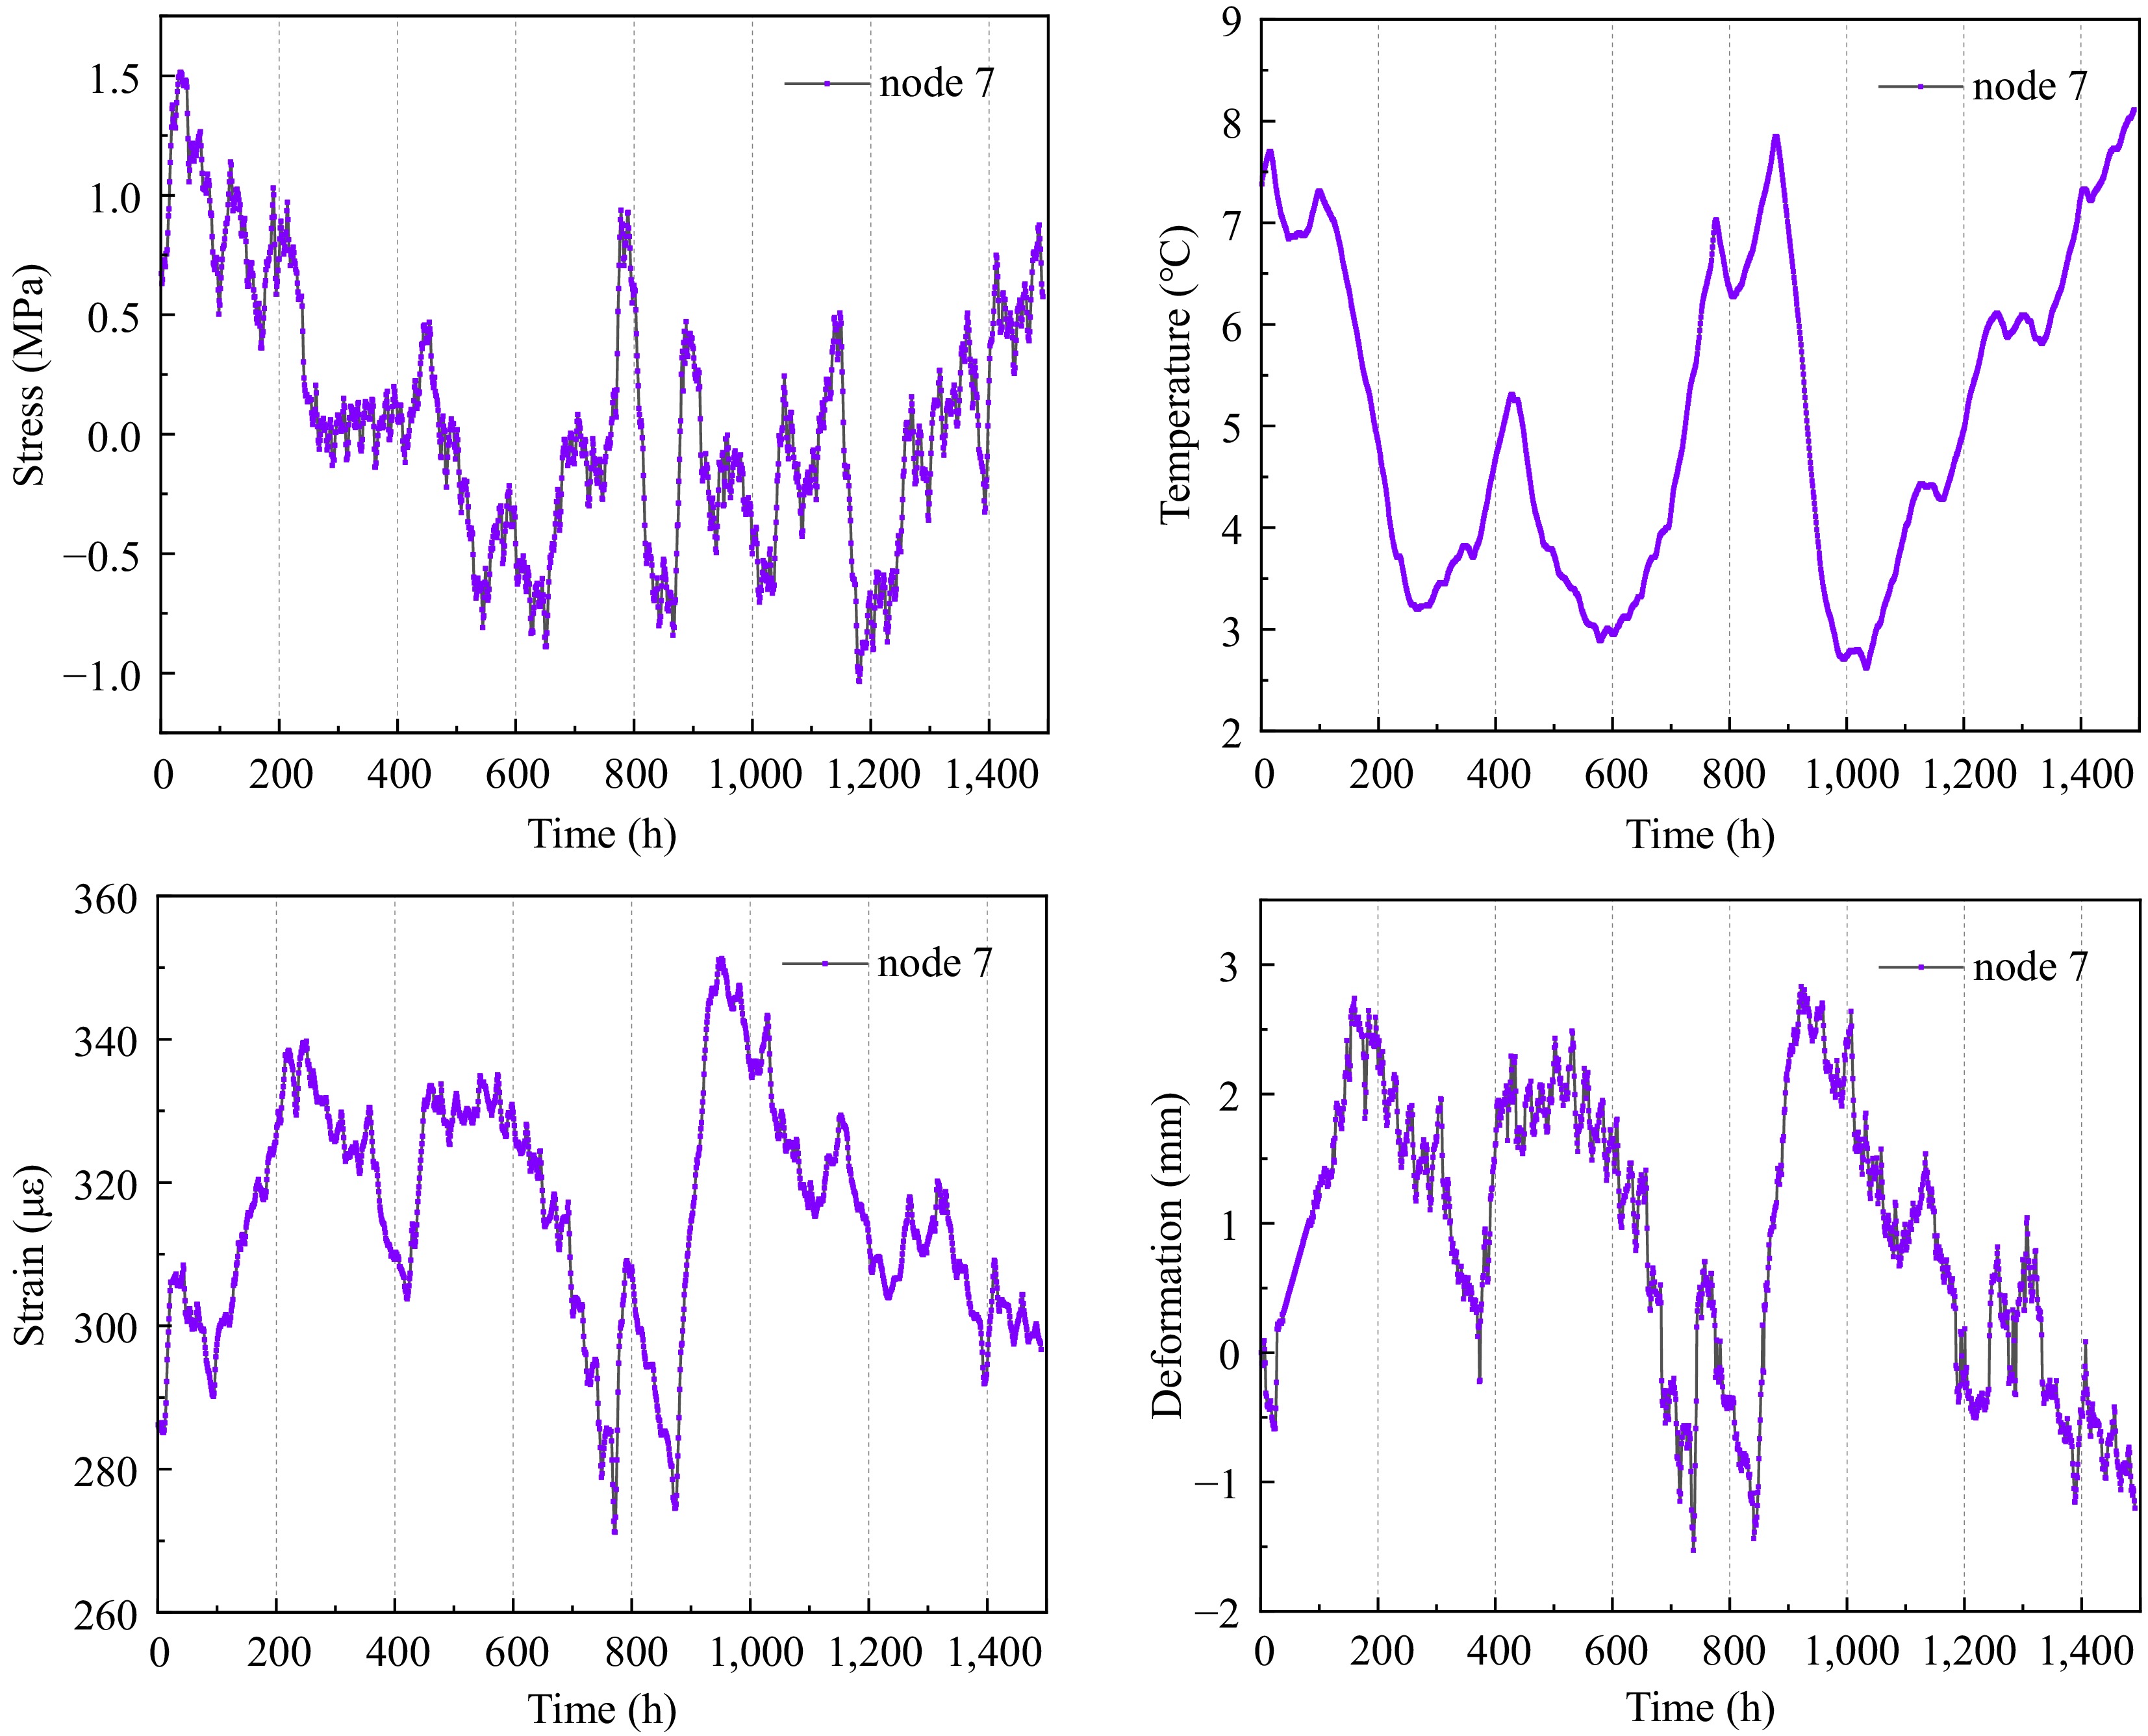
Figure 4.
Monitoring data of different factors. (a) Stress, (b) temperature, (c) strain, and (d) deformation.
-
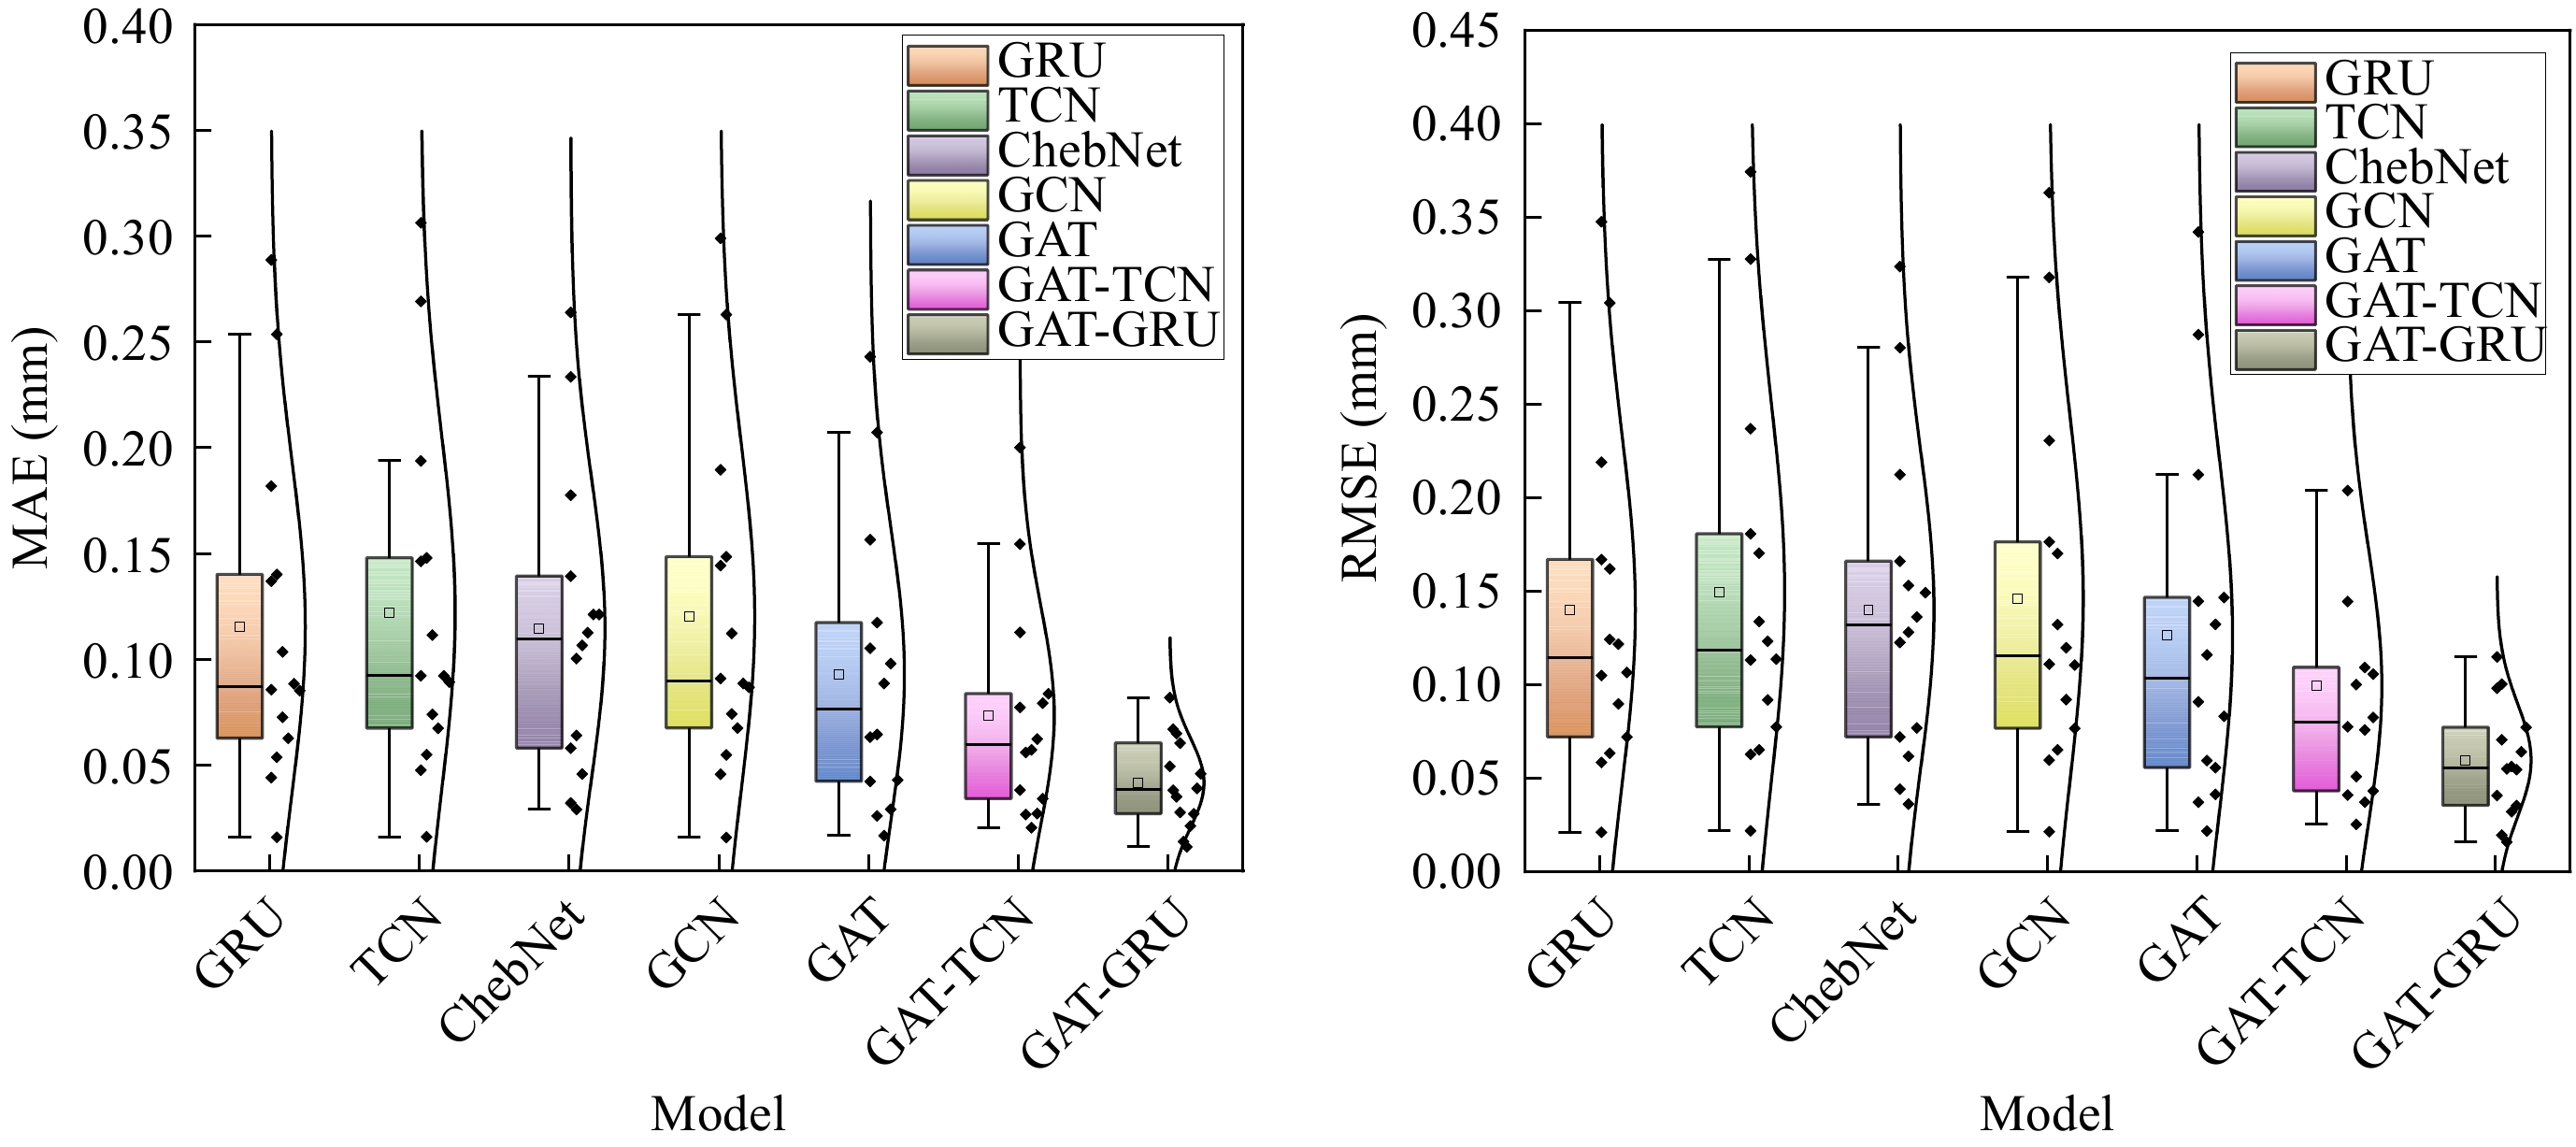
Figure 5.
Comparison of the accuracy of different models at different monitoring locations. (a) MAE, and (b) RMSE.
-
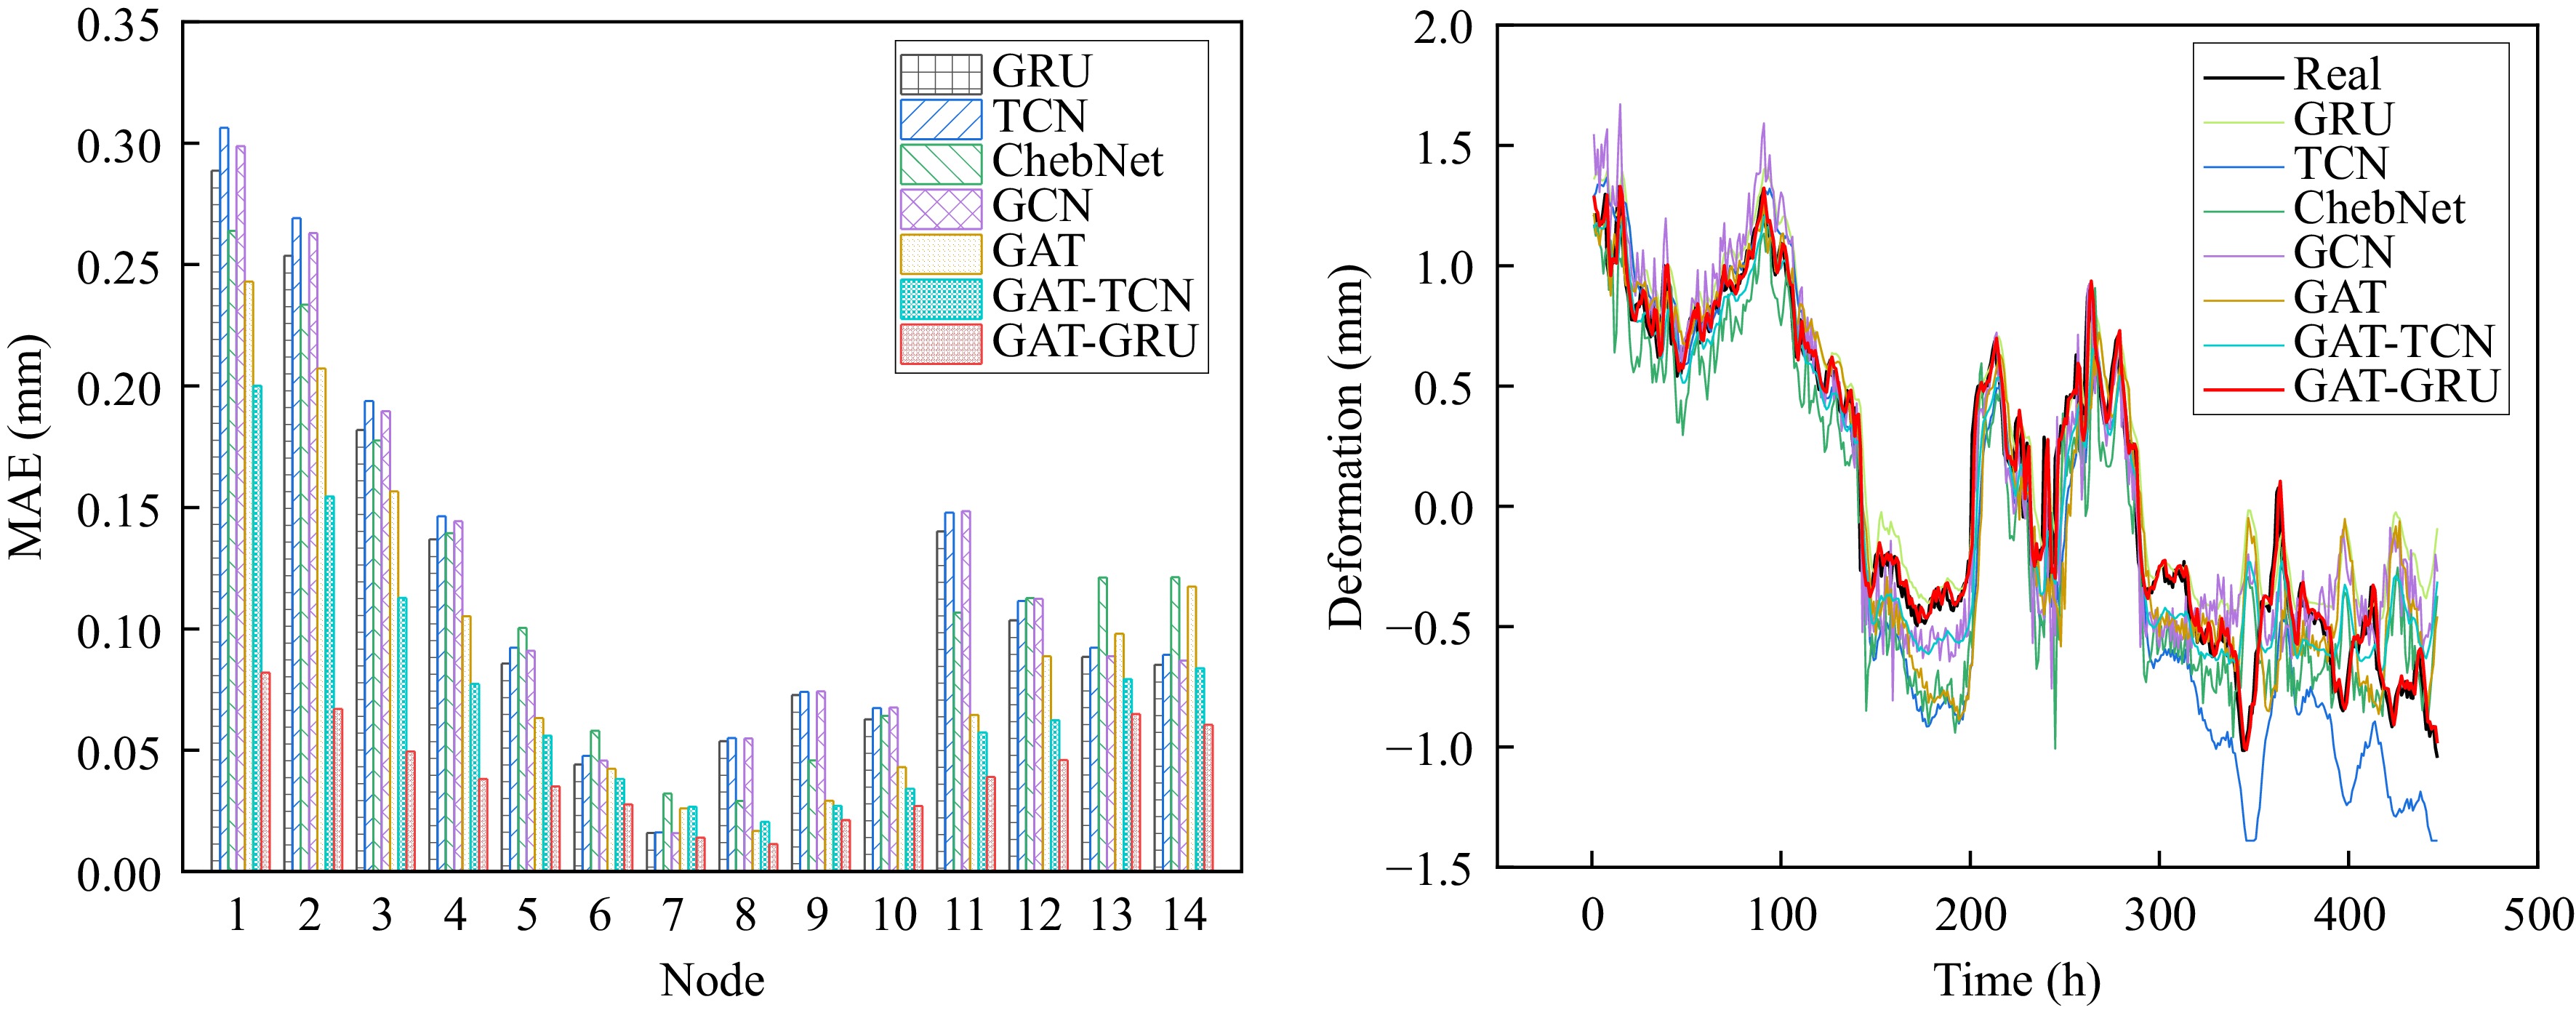
Figure 6.
Comparison of prediction results for each model. (a) MAE at each node, (b) typical node (node 1).
-
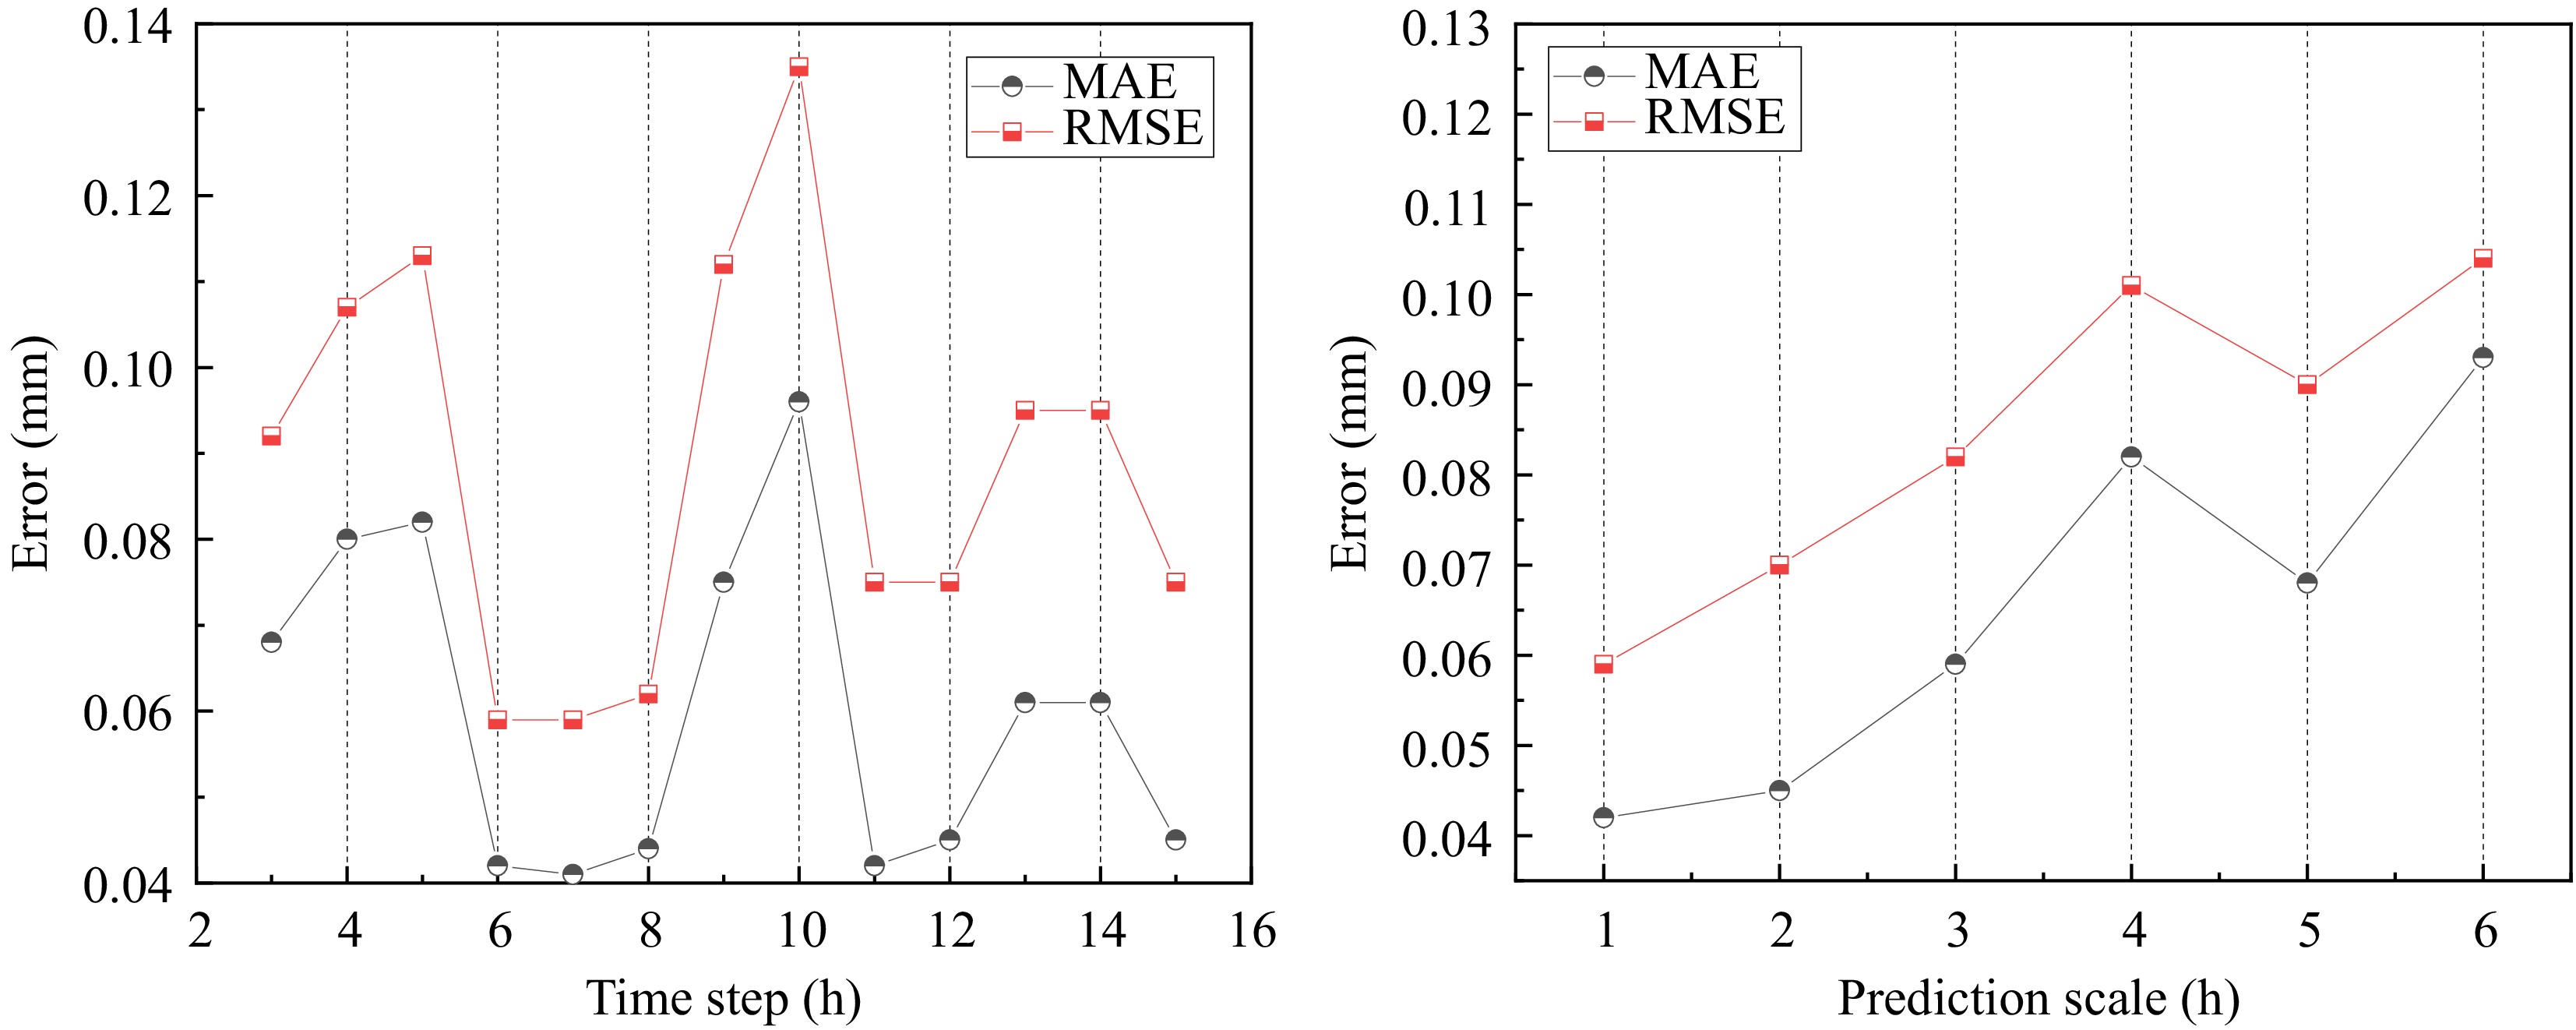
Figure 7.
The predictive capability of the model under different conditions. (a) Time step, and (b) prediction scale.
-
Parameter Range Selected value hidden_feature (GAT) 6, 12, 24 6 num_head (GAT) 2, 4, 6, 8 2 hidden_size (GRU) 64, 128, 256 64 num_layer (GRU) 1, 2, 3 2 learning_rate 0.001, 0.01, 0.1 0.01 batch_size 16, 32, 64 64 num_epoch 50, 100, 150, 200 150 Table 1.
Selection of parameters.
-
Model MAE (mm) RMSE (mm) GRU 0.115 0.14 TCN 0.122 0.149 ChebNet 0.115 0.14 GCN 0.12 0.146 GAT 0.093 0.126 GAT-TCN 0.074 0.099 GAT-GRU 0.042 0.059 Table 2.
Comparison of model accuracy.
Figures
(7)
Tables
(2)