-
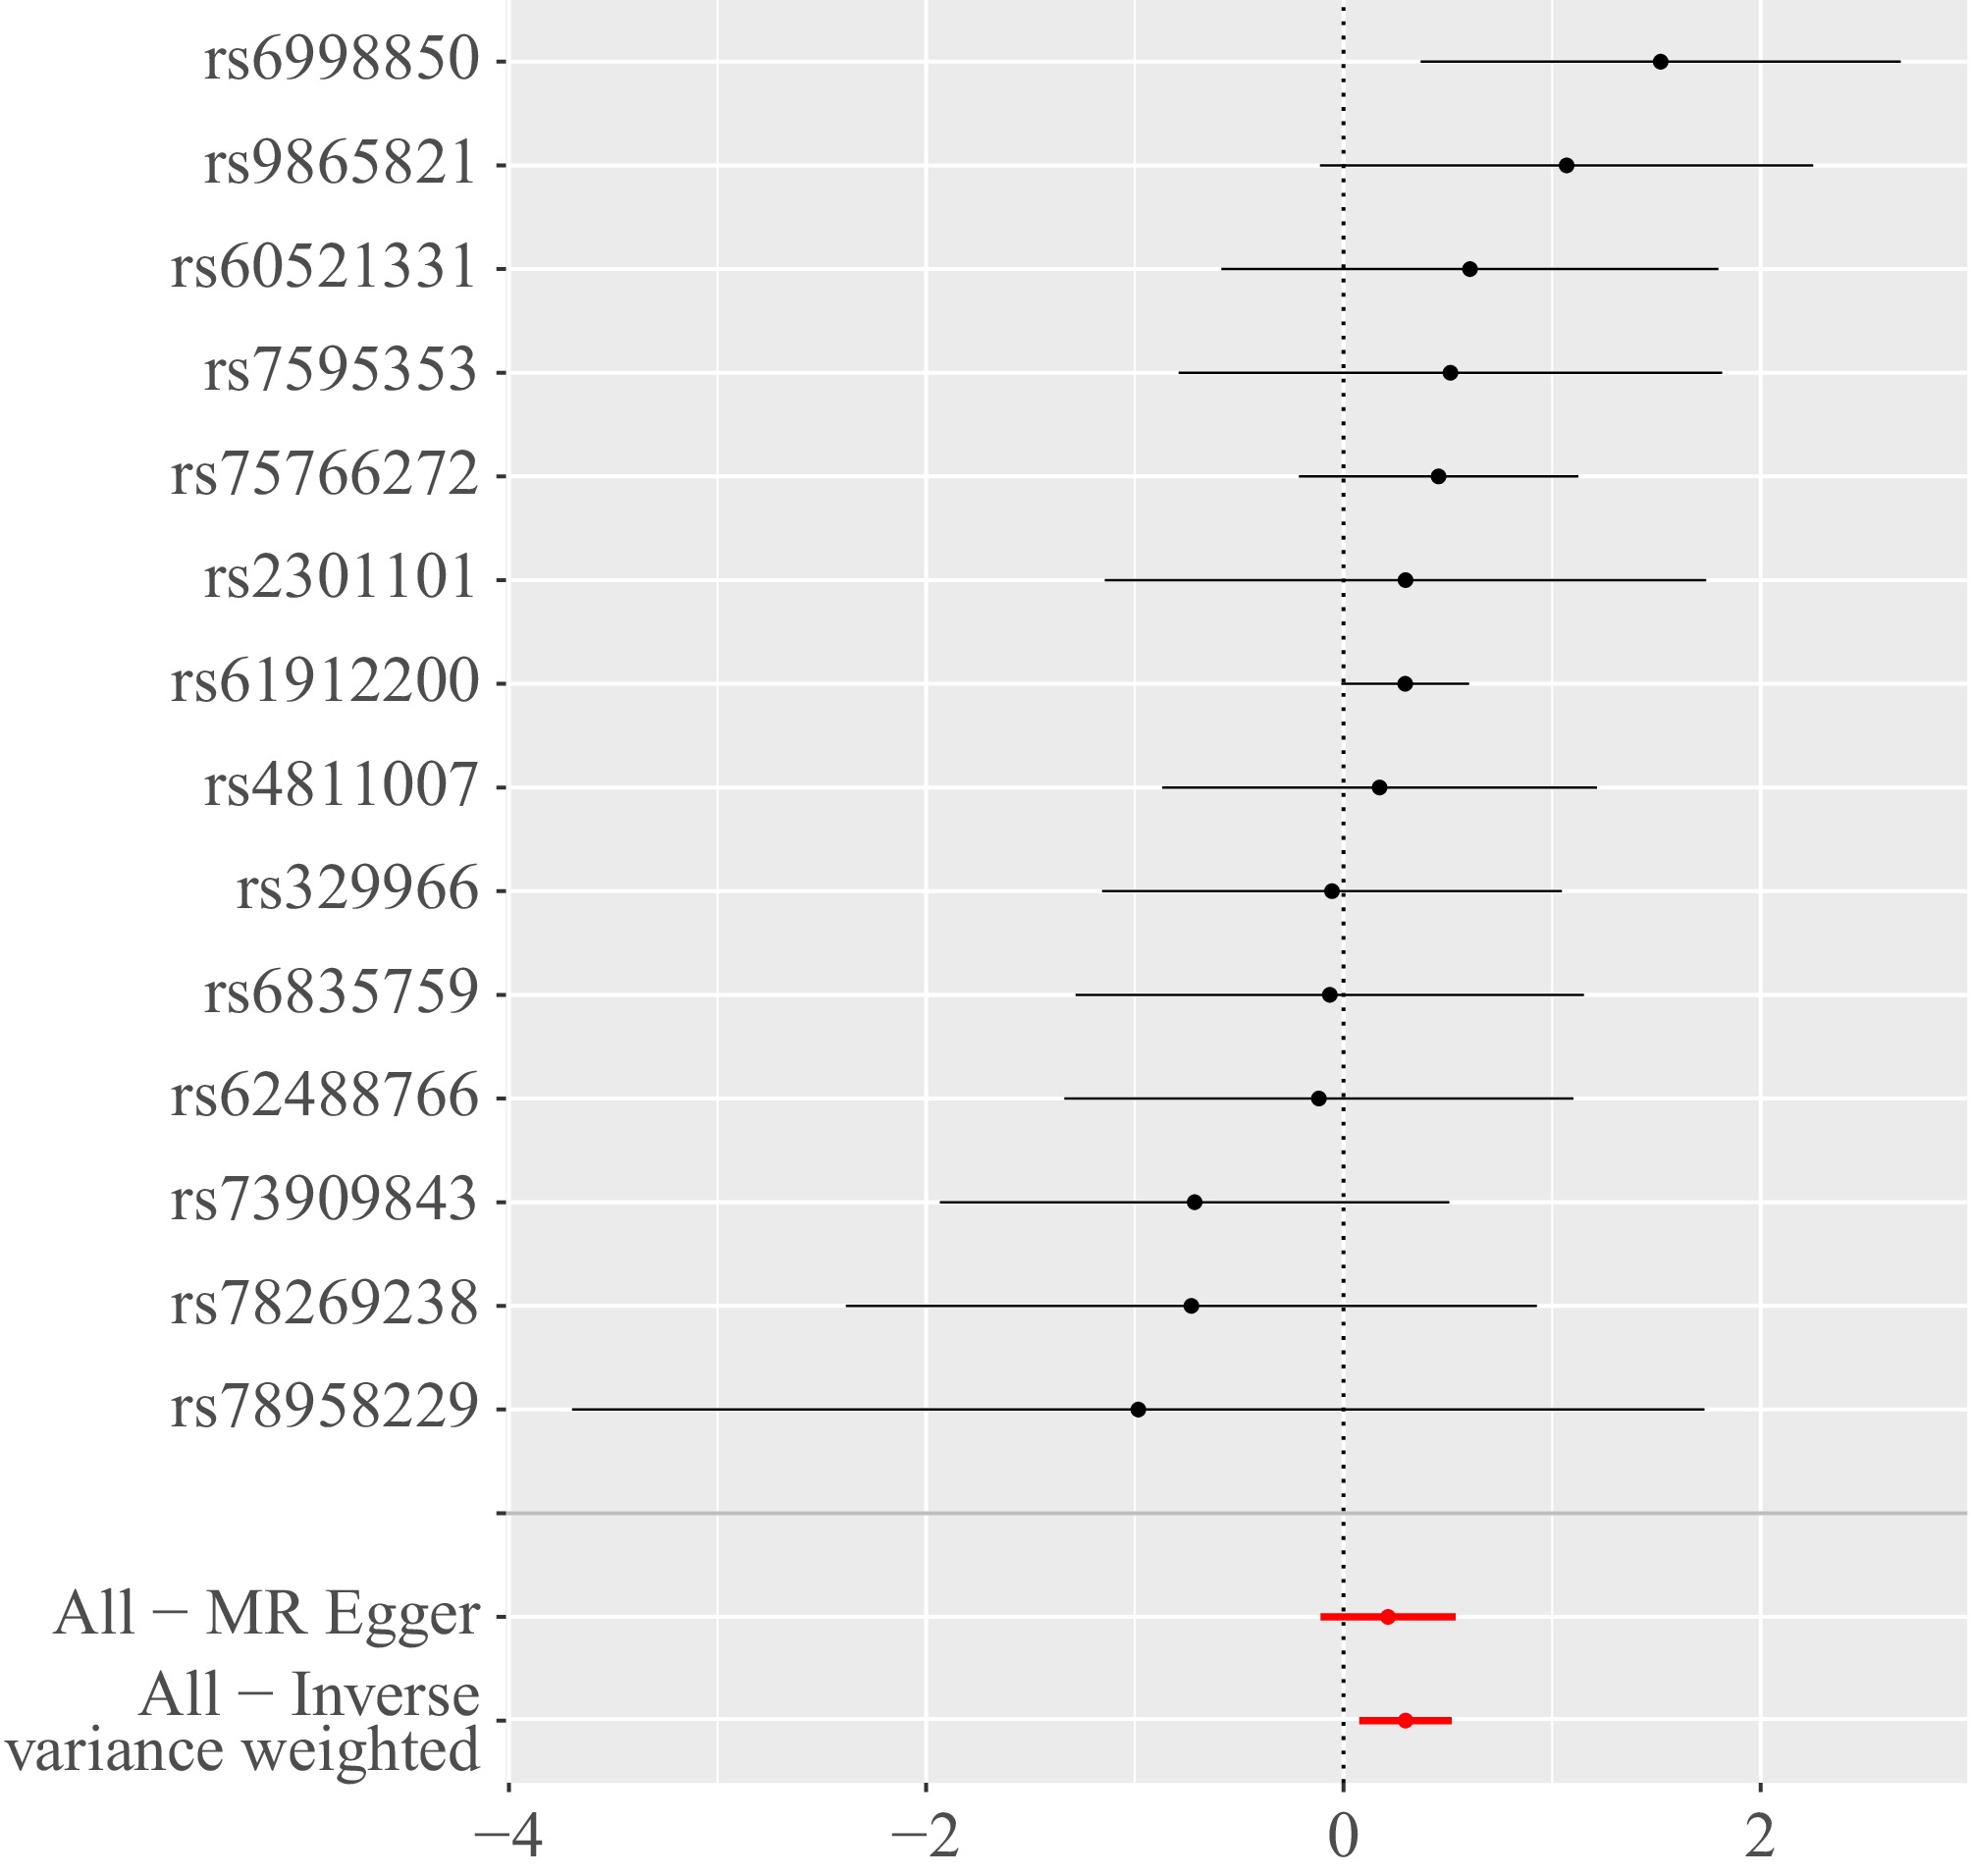
Figure 1.
Forest plot of the causal effects of single nucleotide polymorphisms associated with immune cells on hepatocellular carcinoma. The significance of the red lines are MR results of MR-Egger test and the IVW method.
-
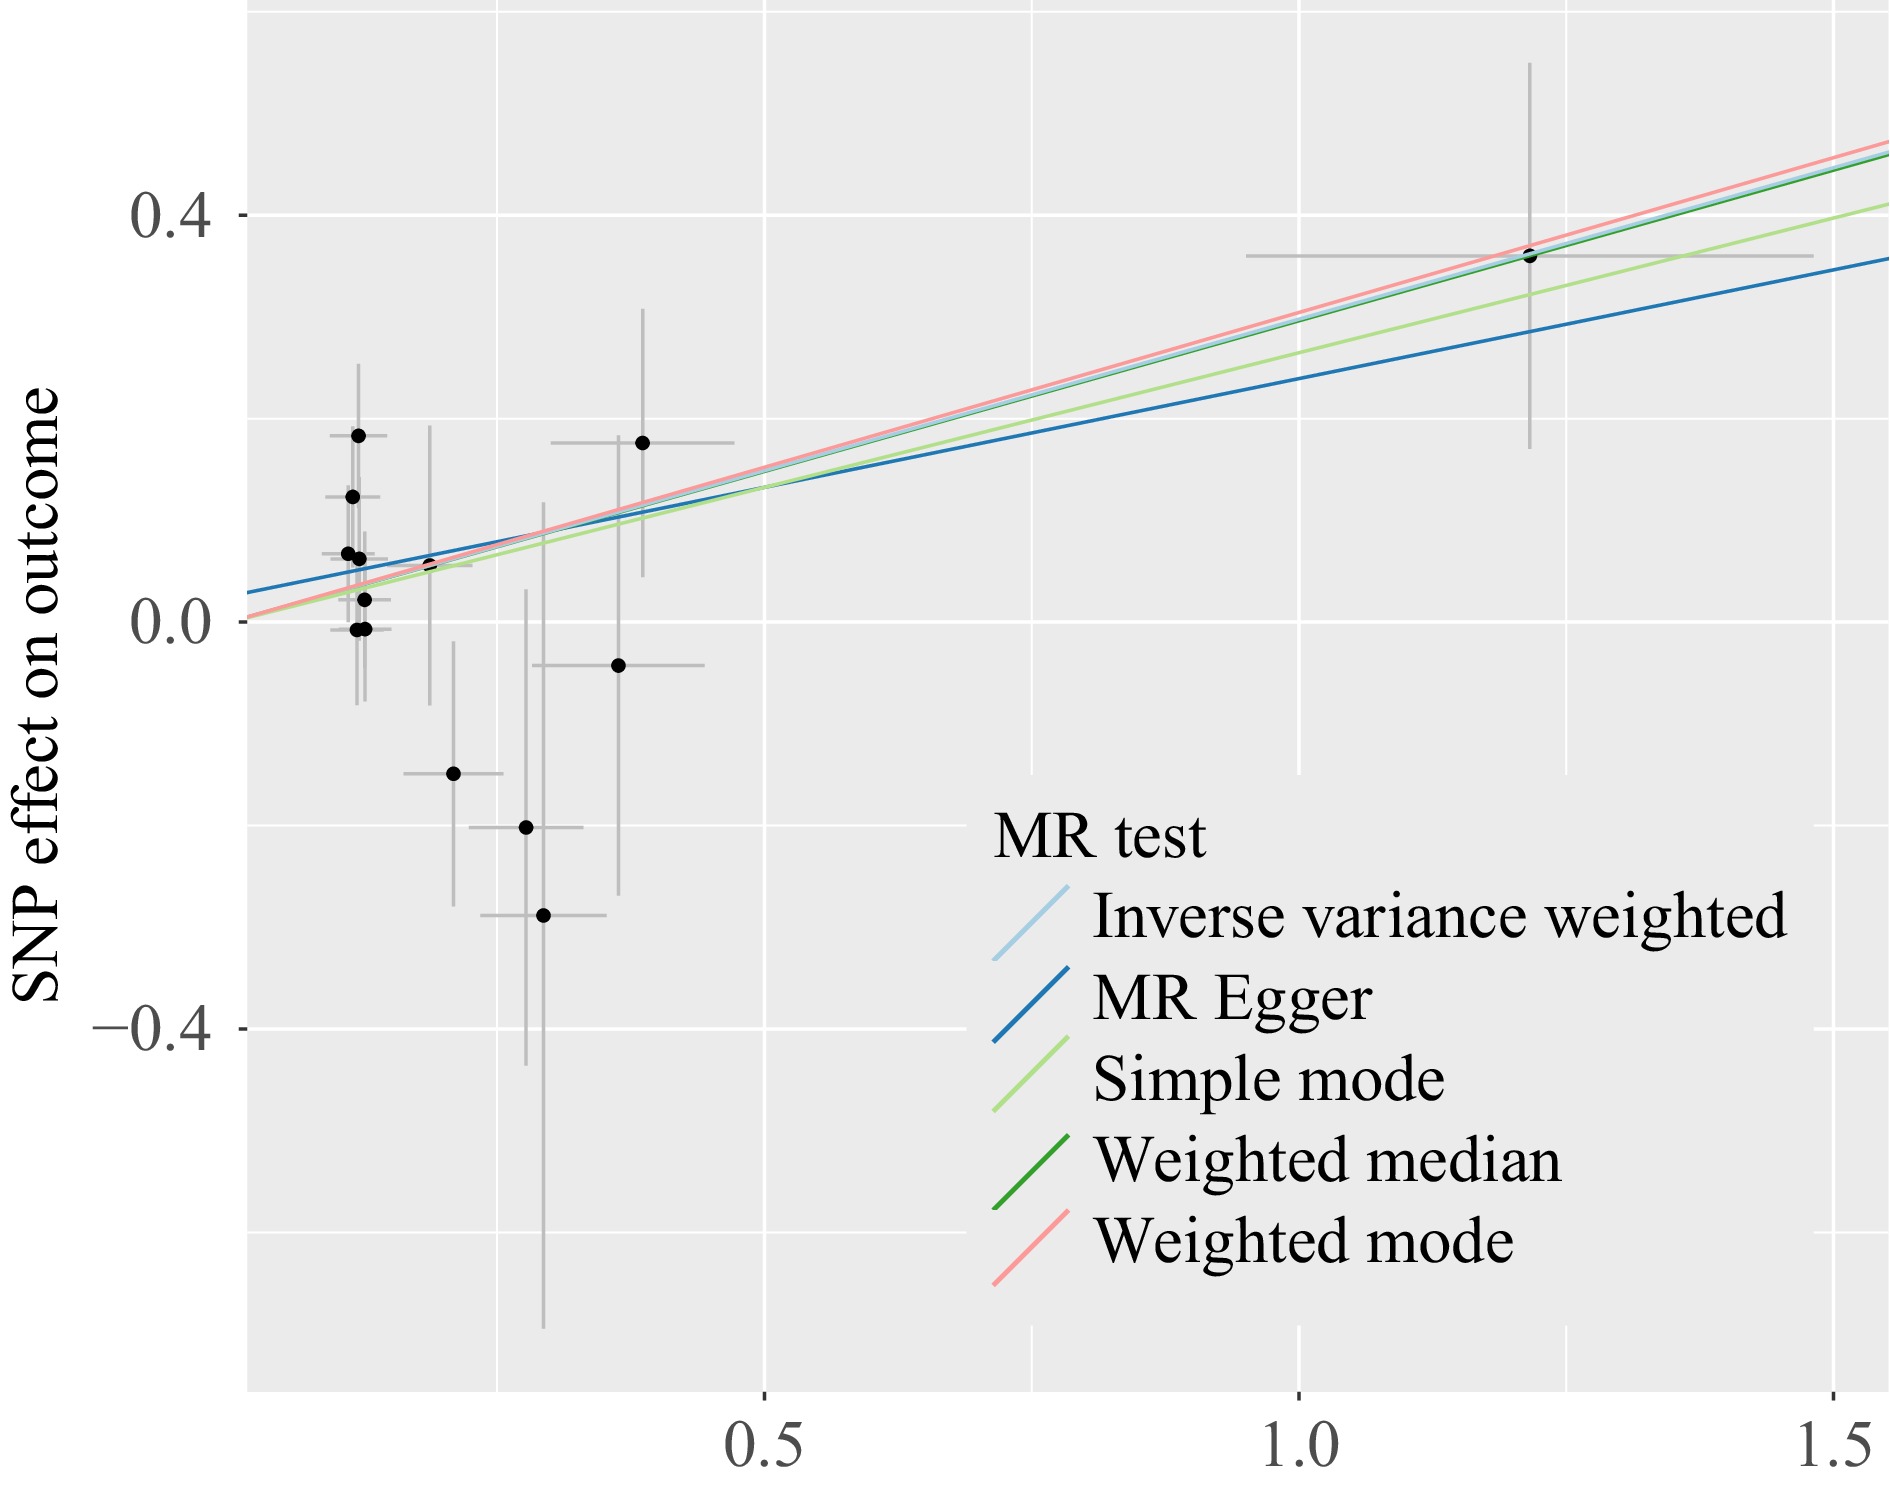
Figure 2.
Scatter plots of genetic associations with immune cells against the genetic associations with hepatocellular carcinoma. The slopes of each line represent the causal association for each method. The Cambridge blue line represents the inverse - variance weighted estimate, the dark green line represents the weighted median estimate, the dark blue line represents the Mendelian randomization - Egger estimate, the pink line represents the Mendelian randomization - weighted mode, the light green line represents the Mendelian randomization - simple mode.
-
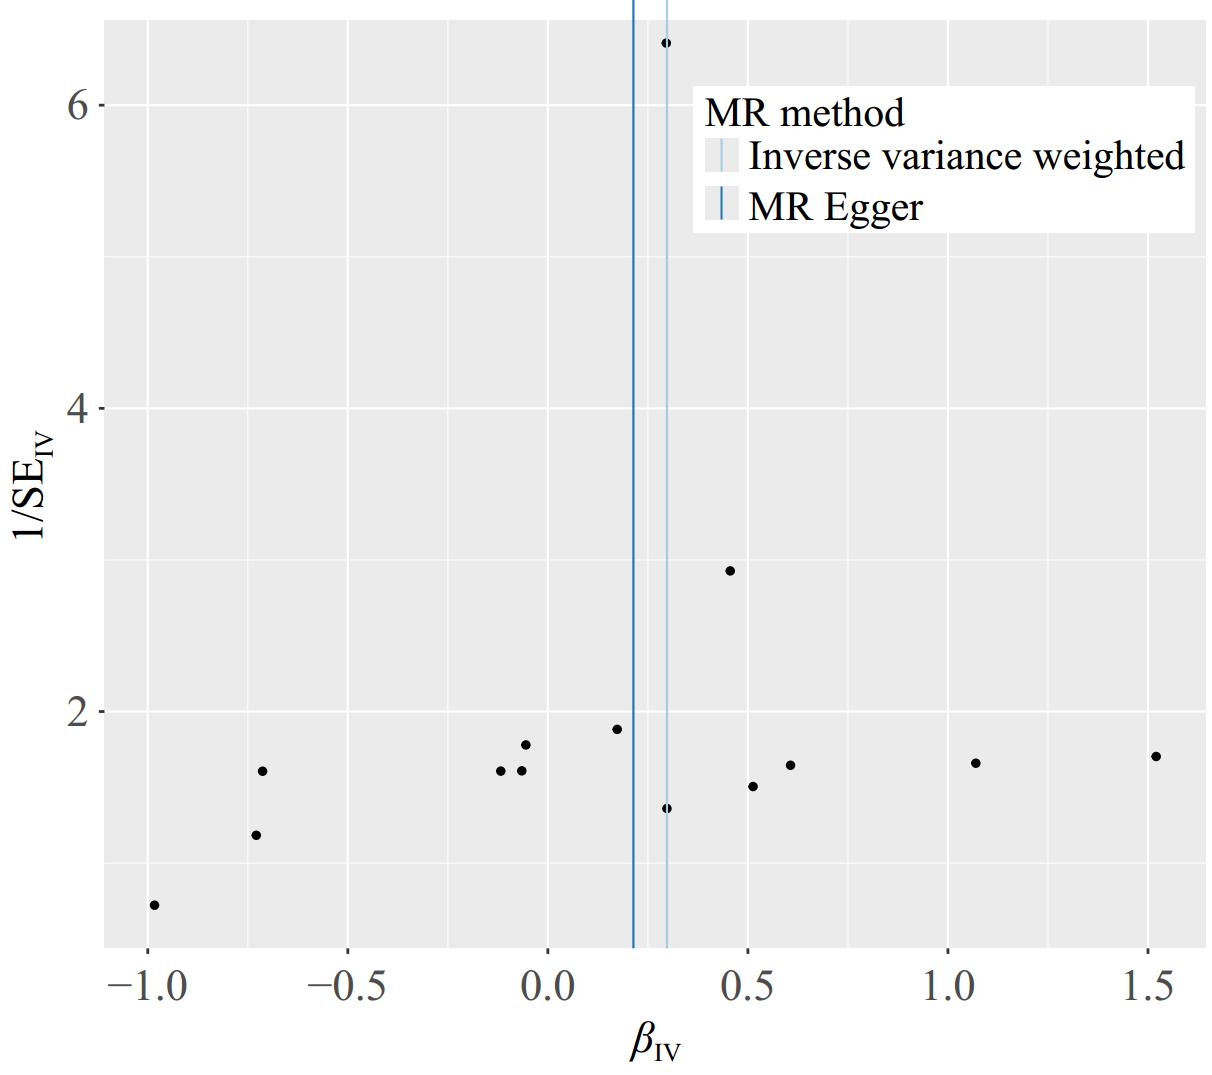
Figure 3.
Funnel plot to assess heterogeneity. The blue line represents the inverse - variance weighted estimate, and the dark blue line represents the Mendelian randomization - Egger estimate.
-
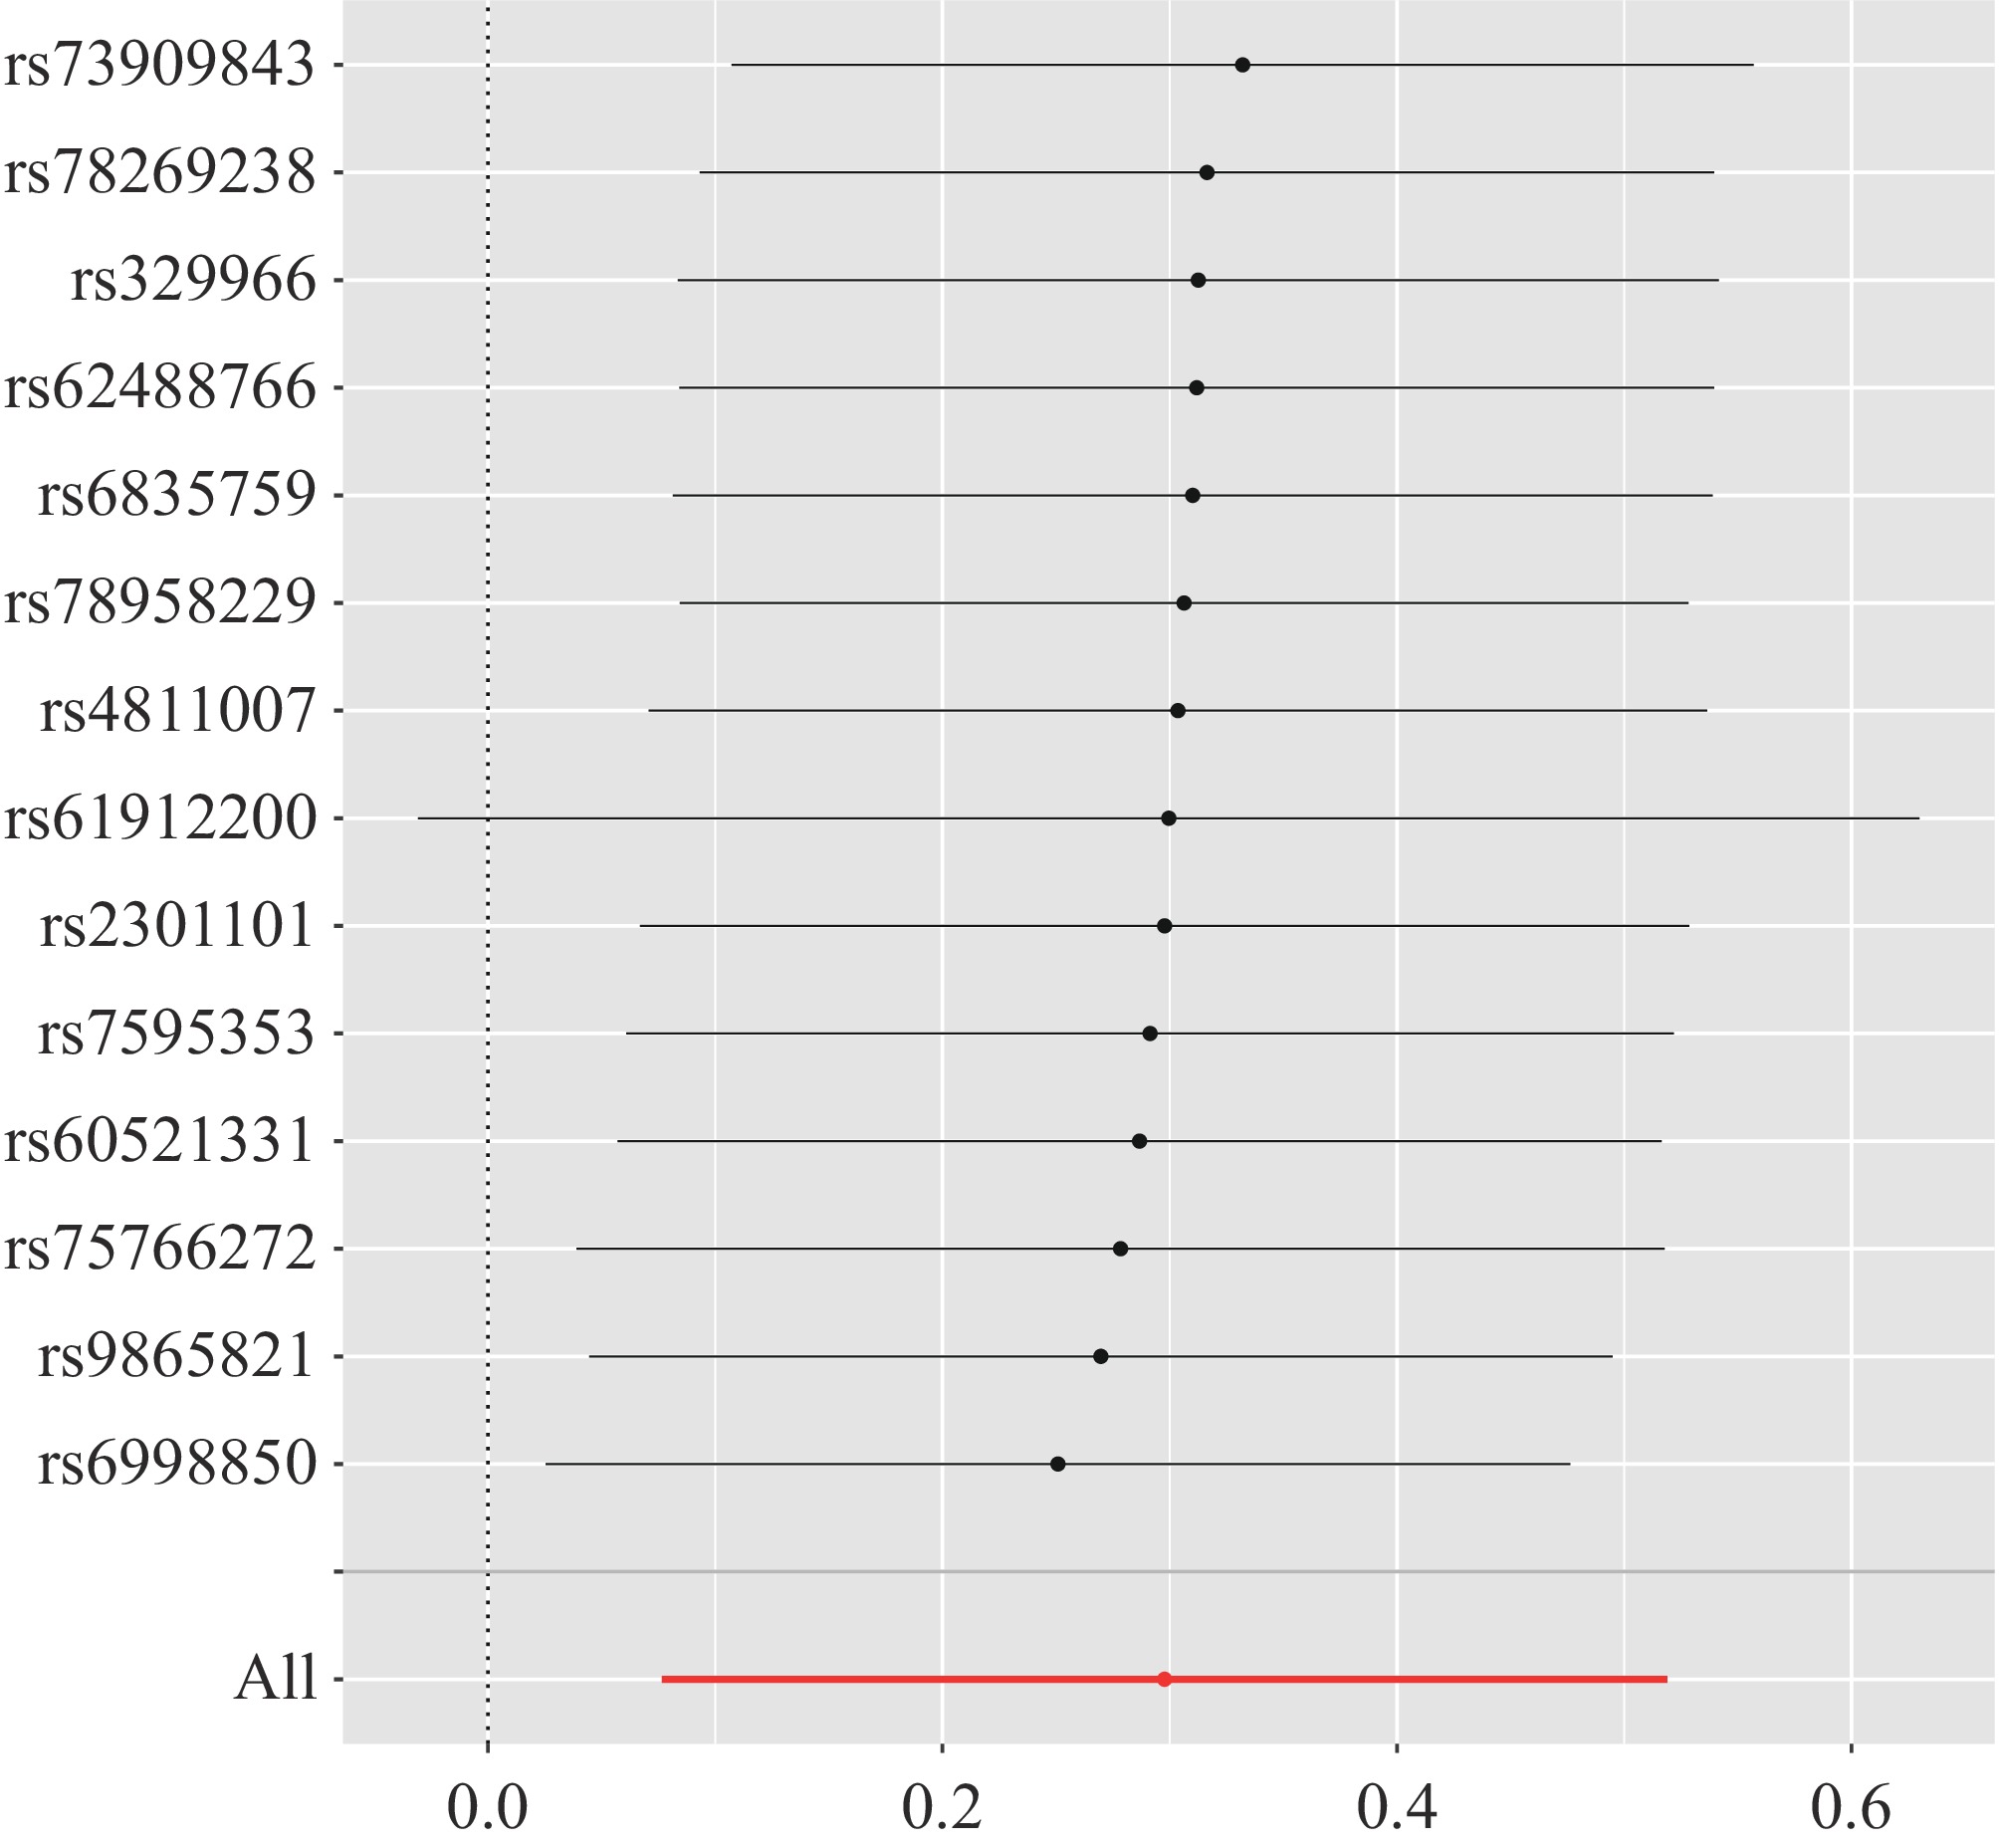
Figure 4.
MR leave-one-out sensitivity analysis on 'outcome'.
-
MR method Number
of SNPsBeta SE p-value OR 95% confidence interval I2 Cochran Q statistic Heterogeneity p-value Horizontal
pleiotropy p-valueMR-Egger 14 0.213 0.164 0.219 1.238 0.896−1.712 0.908 12.254 0.425 0.036 Inverse variance weighted 14 0.297 0.112 0.008 1.346 1.079−1.680 0.556 12.761 0.466 0.039 Table 1.
MR estimates from each method of assessing the causal effect of immune cells on the risk of hepatocellular carcinoma.
Figures
(4)
Tables
(1)