-
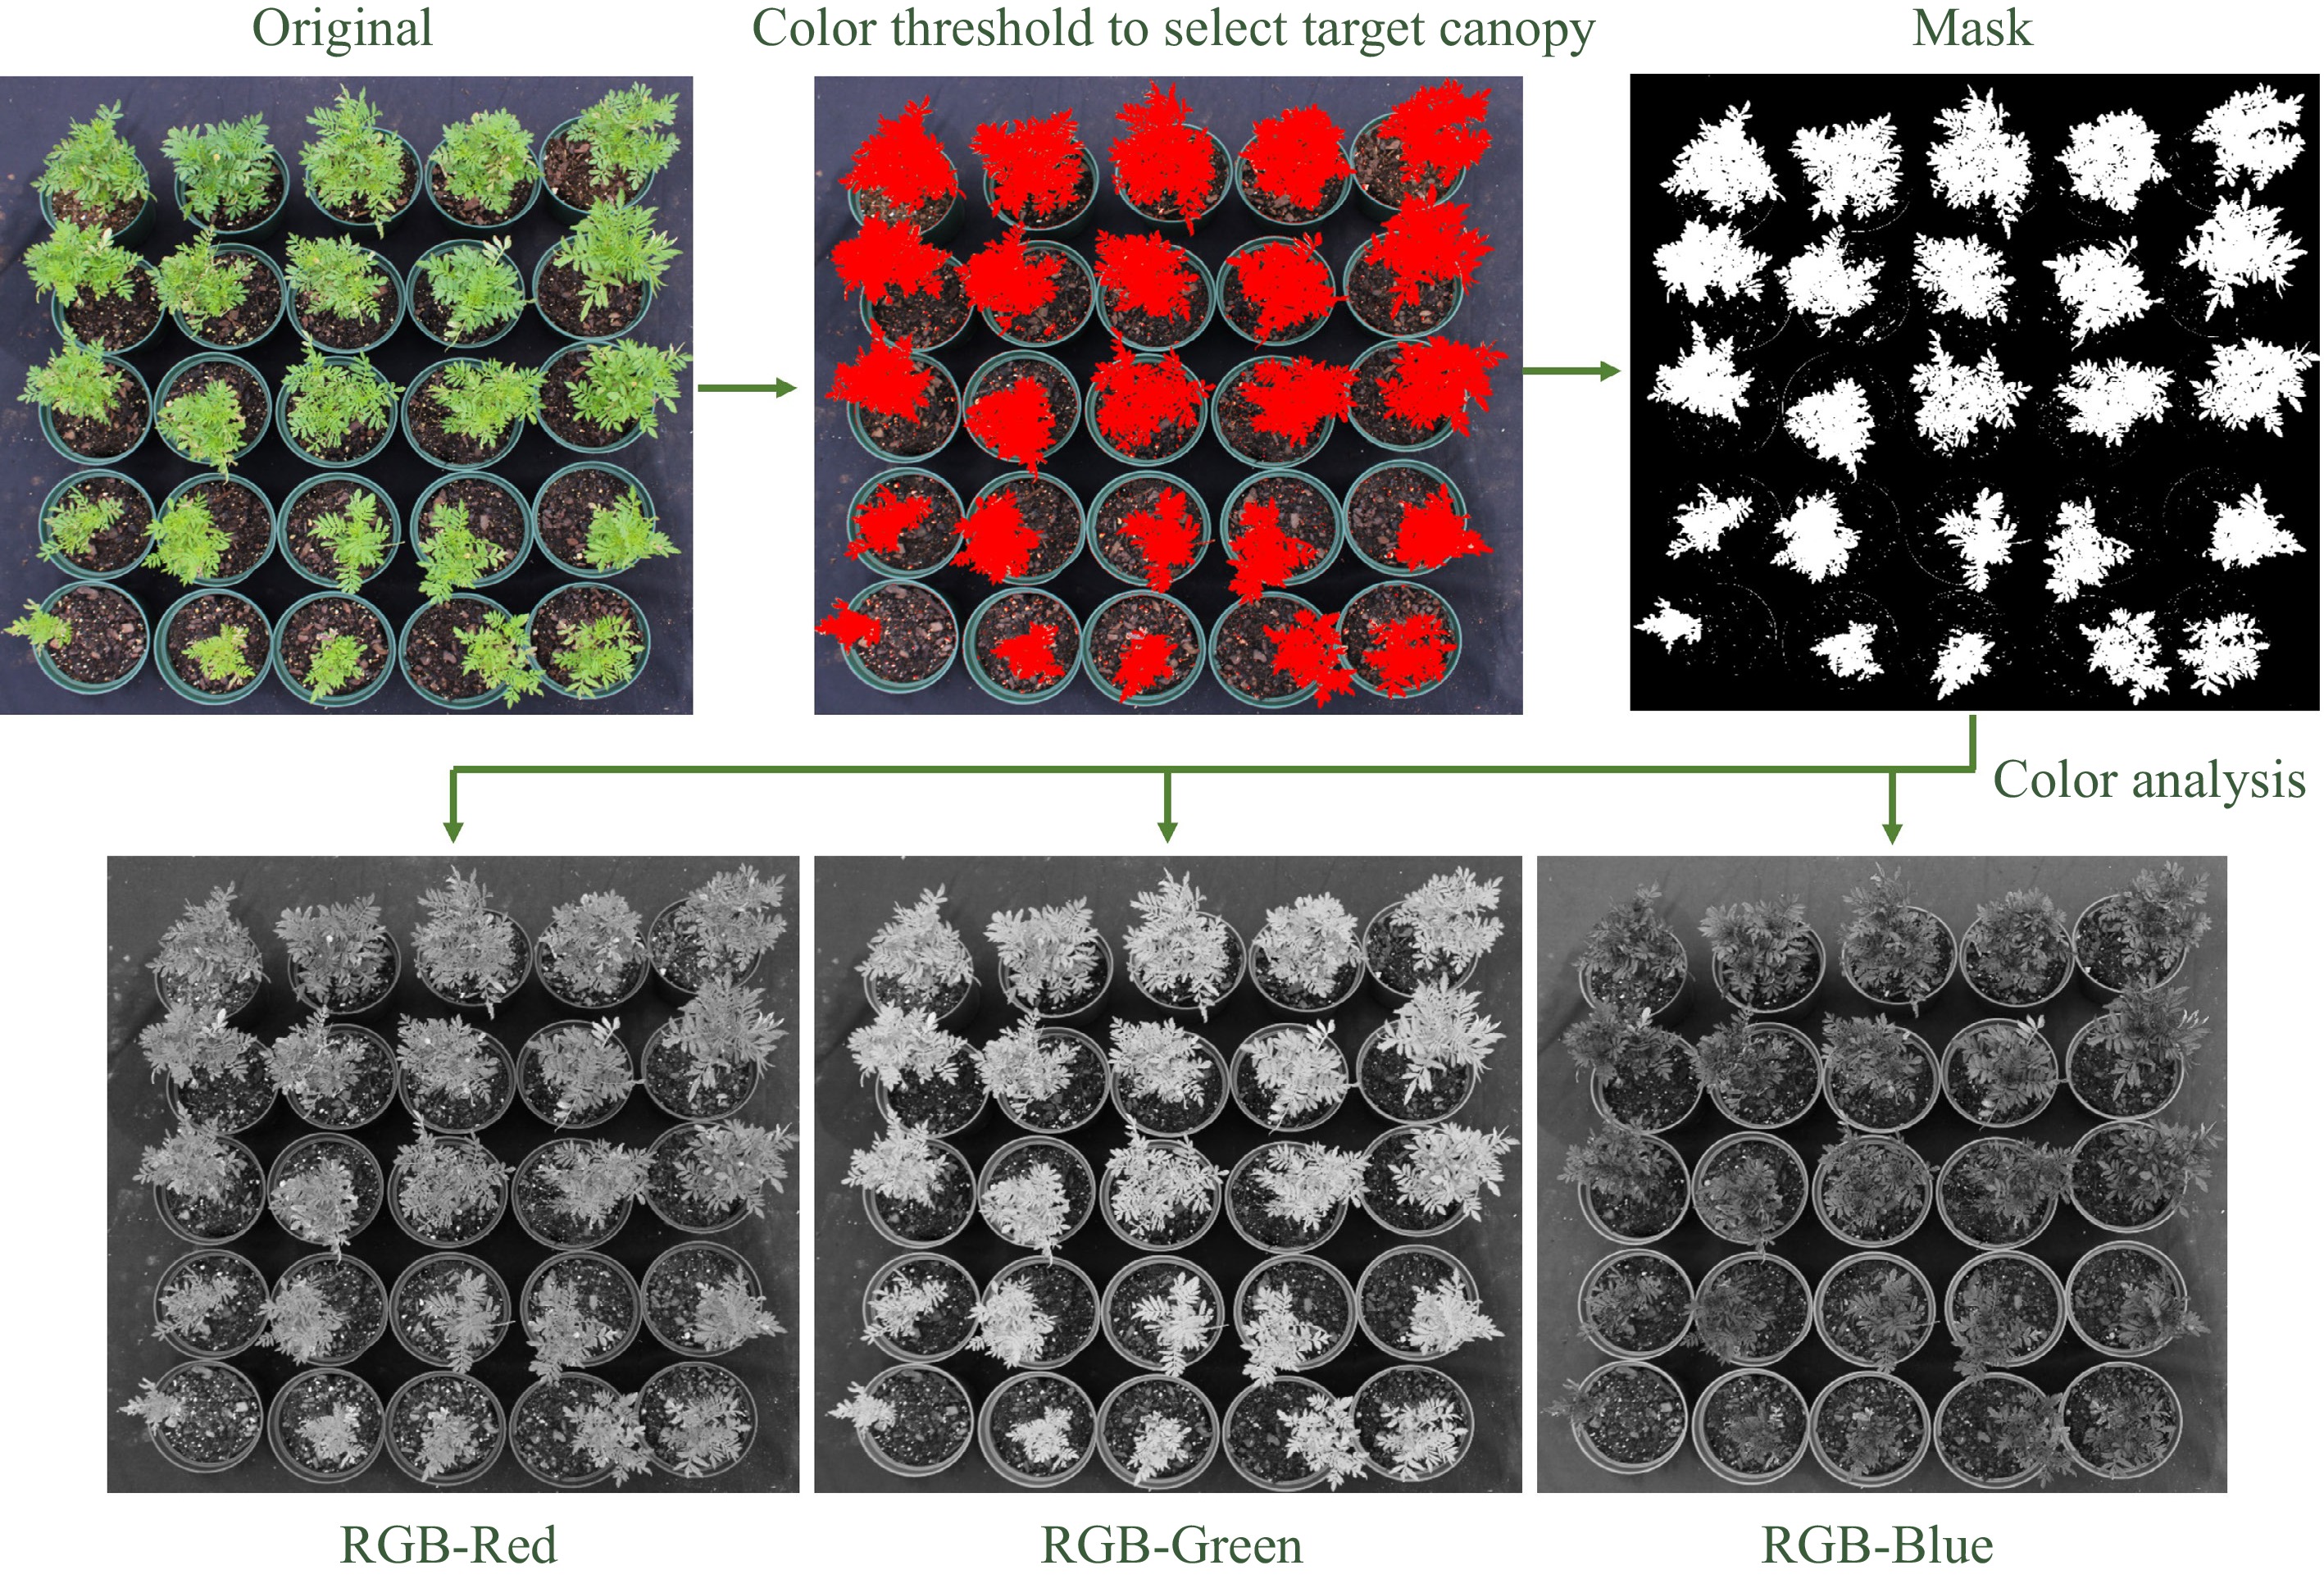
Figure 1.
Illustration of image analysis flowchart with an example of marigold plants. Color thresholds were established to segment out the plant canopy from the background, targeted mask (plant canopy) was then used to calculate canopy area and perform color analysis by separating the image into different color spaces (red, green, and blue).
-
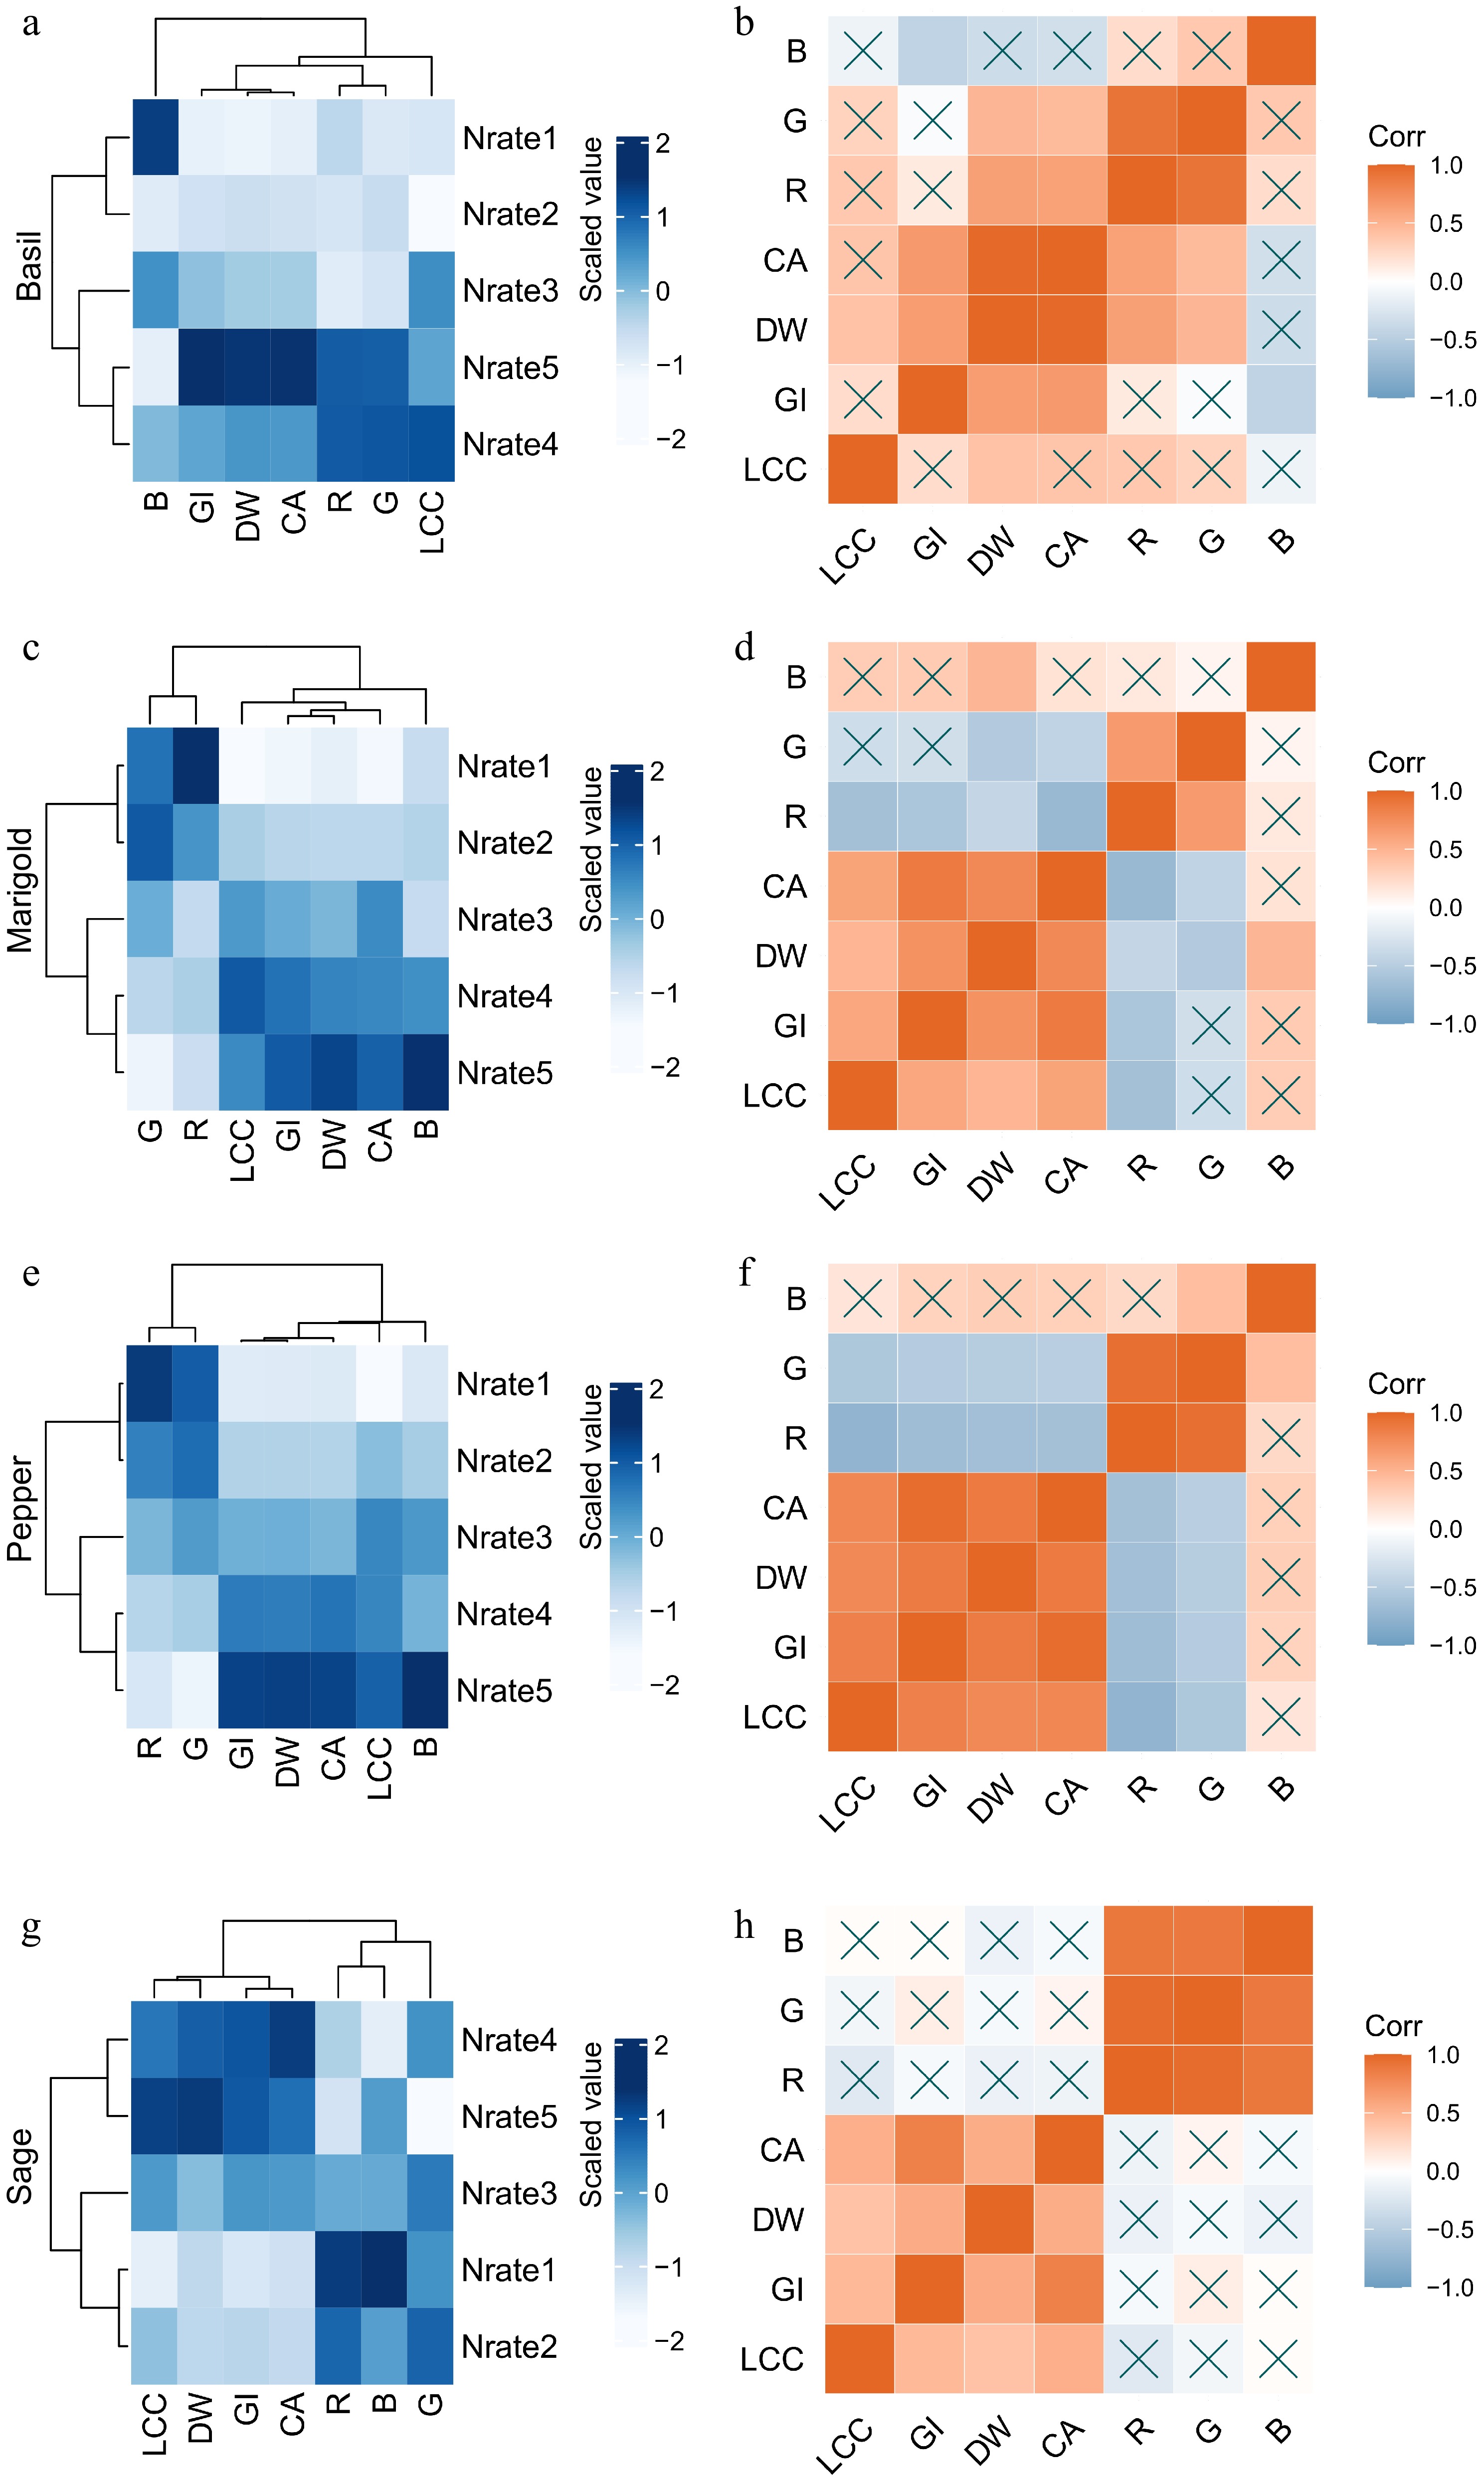
Figure 2.
Heatmaps with clustering, and correlograms of (a), (b) basil, (c), (d) marigold, (e), (f) pepper, and (g), (h) sage for plant leaf chlorophyll content (LCC), growth index (GI), dry weight (DW), and canopy area (CA), red (R), green (G), blue (B) values from image analysis as affected by different fertilization input treatments based on N rates (Nrate1, 2, 3, 4, 5). For heatmaps with clustering, each row represents a treatment, and each column represents a measured variable. All data are standardized, and measured variables are clustered based on their correlations. For correlograms, Pearson correlation coefficient (r) values are used to calculate the strength (basis of judgment) and direction of a linear relationship between two variables, p-values based on the calculated r value and sample size (n) using a t-distribution with (n-2) degrees of freedom is used to indicate statistically significant correlations. X indicates insignificant correlation coefficients (p ≥ 0.05).
-
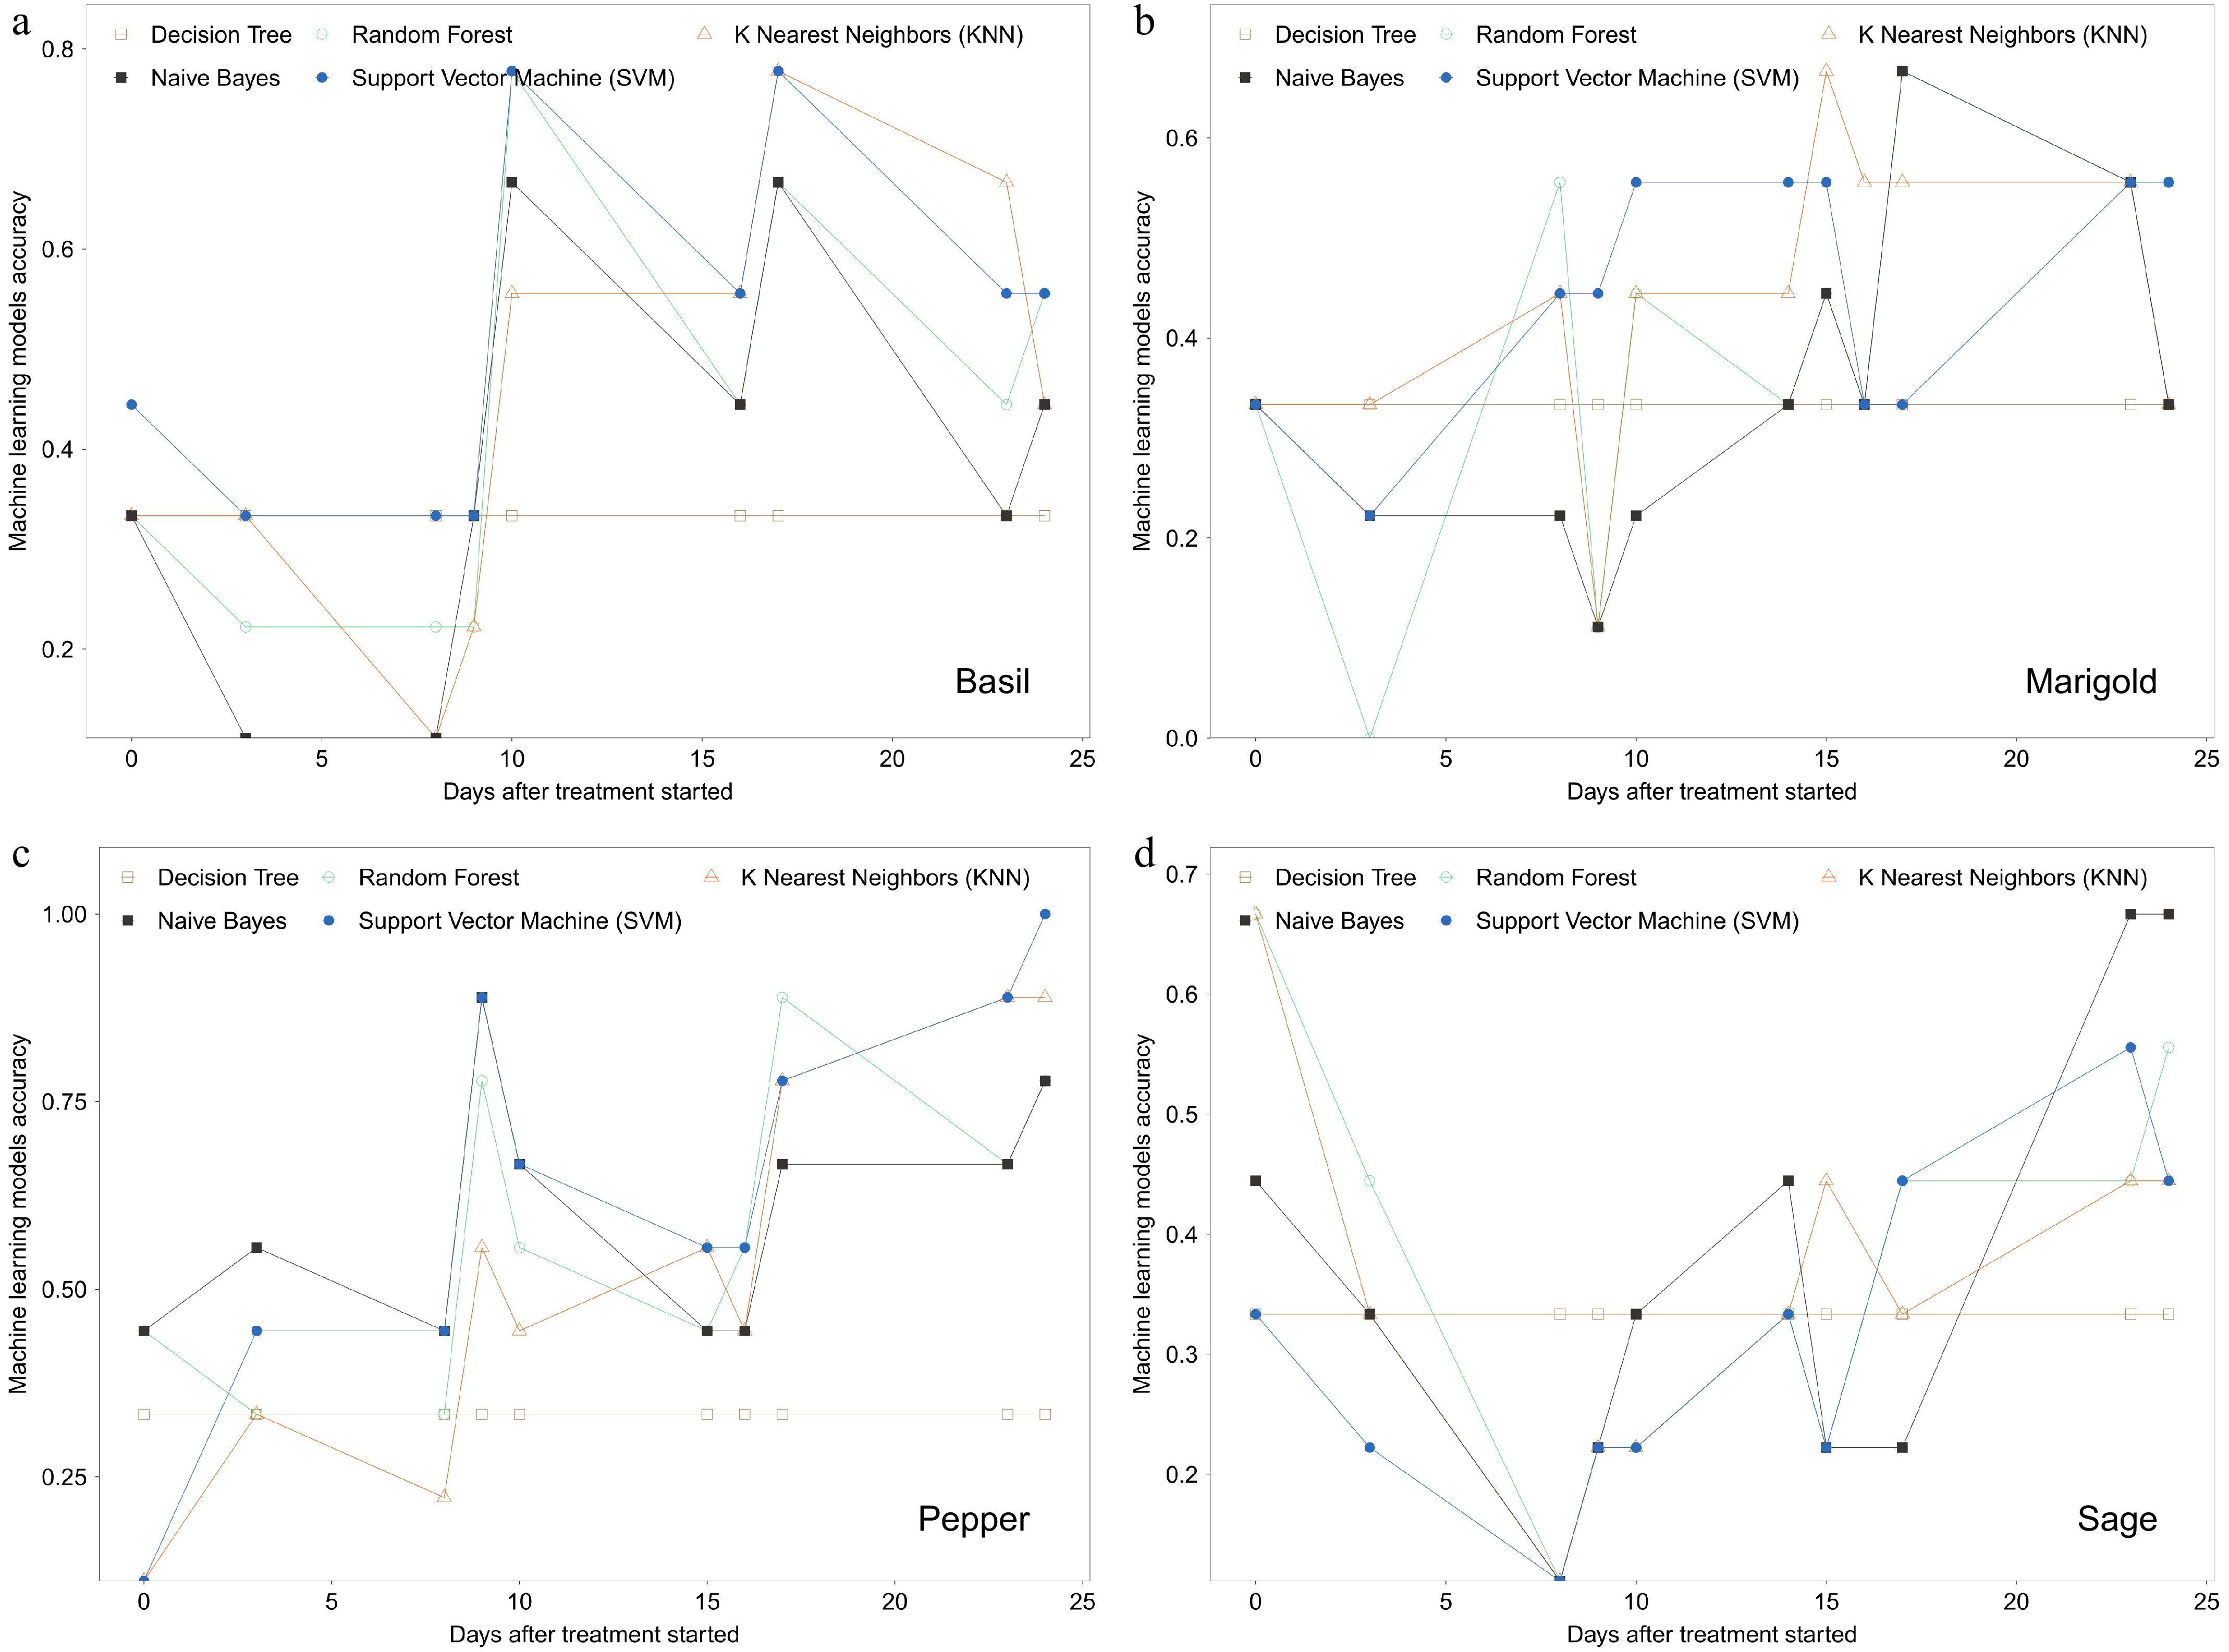
Figure 3.
Machine learning model accuracy evaluation for four fertilization status labeled based on clustering (extreme-underuse, sub-underuse, sufficient use, and overuse) of (a) basil, (b) marigold, (c) pepper, and (d) sage. Training and testing data contain only canopy area, red, green, and blue values from image analysis.
-
Treatments Nrate1 (0%) Nrate2 (25%) Nrate3 (50%) Nrate4 (75%) Nrate5 (100%) Week 1 0 25 50 75 100 Week 2 0 37.5 75 112.5 150 Week 3 0 50 100 150 200 Week 4 0 62.5 125 187.5 250 Total 0 175 350 525 700 Table 1.
Weekly fertilization schedule based on nitrogen (N) rates (mg·L–1).
-
Crop Input rates LCC (SPAD) GI DW (g) CA (cm2) R G B Basil Nrate1 17.6 ± 0.7 bc 24.5 ± 1.7 4.21 ± 0.42 d 141.55 ± 17.44 d 127.03 ± 3.98 b 172.43 ± 4.21 67.33 ± 2.10 Nrate2 16.2 ± 2.0 c 25.2 ± 1.9 5.47 ± 0.50 cd 176.70 ± 19.66 cd 122.55 ± 1.81 b 174.29 ± 1.78 63.78 ± 0.92 Nrate3 21.6 ± 0.9 ab 26.4 ± 2.1 6.46 ± 0.46 bc 230.14 ± 22.85 bc 120.35 ± 1.24 b 173.05 ± 1.59 65.98 ± 1.55 Nrate4 23.6 ± 1.1 a 27.1 ± 1.8 8.26 ± 0.51 b 311.16 ± 24.77 b 149.83 ± 7.92 a 186.25 ± 6.91 65.21 ± 2.65 Nrate5 20.8 ± 1.0 abc 29.7 ± 0.7 10.98 ± 0.51 a 442.51 ± 17.35 a 149.43 ± 4.87 a 185.62 ± 4.33 63.67 ± 0.86 p-values 0.003 0.284 < 0.001 < 0.001 < 0.001 0.059 0.559 Marigold Nrate1 28.8 ± 2.2 b 11.7 ± 0.5 c 1.37 ± 0.14 d 51.94 ± 8.87 b 130.55 ± 4.19 174.55 ± 1.57 86.67 ± 2.09 Nrate2 32.8 ± 0.5 ab 13.1 ± 0.4 bc 2.10 ± 0.09 cd 77.05 ± 4.55 b 125.69 ± 1.54 175.26 ± 2.33 87.34 ± 3.45 Nrate3 35.8 ± 0.8 ab 14.3 ± 0.8 ab 2.80 ± 0.23 bc 112.69 ± 4.96 a 121.27 ± 2.15 172.73 ± 1.24 86.72 ± 1.98 Nrate4 38.6 ± 1.9 a 15.6 ± 0.7 ab 3.61 ± 0.27 b 113.91 ± 7.35 a 122.26 ± 1.82 171.10 ± 1.36 90.58 ± 2.45 Nrate5 36.5 ± 3.8 ab 16.1 ± 0.5 a 4.53 ± 0.24 a 128.44 ± 3.81 a 120.90 ± 2.15 169.36 ± 1.91 94.12 ± 2.01 p-values 0.043 < 0.001 < 0.001 < 0.001 0.073 0.137 0.181 Pepper Nrate1 20.5 ± 1.6 c 9.9 ± 1.1 d 1.37 ± 0.14 d 40.19 ± 9.94 c 182.14 ± 6.58 a 205.68 ± 4.02 91.17 ± 3.75 Nrate2 31.3 ± 1.3 b 12.5 ± 0.8 cd 2.10 ± 0.09 cd 72.27 ± 8.46 bc 175.02 ± 4.26 ab 205.05 ± 2.55 93.09 ± 3.81 Nrate3 37.2 ± 1.4 a 14.8 ± 0.6 bc 2.80 ± 0.23 bc 99.58 ± 10.42 b 168.86 ± 2.58 ab 203.06 ± 1.65 95.39 ± 1.32 Nrate4 37.3 ± 1.1 a 17.7 ± 0.4 ab 3.61 ± 0.27 b 150.02 ± 8.87 a 164.38 ± 1.74 b 200.48 ± 0.93 94.26 ± 1.94 Nrate5 40.8 ± 1.5 a 20.6 ± 0.4 a 4.53 ± 0.24 a 183.85 ± 8.11 a 160.69 ± 3.32 b 197.36 ± 2.20 99.13 ± 3.44 p-values < 0.001 < 0.001 < 0.001 < 0.001 0.010 0.150 0.450 Sage Nrate1 23.8 ± 1.2 b 12.1 ± 1.2 b 1.79 ± 0.43 b 57.82 ± 8.50 c 159.19 ± 8.67 188.15 ± 6.62 115.72 ± 6.40 Nrate2 26.9 ± 0.5 ab 13.2 ± 0.9 b 1.81 ± 0.27 b 63.93 ± 4.30 c 156.44 ± 8.08 189.36 ± 6.52 111.94 ± 5.12 Nrate3 28.7 ± 2.5 ab 15.7 ± 0.7 ab 2.27 ± 0.30 ab 103.86 ± 10.22 b 151.58 ± 5.50 188.78 ± 4.21 111.49 ± 3.27 Nrate4 30.0 ± 1.1 a 17.7 ± 1.0 a 3.38 ± 0.55 ab 146.02 ± 5.00 a 148.37 ± 7.78 188.16 ± 5.65 107.83 ± 5.18 Nrate5 32.1 ± 0.7 a 17.6 ± 0.8 a 3.79 ± 0.44 a 123.14 ± 14.7 ab 145.93 ± 11.70 184.03 ± 9.20 112.03 ± 7.88 p-values 0.005 0.001 0.005 < 0.001 0.798 0.981 0.916 For each crop, different letters within column from the same source factor indicate significant differences at α = 0.05, according to HSD test. Table 2.
Analysis of variance and means comparison of basil, marigold, pepper, sage leaf chlorophyll content (LCC), growth index (GI), dry weight (DW), and canopy area (CA), red (R), green (G), blue (B) values from image analysis as affected by different fertilization input treatments based on N rates (Nrate1, 2, 3, 4, 5) at the end of the study.
Figures
(3)
Tables
(2)