-
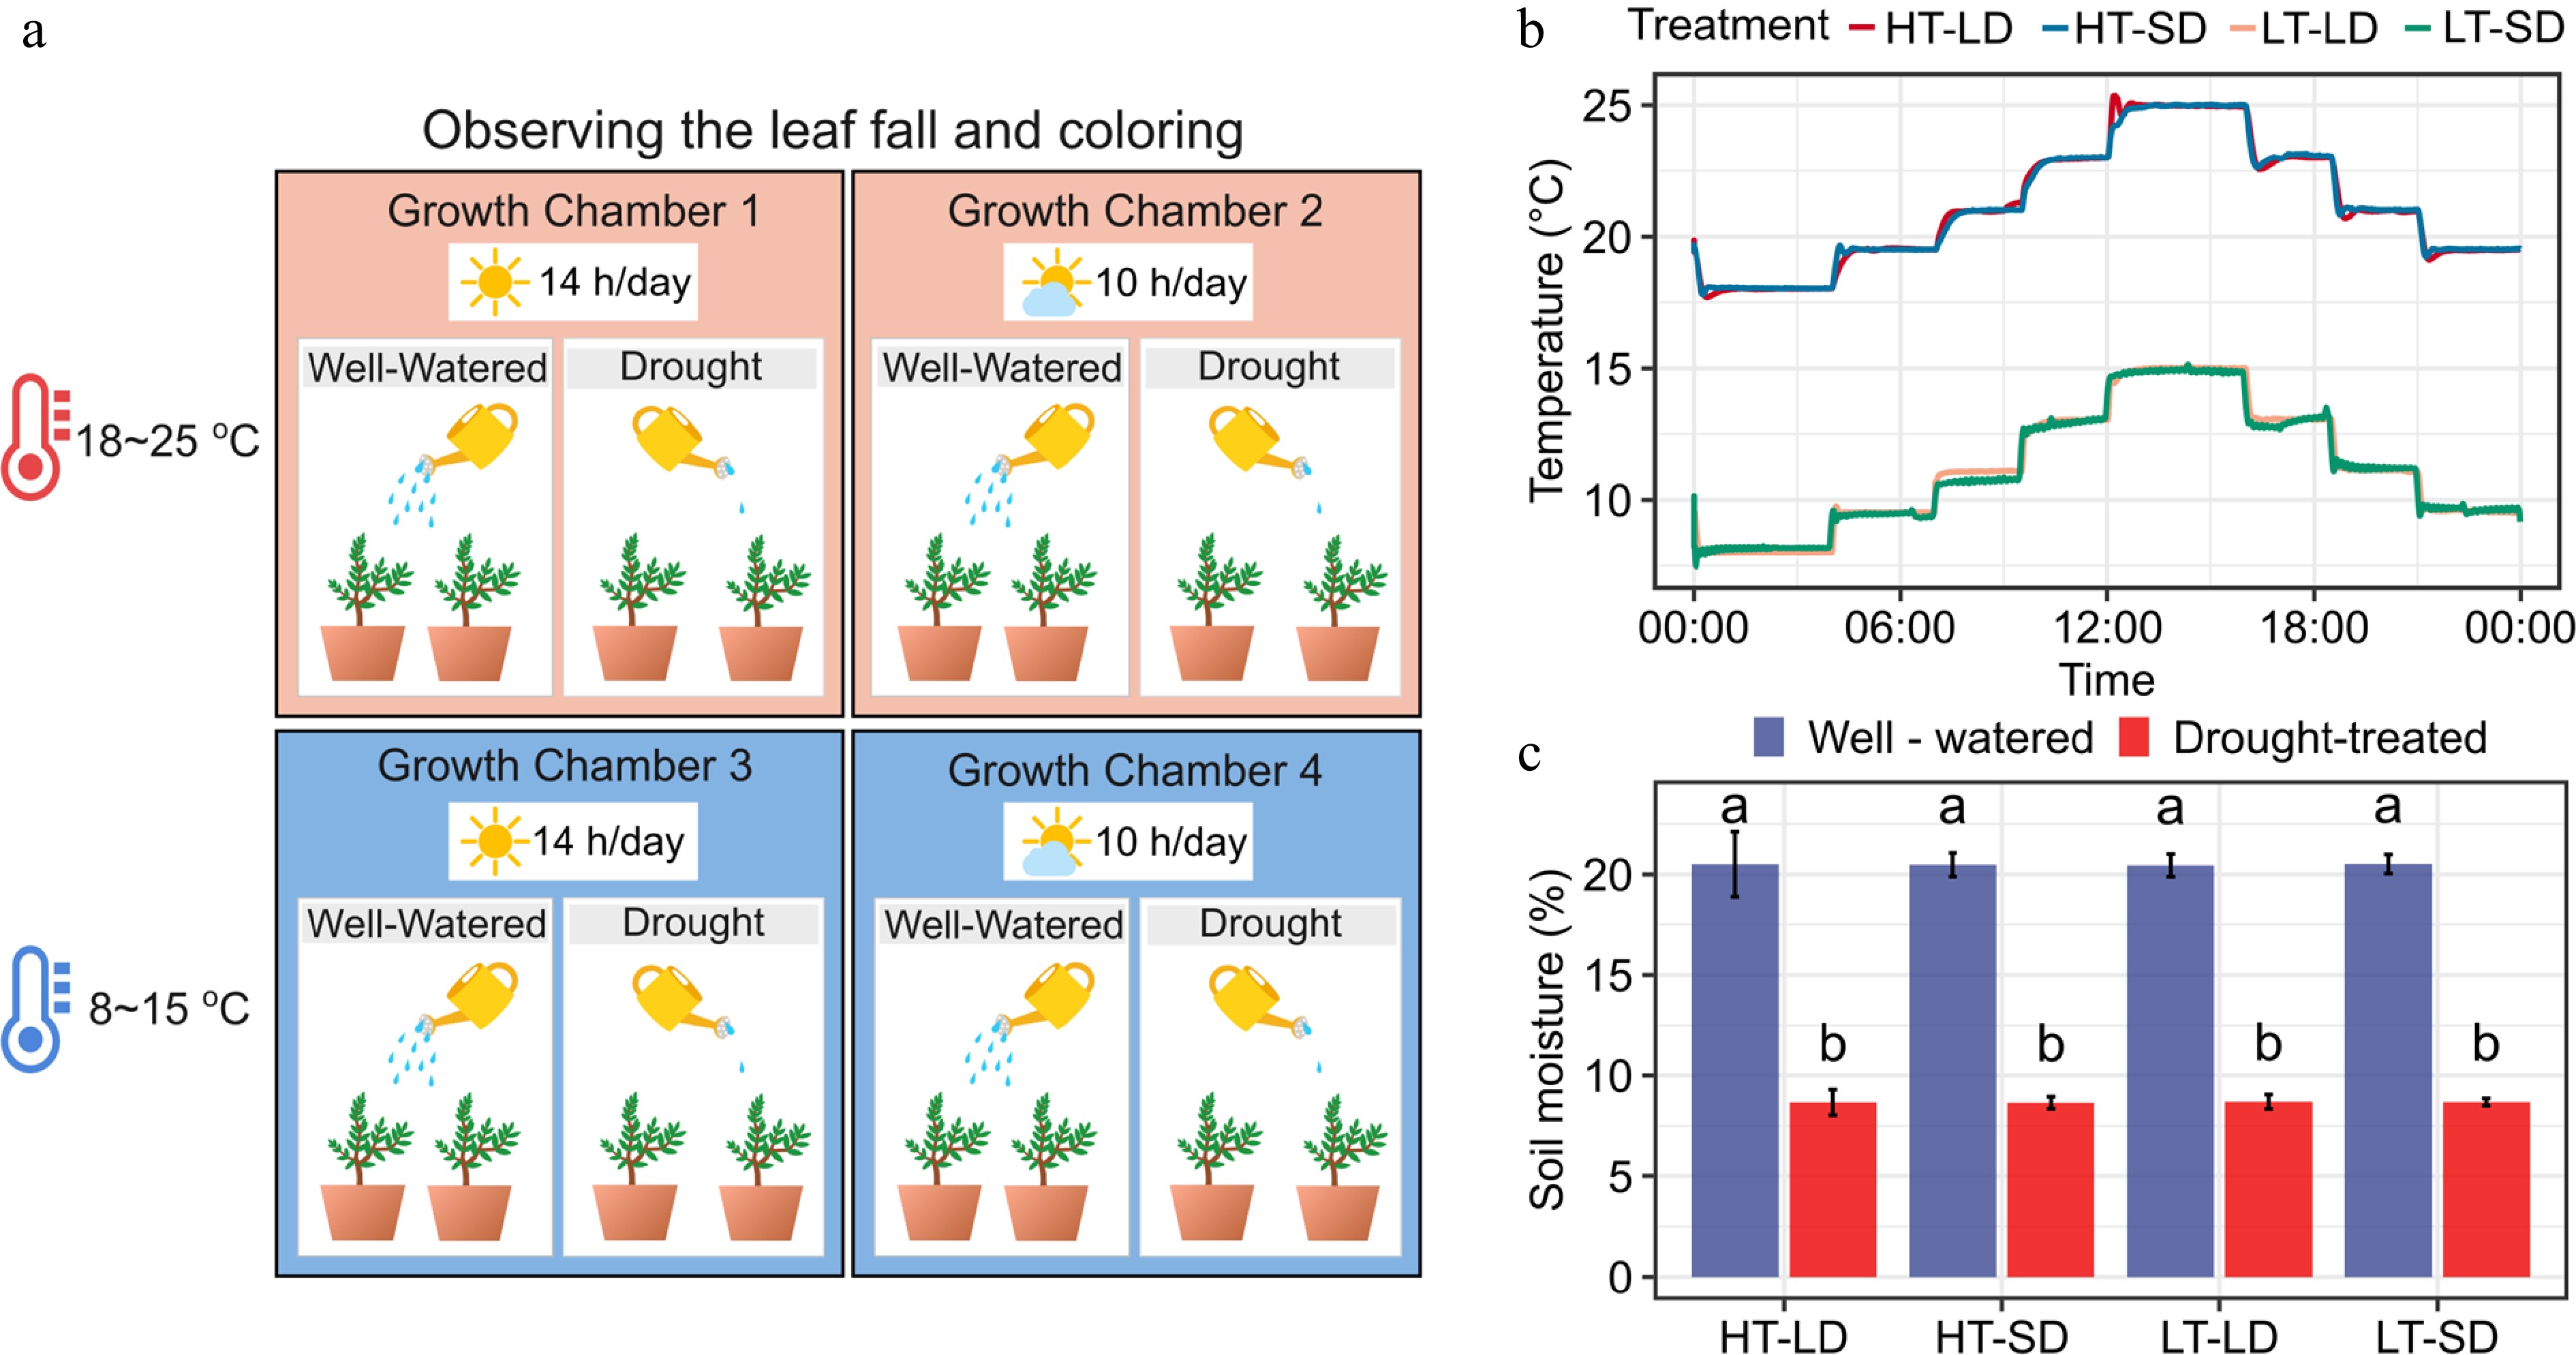
Figure 1.
Experimental design of the study addressing the effects of the air temperature, photoperiod, and soil moisture on autumn senescence and dormancy depth in seedlings of four subtropical tree species. (a) The fully factorial 2 × 2 × 2 = 8 design applied in the study, combining two levels of air temperature (HT = 18−25 °C, LT = 8−15 °C), two levels of photoperiod (LD = 14 h day length, SD = 8 h day length), and two levels of soil moisture (well-watered, drought-treated). (b) The daily patterns of the HT and the LT treatment. (c) Soil moisture percentage in the eight treatments at the end of the experiment. The soil moisture percentage was measured for three potted seedlings per treatment. The different letters above the bars indicate a significant difference in the soil moisture percentage between the treatments (post-hoc Tukey's tests, p < 0.05).
-
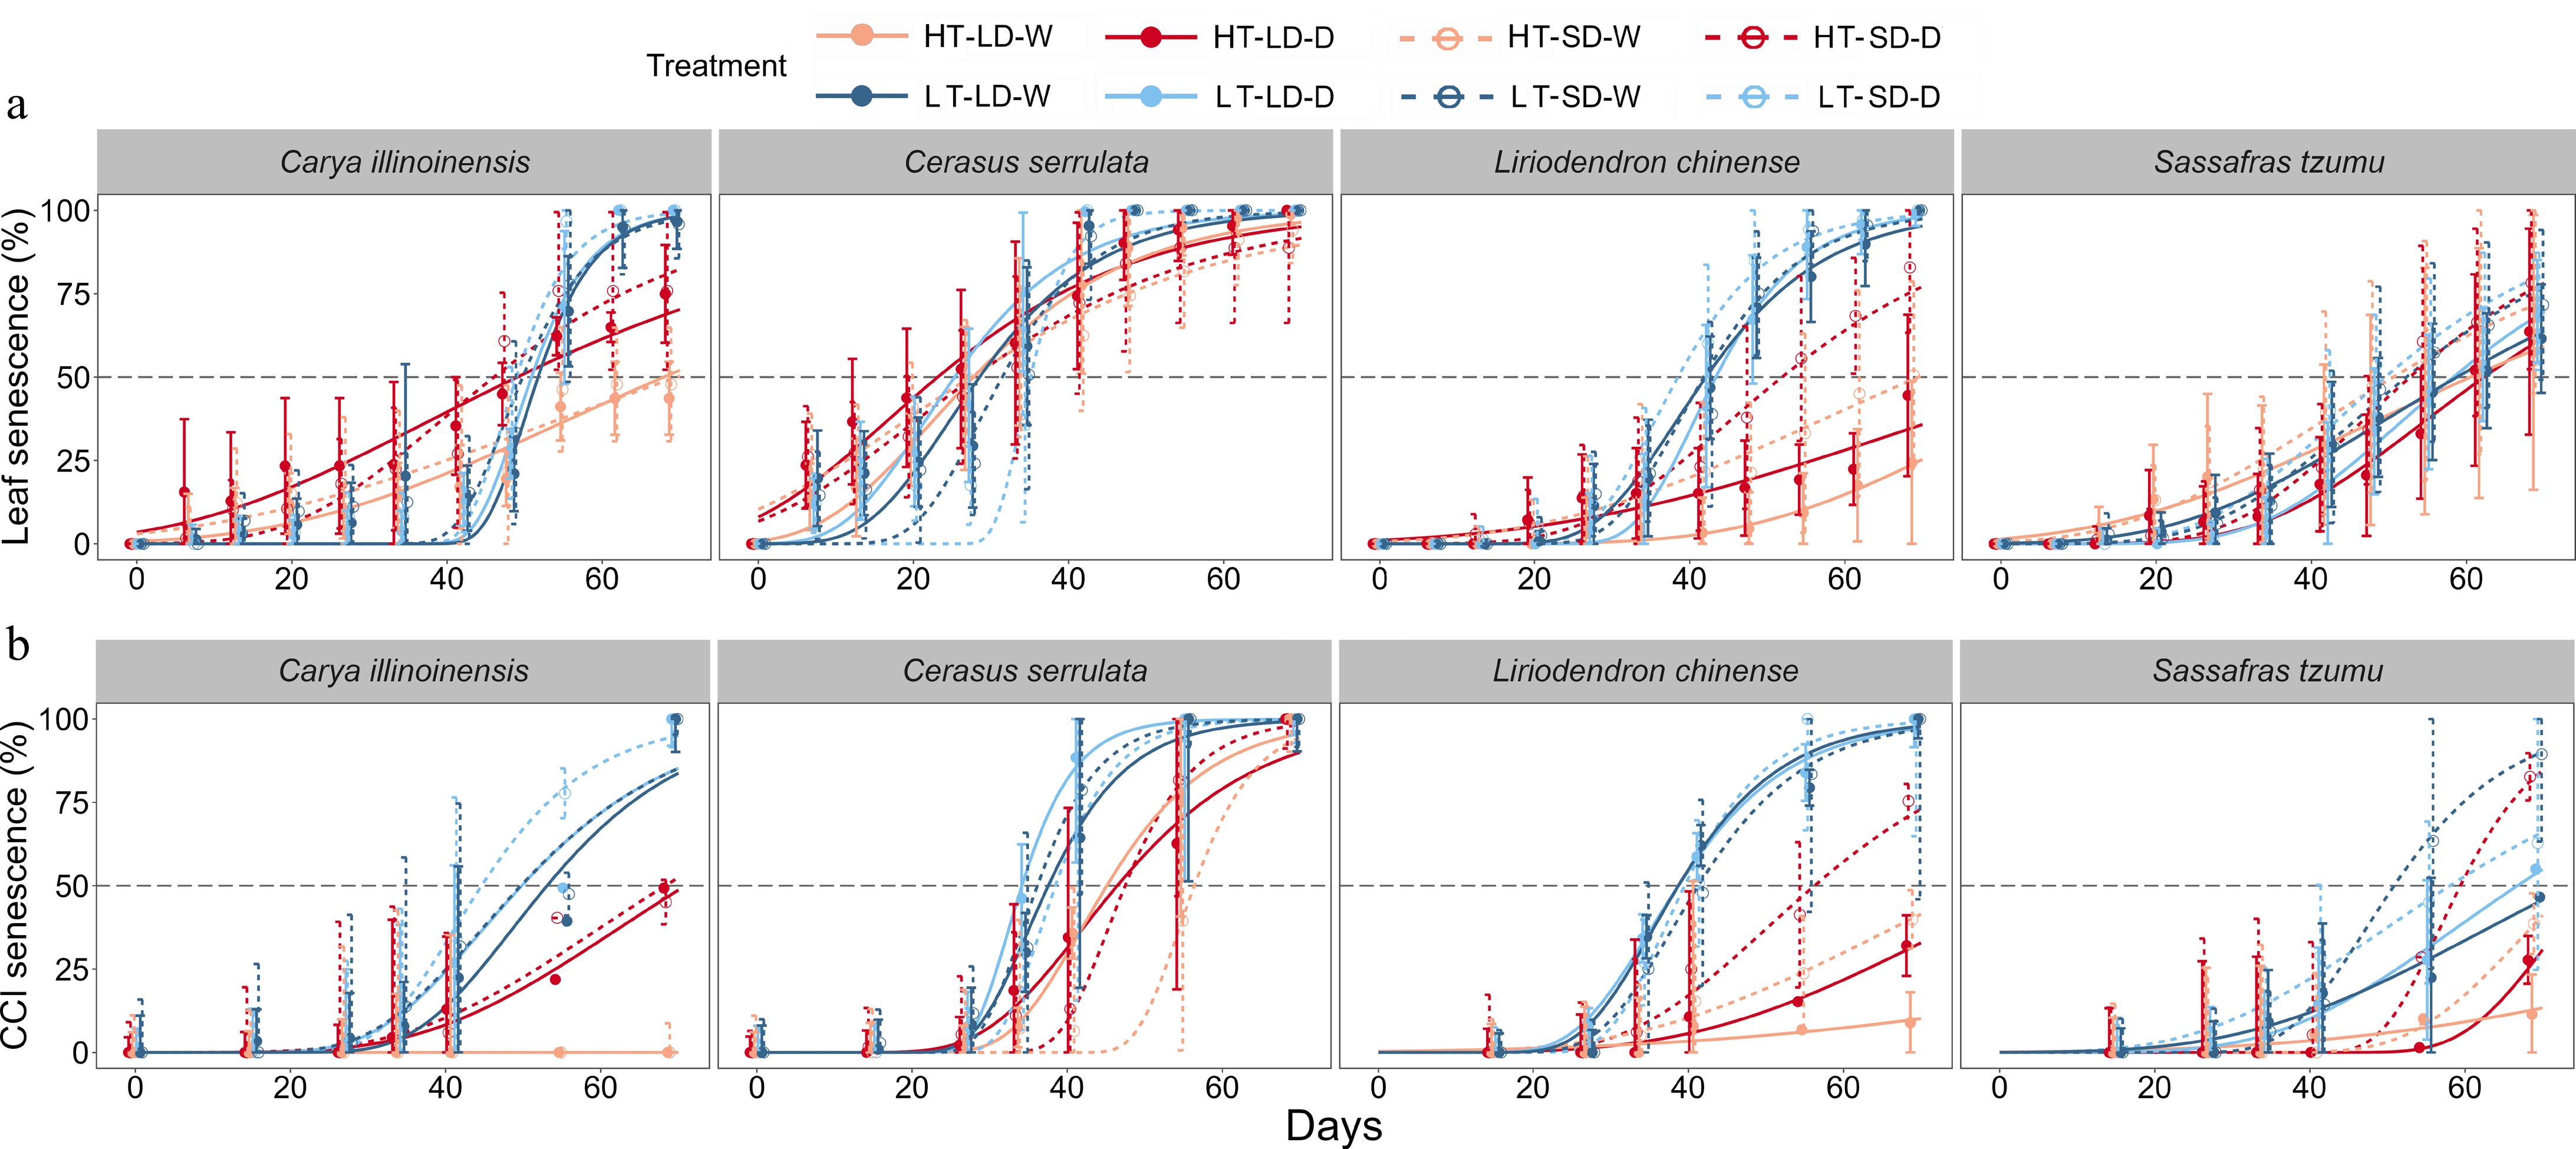
Figure 2.
The observed (points) and fitted (sigmoidal curves) time courses of the mean percentages of (a) leaf senescence and (b) CCI senescence (Chlorophyll Content Index, SPAD) in seedlings of four subtropical tree species in a factorial experiment addressing the effects of the air temperature, photoperiod, and soil moisture. For each individual seedling, leaf senescence was determined to occur when 50% of the leaves were either yellow or had fallen, and CCI senescence when the SPAD value decreased by 50% from its maximum value. Treatments: HT = high temperature (18–25 °C), LT = low temperature (8–15 °C), LD = long day (14 h), SD = short day (10 h), W = well-watered seedlings, D = drought-treated seedlings. The error bars represent the standard deviation across individual seedlings in the same treatment.
-
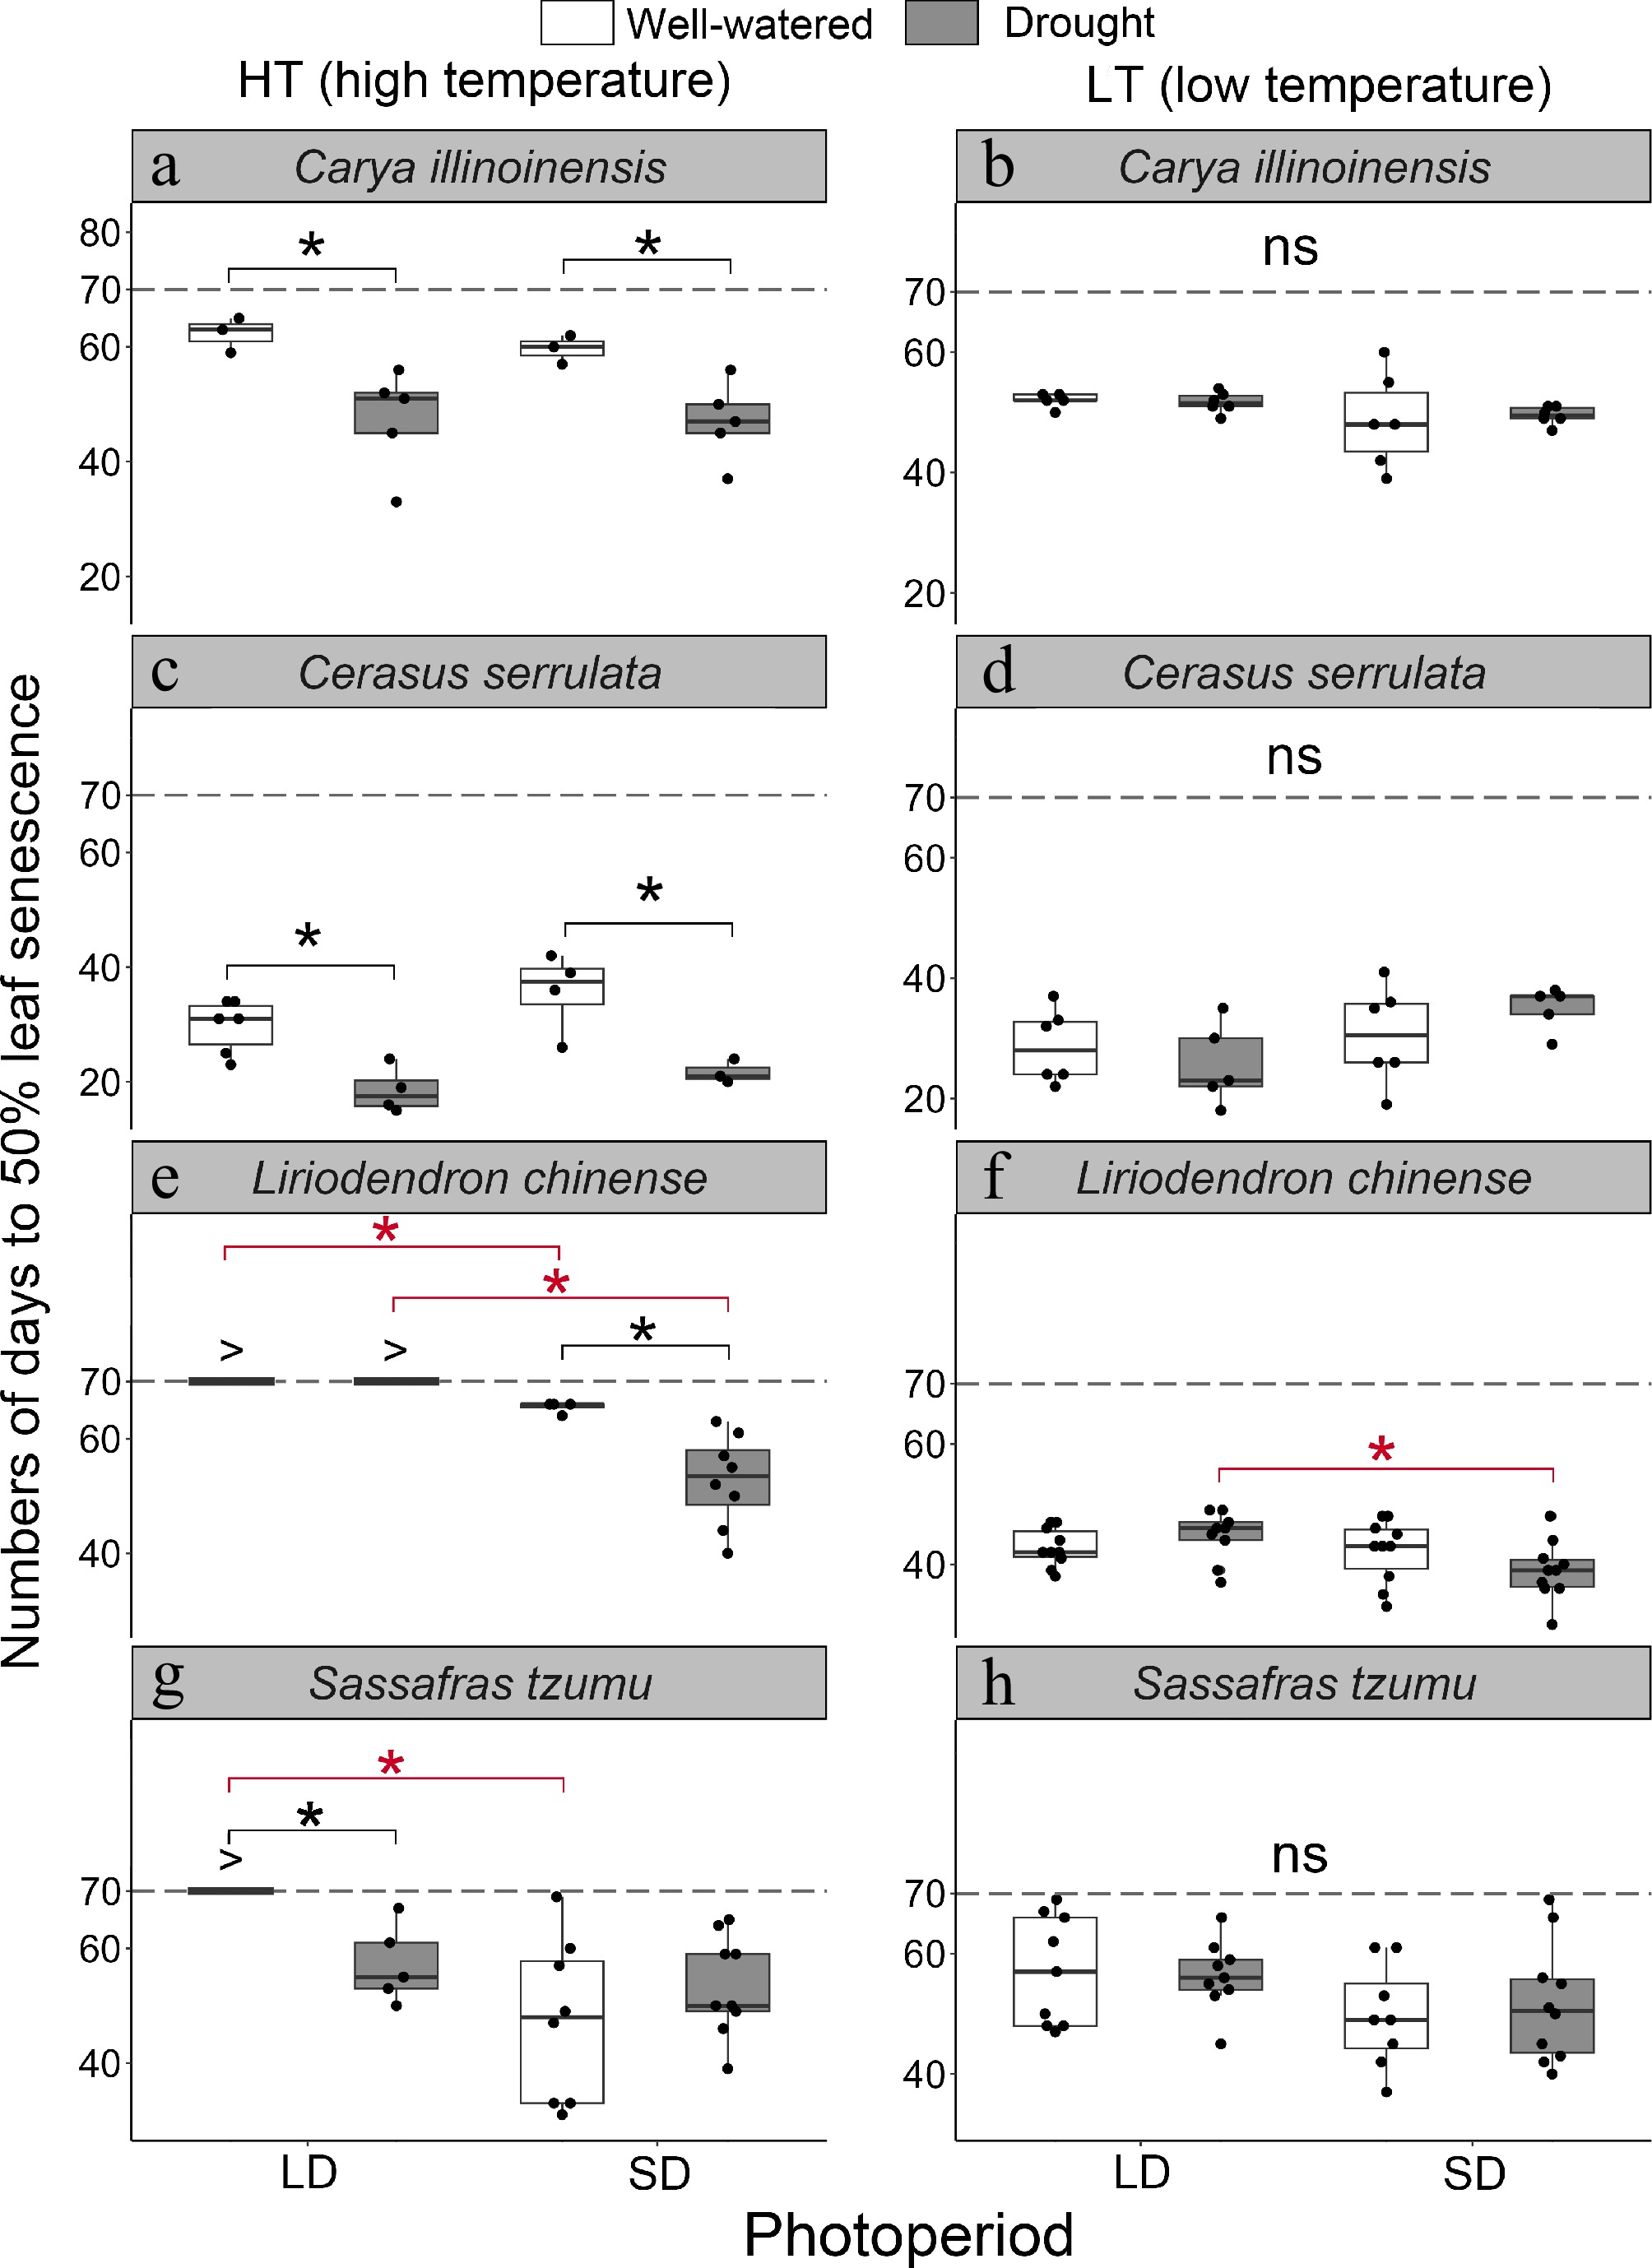
Figure 3.
The number of days to leaf senescence in seedlings of four subtropical tree species in a factorial experiment addressing the effects of the air temperature, photoperiod, and soil moisture. For each seedling, the date of leaf senescence was determined as the first day when 50% of the leaves were either yellow or had fallen. The statistics shown were calculated across the seedlings of the treatment group meeting this criterion. If the criterion was met in less than 50% of the seedlings in the treatment group, then leaf senescence was considered not to have taken place in that particular treatment group during the experiment. For those treatments, '>' indicates that the number of days to leaf senescence exceeded the duration of the experiment (70 d). Treatments: HT = high temperature (18–25 °C), LT = low temperature (8–15 °C), LD = long day (14 h), SD = short day (10 h), W = well-watered seedlings, D = drought-treated seedlings. The black and red asterisks indicate a statistically significant difference between the two soil moisture treatments and between the two photoperiod treatments, respectively (p < 0.05).
-
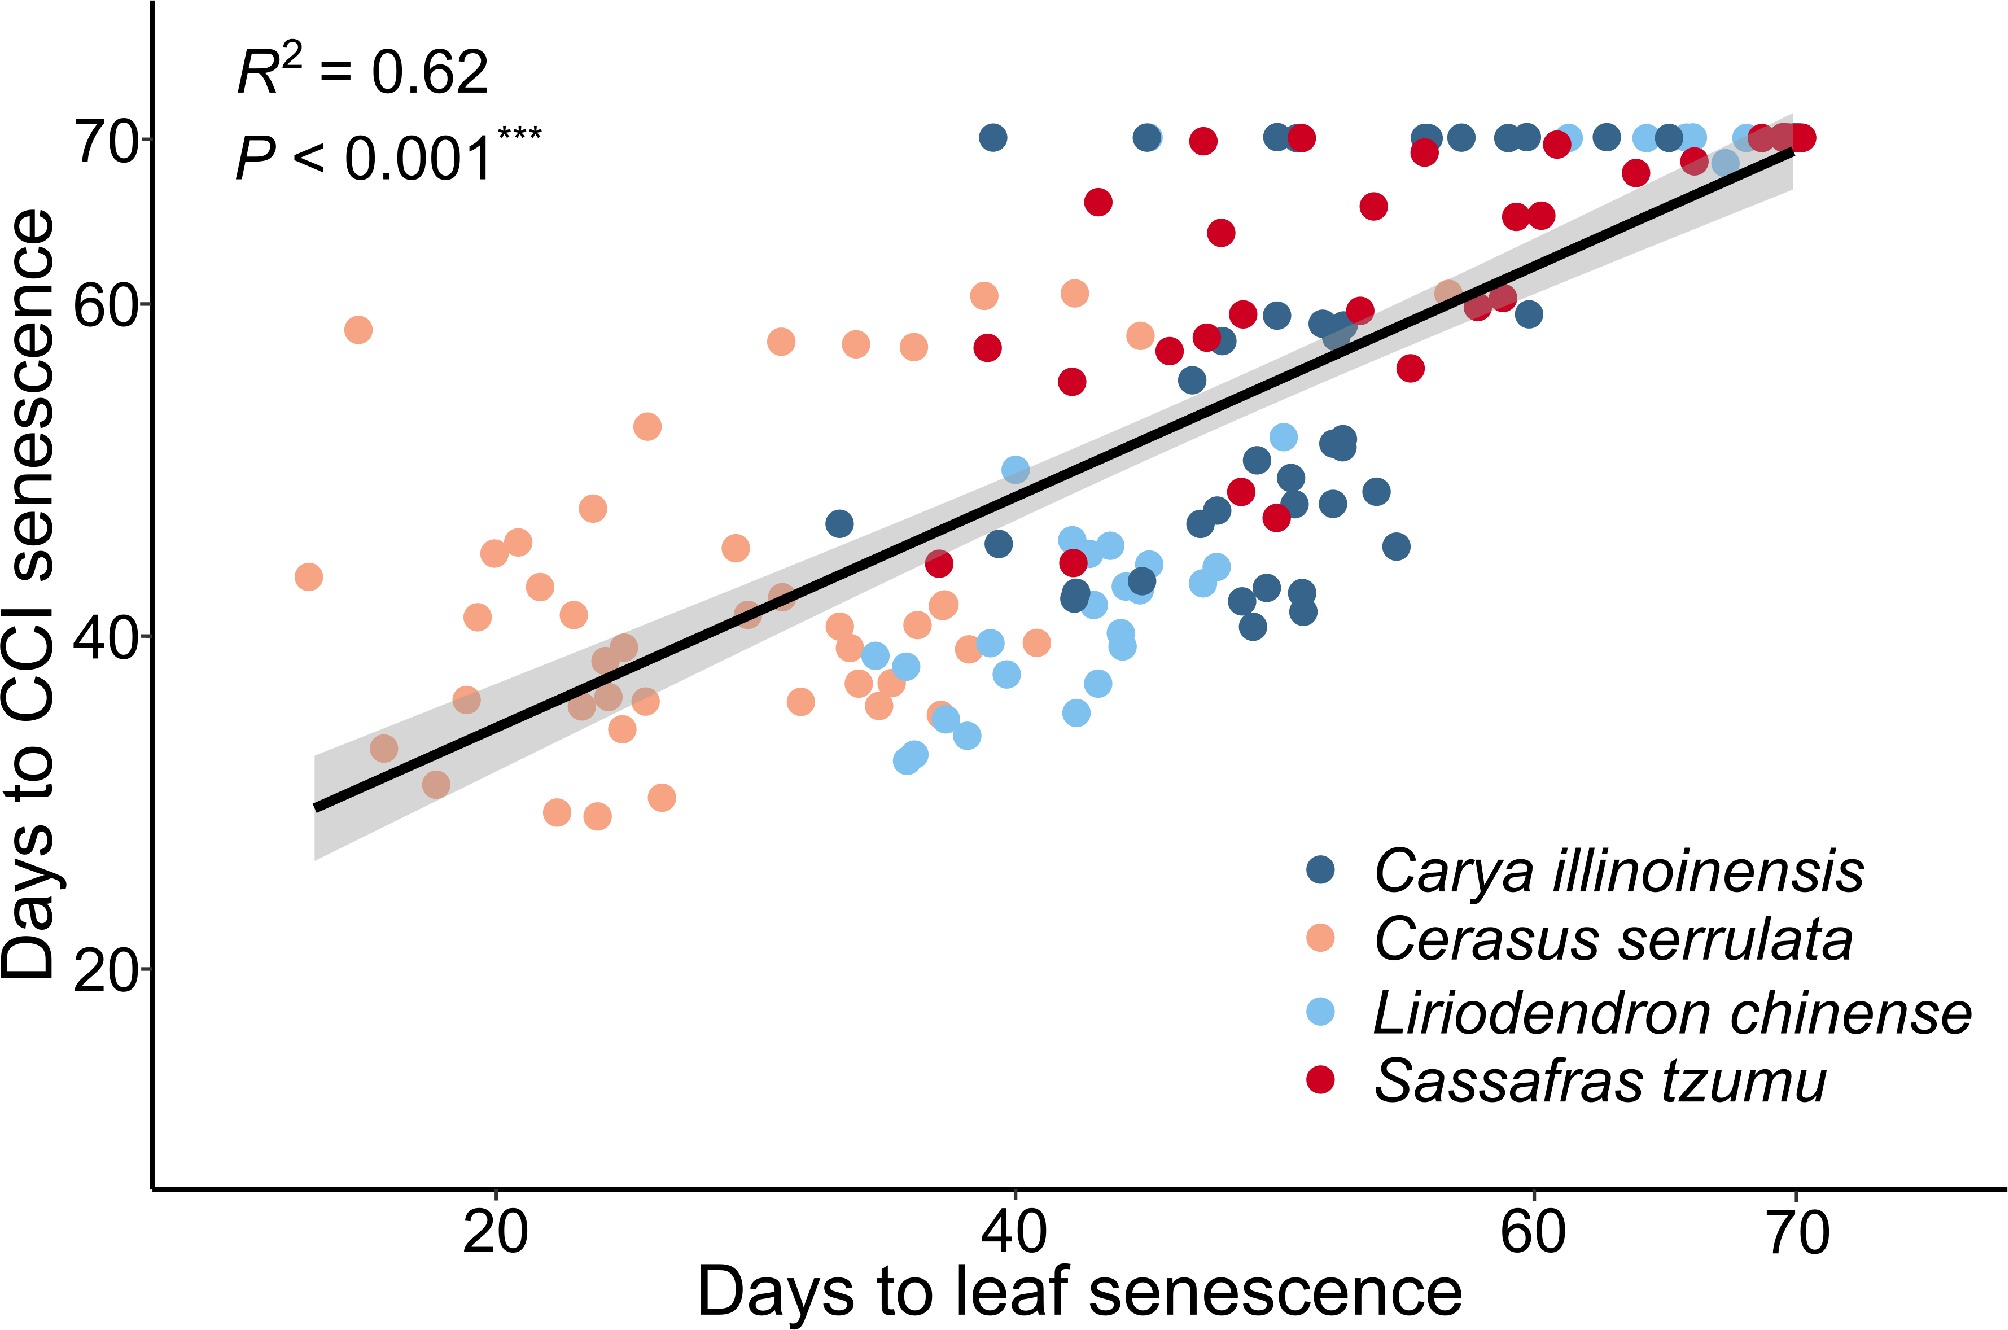
Figure 4.
Correlation between the timing of CCI senescence and leaf senescence in seedlings of four subtropical tree species in a factorial experiment addressing the effects of the air temperature, photoperiod, and soil moisture. The leaf senescence date of each seedling was determined as the first day when 50% of the leaves were either yellow or had fallen. The CCI senescence date of each seedling was determined as the day when the Chlorophyll Content Index (SPAD) decreased by 50% from its maximum.
-
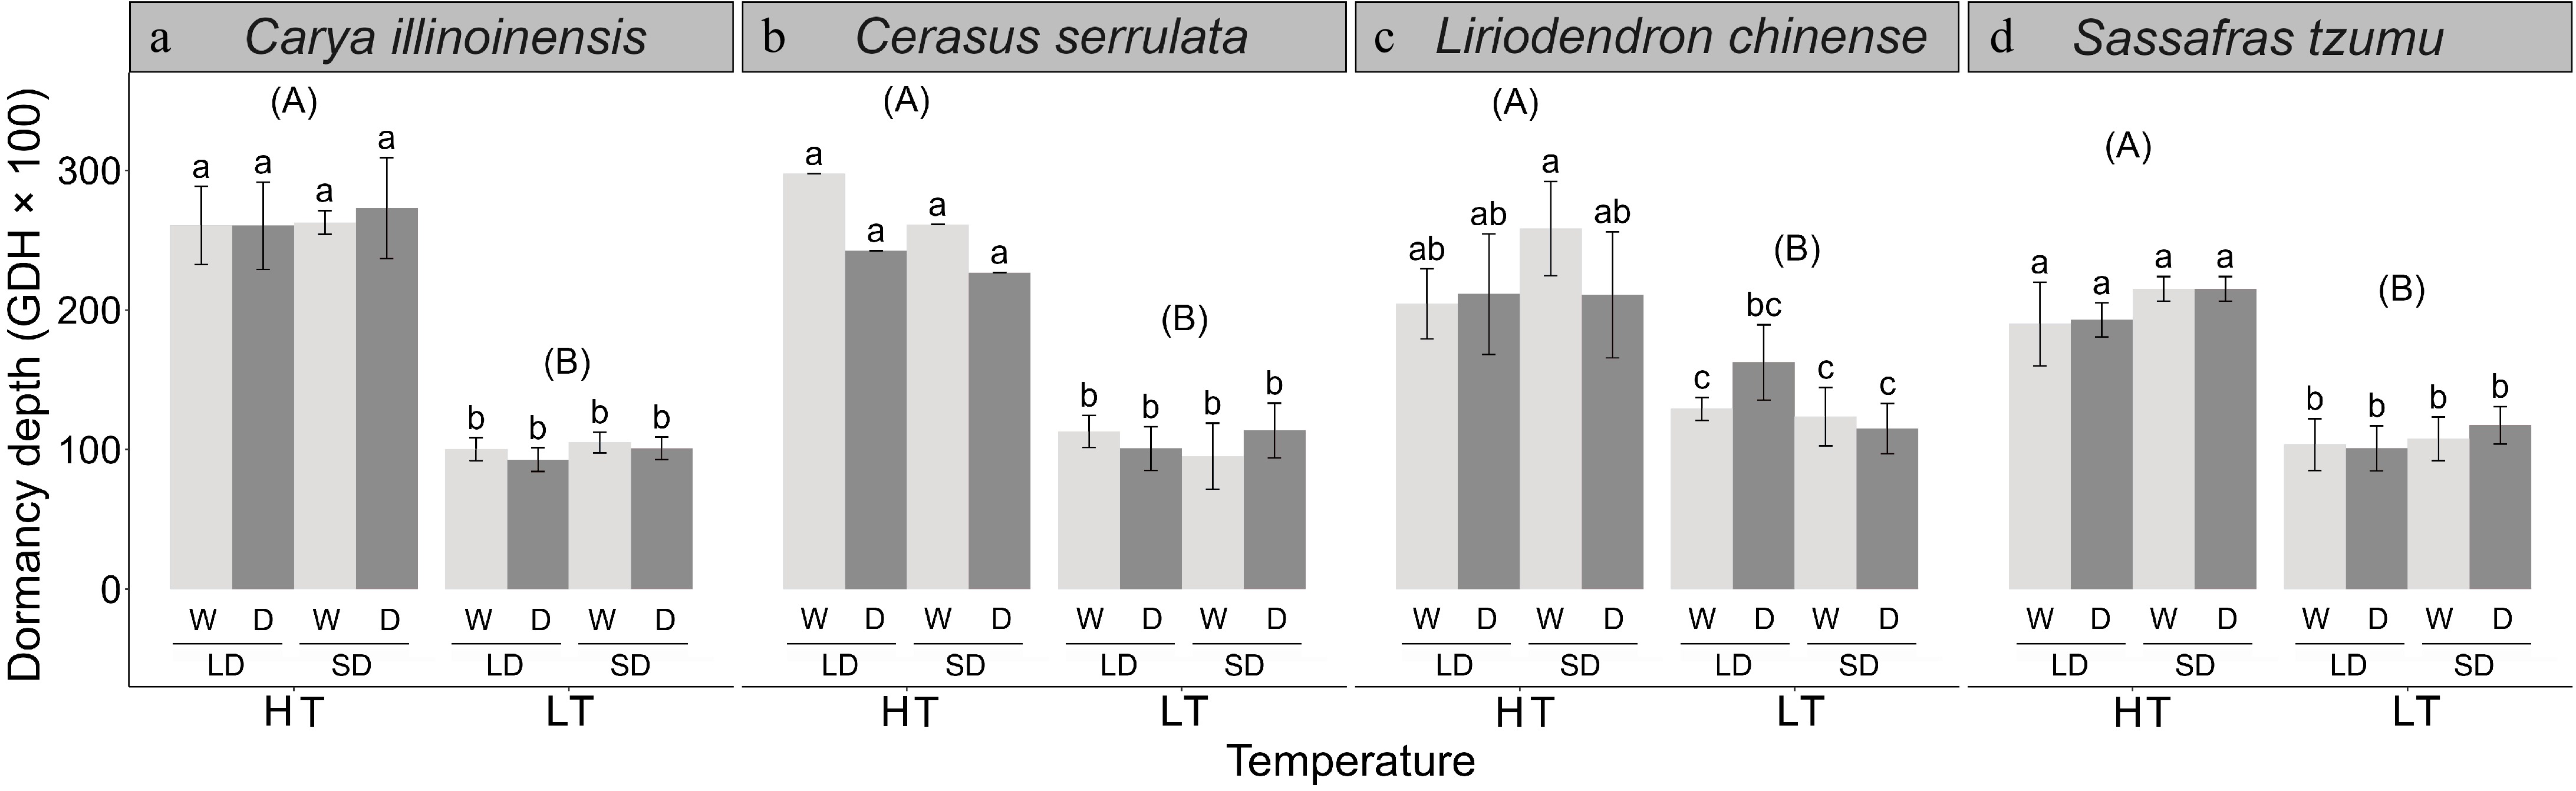
Figure 5.
The dormancy depth in seedlings of four subtropical tree species in a factorial experiment addressing the effects of the air temperature, photoperiod, and soil moisture. The dormancy depth was determined after the 70-d treatments as the growing degree hours (GDHs, mean ± standard deviation) required for leaf unfolding under growth-promoting test conditions. The treatments: HT = high temperature (18–25 °C), LT = low temperature (8–15 °C), LD = long day (14 h), SD = short day (10 h), W = well-watered seedlings, D = drought-treated seedlings. The different lower-case letters above the bars indicate a significant difference between the treatments in the mean dormancy depth (post-hoc Tukey's tests, p < 0.05). The different upper-case letters indicate a significant difference between high-temperature (HT) and low-temperature (LT) treatments in the mean dormancy depth for data pooled across the two photoperiod treatments and the two soil moisture treatment.
-
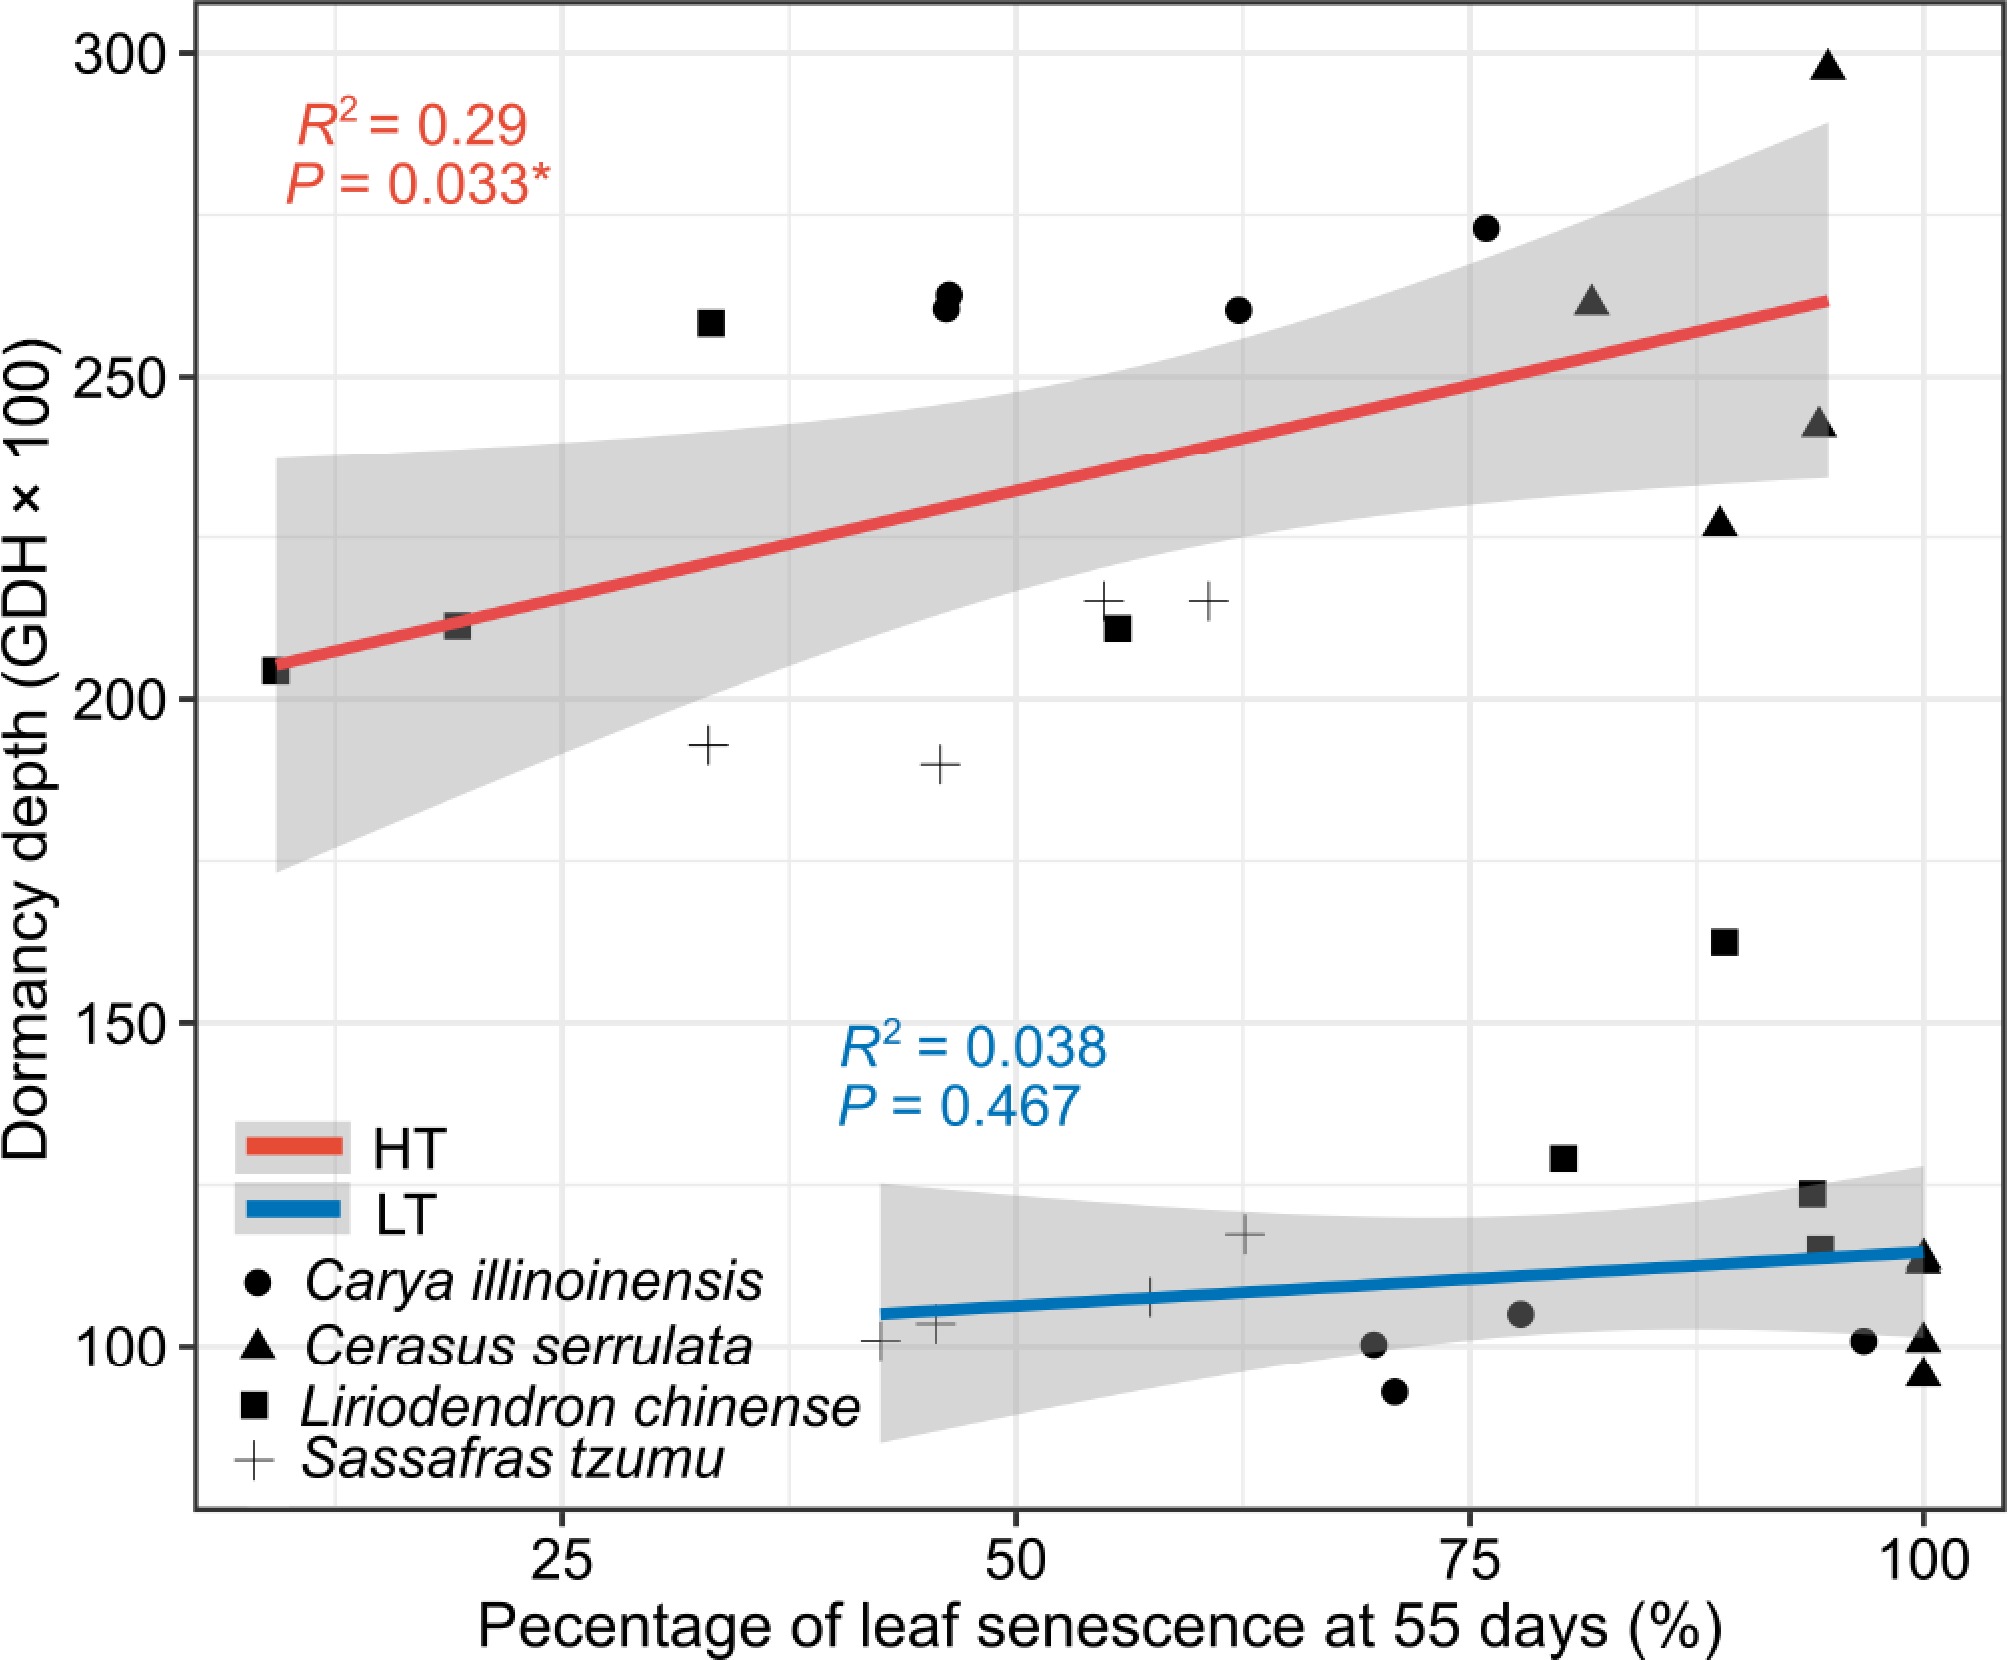
Figure 6.
The relation between dormancy depth and the leaf senescence percentage in seedlings of four subtropical tree species in a factorial experiment addressing the effects of the air temperature, photoperiod, and soil moisture. The dormancy depth was determined after the 70-d treatments as the growing degree hours (GDHs, mean ± standard deviation) required for leaf unfolding under growth-promoting test conditions. Leaf senescence was determined to occur in a given seedling when 50% of its leaves were yellow or had fallen. The percentage of seedlings showing leaf senescence in each treatment group was determined after 55 d of the treatment (see Materials and methods). The dependence is shown for data pooled across the two photoperiod and the two soil moisture treatment but separately for treatments with a high temperature (HT, 18–25 °C, red line), and with low-temperature (LT, 8–15 °C, blue line).
-
Treatment Carya illinoinensis Cerasus serrulata Liriodendron chinense Sassafras tzumu F P F P F P F P T 894.88 < 0.001*** 251.60 < 0.001*** 106.62 < 0.001*** 398.89 < 0.001*** P 1.385 0.246 0.475 0.499 0.002 0.965 12.415 0.001** SM 0.060 0.936 0.418 0.526 0.178 0.675 0.256 0.616 T × P 0.001 0.980 1.529 0.231 9.416 0.004** 1.948 0.171 T × SM 0.897 0.349 5.333 0.0323* 3.590 0.065 0.041 0.841 P × SM 0.344 0.561 4.144 0.056 7.664 0.009 0.241 0.626 T × P × SM 0.086 0.771 0.115 0.738 0.086 0.770 0.631 0.432 The values shown are the F-statistic of the analysis of variance (ANOVA). ***p < 0.001; **p < 0.01; *p < 0.05. The p-values in bold are significant at p < 0.05. Table 1.
A three-way analysis of variance for the effects of the air temperature (T), photoperiod (P), soil moisture (SM), and their interactions on the dormancy depth. The dormancy depth was determined after the 70-d treatments in terms of the growing degree hours (GDHs, mean ± standard deviation) needed for leaf unfolding under growth-promoting test conditions.
Figures
(6)
Tables
(1)