-
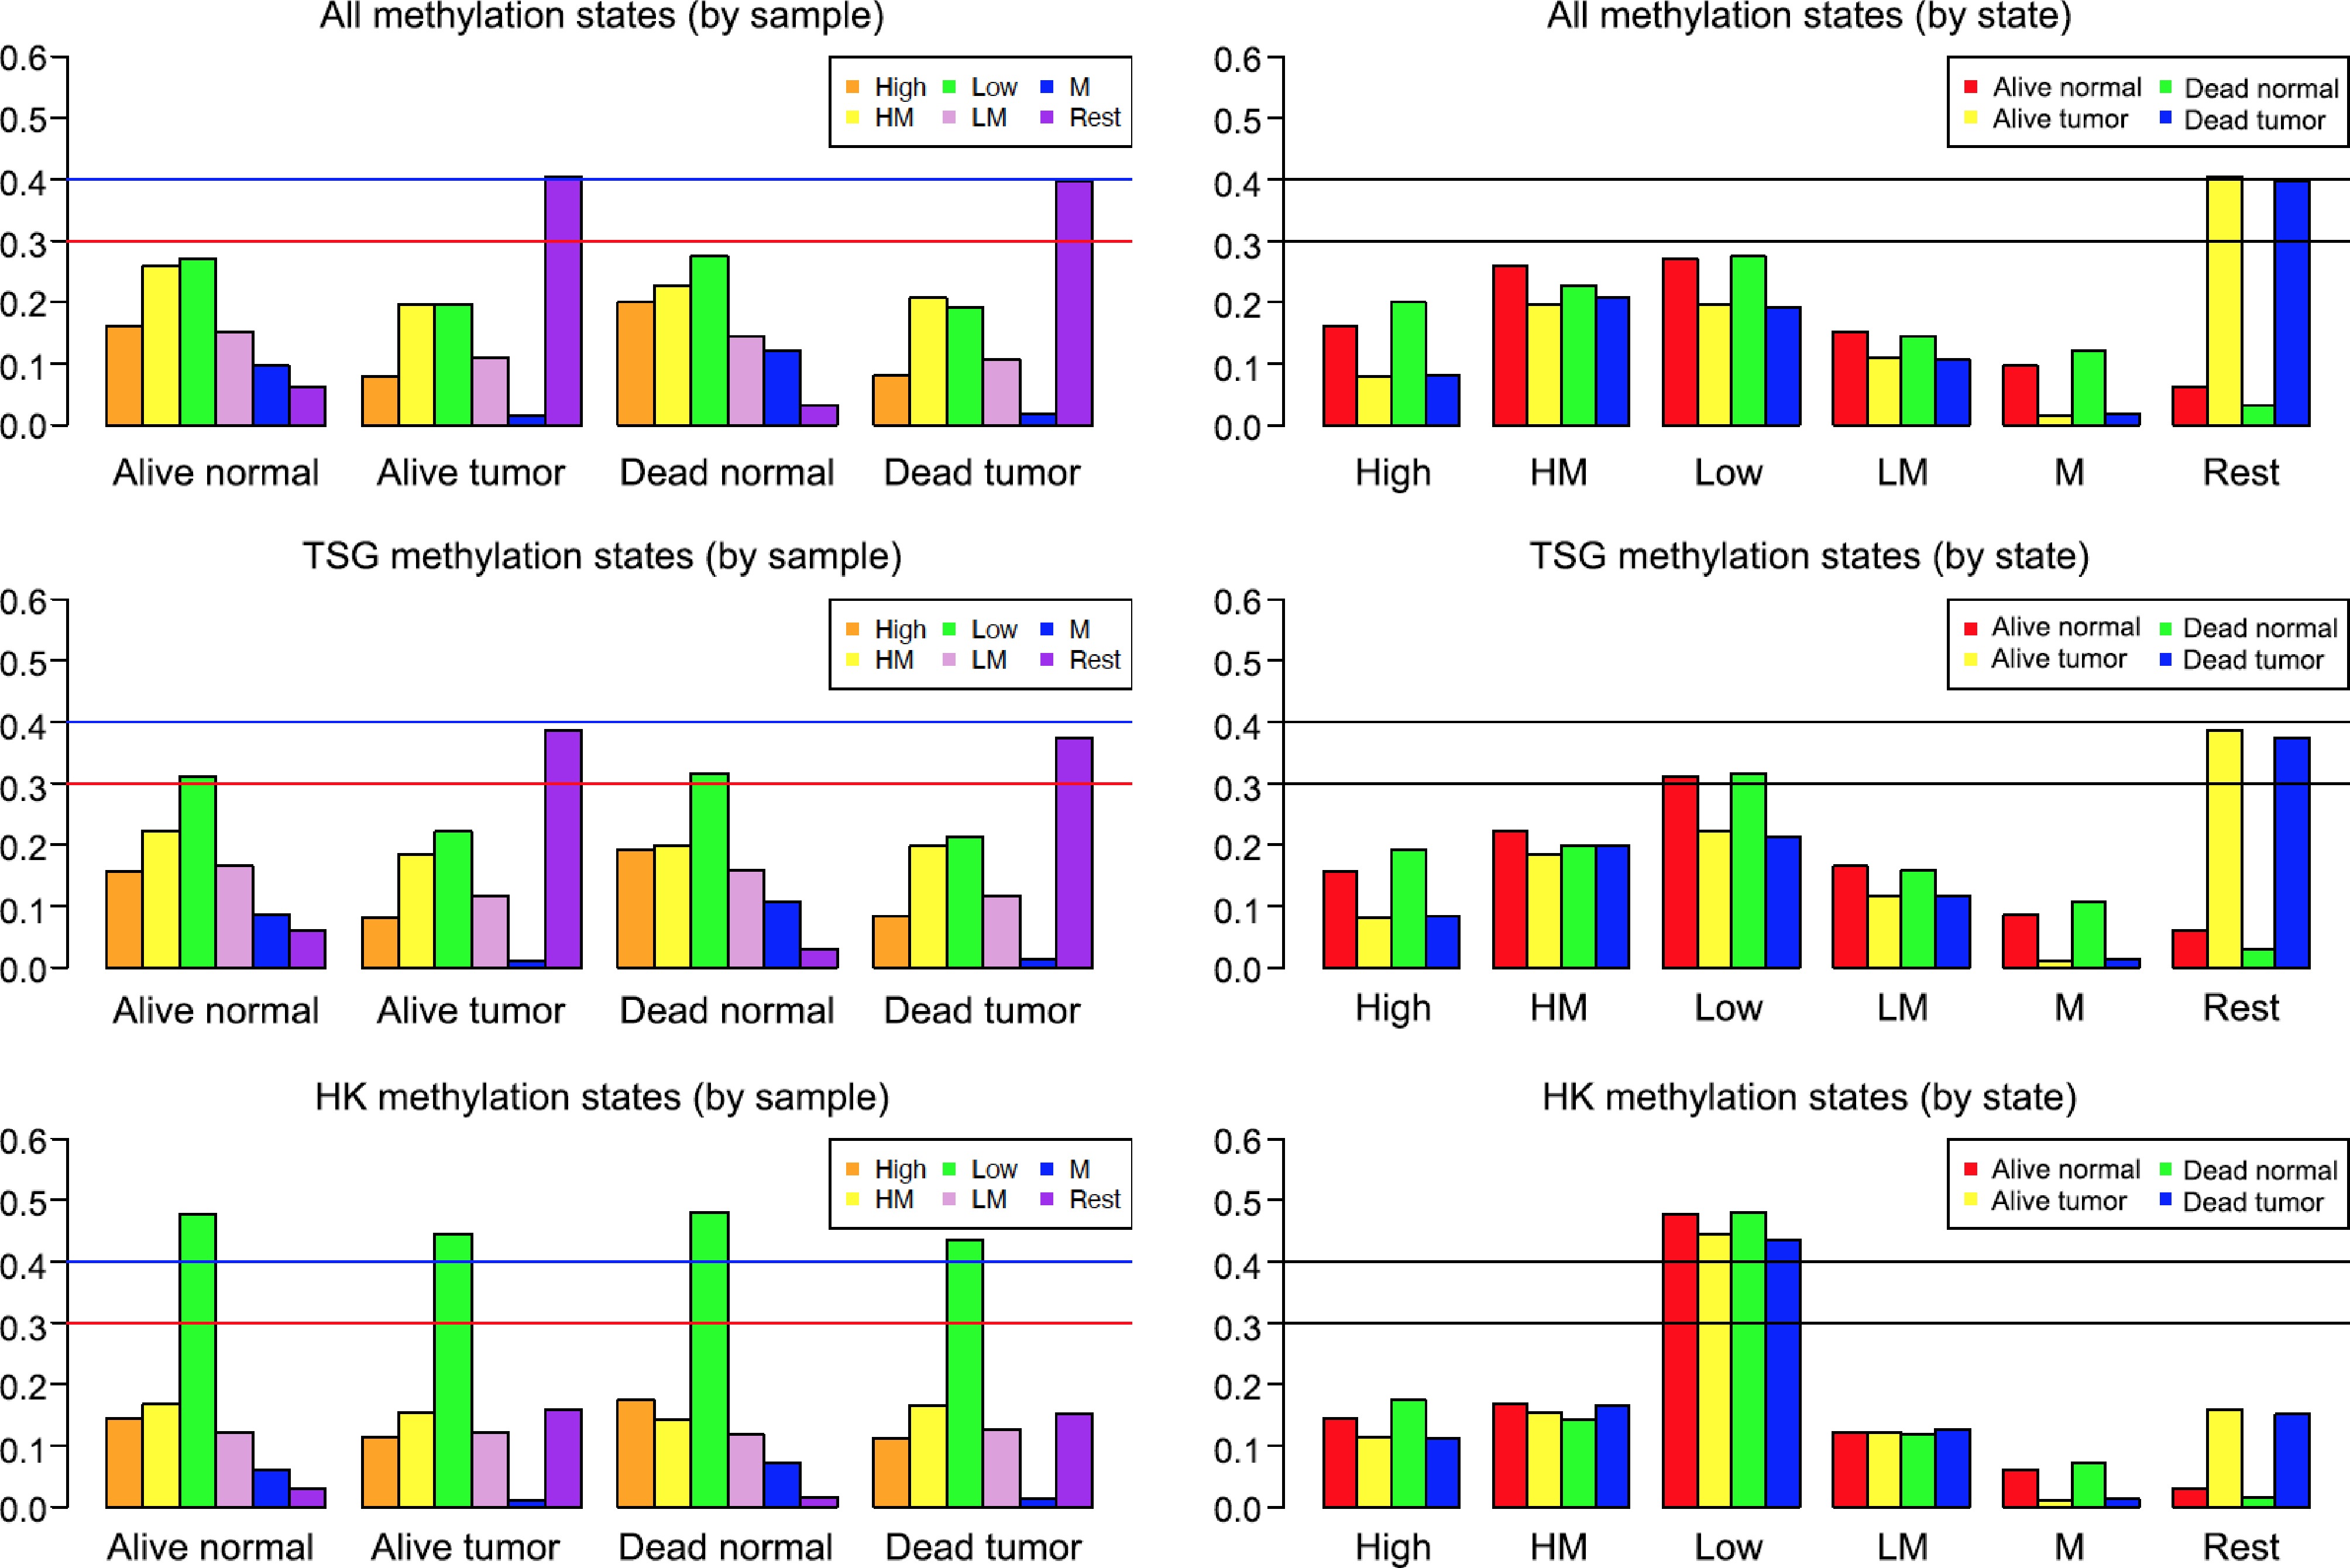
Figure 1.
Methylation states of various breast cancer samples. The vertical axis is proportion (or percentage, e.g., 0.6 means 60%). The left three plots were generated based on samples: Alive Normal, Alive Tumor, Dead Normal, and Dead Tumor. The right three plots were made based on methylation states: High, High-Median (HM), Low, Low-Median (LM), Median (M), and Rest. Two horizontal lines were drawn at 30% and 40% (i.e., 0.3 and 0.4) to make it easy to compare different samples and states.
-
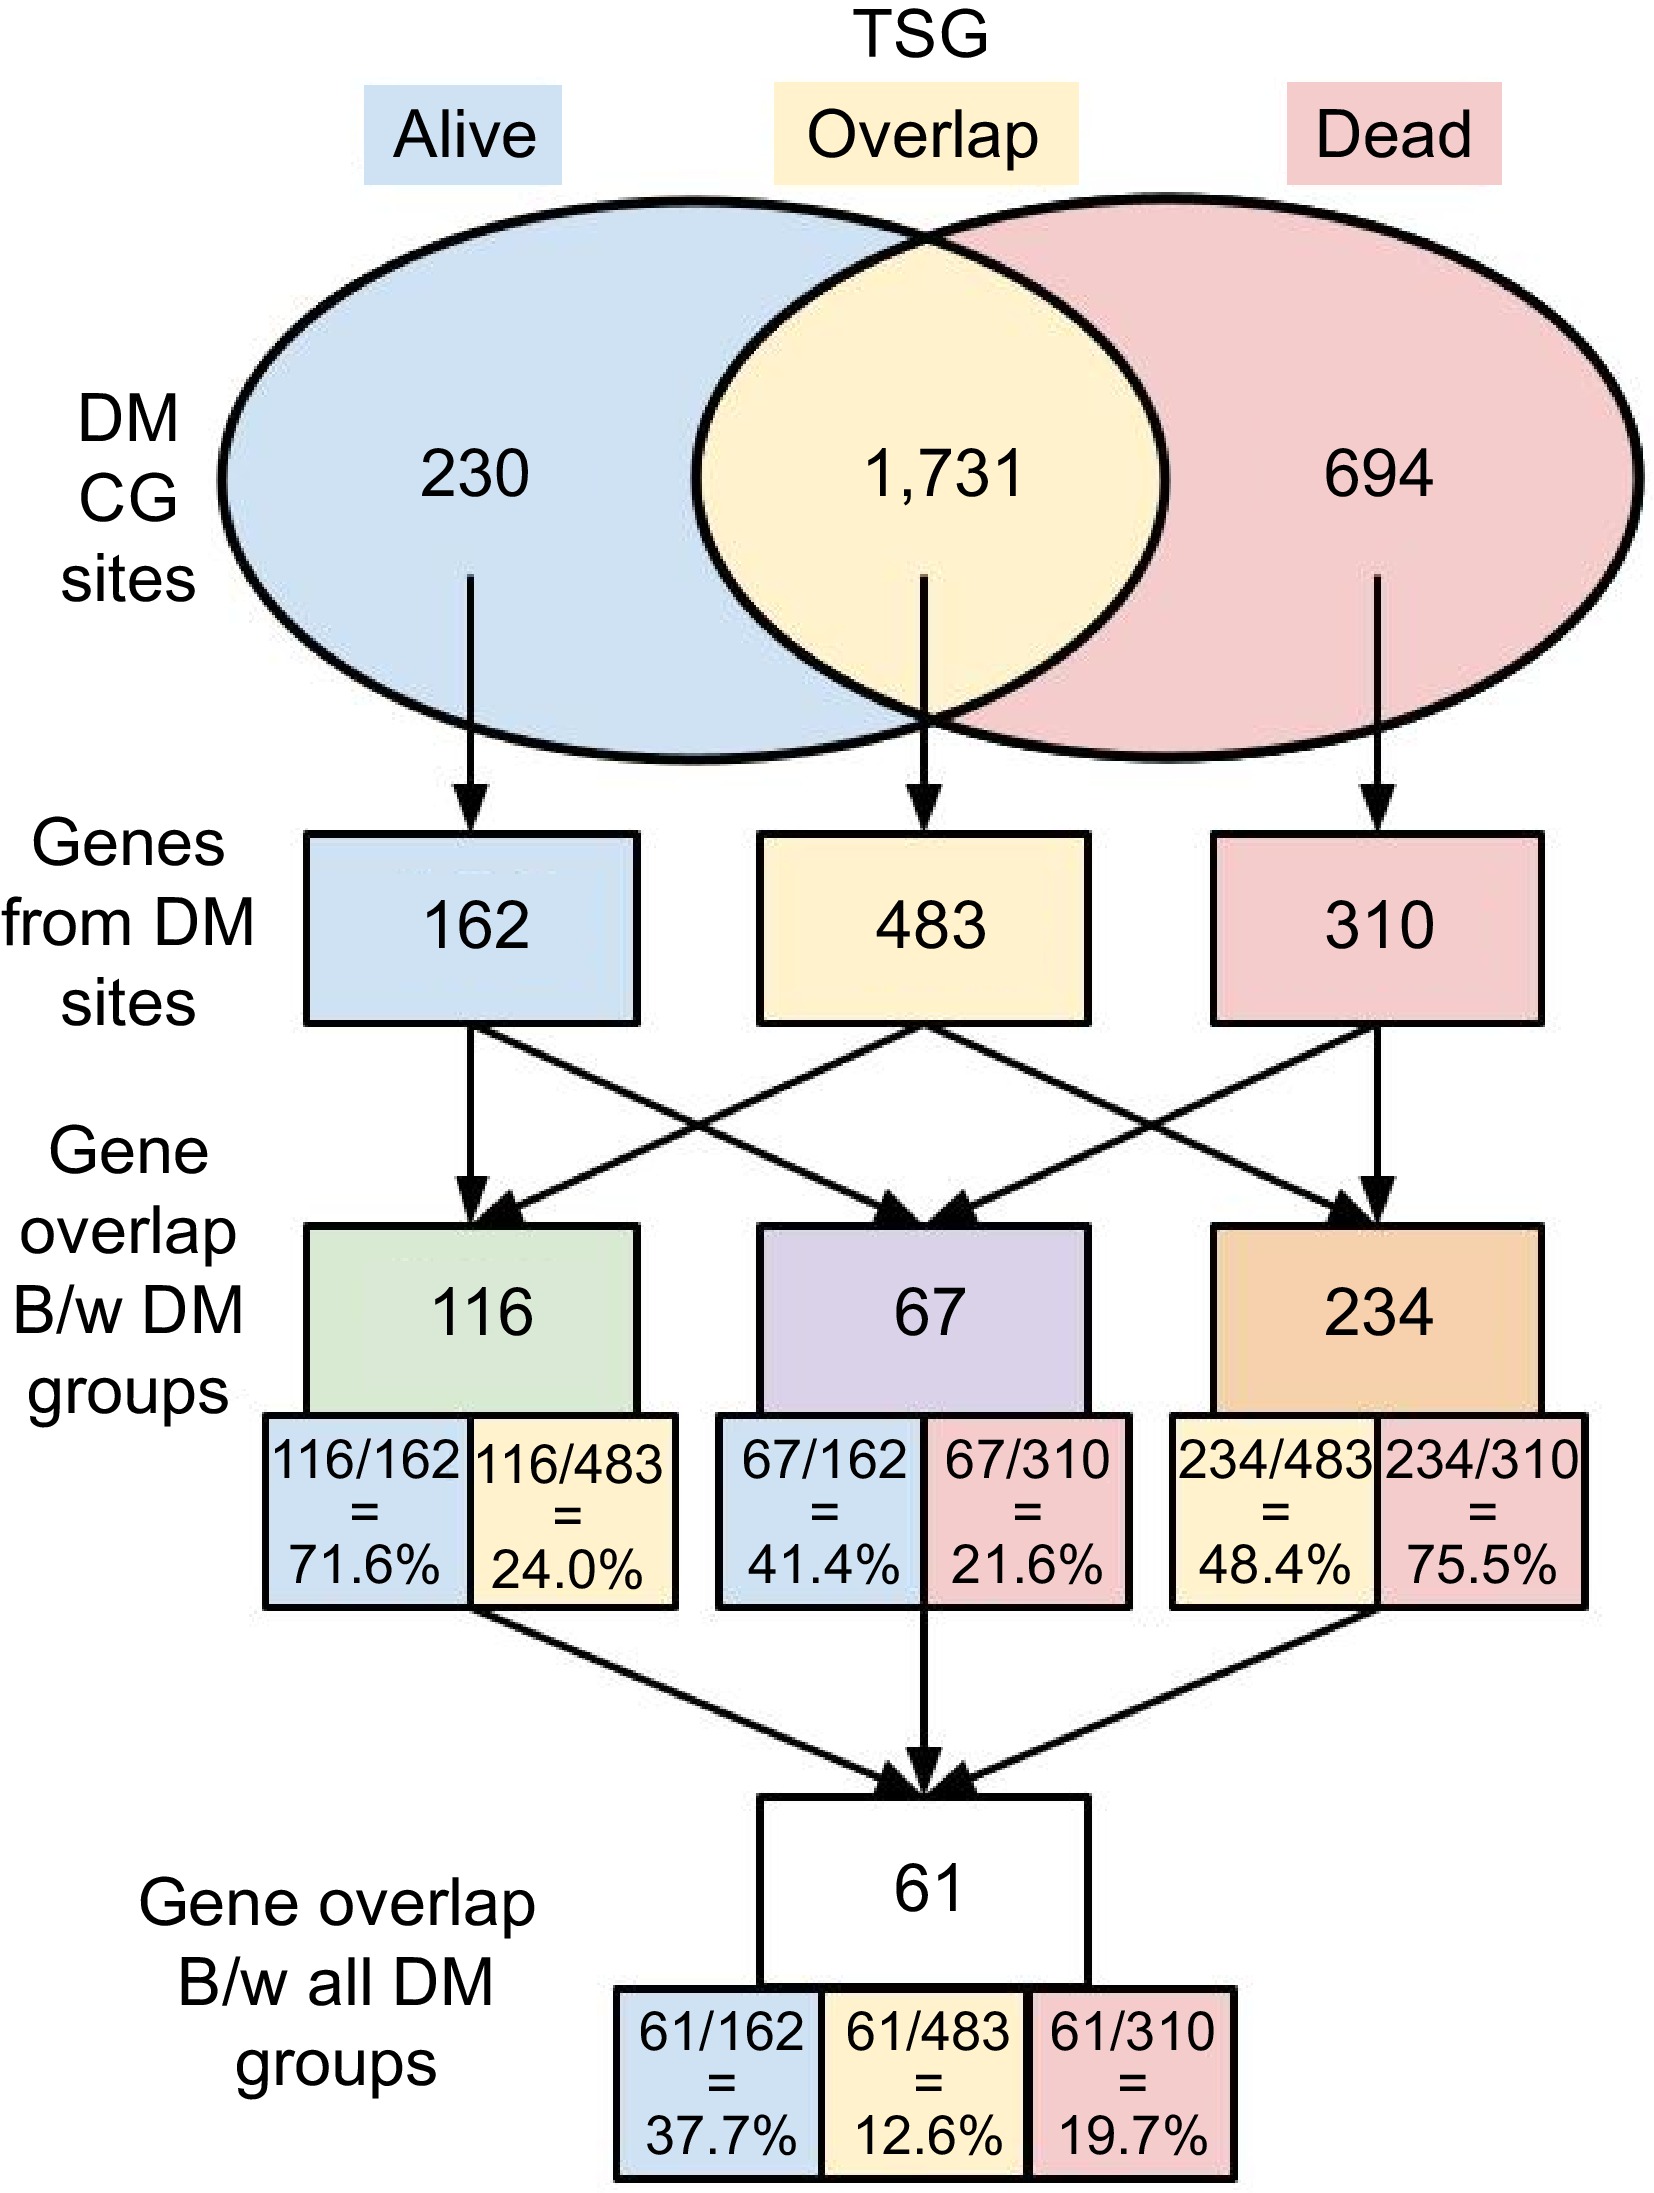
Figure 2.
Numbers of DM sites and associated genes. DM sites were identified between tumor and normal tissues in both 53-Alive and 32-Dead data. DM sites and corresponding genes associated with DM sites in each group were identified, i.e., alive-only, dead-only, and overlap in both Alive and Dead samples.
-
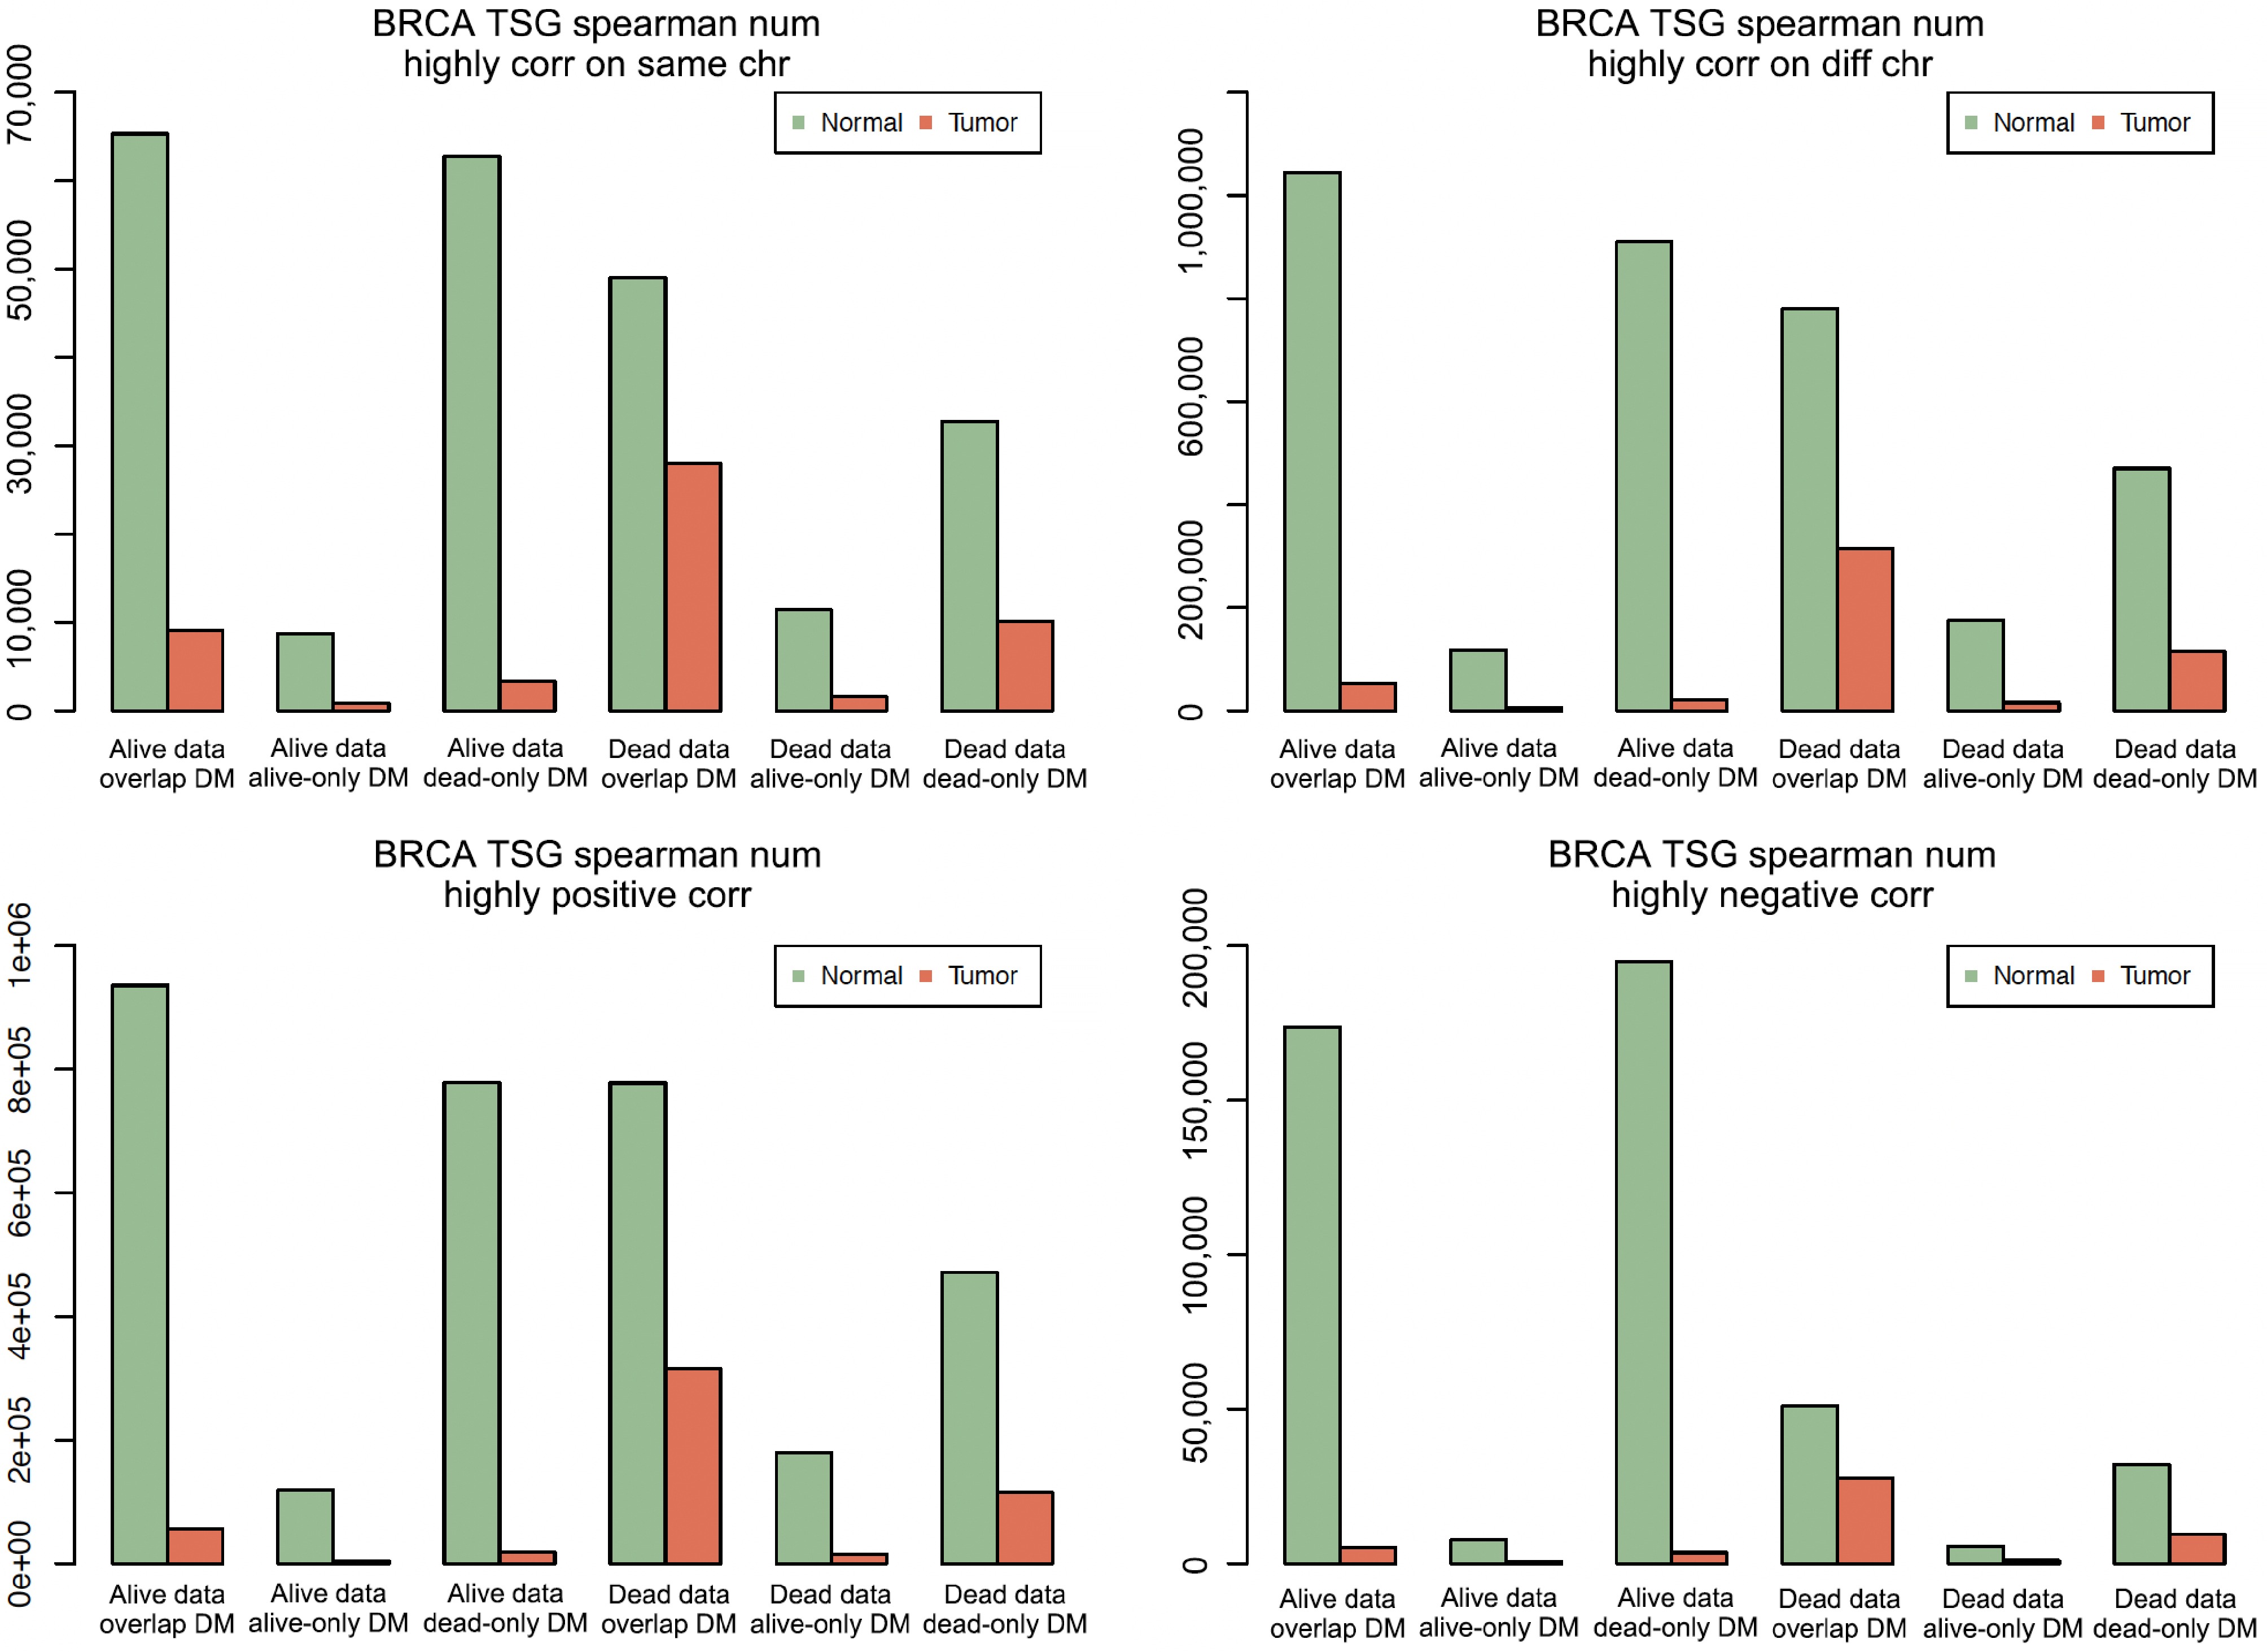
Figure 3.
The total number of highly correlated pairs in different groups. BRCA means breast cancer. In each of the four plots, the first three bar clusters are for 'Alive data, Overlap DM', 'Alive Data, Alive-only DM', and 'Alive Data, Dead-only DM', and the last three bar clusters are for 'Dead Data, Overlap DM', 'Dead Data, Alive-only DM', and 'Dead Data, Dead-only DM'.
-
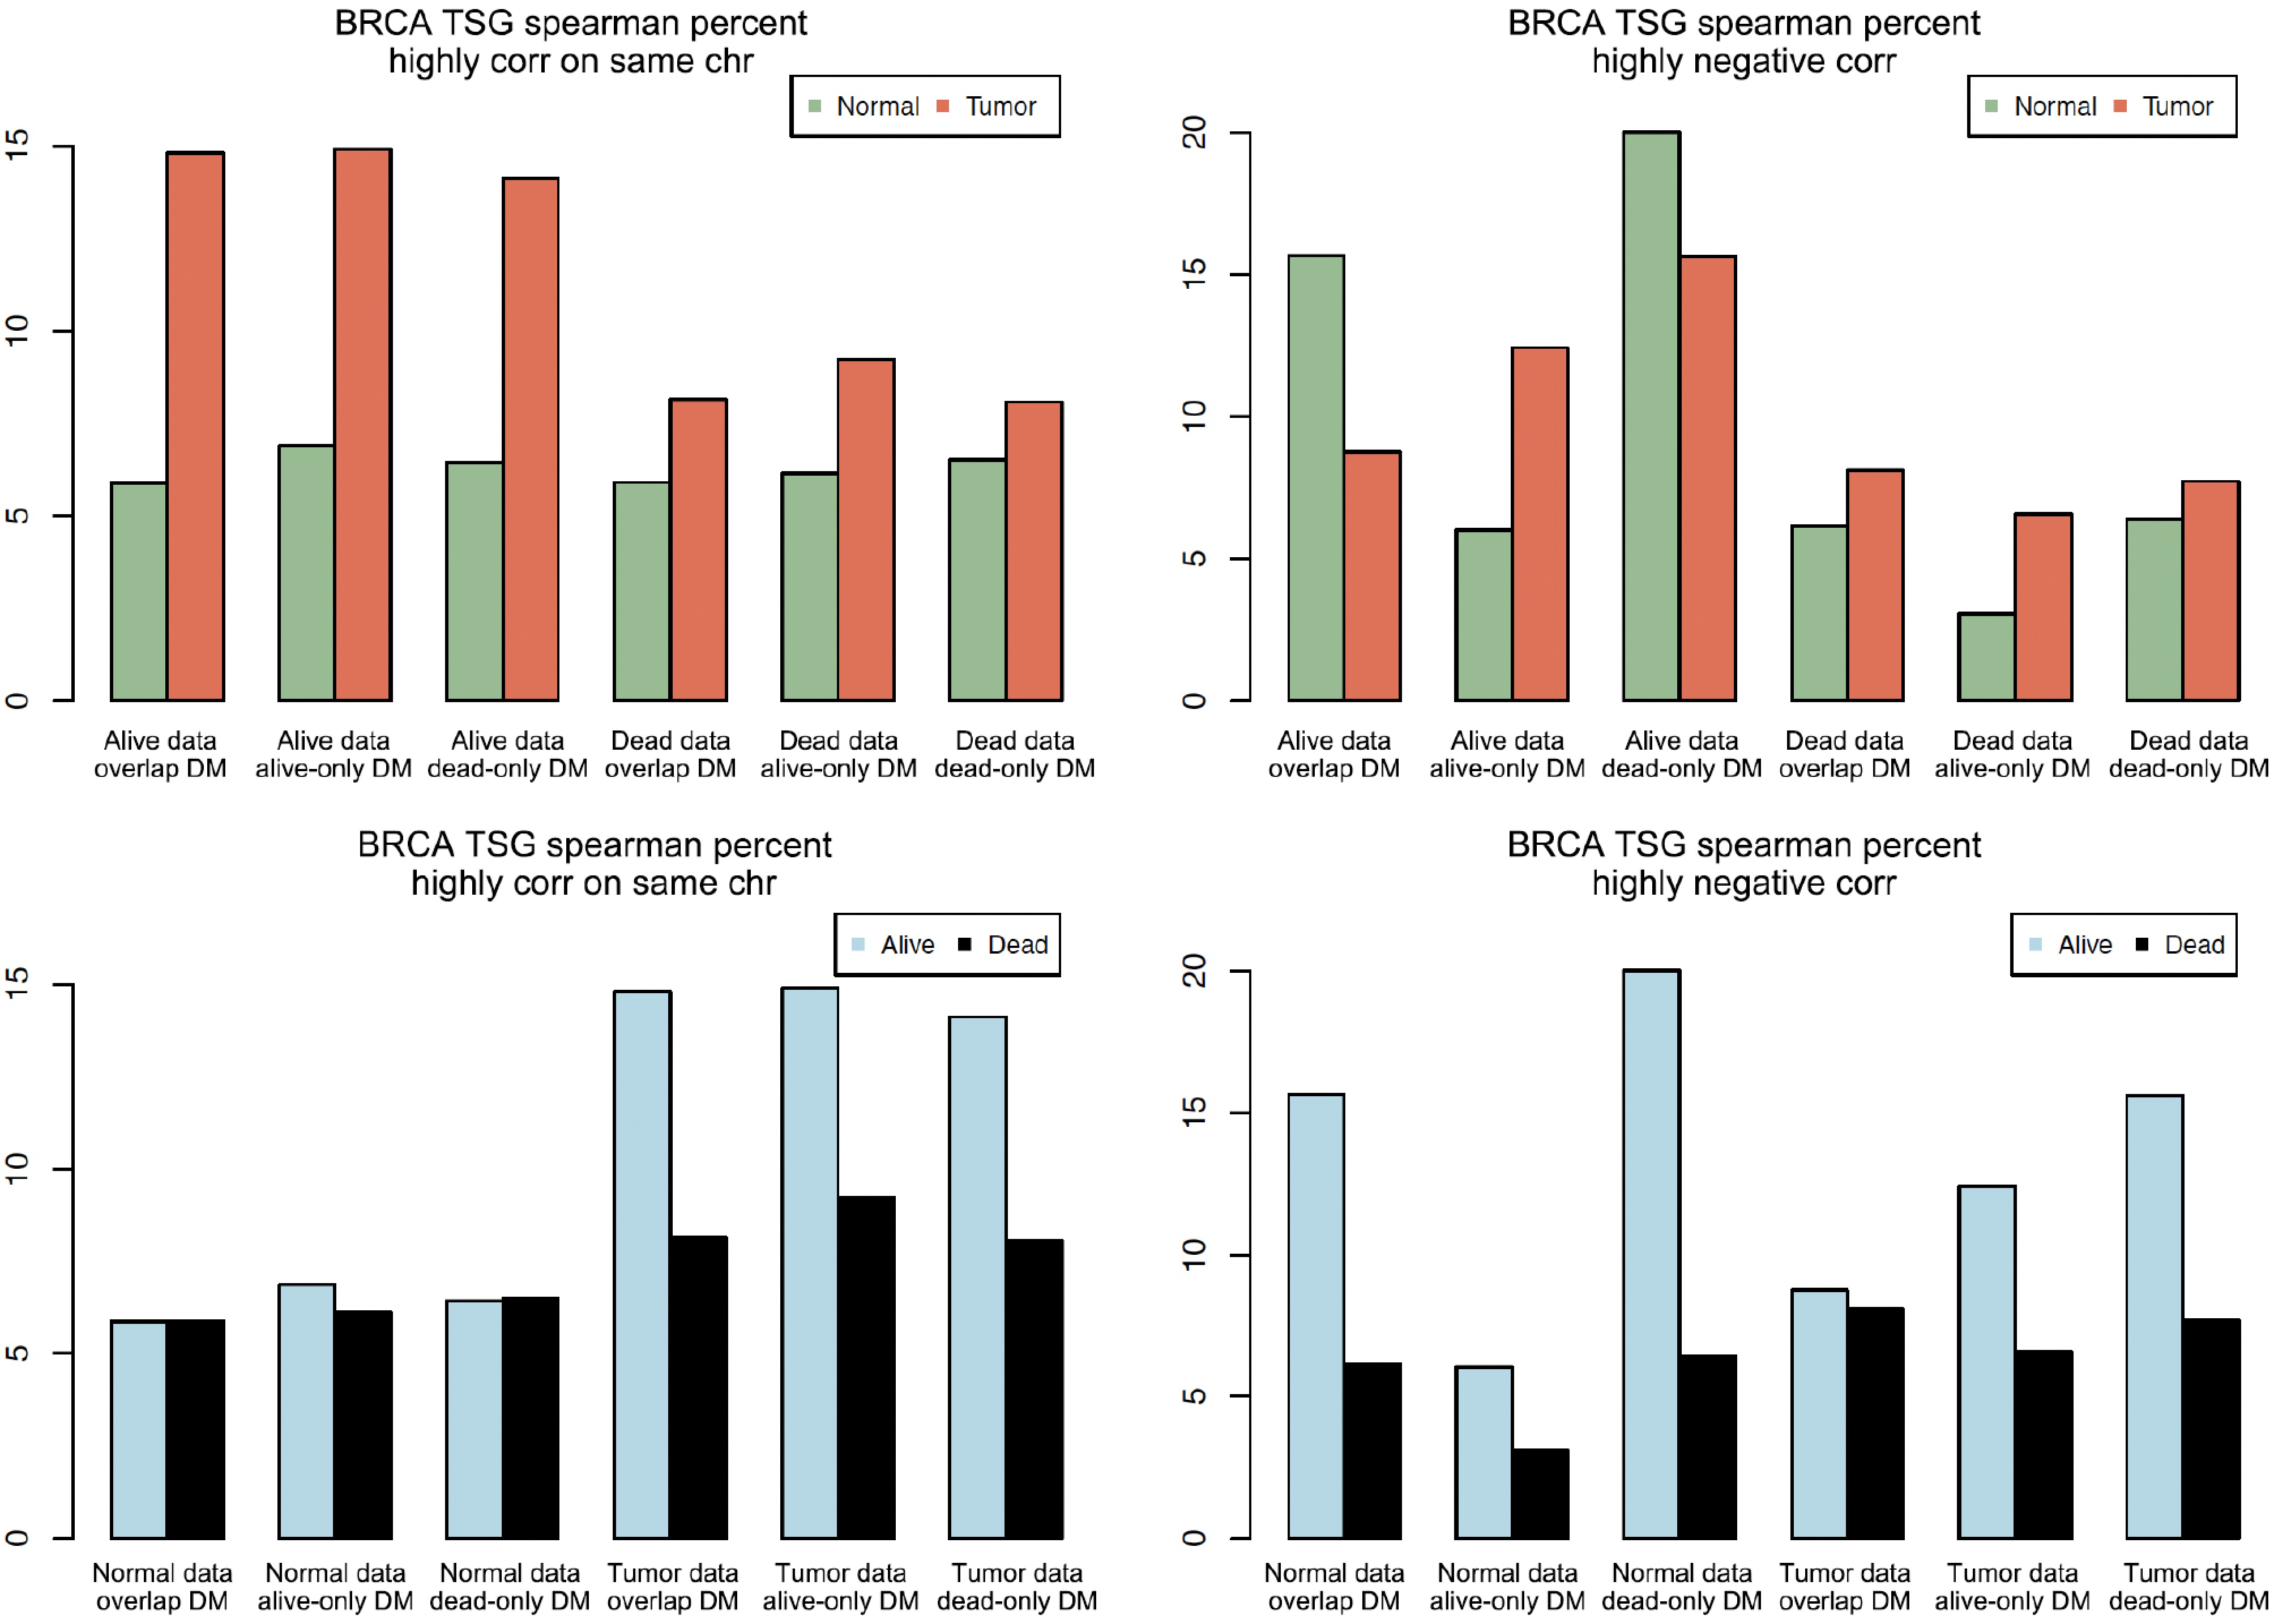
Figure 4.
Bar plots of highly correlated pairs on the same chromosome and with negative correlation. The vertical axis is the percentage (e.g., 15 means 15%).
-
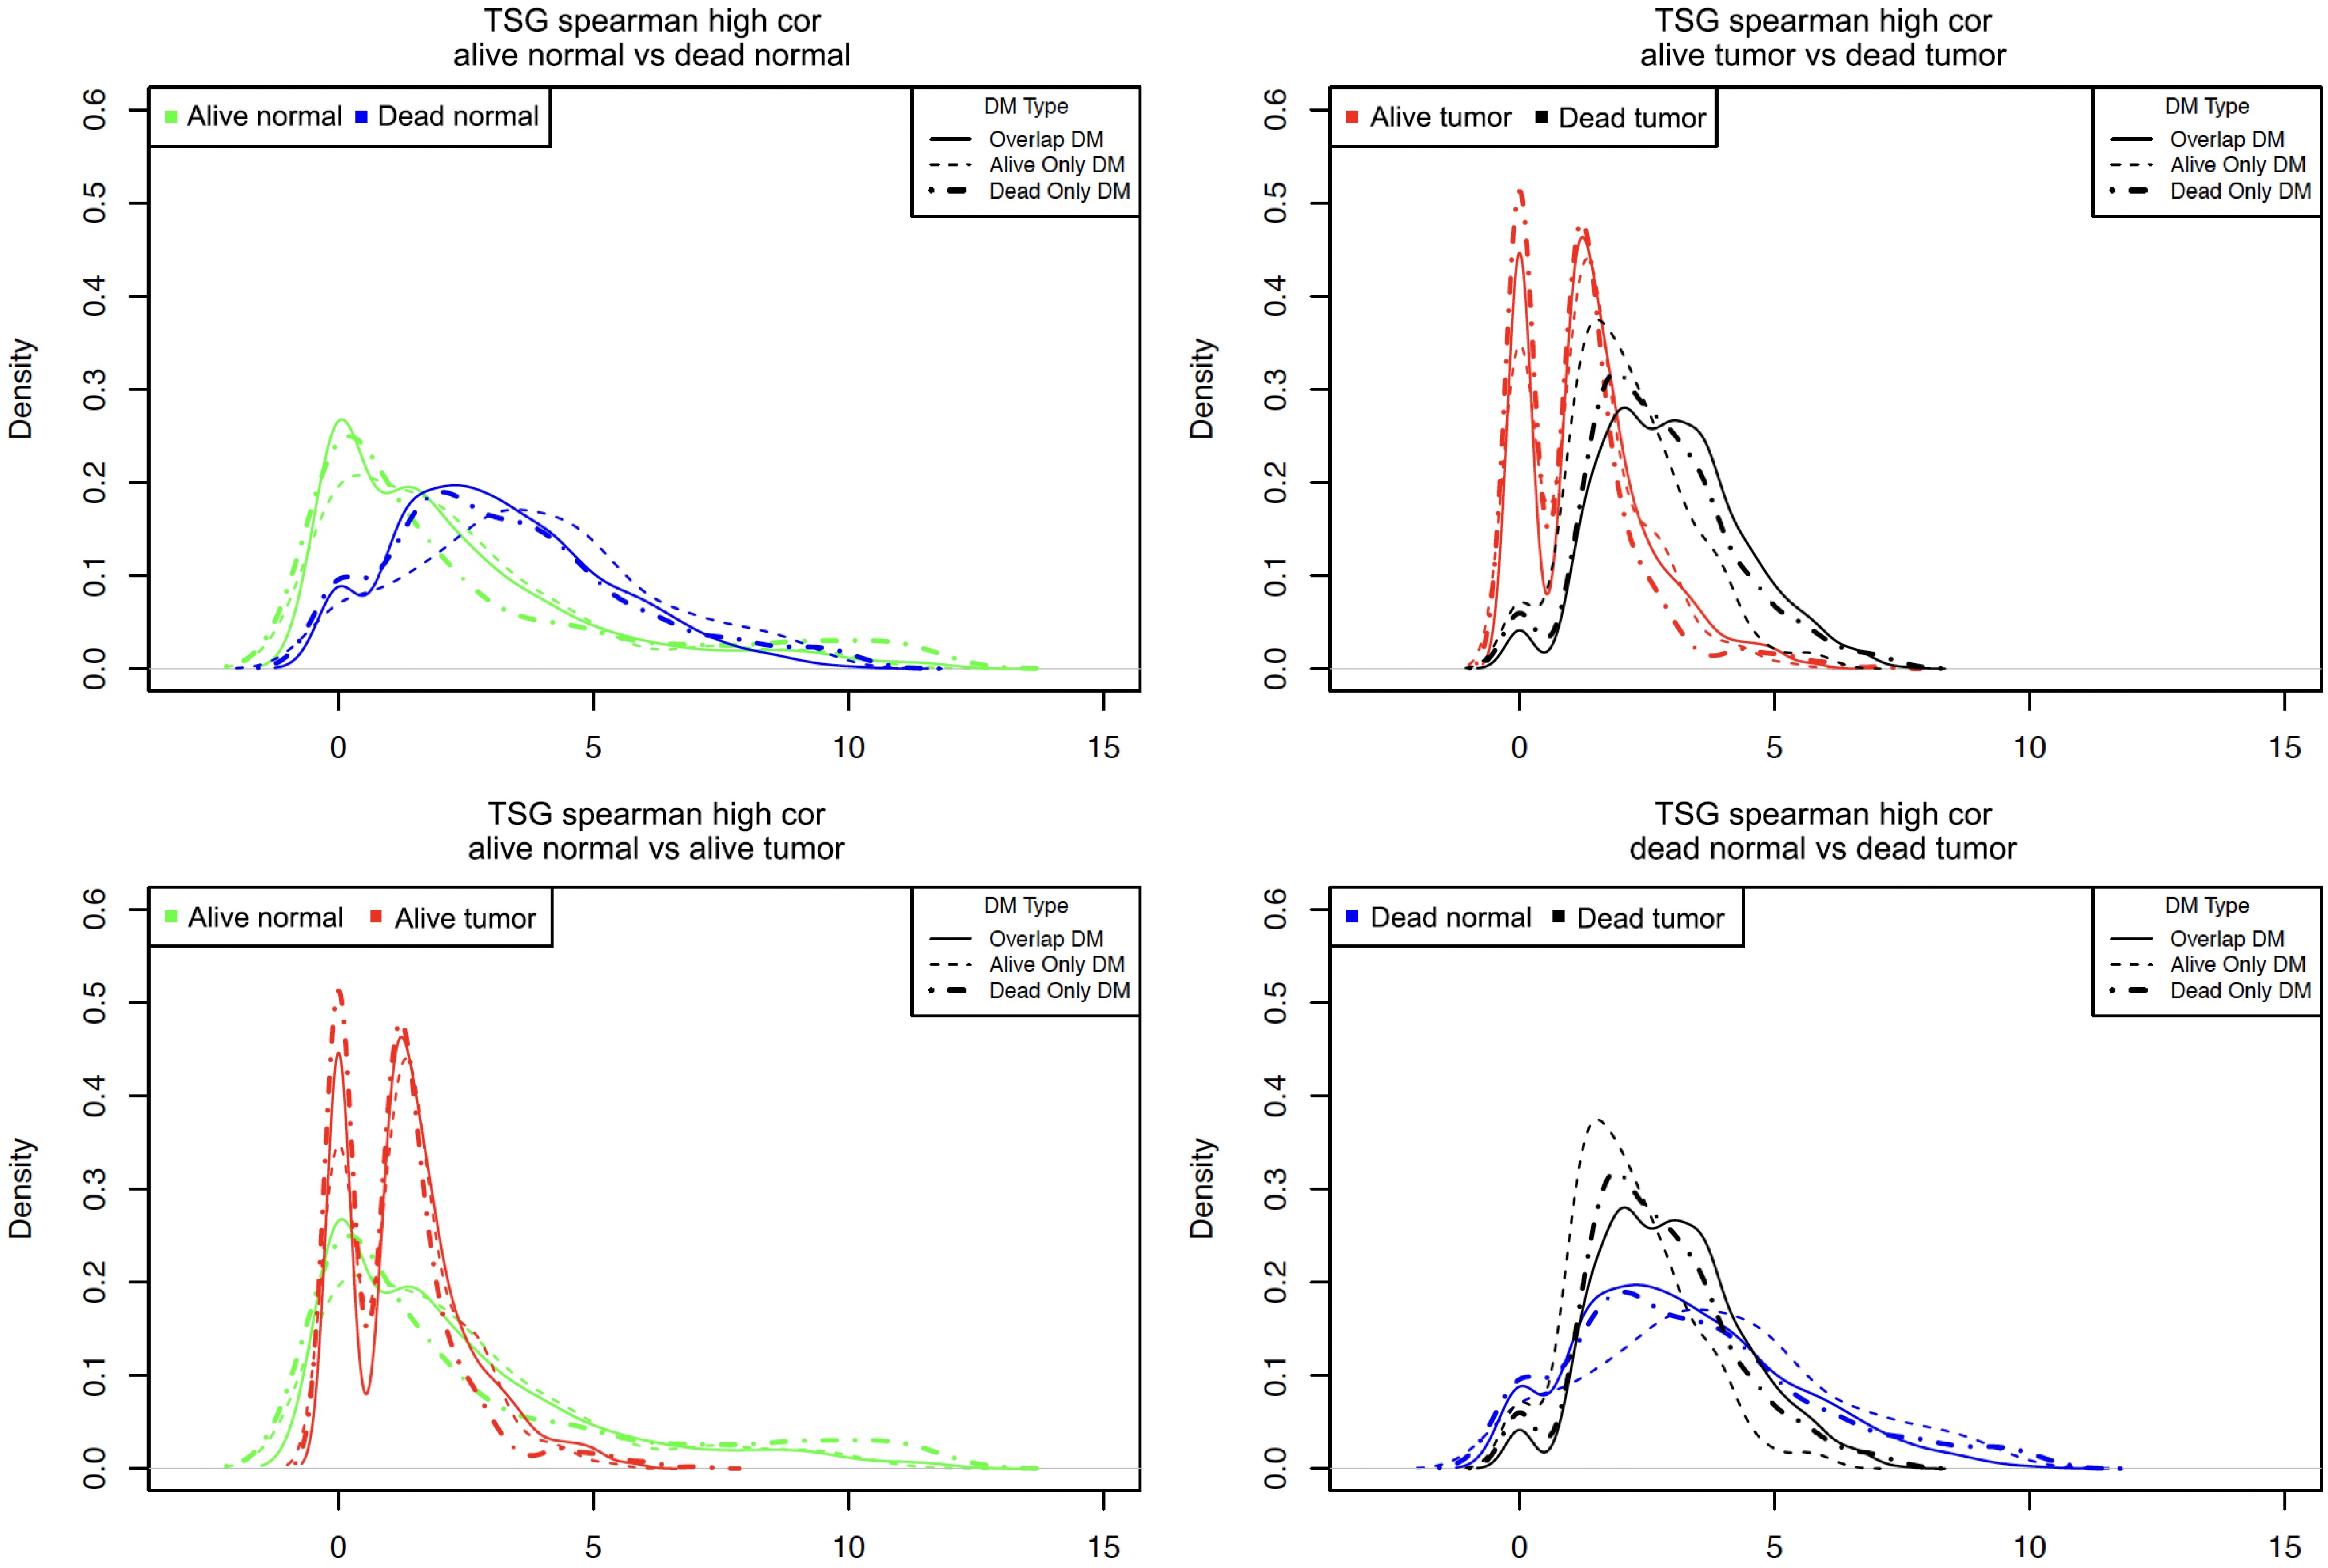
Figure 5.
Density plots for the number of highly correlated sites per DM site in different samples. Note, the count of the highly correlated partners that each DM site had was calculated and then the root 4 transformation of each count was used to generate the above density plots.
-
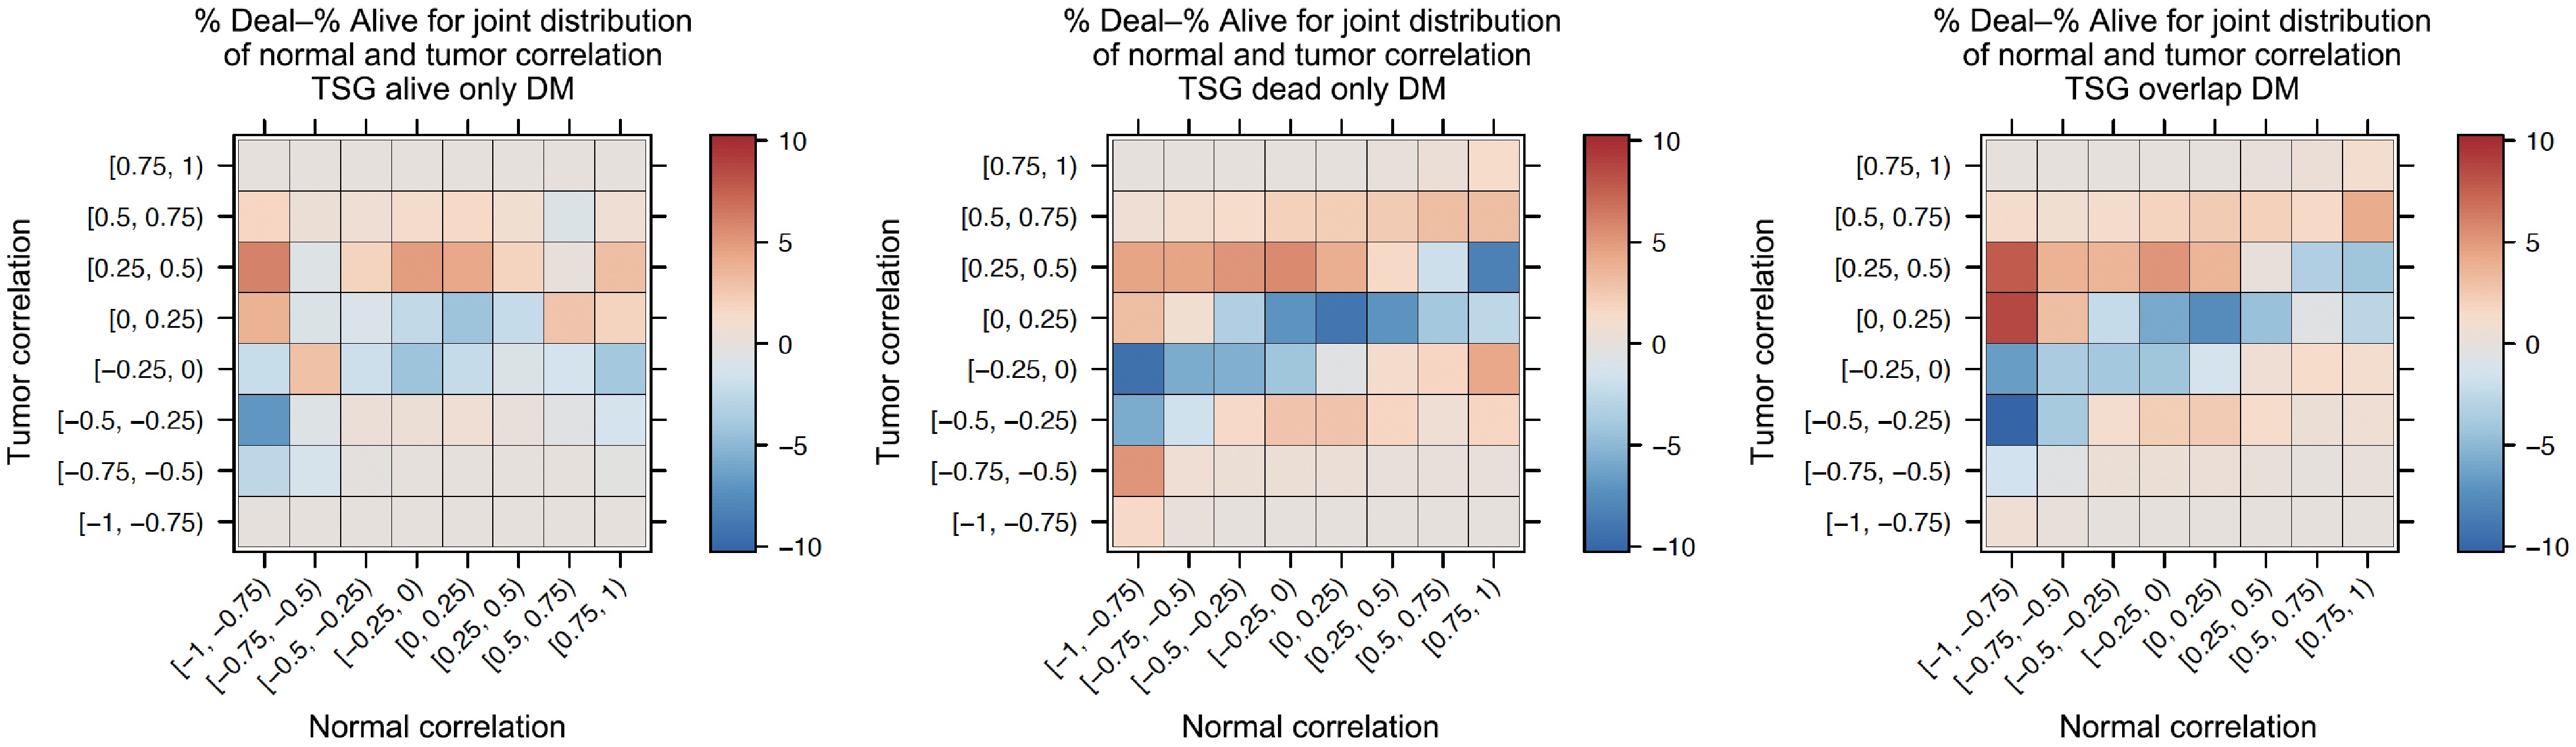
Figure 6.
Heatmaps of comparing co-methylation changes from normal to tumor.
-
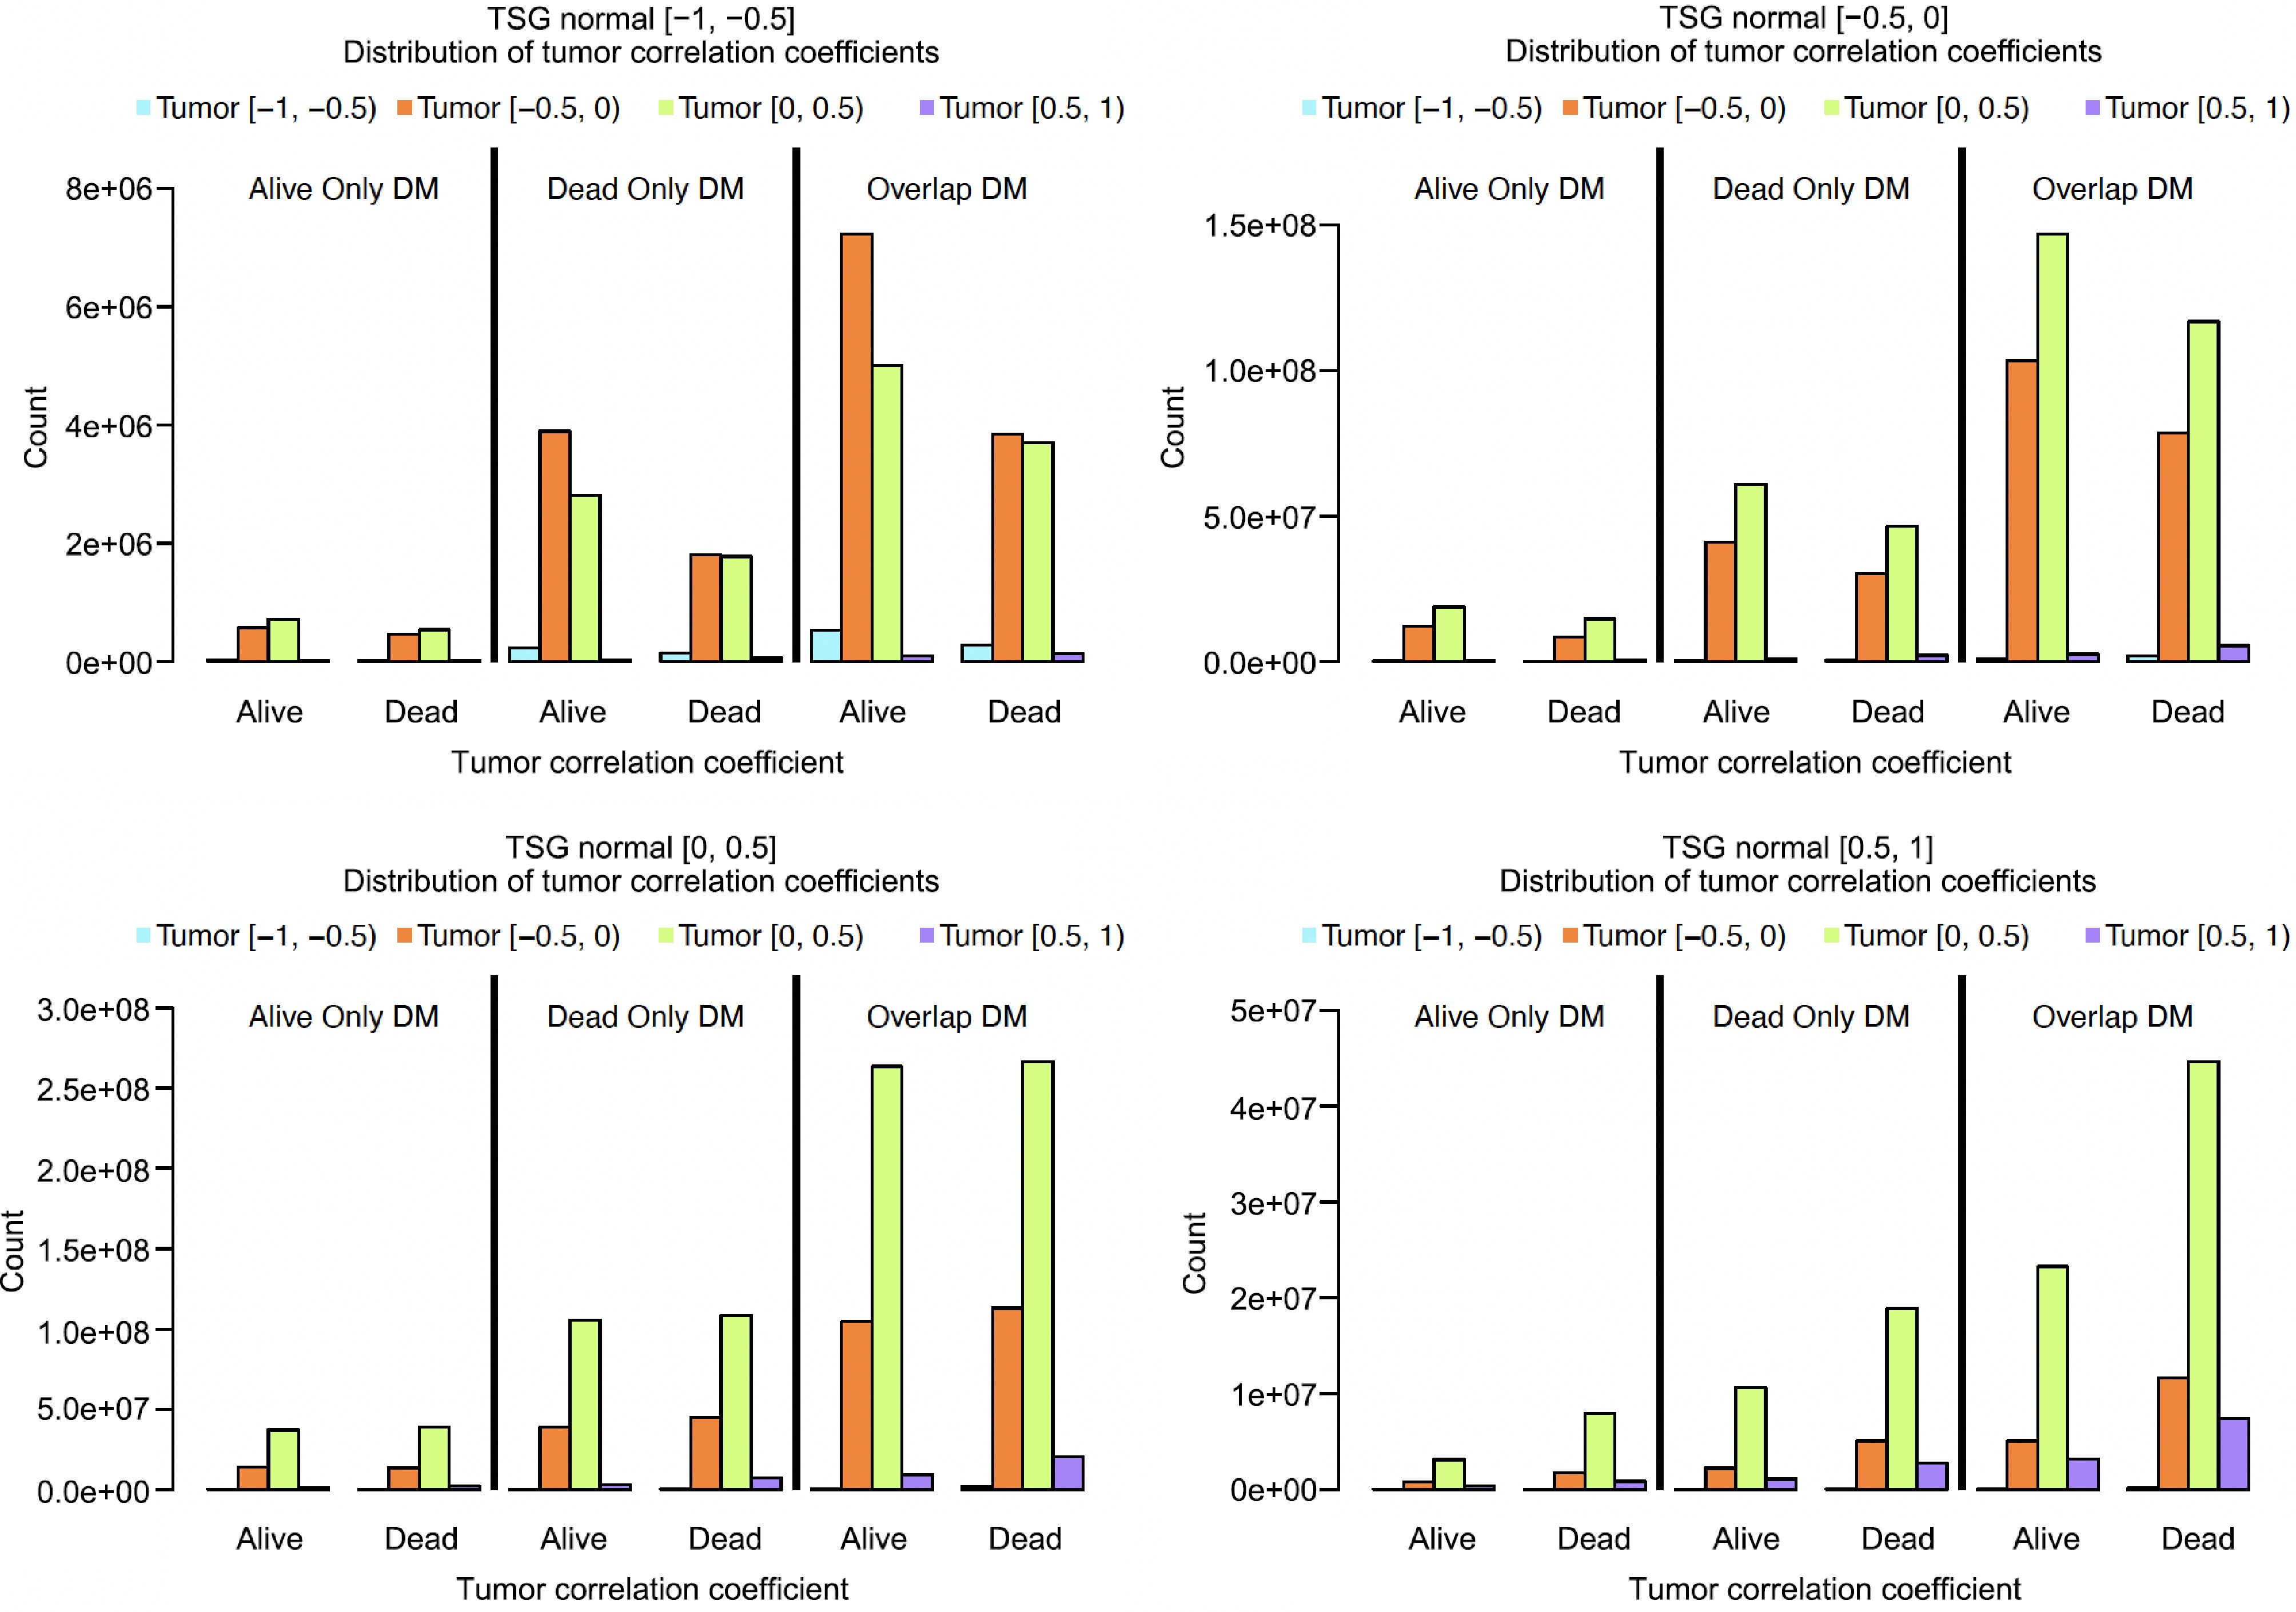
Figure 7.
Comparing the co-methylation changes in Alive and Dead samples based on 4 × 4 matrices.
-
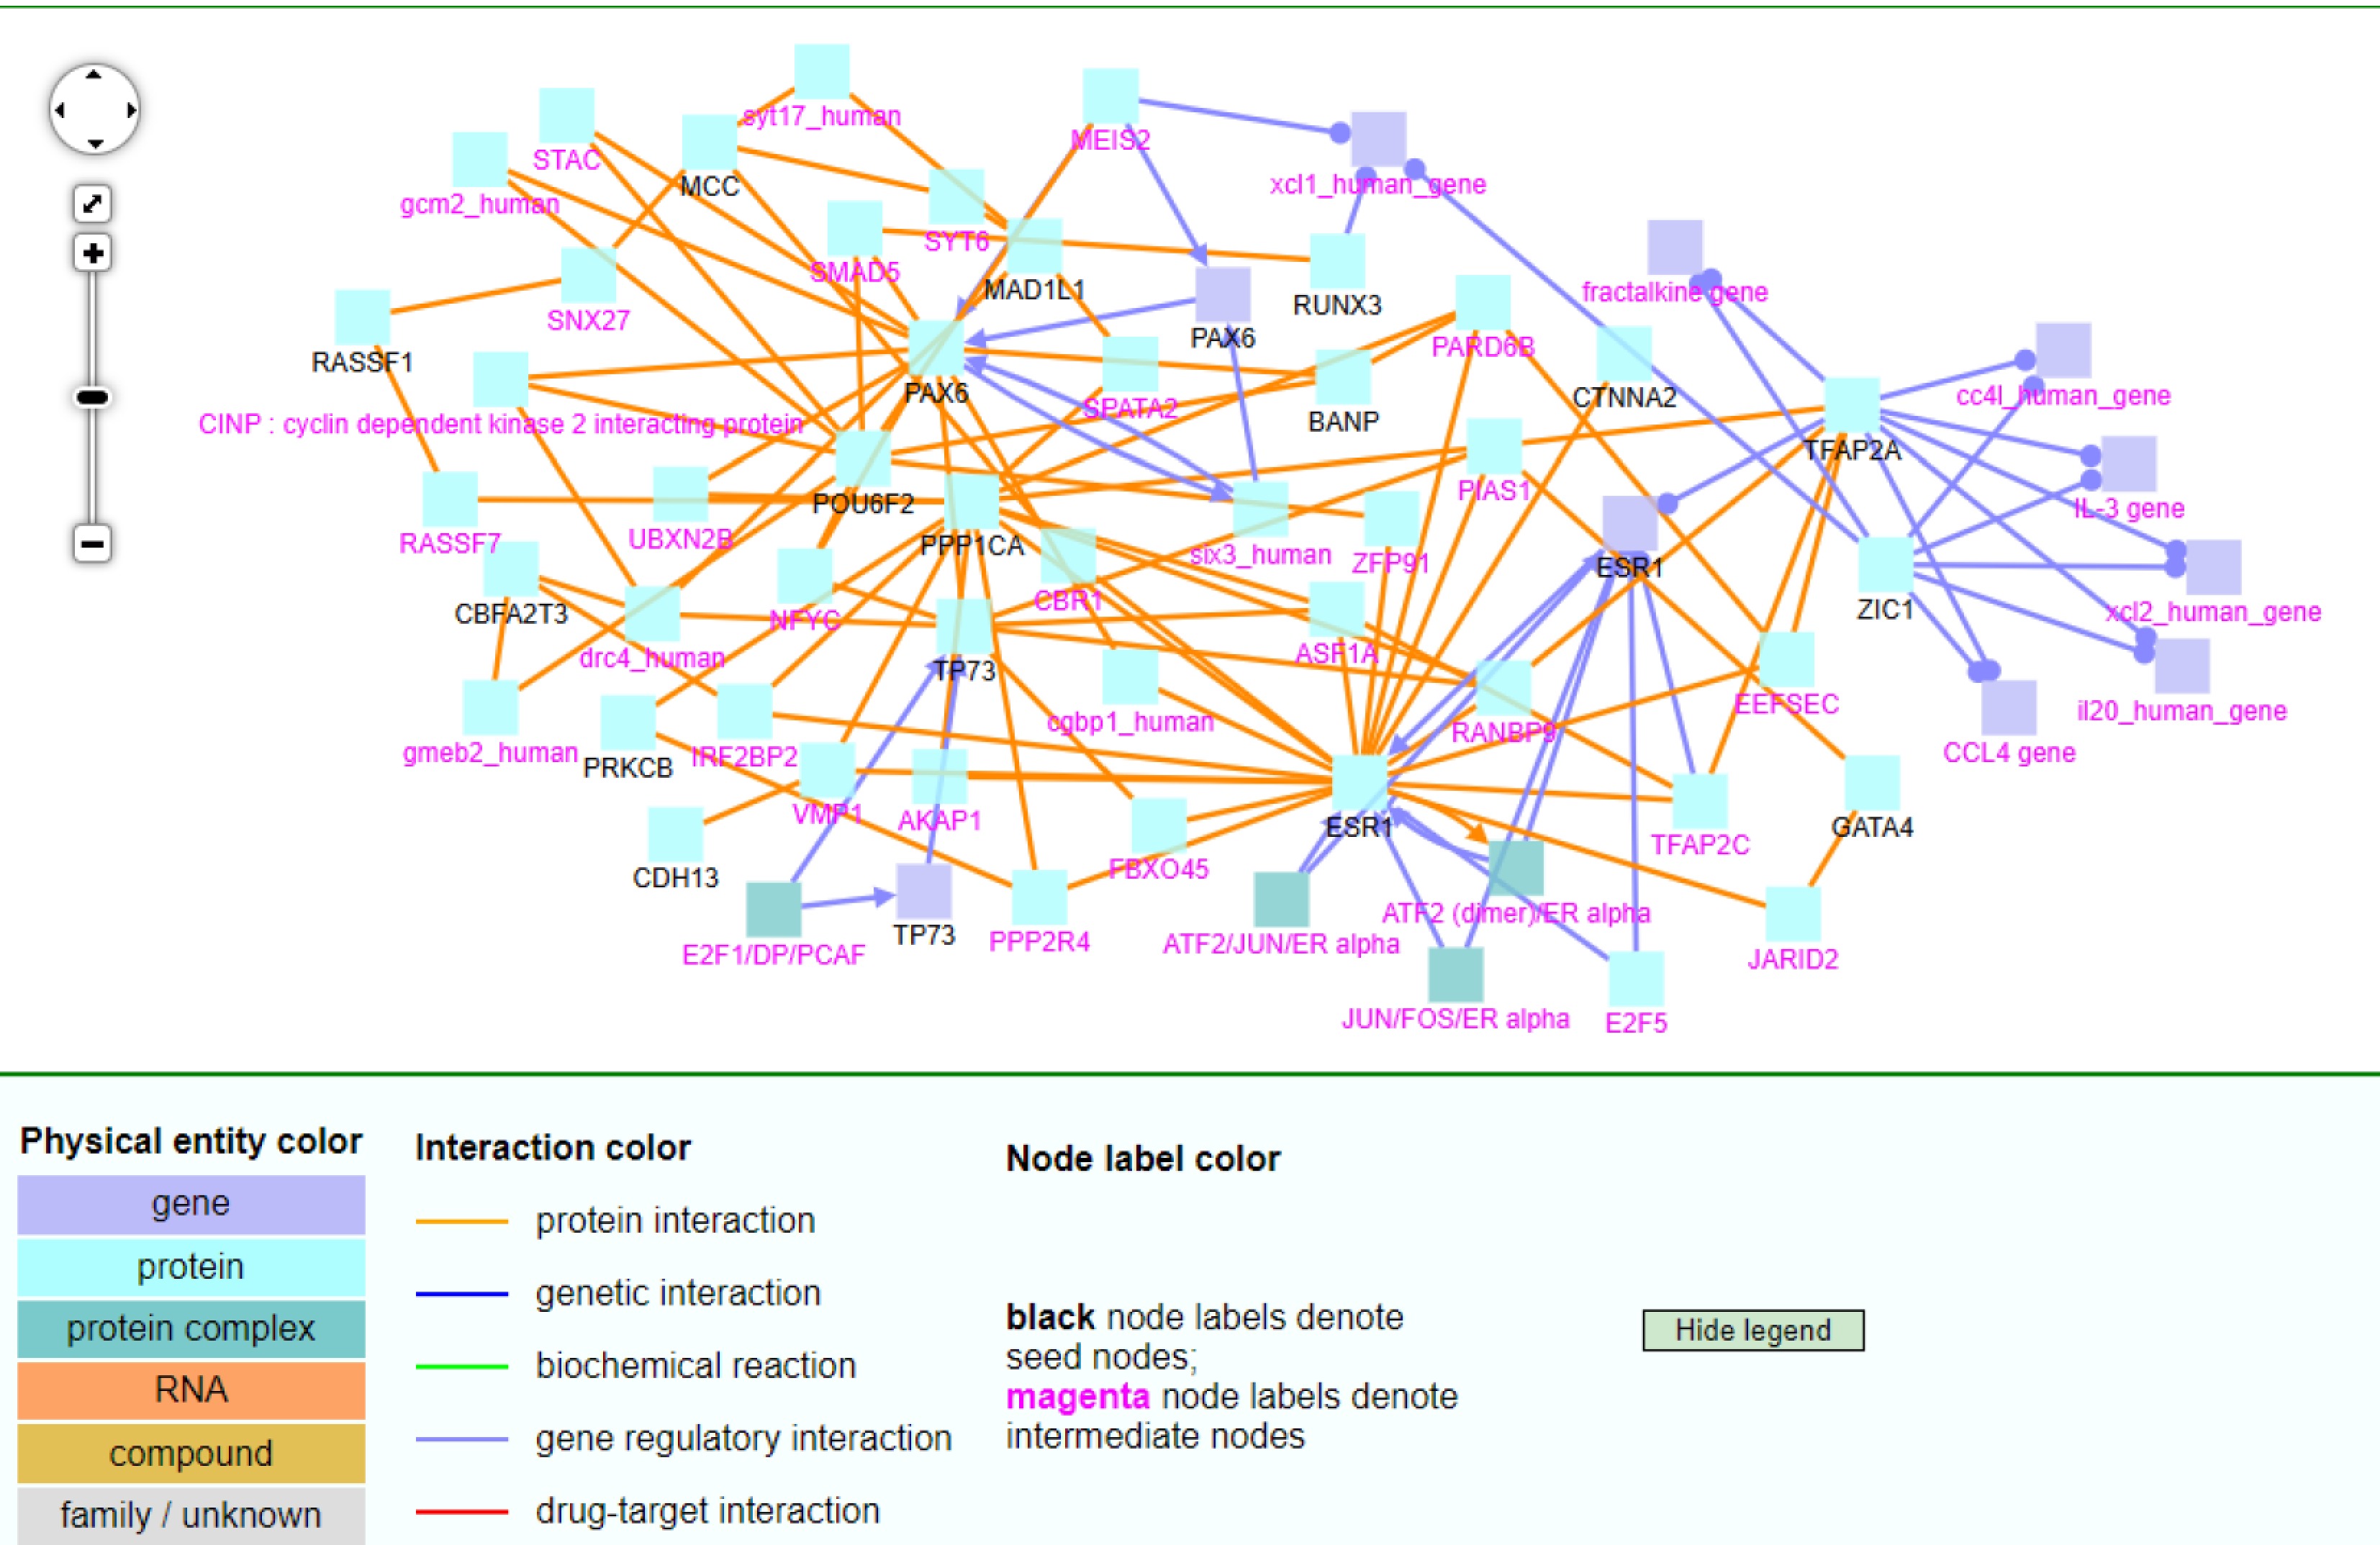
Figure 8.
The CPDB network analysis of 30 TSGs.
-
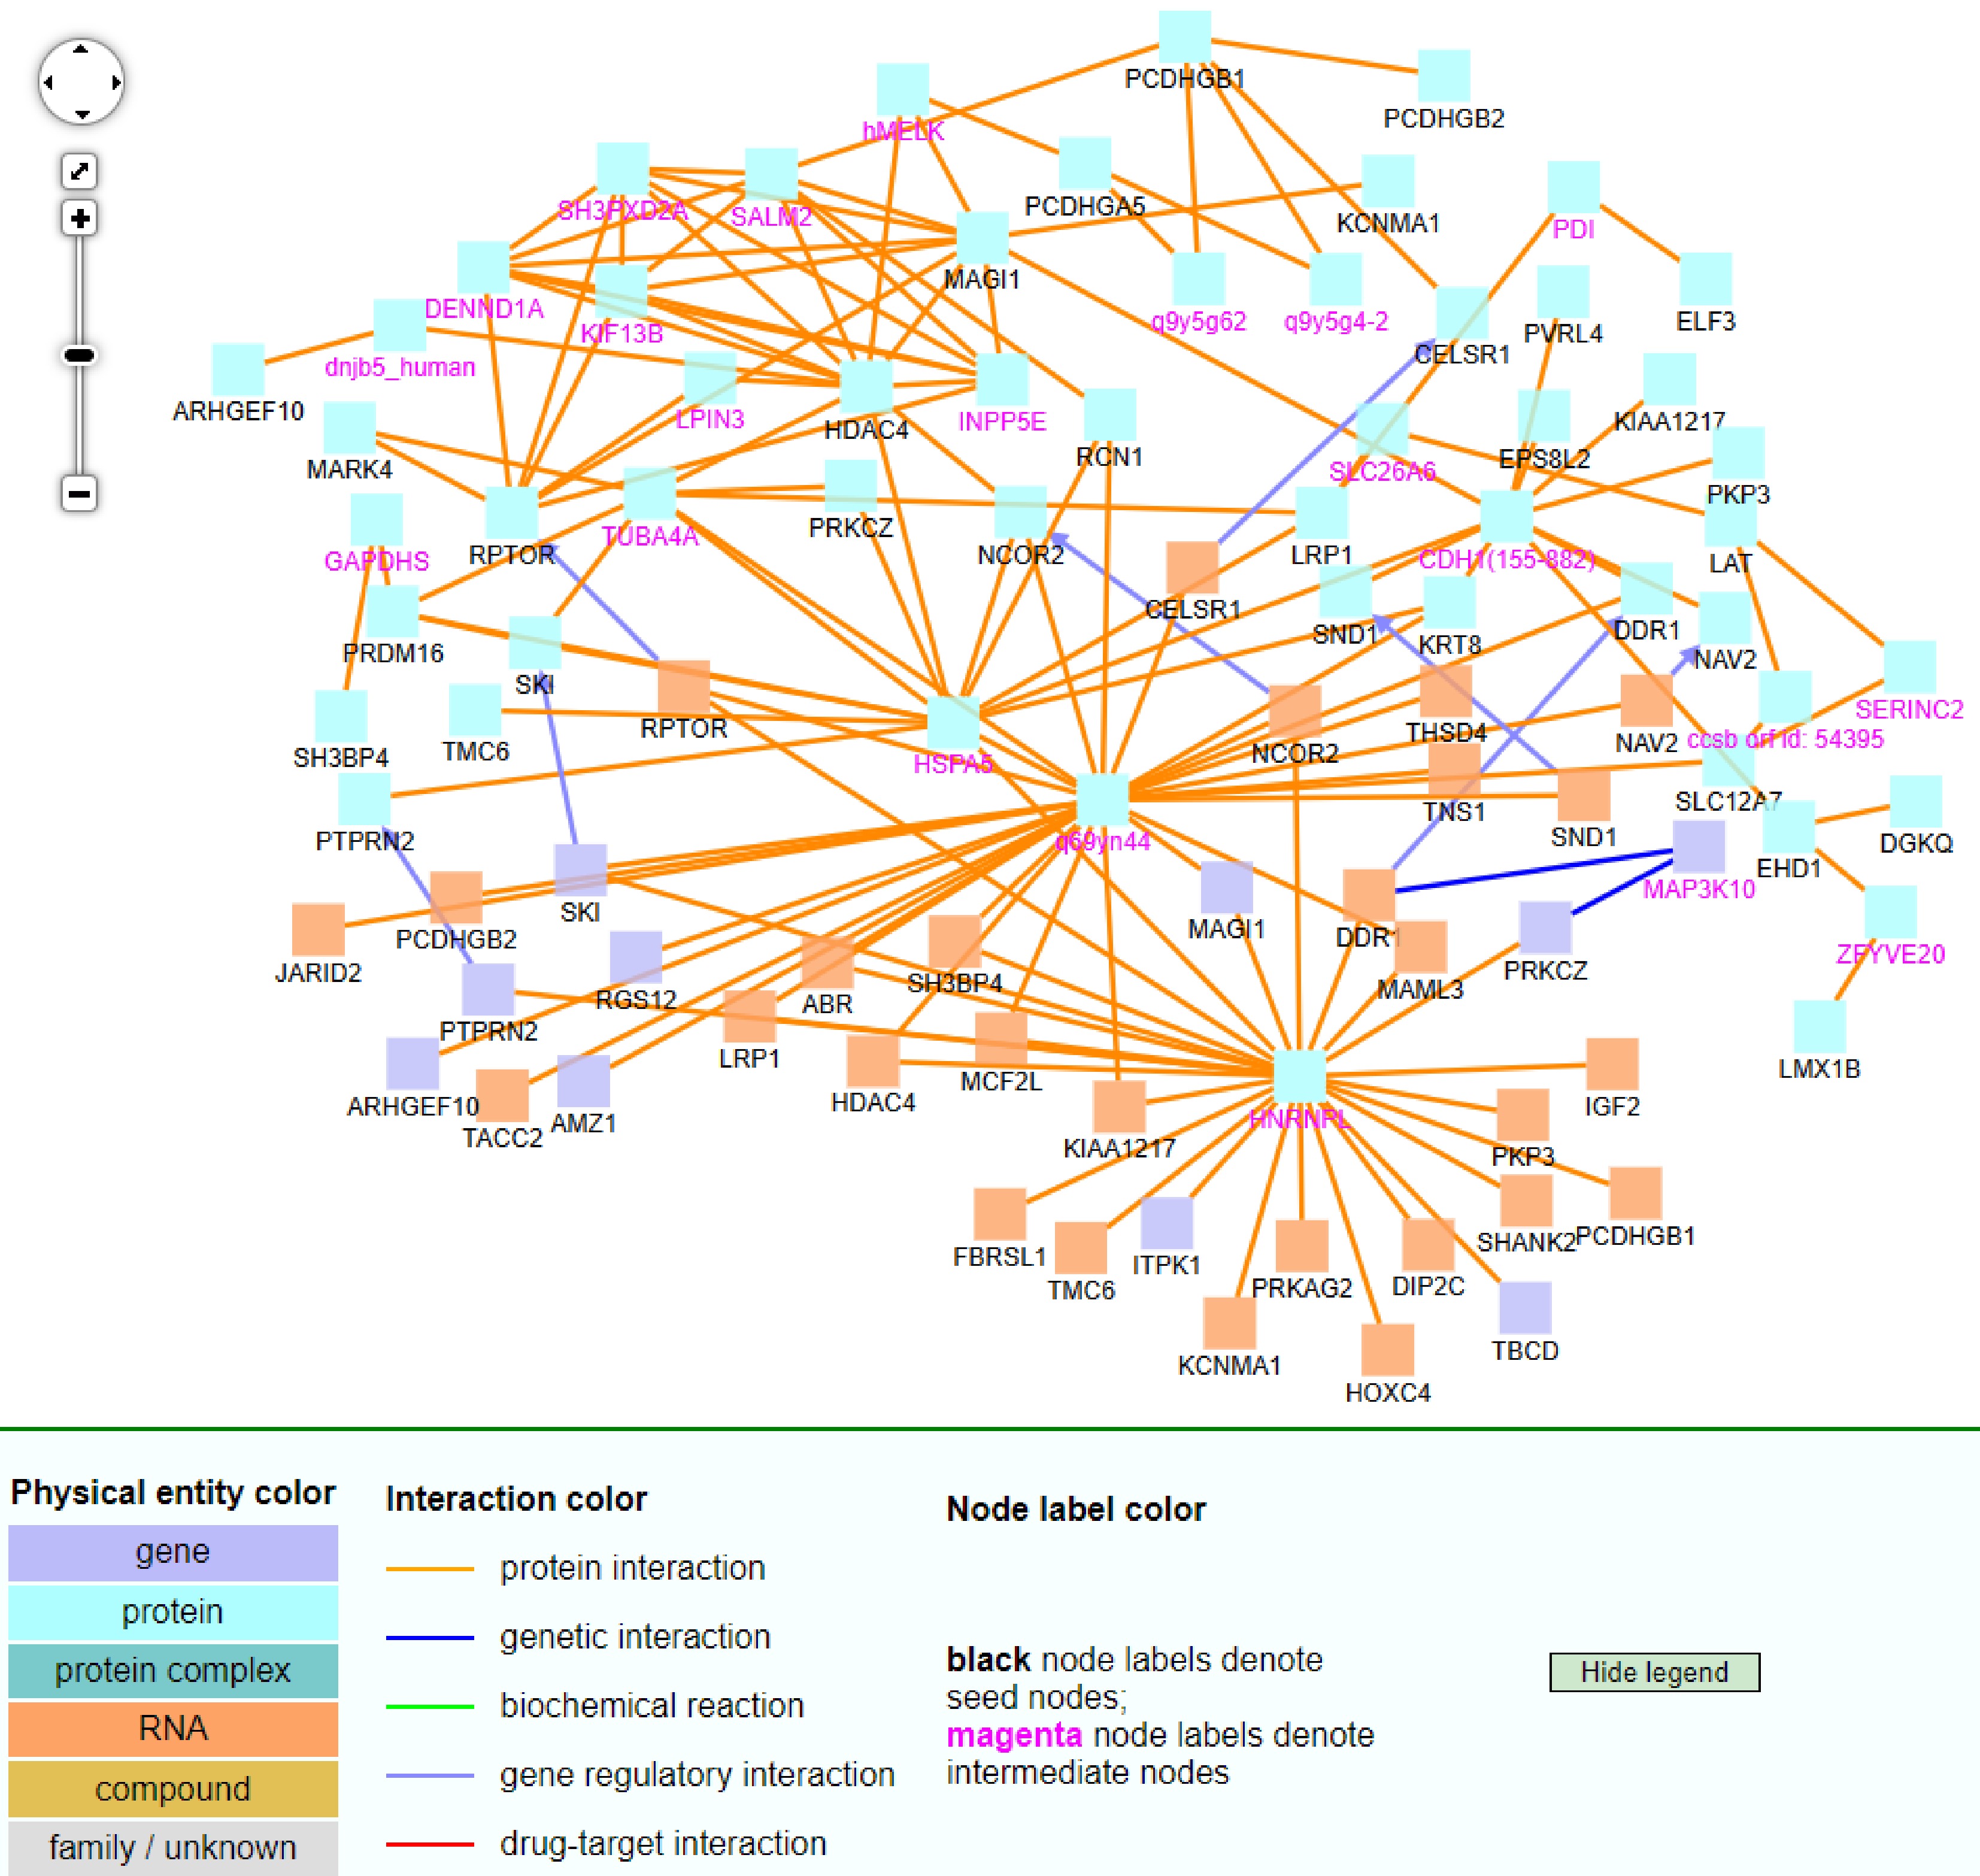
Figure 9.
The CPDB network analysis of 92 non-TSGs.
-
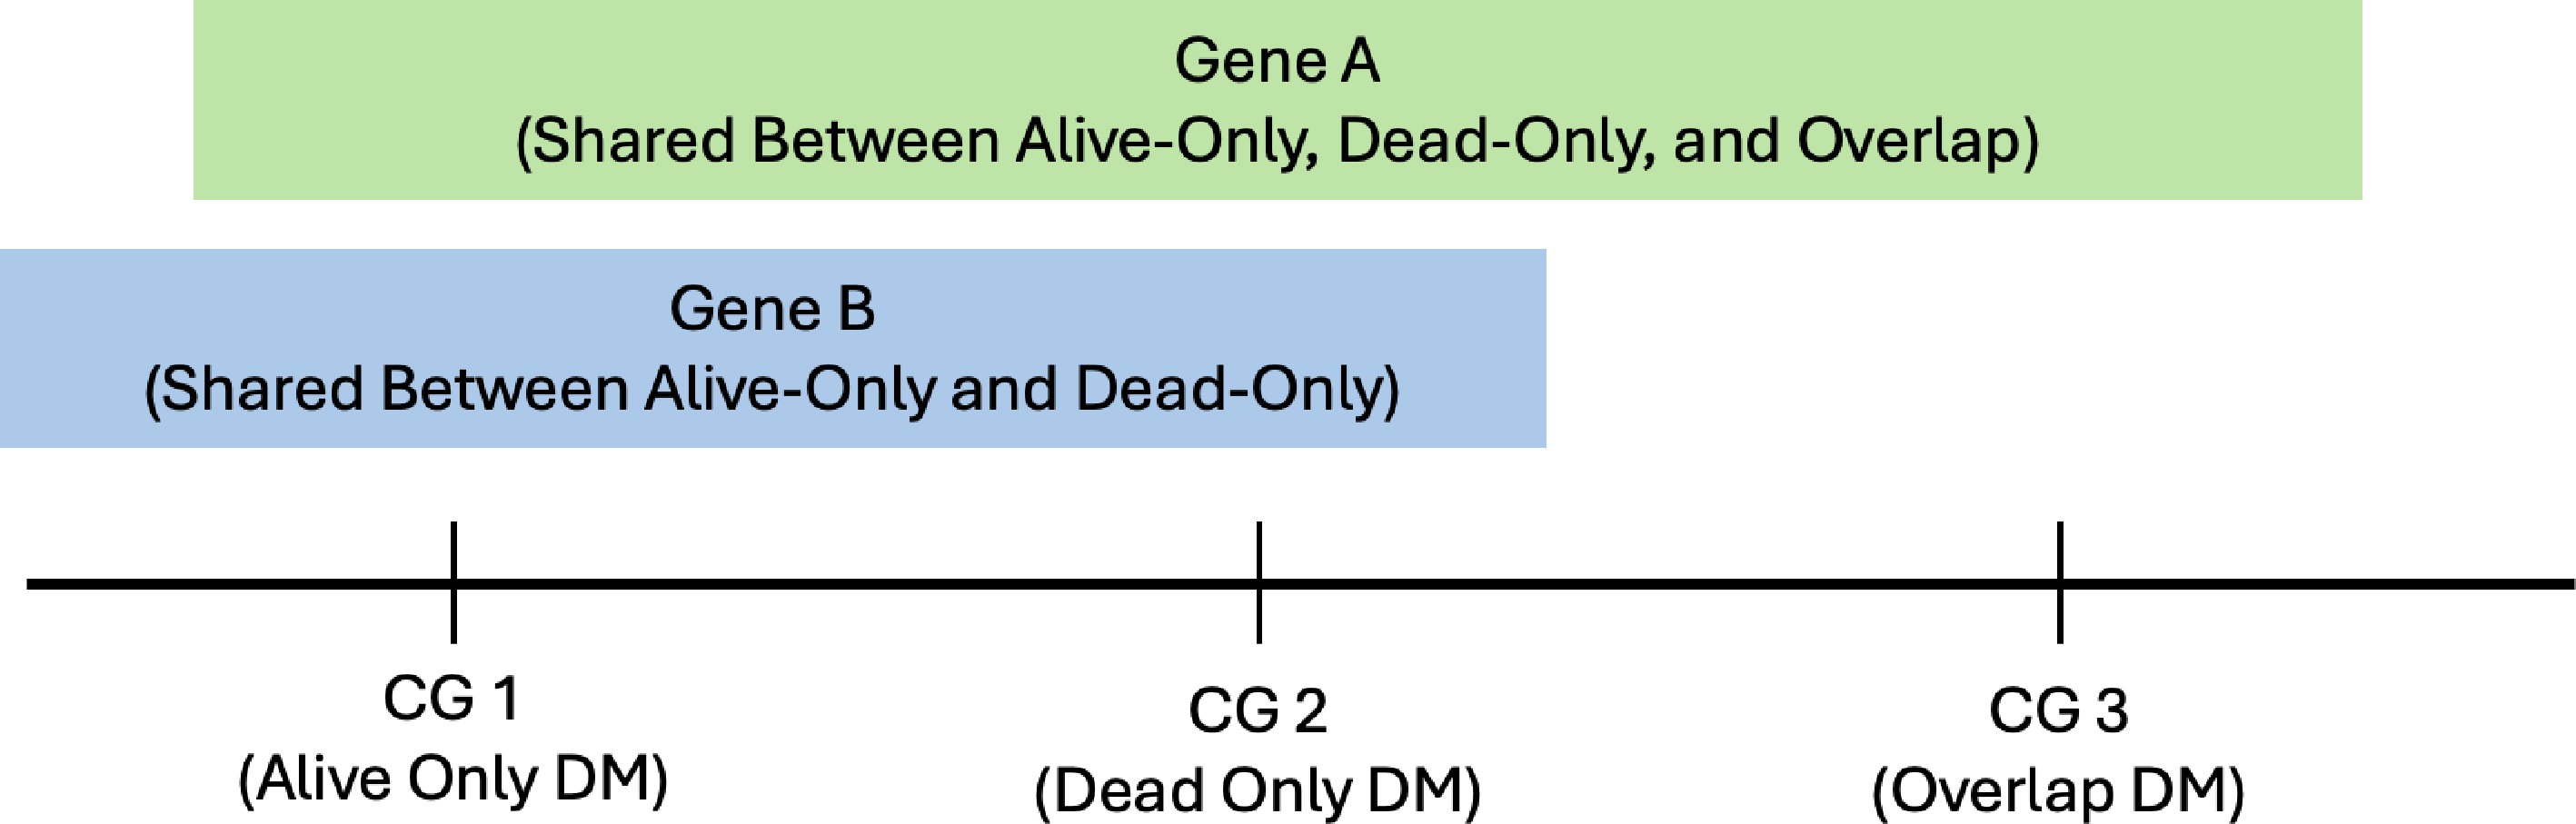
Figure 10.
Visualization or example of overlap DM sites and shared genes.
-
Samples DM sites
(count)DM rates p-value Alive (for all 391,459 CG sites) 27,160 6.94% 2.2e-16
(Compare:
6.94% vs 8.68%)Dead (for all 391,459 CG sites) 33,974 8.68% Alive (for all 25,977 TSG CG sites) 1,961 7.55% 2.746e-13
(Compare:
7.55% vs 9.34%)Dead (for all 25,977 TSG CG sites) 2,425 9.34% Table 1.
Summary of DM sites and percentages between normal and tumor tissues.
-
DM sites Samples Total pairs High.cor (%) Same.chr (%) Diff.chr (%) Neg.cor (%) Pos.cor (%) Overlap DM (1731) Alive.Normal 676116483 1108956 (0.164%) 65337 (5.89%) 1043619 (94.11%) 173580 (15.65%) 935376 (84.35%) Alive.Tumor 676116483 61217 (0.00905%) 9068 (14.81%) 52149 (85.19%) 5368 (8.77%) 55849 (91.23%) Dead.Normal 676116483 828833 (0.1226%) 48966 (5.91%) 779867 (94.09%) 50911 (6.14%) 777922 (93.86%) Dead.Tumor 676116483 343043 (0.0507%) 27970 (8.15%) 315073 (91.85%) 27812 (8.11%) 315231 (91.89%) Alive-only DM (230) Alive.Normal 90009005 126721 (0.1408%) 8728 (6.89%) 117993 (93.11%) 7618 (6.01%) 119103 (93.99%) Alive.Tumor 90009005 5760 (0.0064%) 859 (14.91%) 4901 (85.09%) 716 (12.43%) 5044 (87.57%) Dead.Normal 90009005 186396 (0.2071%) 11456 (6.15%) 174940 (93.85%) 5734 (3.08%) 180662 (96.92%) Dead.Tumor 90009005 16785 (0.0186%) 1552 (9.25%) 15233 (90.75%) 1102 (6.57%) 15683 (93.43%) Dead-only DM (694) Alive.Normal 271431381 973059 (0.3585%) 62739 (6.45%) 910320 (93.55%) 194705 (20.01%) 778354 (79.99%) Alive.Tumor 271431381 23288 (0.00858%) 3291 (14.13%) 19997 (85.87%) 3636 (15.61%) 19652 (84.39%) Dead.Normal 271431381 502902 (0.1853%) 32766 (6.52%) 470136 (93.48%) 32206 (6.40%) 470696 (93.60%) Dead.Tumor 271431381 124846 (0.046%) 10087 (8.08%) 114759 (91.92%) 9638 (7.72%) 115208 (92.28%) Table 2.
Highly co-methylated pairs on the same and different chromosomes and with positive and negative correlations.
-
Alive vs Dead Same.Chr p-value Same.Chr (%) Neg.Cor p-value Neg.Cor (%) Alive Normal vs Dead Normal – Overlap DM 0.64079 5.89% vs 5.91% 0.00 15.65% vs 6.14% Alive Tumor vs Dead Tumor – Overlap DM 0.00 14.81% vs 8.15% 4.16E-08 8.77% vs 8.11% Alive Normal vs Dead Normal – Alive-only DM 1.17E-16 6.89% vs 6.15% 0 6.01% vs 3.08% Alive Tumor vs Dead Tumor – Alive-only DM 4.34E-33 14.91% vs 9.25% 5.17E-45 12.43% vs 6.57% Alive Normal vs Dead Normal – Dead-only DM 0.11344 6.45% vs 6.52% 0.00 20.01% vs 6.4% Alive Tumor vs Dead Tumor – Dead-only DM 3.71E-192 14.13% vs 8.08% 0.00 15.61% vs 7.72% Normal vs Tumor Same.Chr p-value Same.Chr (%) Neg.Cor p-value Neg.Cor (%) Alive Normal vs Alive Tumor – Overlap DM 0.00 5.89% vs 14.81% 0.00 15.65% vs 8.77% Dead Normal vs Dead Tumor – Overlap DM 0.00 5.91% vs 8.15% 0.00 6.14% vs 8.11% Alive Normal vs Alive Tumor – Alive-only DM 0.00 6.89% vs 14.91% 0.00 6.01% vs 12.43% Dead Normal vs Dead Tumor – Alive-only DM 1.52E-55 6.15% vs 9.25% 3.57E-127 3.08% vs 6.57% Alive Normal vs Alive Tumor -- Dead-only DM 0.00 6.45% vs 14.13% 7.42E-62 20.01% vs 15.61% Dead Normal vs Dead Tumor -- Dead-only DM 1.32E-85 6.52% vs 8.08% 1.90E-62 6.4% vs 7.72% Table 3.
Proportion tests for highly co-methylated pairs of different groups.
-
Normal Eight correlation intervals for tumor tissues (Overlap DM sites) Alive T[−1, −0.75) T[−0.75, −0.5) T[−0.5, −0.25) T[−0.25, 0) T[0, 0.25) T[0.25, 0.5) T[0.5, 0.75) T[0.75, 1) N[−1, −0.75) 4297 73818 182298 201921 88579 16019 785 4 0.7569% 13.0025% 32.1105% 35.5669% 15.6026% 2.8216% 0.1383% 0.0007% N[−0.75, −0.5) 9387 446831 2224635 4629139 3733207 1167473 96376 496 0.0763% 3.6305% 18.0754% 37.6122% 30.3327% 9.4858% 0.7831% 0.0040% N[−0.5, −0.25) 6650 564390 6011579 24309202 26269230 7781659 605428 4656 0.0101% 0.8610% 9.1706% 37.0834% 40.0734% 11.8708% 0.9236% 0.0071% N[−0.25, 0) 3867 526811 10131385 62857780 86421033 26476788 1905978 15584 0.0021% 0.2797% 5.3793% 33.3748% 45.8858% 14.0580% 1.0120% 0.0083% N[0, 0.25) 2414 350385 8278526 66488860 1.20E+08 47972035 4210138 39078 0.0010% 0.1415% 3.3427% 26.8471% 48.5817% 19.3703% 1.7000% 0.0158% N[0.25, 0.5) 897 152662 3177399 26650227 59823925 35385440 4881785 61851 0.0007% 0.1173% 2.4416% 20.4790% 45.9710% 27.1915% 3.7513% 0.0475% N[0.5, 0.75) 255 38374 627733 4235769 11121962 10632349 2638530 65056 0.0009% 0.1307% 2.1381% 14.4270% 37.8813% 36.2137% 8.9868% 0.2216% N[0.75, 1) 4 905 30043 196838 611727 895235 432303 30042 0.0002% 0.0412% 1.3674% 8.9590% 27.8425% 40.7463% 19.6761% 1.3673% Dead T[−1, −0.75) T[−0.75, −0.5) T[−0.5, −0.25) T[−0.25, 0) T[0, 0.25) T[0.25, 0.5) T[0.5, 0.75) T[0.75, 1) N[−1, −0.75) 2157 17975 34195 45471 38048 16498 2191 25 1.3777% 11.4812% 21.8415% 29.0438% 24.3025% 10.5378% 1.3995% 0.0160% N[−0.75, −0.5) 13472 244397 1112990 2657168 2616850 1030260 129771 1918 0.1726% 3.1306% 14.2566% 34.0365% 33.5200% 13.1969% 1.6623% 0.0246% N[−0.5, −0.25) 27130 795739 6105060 19946327 22732054 9355171 1238490 19905 0.0451% 1.3214% 10.1379% 33.1225% 37.7484% 15.5350% 2.0566% 0.0331% N[−0.25, 0) 26559 1184801 10812917 41537423 57090359 27525978 4224644 81291 0.0186% 0.8315% 7.5889% 29.1523% 40.0679% 19.3186% 2.9650% 0.0571% N[0, 0.25) 17384 1084594 11855469 52334484 8.43E+07 47341213 8402419 196268 0.0085% 0.5276% 5.7668% 25.4570% 41.0294% 23.0281% 4.0872% 0.0955% N[0.25, 0.5) 7709 586844 7584976 41334942 81234297 53617788 11292281 347076 0.0039% 0.2994% 3.8698% 21.0886% 41.4448% 27.3552% 5.7612% 0.1771% N[0.5, 0.75) 1510 126824 1643208 9757545 22967367 20208793 6471237 327785 0.0025% 0.2062% 2.6717% 15.8648% 37.3427% 32.8575% 10.5216% 0.5329% N[0.75, 1) 21 3841 48287 234001 590675 863640 561199 57167 0.0009% 0.1628% 2.0471% 9.9202% 25.0410% 36.6131% 23.7914% 2.4235% Table 4's top panel is for Alive samples and the bottom panel is for Dead samples of the overlap DM sites' correlation or co-methylation with all 391,459 CG sites. For each correlation level or interval, there are two rows. One row is the count, and the next row is the corresponding percentage. The first column is for normal tissues' correlation intervals (i.e., 'N' means normal). The other eight columns are tumor tissues' correlation intervals (i.e., 'T' means tumor). Table 4.
Two 8 × 8 matrices showing co-methylation changes between normal and tumor tissues.
-
Panel Panel shorthand Normal interval Tumor interval Normal negative to tumor positive neg2pos [−1, −0.75) [0.5, 1) Normal positive to tumor negative pos2neg [0.75, 1) [−1, −0.5) Normal sleeping to tumor negative sleeping.neg [−0.25, 0.25] [−1, −0.75) Normal sleeping to tumor positive sleeping.pos [−0.25, 0.25] [0.75, 1) Normal negative to tumor shutting neg.shutting [−1, −0.75) [−0.1, 0.1] Normal positive to tumor sleeping pos.shutting [0.75, 1) [−0.1, 0.1] Table 5.
Definition of co-methylation pattern changes from normal to tumor tissues.
-
Category neg2pos pos2neg sleeping.neg sleeping.pos neg.shutting pos.shutting Total TSG identified by Method A:
only Alive for each change or panel, Ng.Alive ≥ 3 and Ng.Dead = 01 0 2 0 20 1 24 TSG identified by Method B:
only Dead for each change or panel, Ng.Alive = 0 and Ng.Dead ≥311 17 49 81 23 61 242 Non-TSG identified by Method A:
only Alive for each change or panel, Ng.Alive ≥ 3 and Ng.Dead = 04 5 5 20 605 67 706 Non-TSG identified by Method B:
only Dead for each change or panel, Ng.Alive = 0 and Ng.Dead ≥ 338 123 601 2,288 100 2,193 5,343 Table 6.
Summary of number of genes with different co-methylation changes.
-
Category Gene Samples (Alive/Dead), co-methylation change/panel TSG PROX1 Alive and Dead, shared in ≥ 4 same panels TSG CAV1 Alive, neg.shutting TSG STAT5A Dead, pos2neg TSG FAT4 Dead, sleeping.pos and neg.shutting TSG PPARG Dead, sleeping.pos Non-TSG PRDM16 Alive and Dead difference Non-TSG RYR3 Alive, neg.shutting Non-TSG KIT Dead, sleeping.pos Non-TSG SOX17 Dead, sleeping.pos Non-TSG PREX2 Dead, pos.shutting The first column is the category, i.e., TSG or non-TSG, based on the TSG database used in this study. The second column consists of gene names identified by both this study and Cao et al.[37]. The third column shows in which sample and with which co-methylation change pattern (or panel) each gene was identified. Table 7.
Genes identified by both this study and a previous study.
-
DT_L DT_LM DT_M DT_HM DT_H DT_R Sum AT_L 67766 (88.06%) 8213 (10.67%) 0 (0%) 0 (0%) 0 (0%) 975 (1.27%) 76954 (100%) AT_LM 6647 (15.5%) 26287 (61.32%) 214 (0.5%) 0 (0%) 0 (0%) 9723 (22.68%) 42871 (100%) AT_M 0 (0%) 177 (3.18%) 3291 (59.2%) 86 (1.55%) 0 (0%) 2005 (36.07%) 5559 (100%) AT_HM 0 (0%) 0 (0%) 364 (0.47%) 55797 (72.57%) 8491 (11.04%) 12240 (15.92%) 76892 (100%) AT_H 0 (0%) 0 (0%) 0 (0%) 7825 (25.72%) 22228 (73.07%) 367 (1.21%) 30420 (100%) AT_R 522 (0.33%) 6911 (4.35%) 3201 (2.02%) 17205 (10.84%) 539 (0.34%) 130385 (82.13%) 158763 (100%) Sum 74935 (19.14%) 41588 (10.62%) 7070 (1.81%) 80913 (20.67%) 31258 (7.98%) 155695 (39.77%) 391459 (100%) In the first column, 'AT' stands for Alive-Tumor. For example, 'AT_L' means Alive Tumor samples' L methylation state. On the top/first row, 'DT' stands for Dead-Tumor. Table 8.
Methylation state changes from Alive-Tumor to Dead-Tumor.
-
Alive methy.state North Shore South Shore Open-Sea Island South Shelf North Shelf Sum L 94 (9.64%) 86 (8.82%) 60 (6.15%) 733 (75.18%) 2 (0.21%) 0 (0%) 975 (100%) LM 1435 (14.76%) 1429 (14.7%) 1523 (15.66%) 5080 (52.25%) 134 (1.38%) 122 (1.25%) 9723 (100%) M 291 (14.51%) 280 (13.97%) 698 (34.81%) 519 (25.89%) 93 (4.64%) 124 (6.18%) 2005 (100%) HM 1419 (11.59%) 1257 (10.27%) 6192 (50.59%) 1662 (13.58%) 863 (7.05%) 847 (6.92%) 12240 (100%) H 32 (8.72%) 20 (5.45%) 188 (51.23%) 63 (17.17%) 31 (8.45%) 33 (8.99%) 367 (100%) R 17577 (13.48%) 16096 (12.34%) 53099 (40.72%) 33522 (25.71%) 5005 (3.84%) 5086 (3.9%) 130385 (100%) Table 9.
Analysis of locations for CGs whose methylation states changed to R in Dead samples.
-
Alive. methy. state Num_CG_w_0_Gene Num_CG_w_1_Gene Num_CG_w_GE2_Gene Total_Num_CG L 48 (4.92%) 559 (57.33%) 368 (37.74%) 975 (100%) LM 944 (9.71%) 6121 (62.95%) 2658 (27.34%) 9723 (100%) M 340 (16.96%) 1301 (64.89%) 364 (18.15%) 2005 (100%) HM 2209 (18.05%) 8153 (66.61%) 1878 (15.34%) 12240 (100%) H 31 (8.45%) 290 (79.02%) 46 (12.53%) 367 (100%) R 24987 (19.16%) 80592 (61.81%) 24806 (19.03%) 130385 (100%) Table 10.
Numbers of genes associated with CGs whose methylation states changed to R in Dead samples.
-
Alive_State 1 isoform 2 ~ 4 isoforms 5 ~10 isoforms 11 ~ 20 isoforms ≥ 21 isoforms Total L 90 (16.1%) 228 (40.79%) 206 (36.85%) 34 (6.08%) 1 (0.18%) 559 LM 1292 (21.11%) 2667 (43.57%) 1723 (28.15%) 379 (6.19%) 60 (0.98%) 6121 M 322 (24.75%) 539 (41.43%) 350 (26.9%) 80 (6.15%) 10 (0.77%) 1301 HM 1996 (24.48%) 3456 (42.39%) 2149 (26.36%) 490 (6.01%) 62 (0.76%) 8153 H 68 (23.45%) 118 (40.69%) 88 (30.34%) 15 (5.17%) 1 (0.34%) 290 R 20933 (25.97%) 34751 (43.12%) 20118 (24.96%) 4169 (5.17%) 621 (0.77%) 80592 Table 11.
Numbers of isoforms for CG sites associated with one gene.
Figures
(10)
Tables
(11)