-
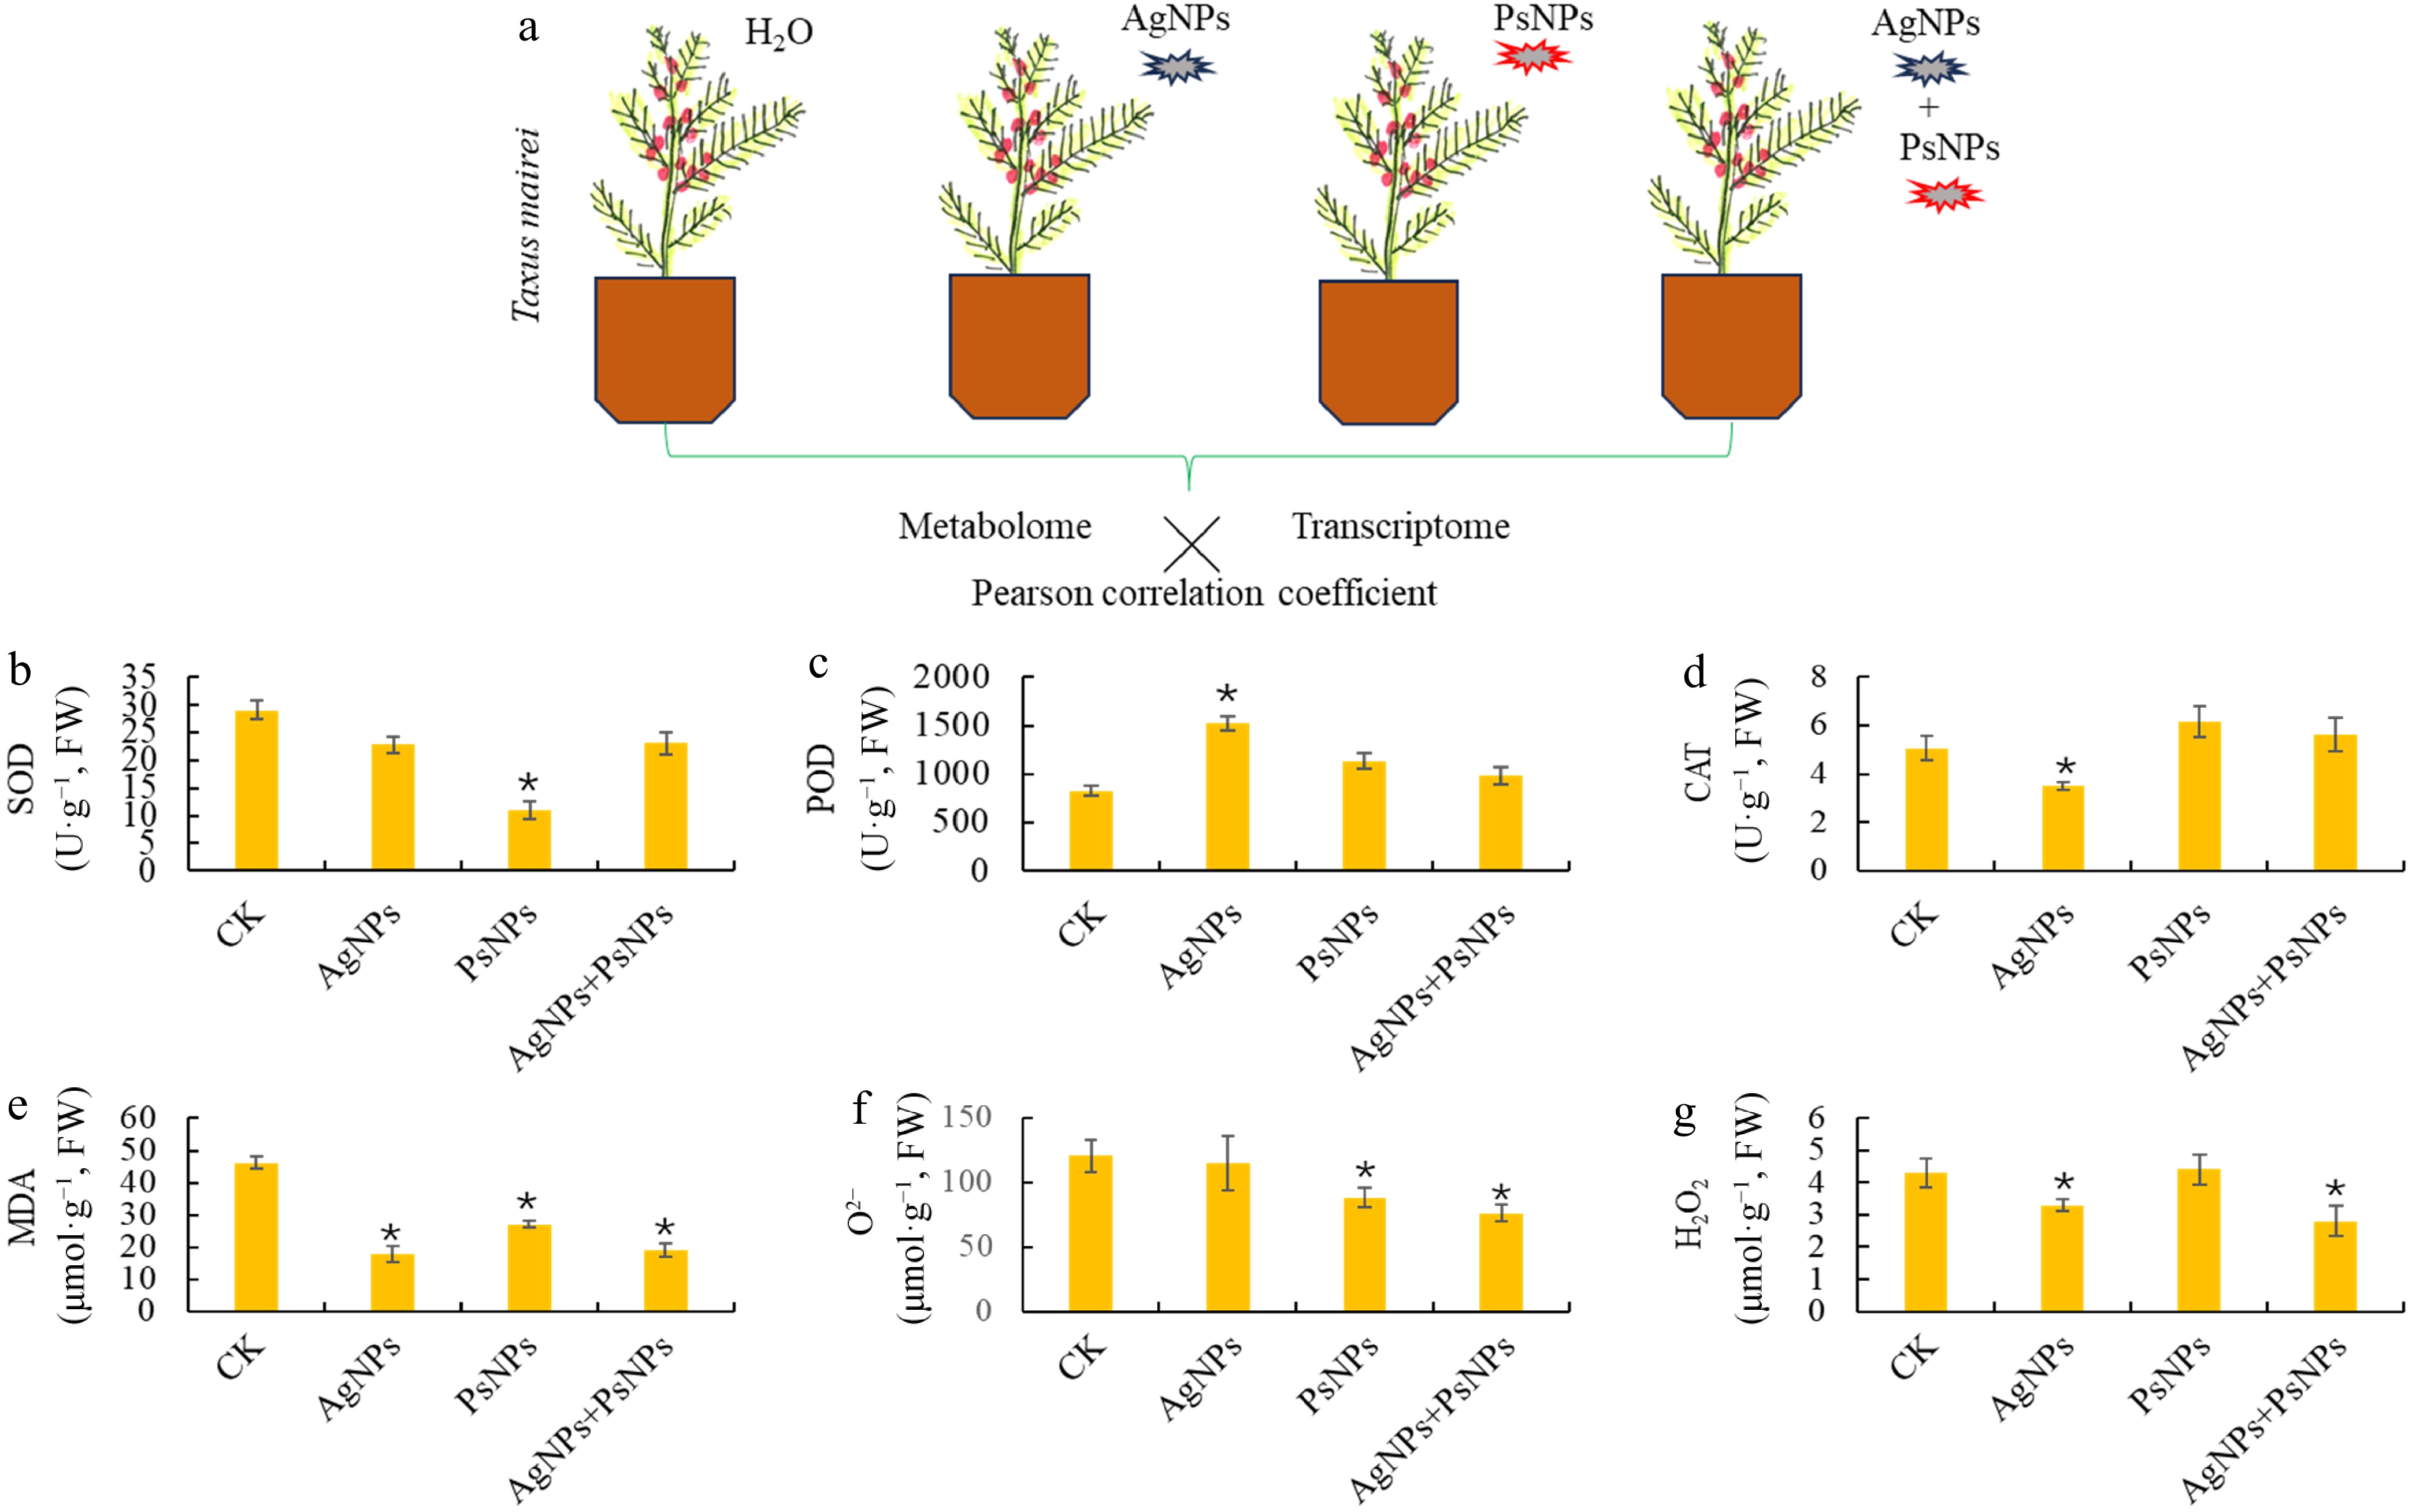
Figure 1.
Physiological responses of T. mairei to two different nanoparticulate pollutants. (a) Schematic diagram of experimental design. Two nanoparticulate pollutants, polystyrene nanoplastics (PsNPs), and silver nanoparticles (AgNPs), were used to treat the T. mairei seedlings. Six major stress-related physiological parameters, (b) SOD, (c) POD, (d) CAT, (e) MDA, (f) O2−, and (g) H2O2, were determined under different treatments. Statistical significance is denoted by * at a p value < 0.05.
-
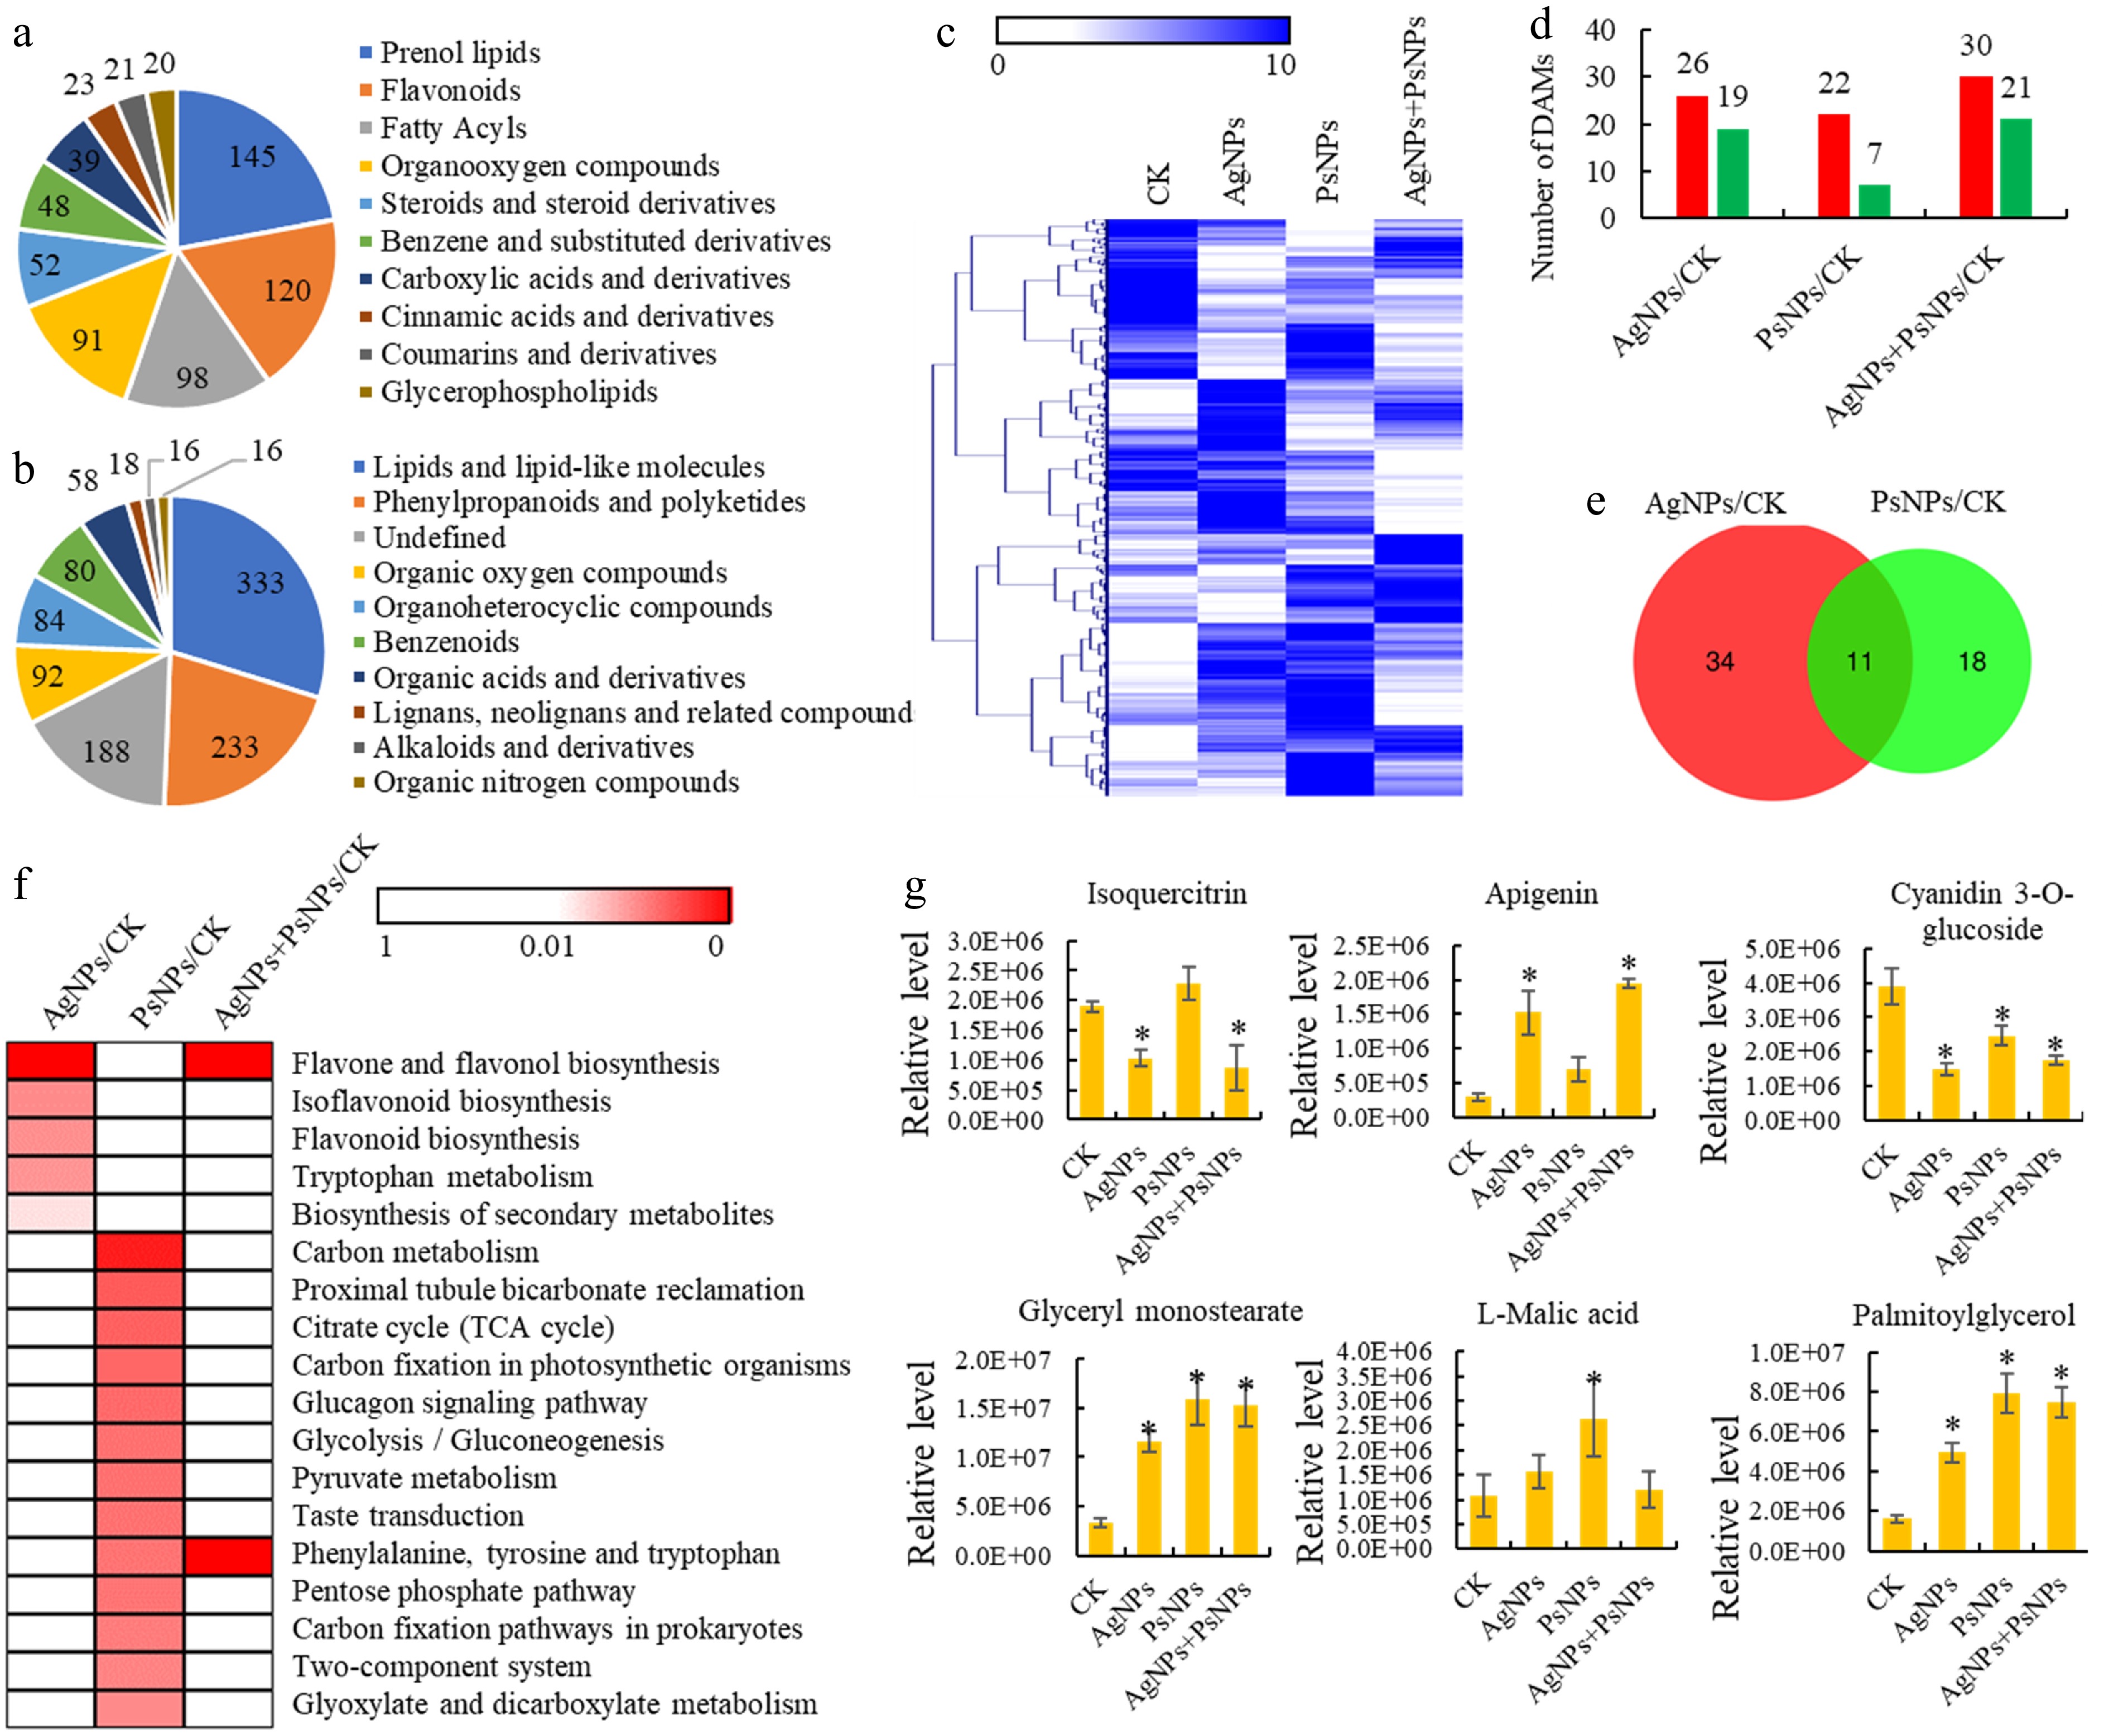
Figure 2.
Metabolomics analyses of T. mairei seedlings under AgNPs and PsNPs treatments. (a) All identified metabolites grouped into major categories. (b) All identified metabolites grouped into superclasses. (c) The metabolite profiles of different treatment groups. The heatmap scale ranges from 0 to 10 on a log2 scale. (d) The number of differentially accumulated metabolites (DAMs) in different treatment comparisons. (e) Venn diagram analysis of the shared DAMs between AgNPs/CK and PsNPs/CK comparisons. (f) KEGG enrichment analysis of the DAMs in different treatment comparisons. The significant P values of each KEGG term in the three comparisons are illustrated by a heatmap. The heatmap scale ranges from 1 to 0. (g) The accumulation levels of six typical metabolites in different treatment groups. Statistical significance is denoted by * at a p value < 0.05.
-
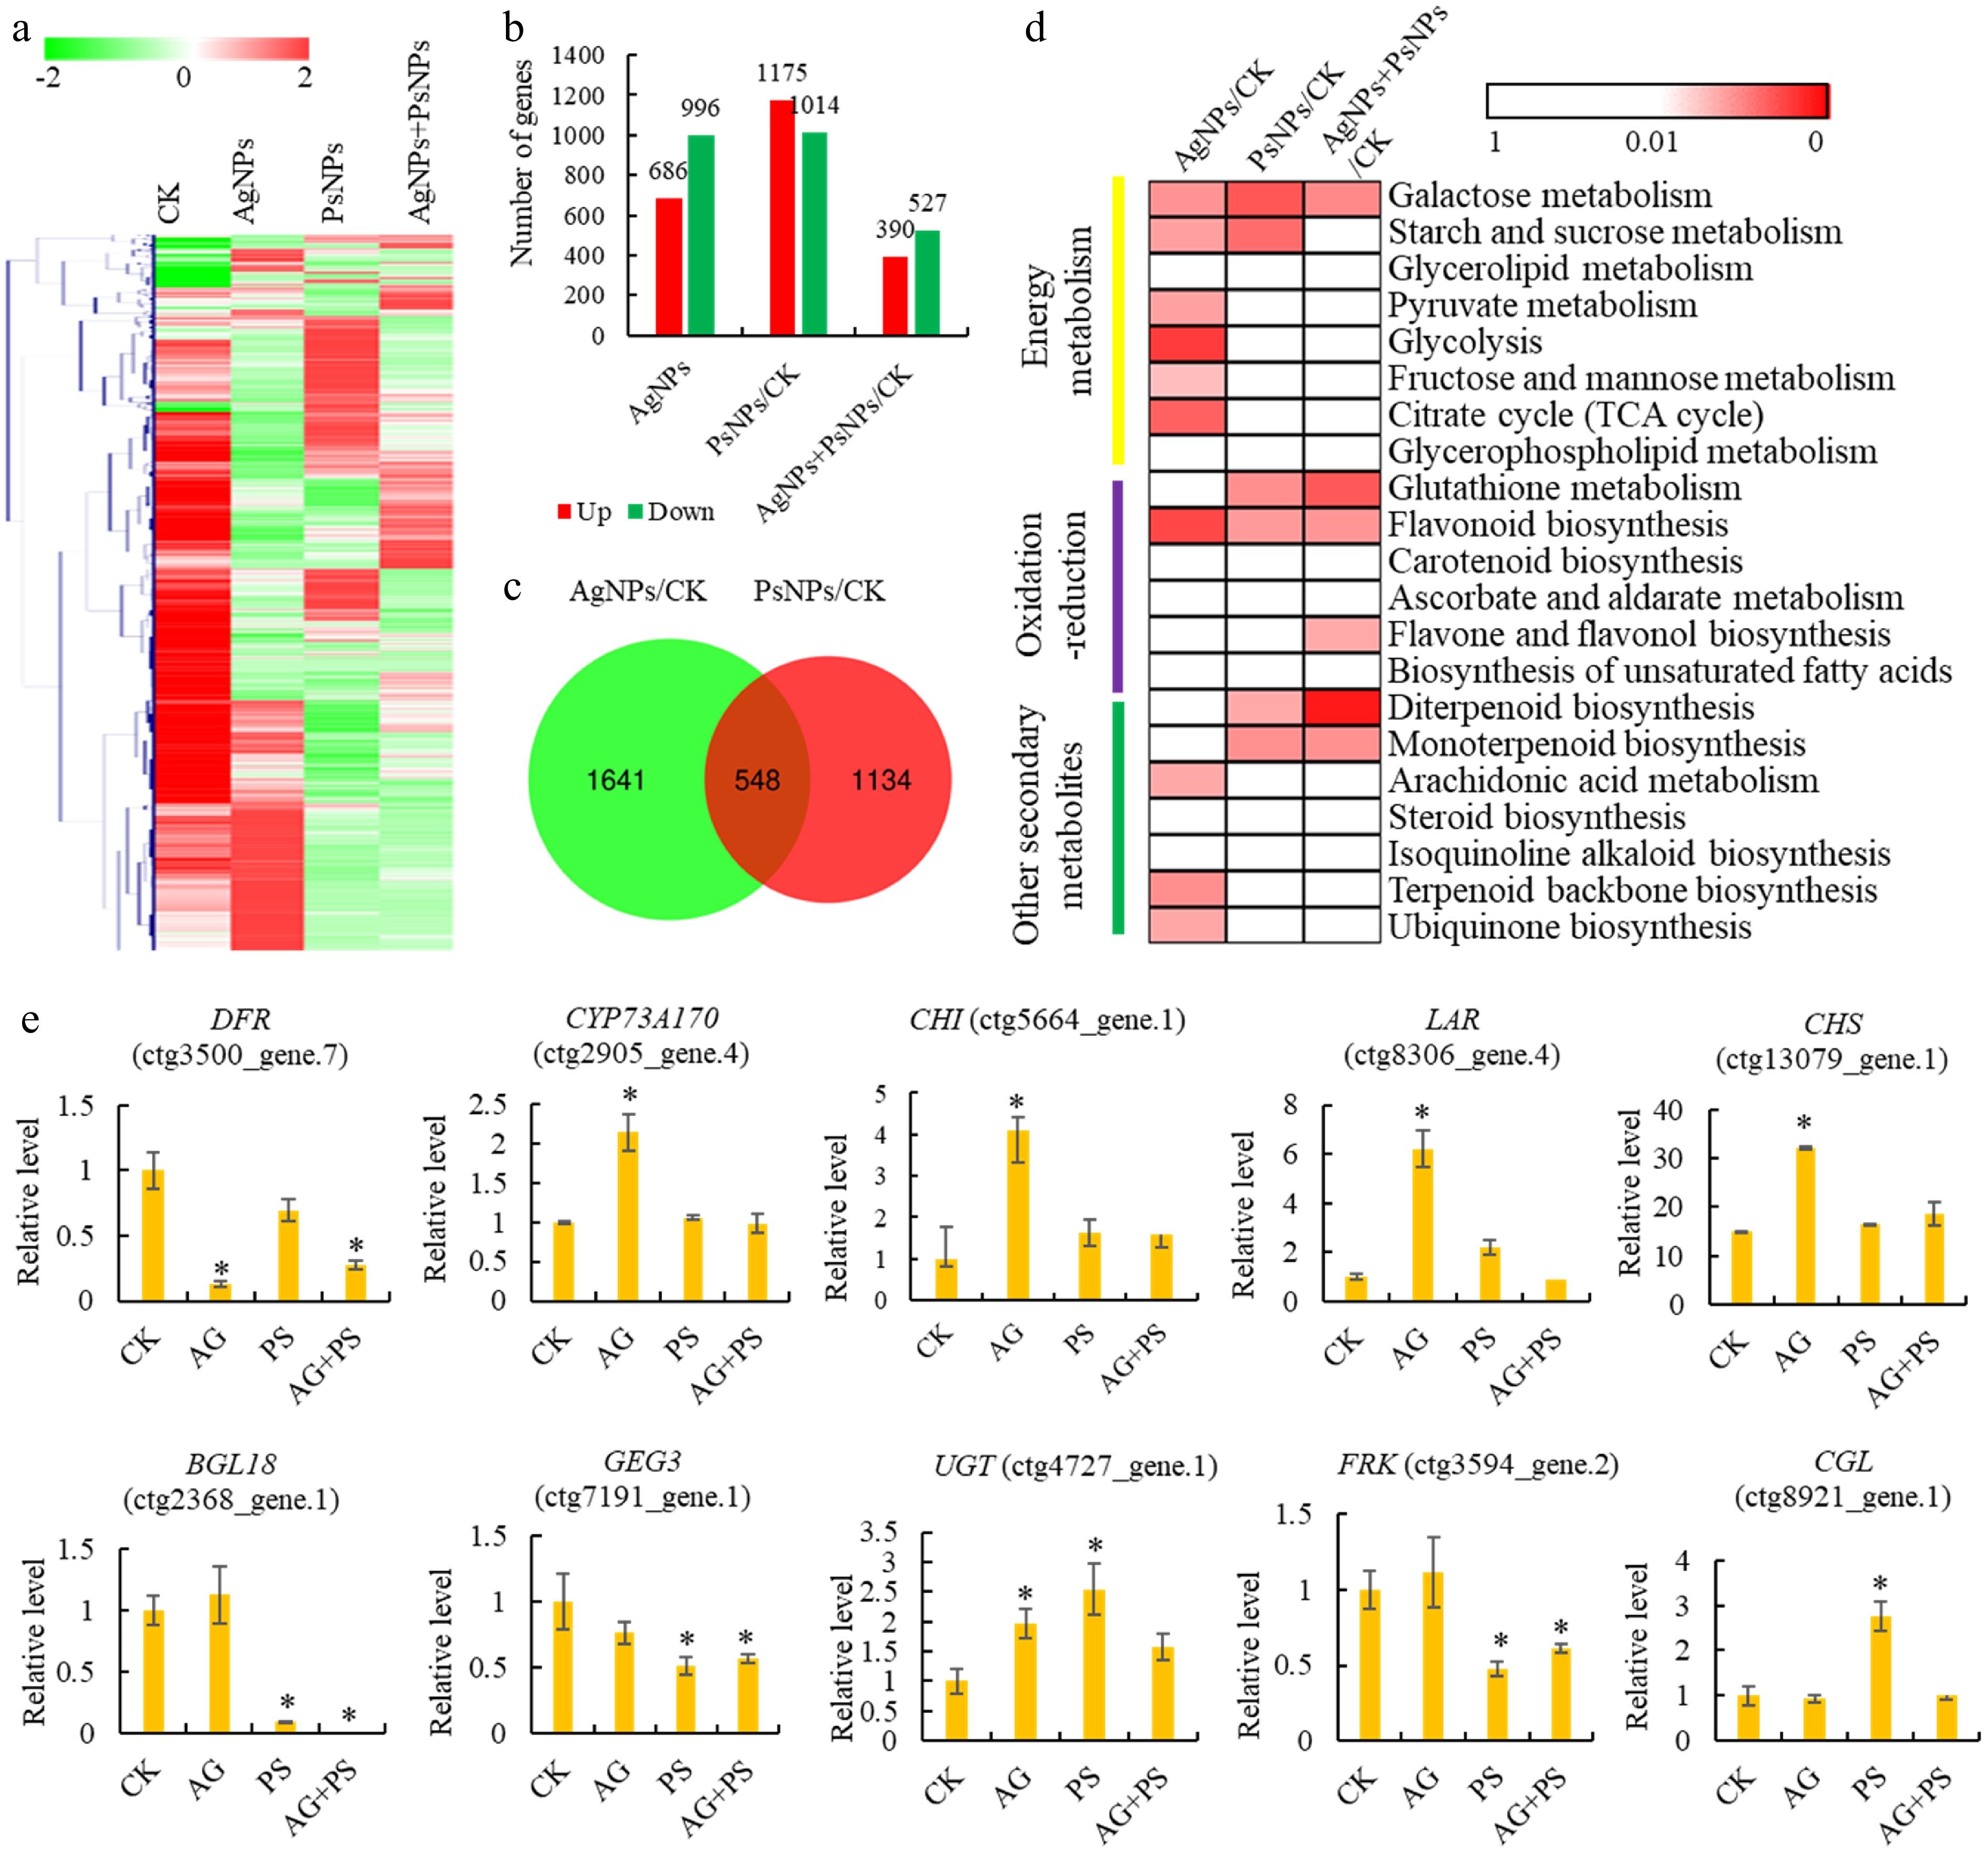
Figure 3.
Transcriptomic analysis of T. mairei seedlings under AgNPs and PsNPs treatments. (a) Gene expression profiles of different treatment groups. The heatmap scale ranges from −2 to 2 on a log2 scale. (b) The number of differentially expressed genes (DEGs) in different treatment comparisons. (c) Venn diagram analysis of the shared DEGs between AgNPs/CK and PsNPs/CK comparisons. (d) KEGG enrichment analysis of the DEGs in different treatment comparisons. The significant P values of each KEGG term in the three comparisons are illustrated by a heatmap. The heatmap scale ranges from 1 to 0. (e) The expression levels of 10 typical genes in different treatment groups. Statistical significance is denoted by * at a p value < 0.05.
-
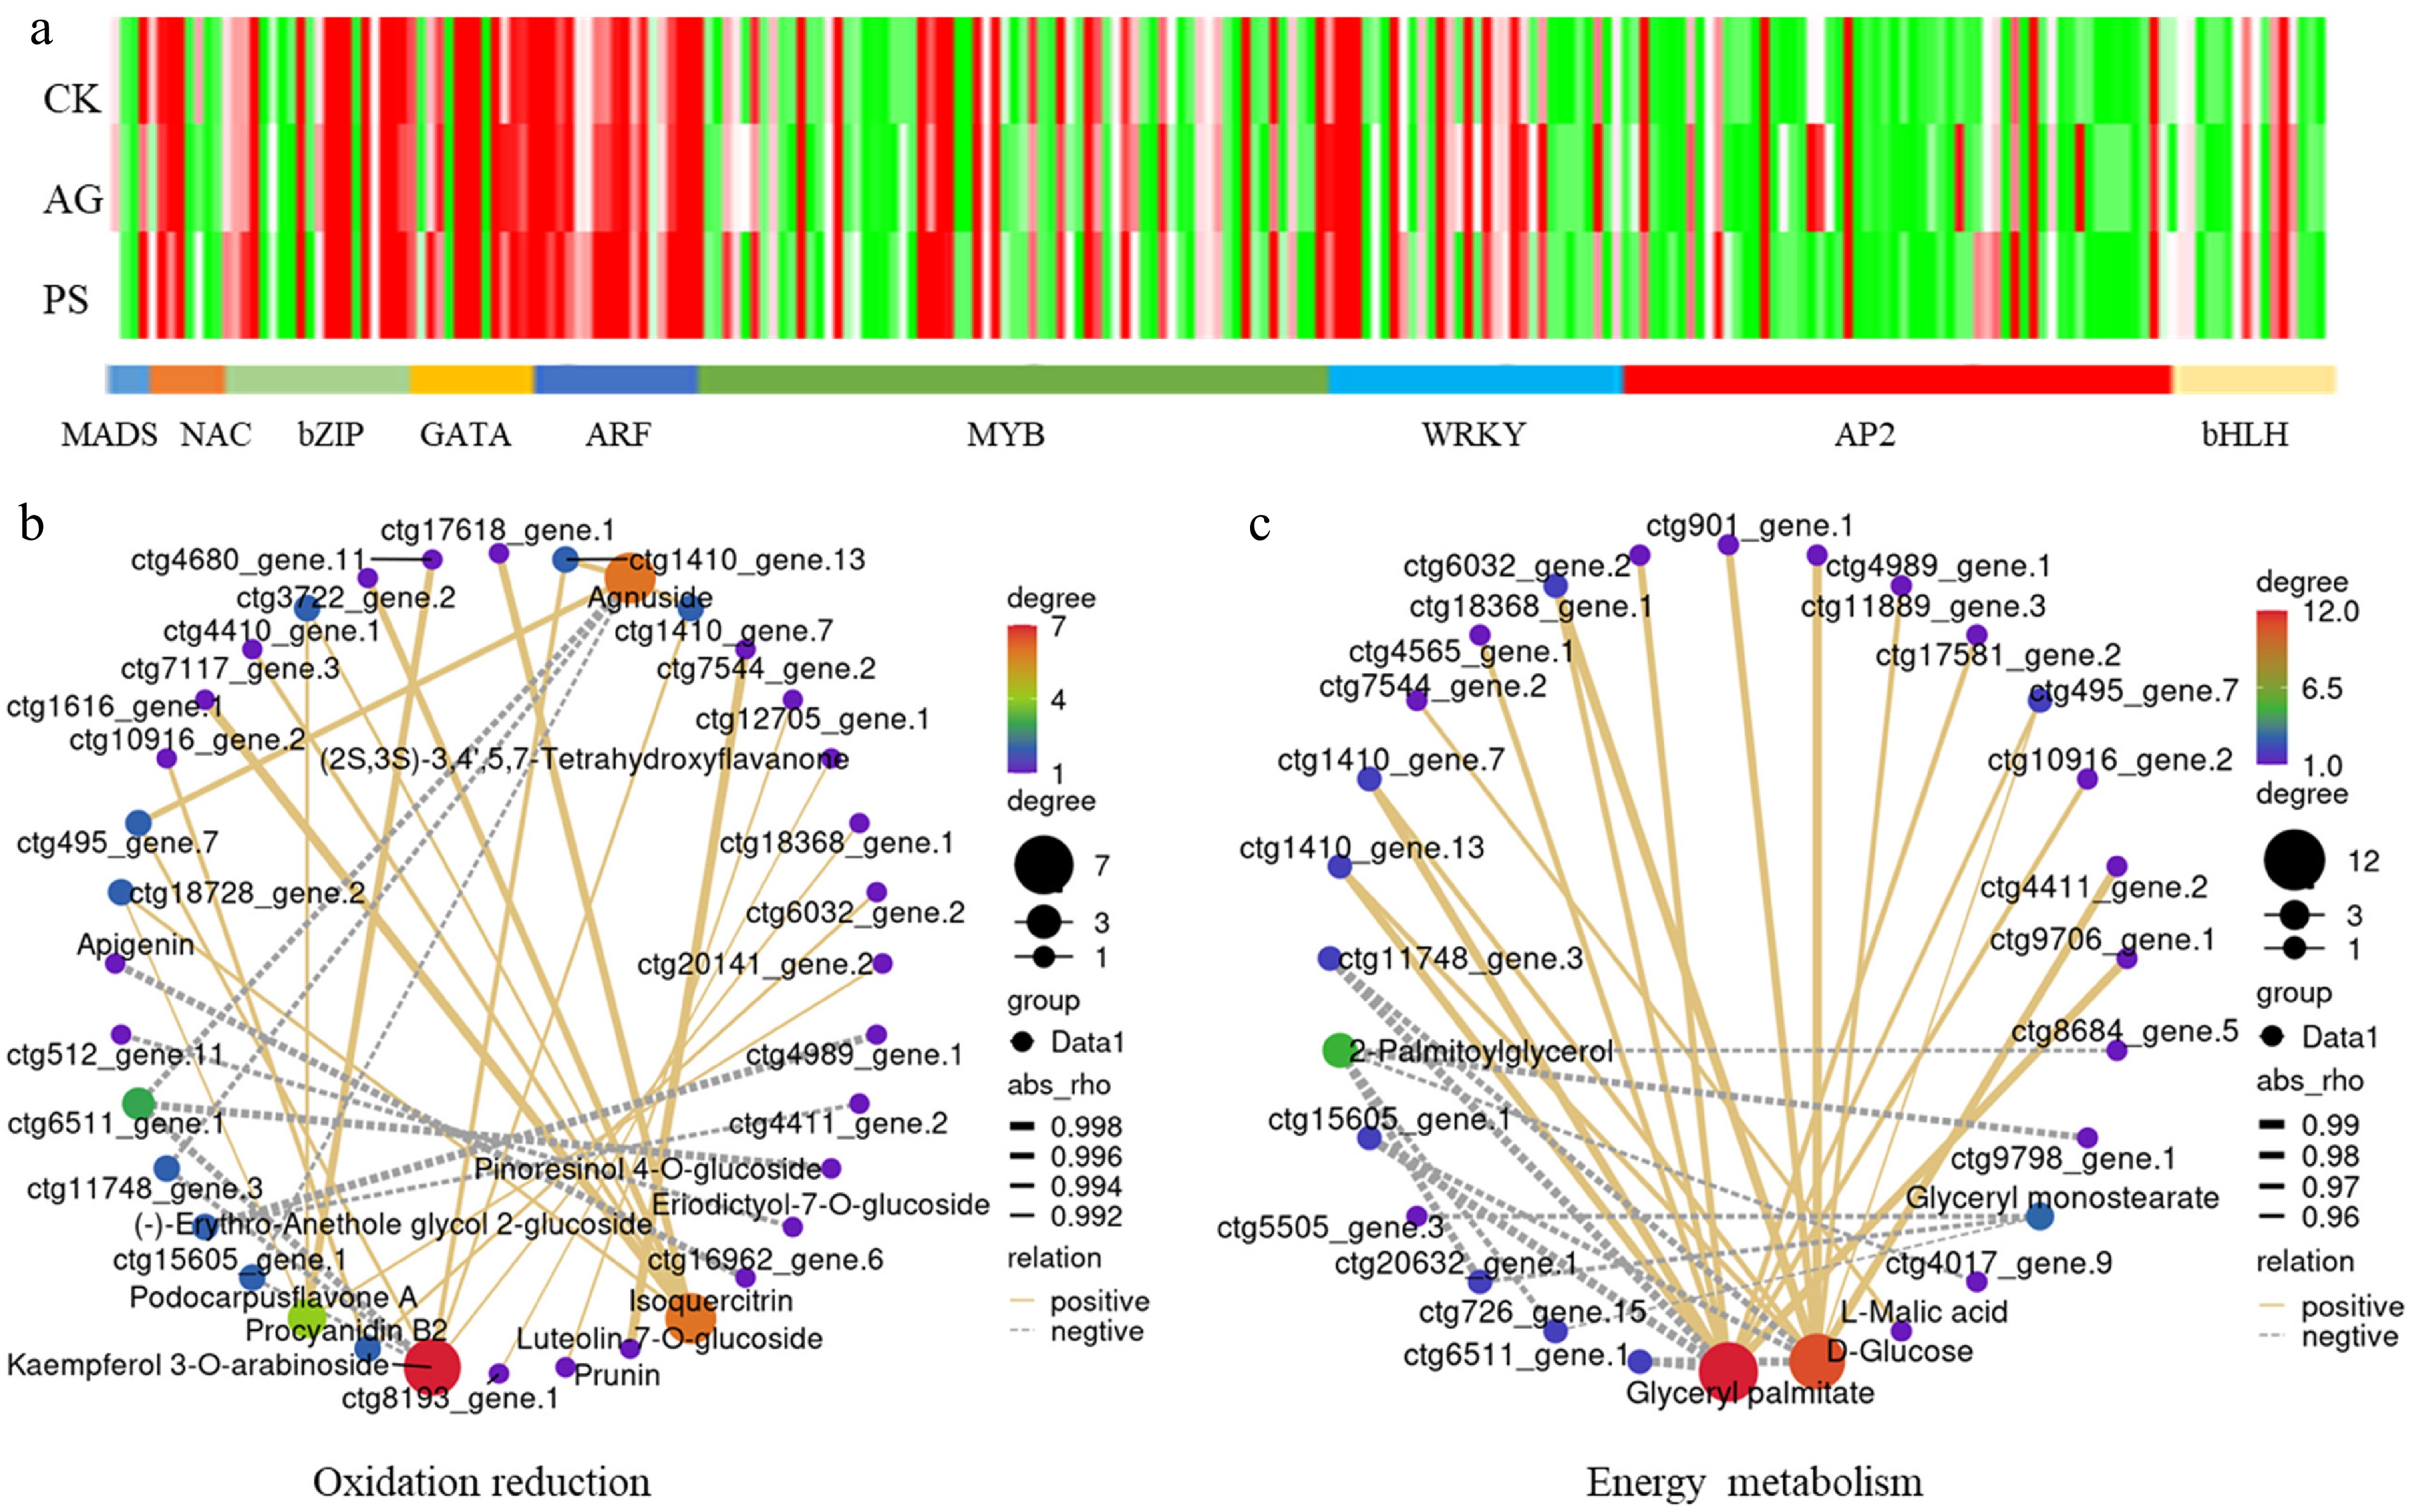
Figure 4.
Analysis of differentially expressed transcription factor (TF) genes. (a) The expression profiles of TF encoding genes, including the members belonging to MADS, NAC, bZIP, GATA, ATF, MYB, WRKY, AP2, and bHLH families. (b) Pearson correlation analysis of TFs and oxidation reduction-related DAMs. (c) Pearson correlation analysis of TFs and energy metabolism-related DAMs.
-
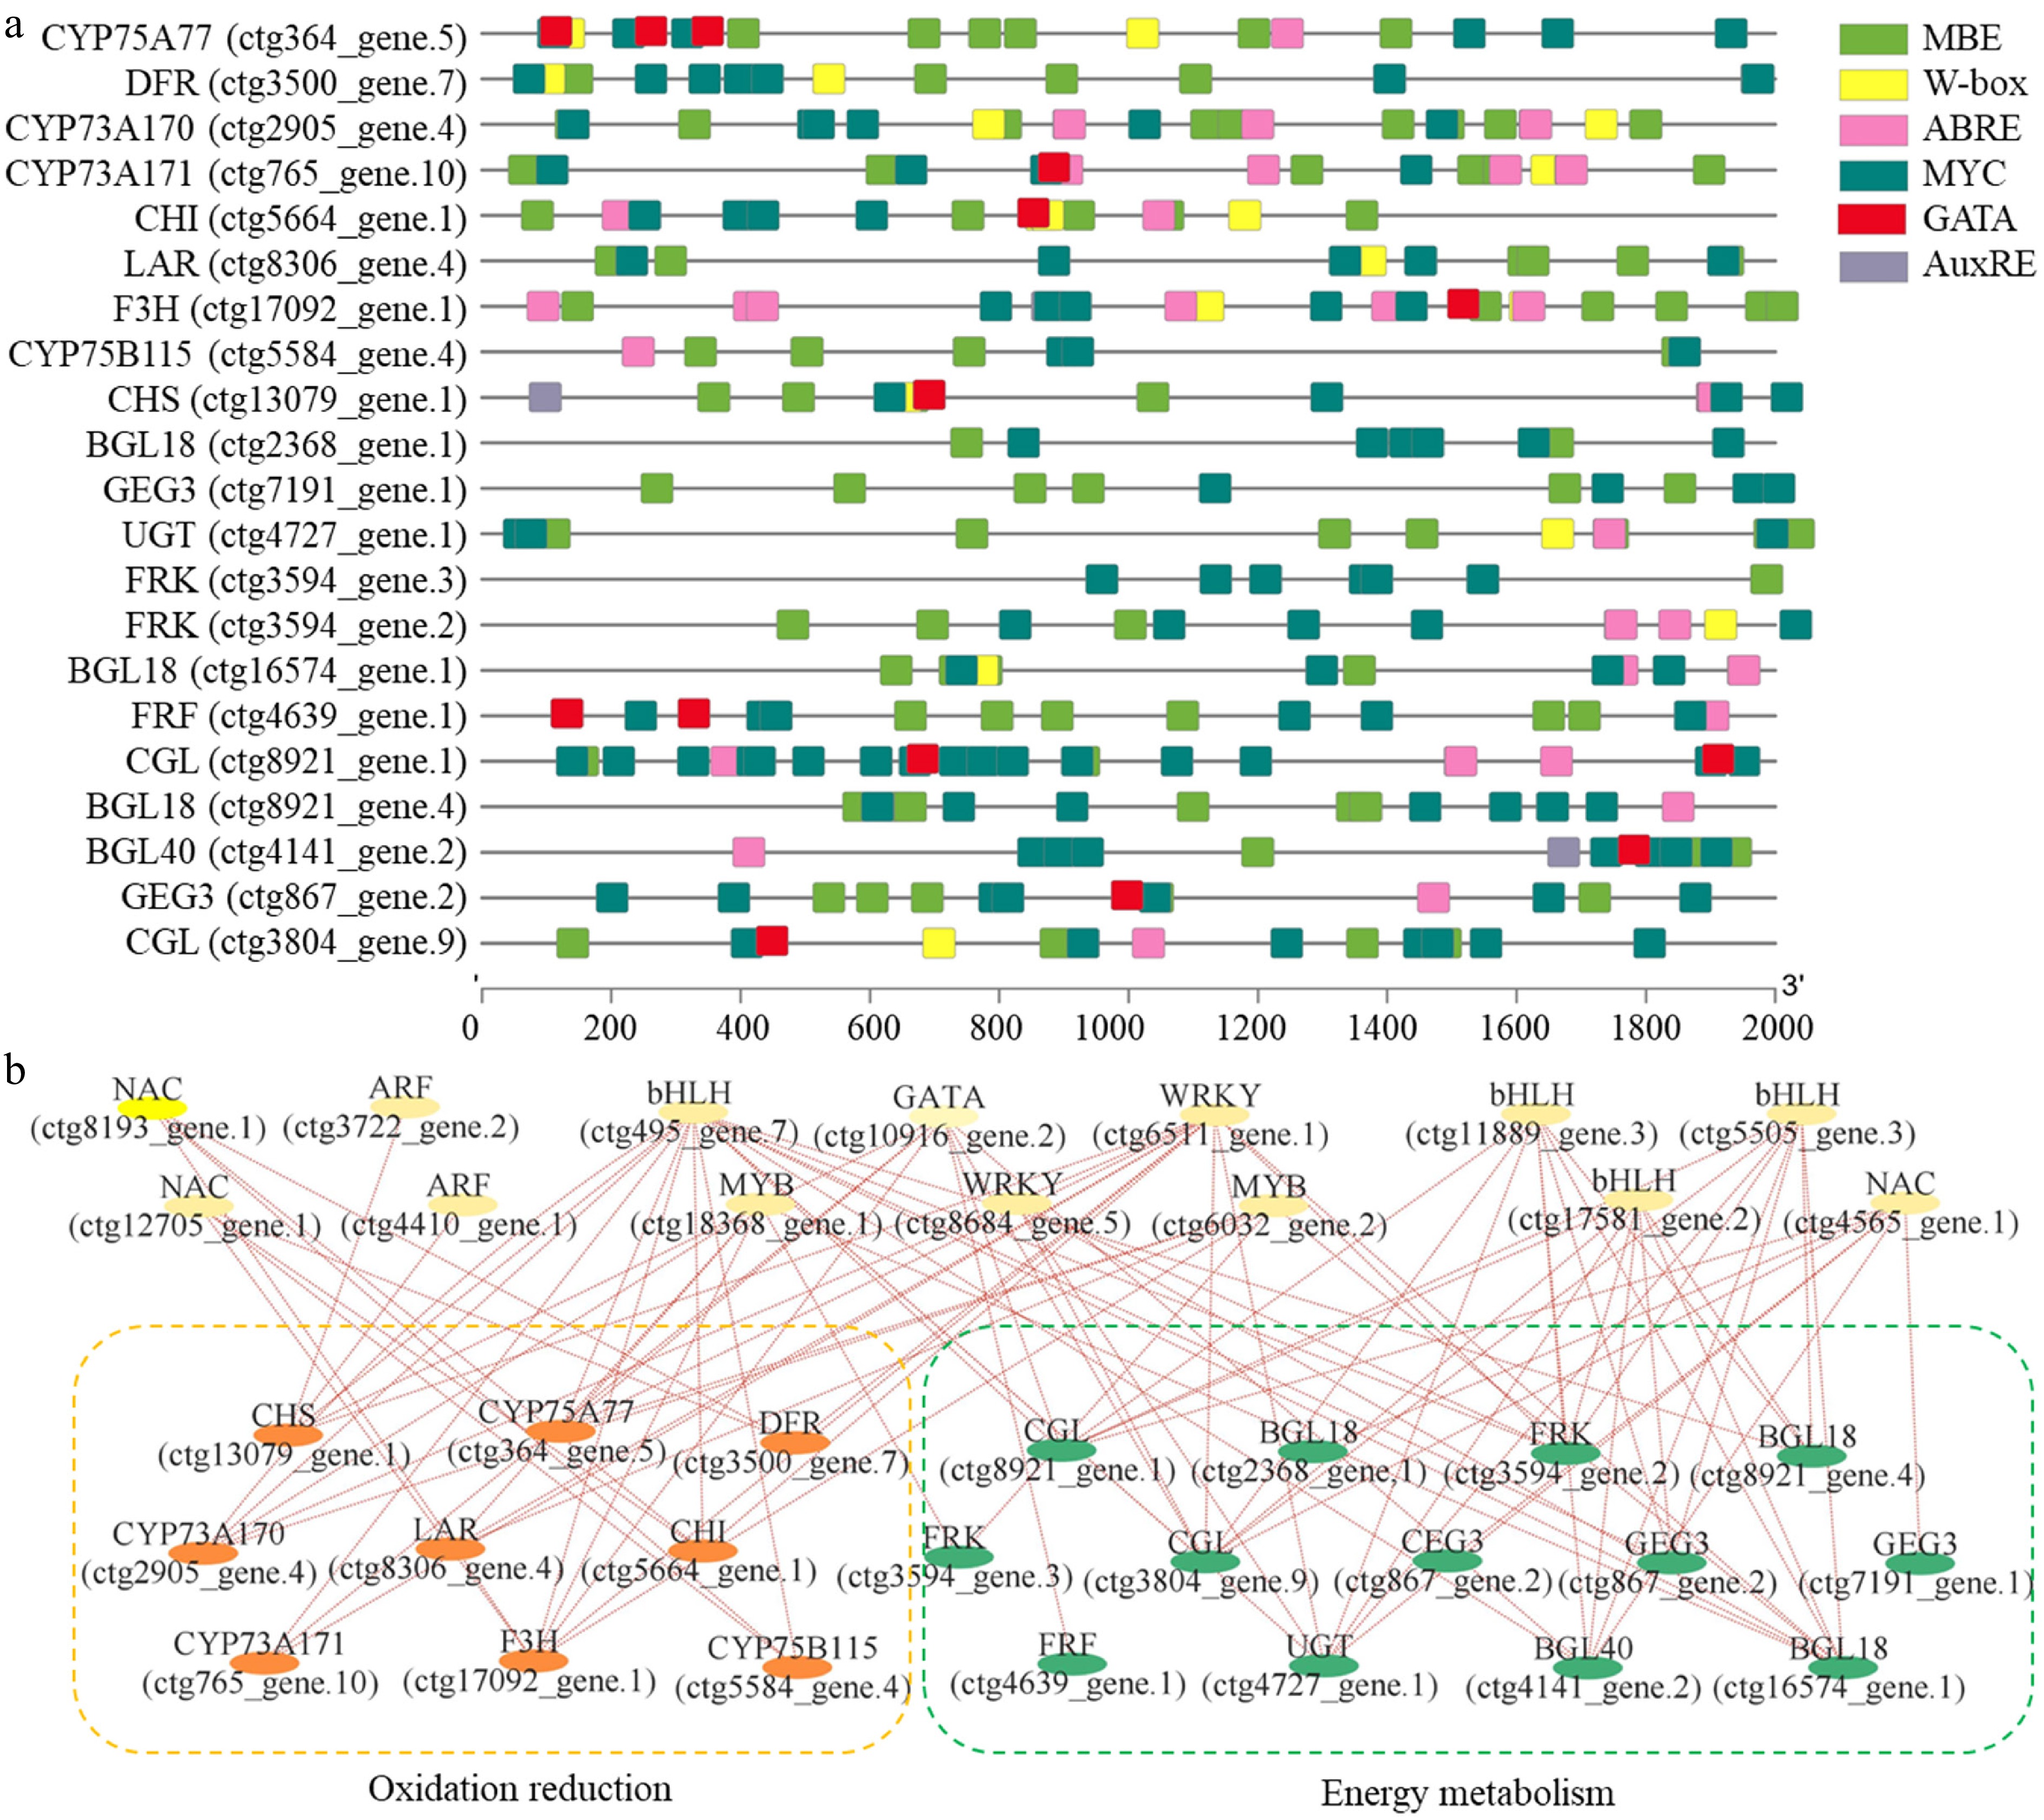
Figure 5.
Prediction of transcriptional regulatory networks. (a) Promoter analysis of nine oxidation reduction-related genes and 12 energy metabolism-related genes. Different color boxes indicate different cis-elements, including MBE, W-box, ABRE, MYC, GATA, and AuxRE. (b) A potential regulatory network as predicted by the Pearson correlation analysis method.
-
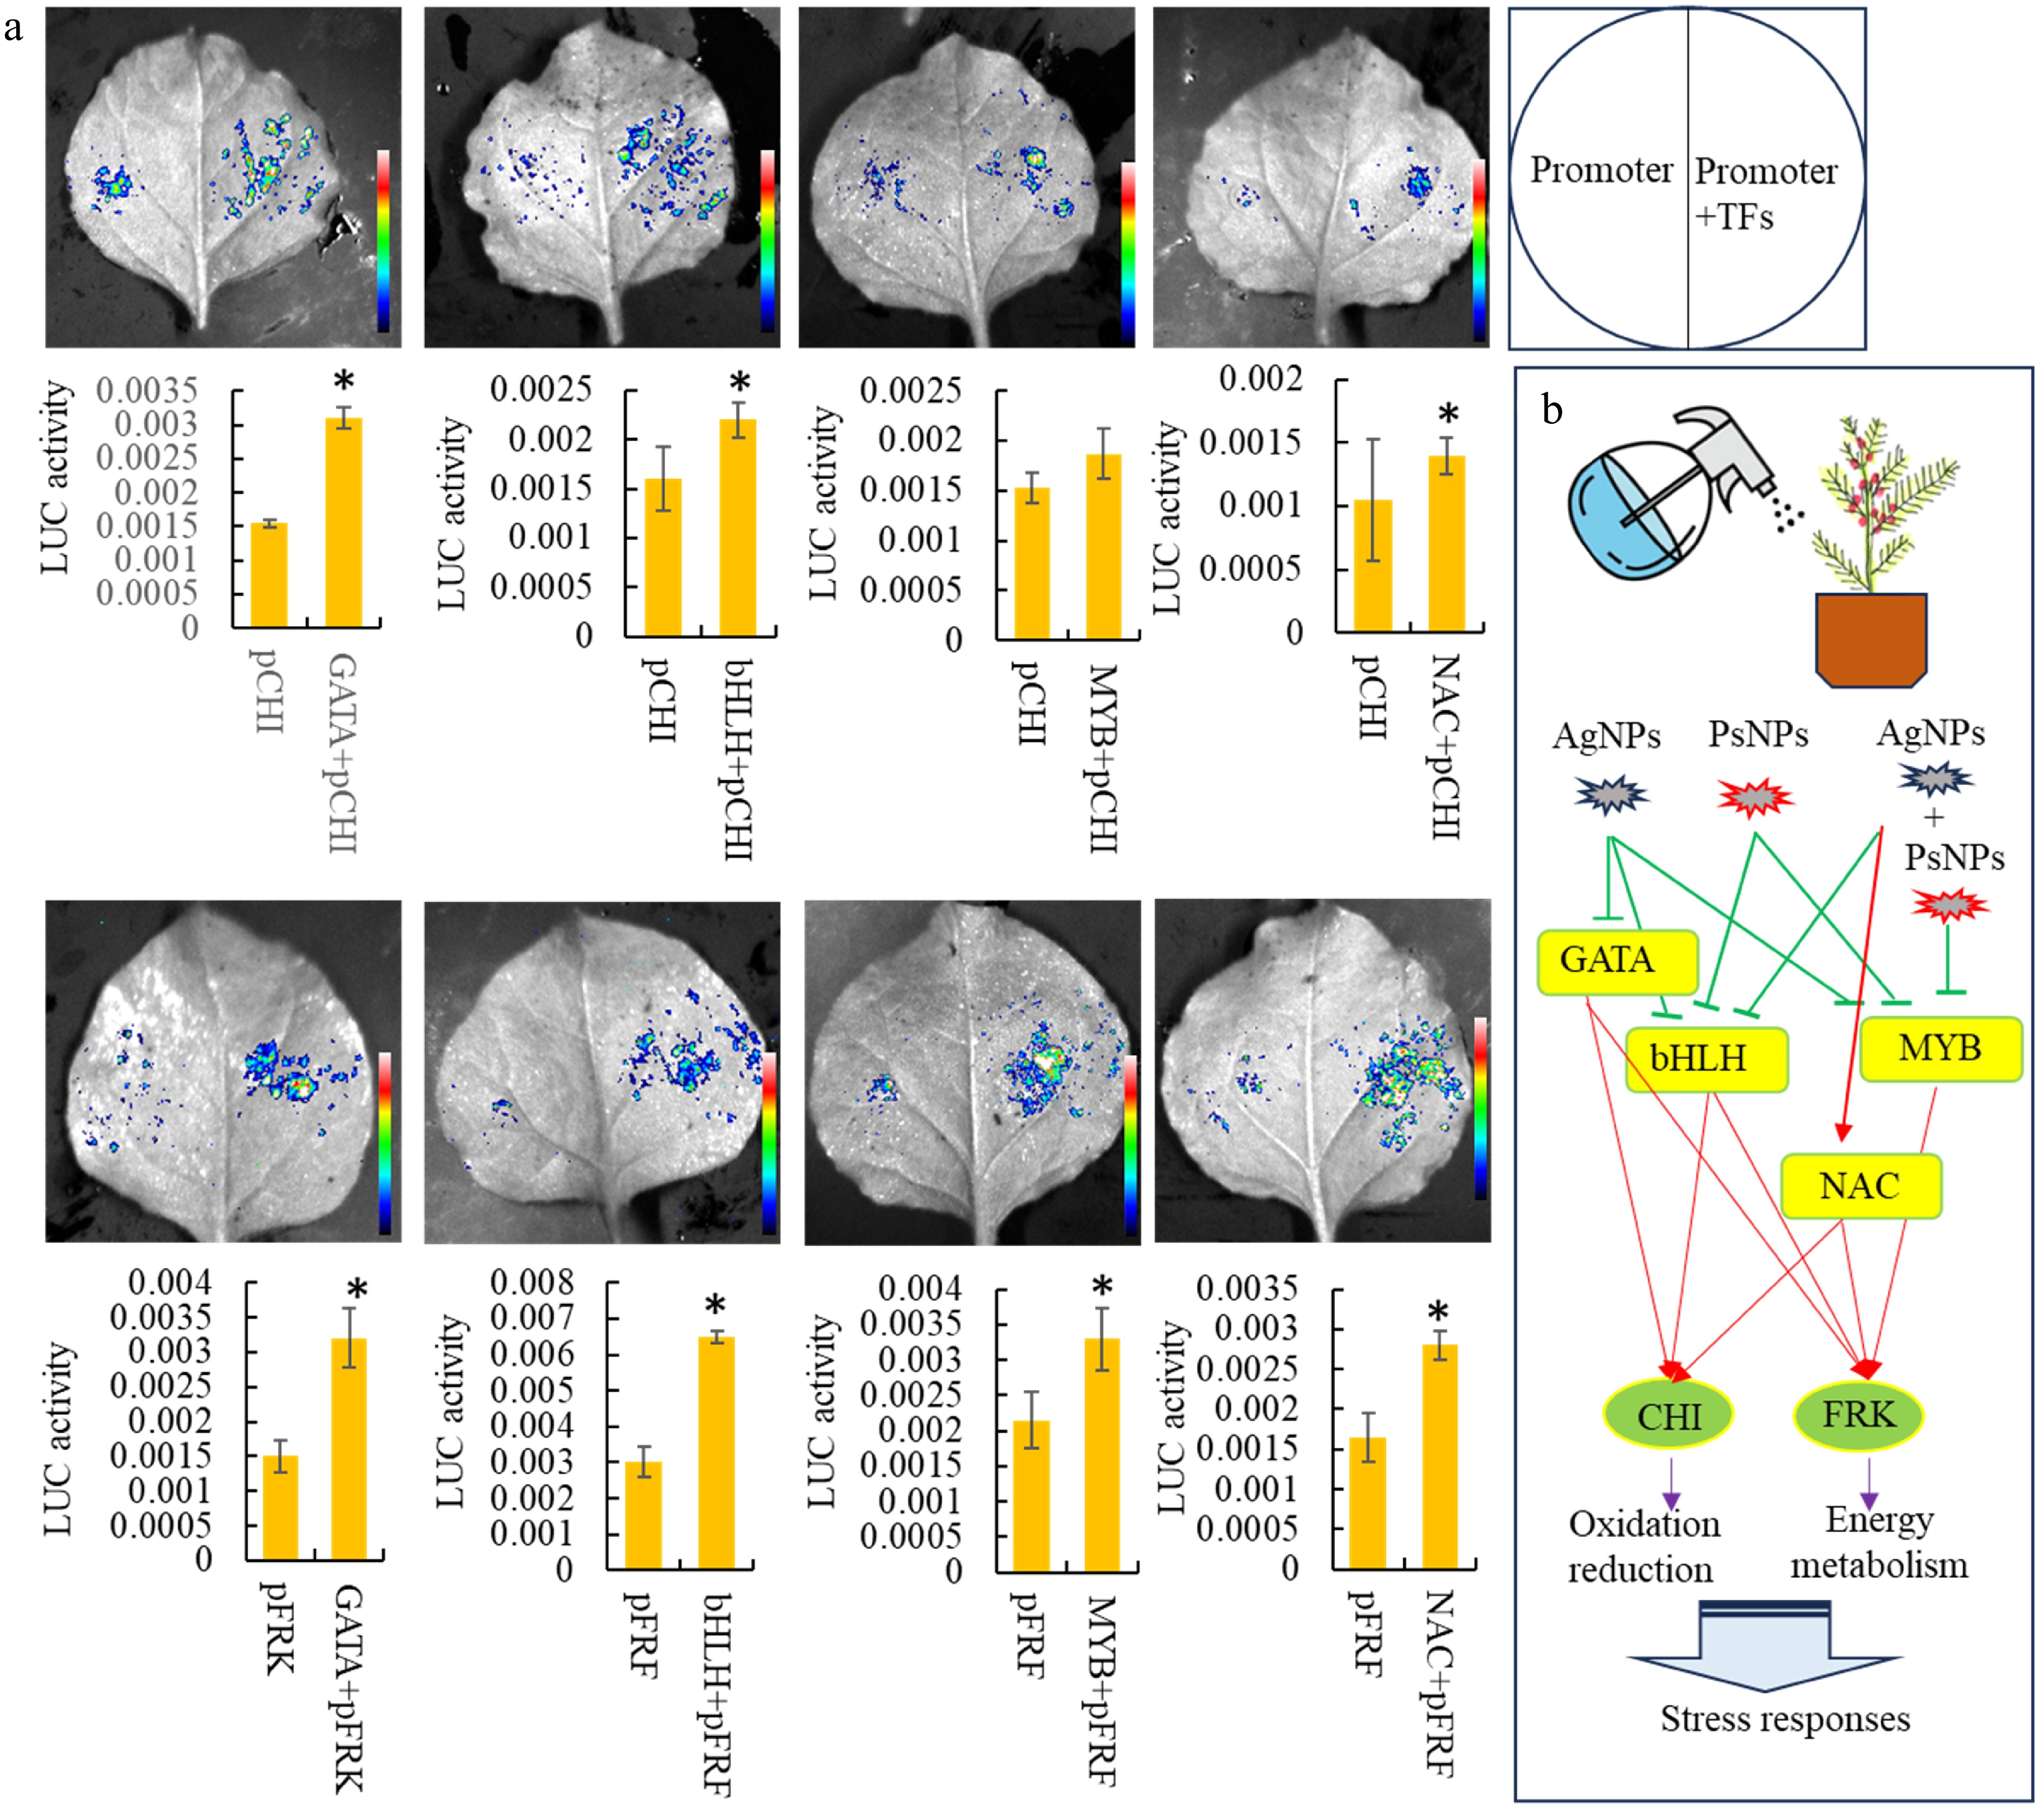
Figure 6.
Analysis of downstream target genes of various differentially expressed TFs. (a) Dual-luciferase assays in tobacco leaves demonstrating that the co-transformation of TFs activates the promoters of two important downstream target genes. Statistical significance is denoted by * at a p value < 0.05. (b) A predicted model of transcription regulation associated with the responses to nanoparticulate pollutants.
Figures
(6)
Tables
(0)