-
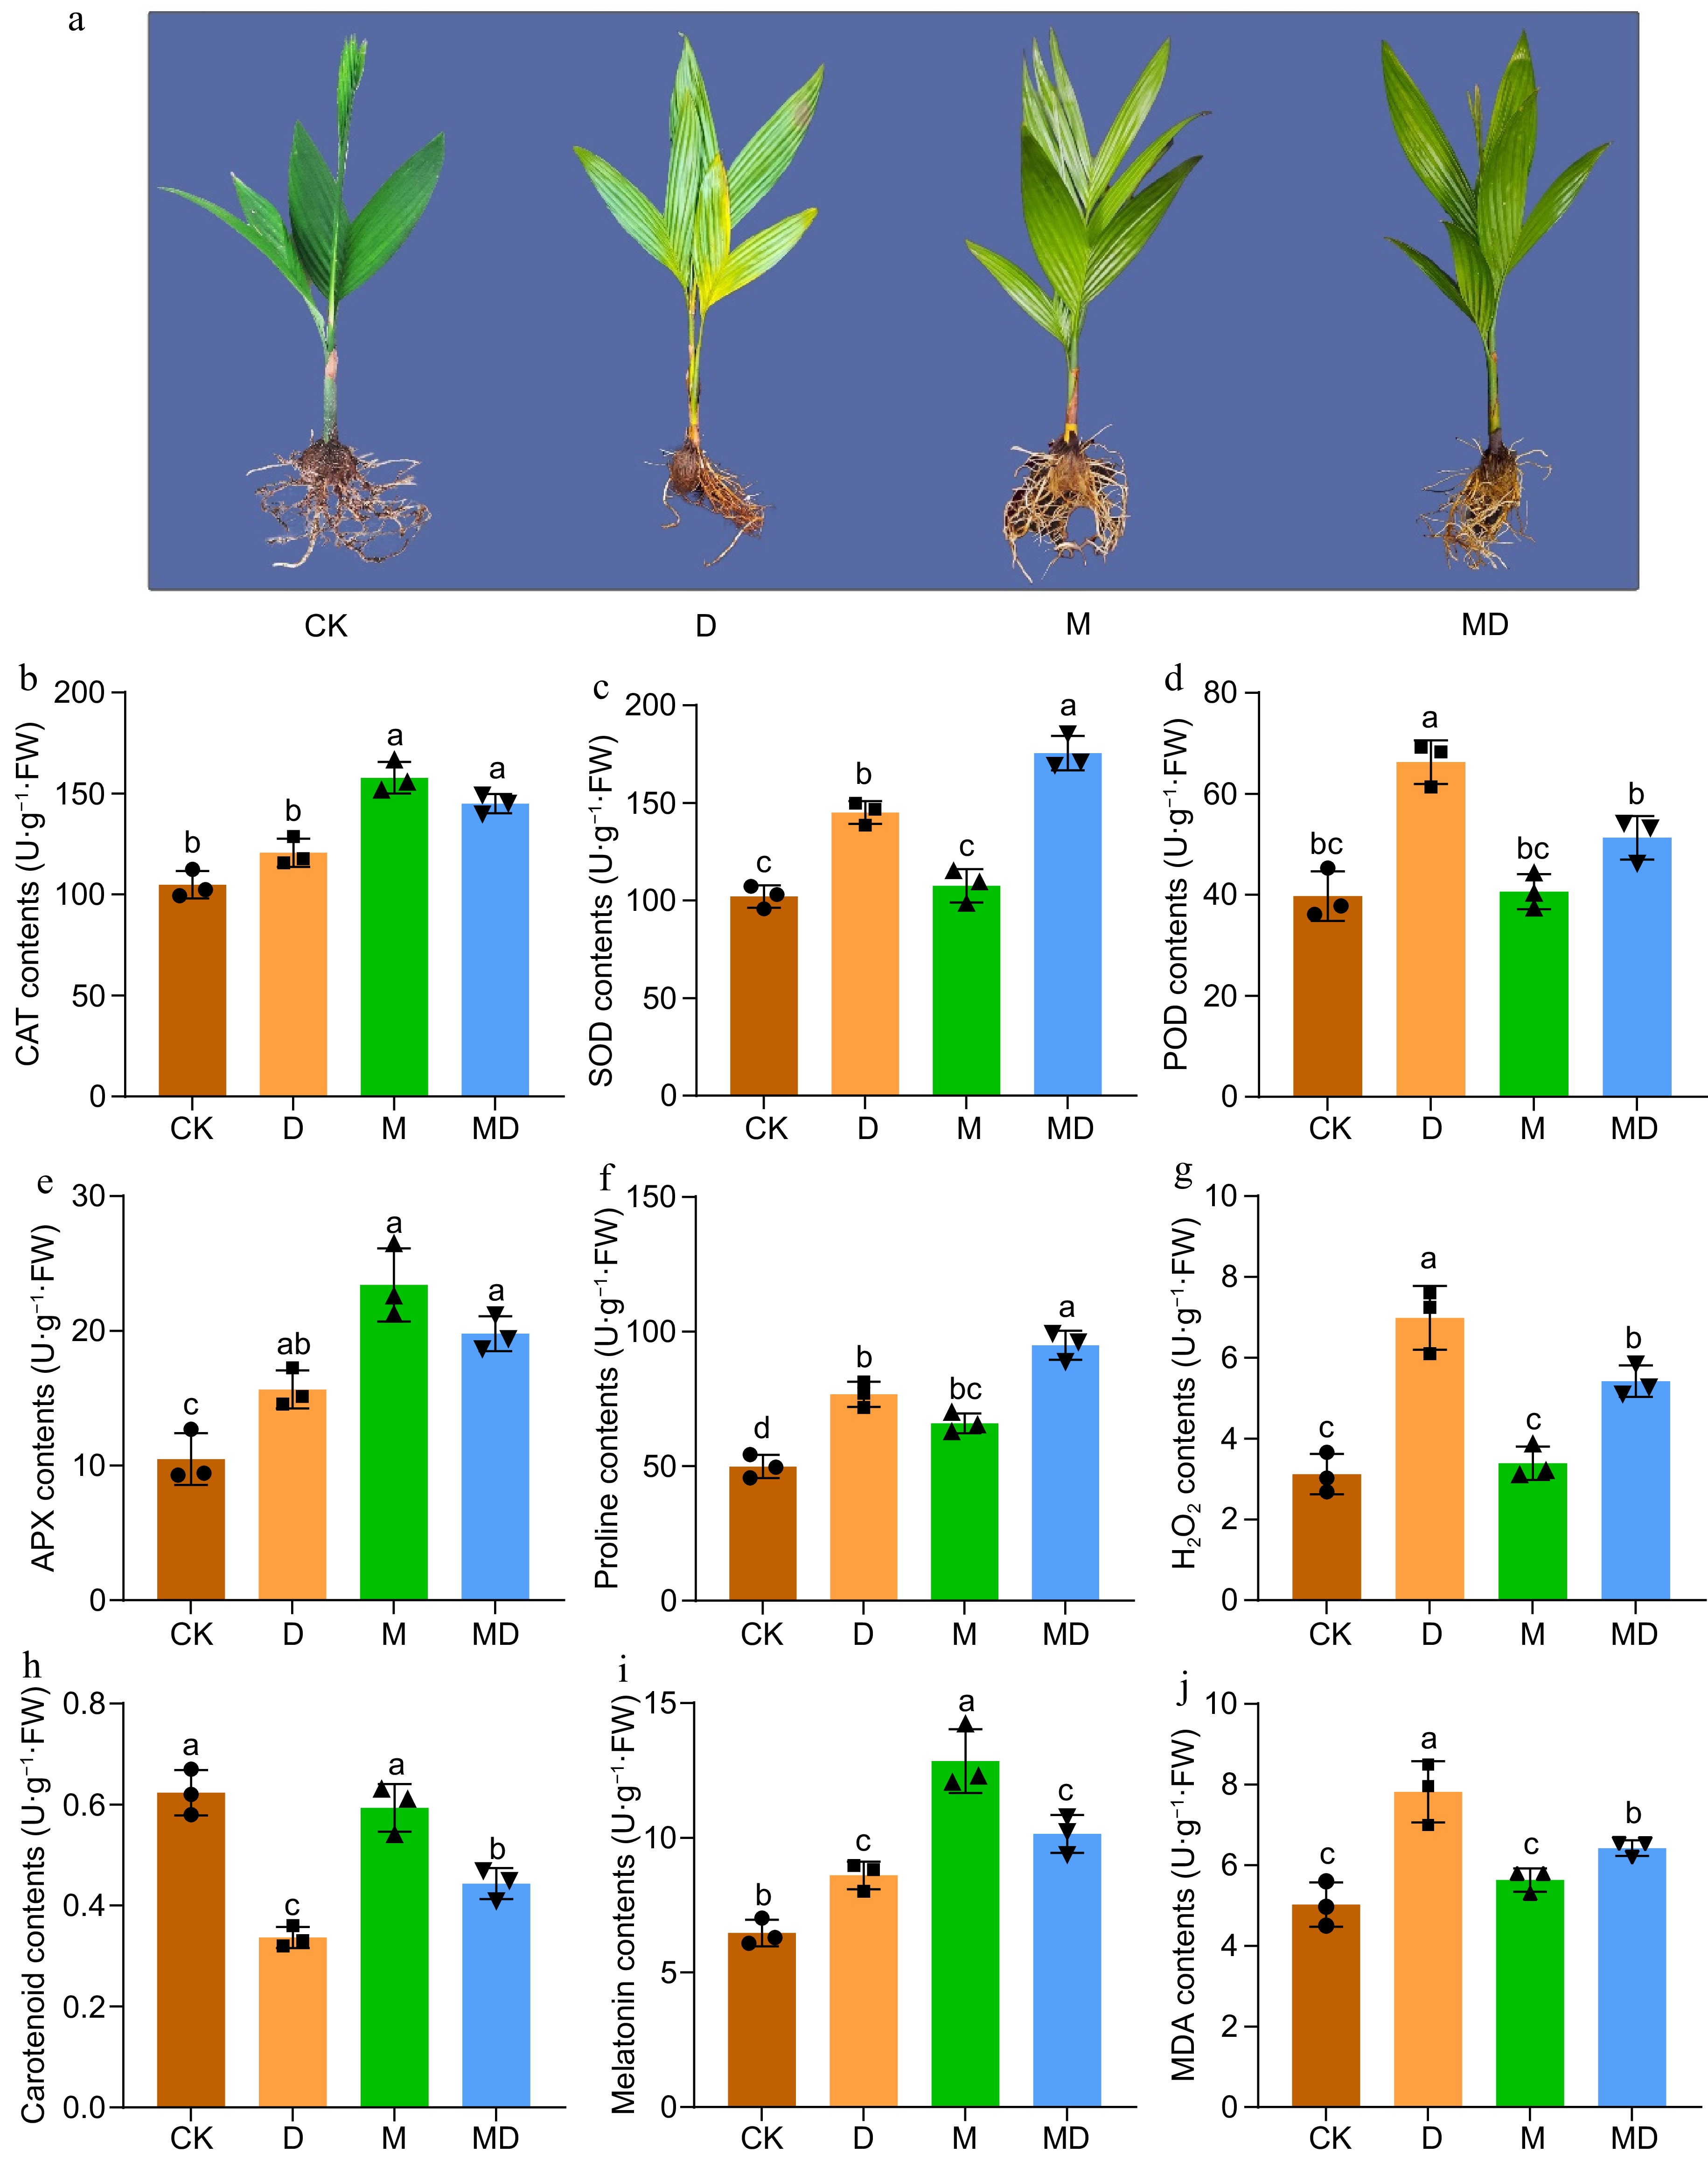
Figure 1.
This figure illustrates the phenotypic and biochemical responses of A. catechu seedlings subjected to drought stress (D) and exogenous melatonin (M) treatment following drought stress (MD). The experiment included four treatments: control (CK), melatonin (M), drought stress (D), and drought stress combined with melatonin (MD). (a) After a 30-d drought stress period, morphological observations were recorded. Subsequently, the activities of key antioxidant enzymes were assessed, including (b) catalase (CAT), (c) superoxide dismutase (SOD), (d) peroxidase (POD), and (e) ascorbate peroxidase (APX). Additionally, the levels of (f) proline, (g) hydrogen peroxide H2O2, (h) carotenoids, (i) endogenous melatonin, and (j) malondialdehyde (MDA) were measured. Each bar in the figure represents the mean ± standard deviation based on three biological replicates (n = 3). Statistically significant differences between treatments are denoted by different letters above the bars (p < 0.05), determined through Duncan's multiple range test. Treatment comparisons were performed using one-way ANOVA with a significance threshold of p < 0.05.
-
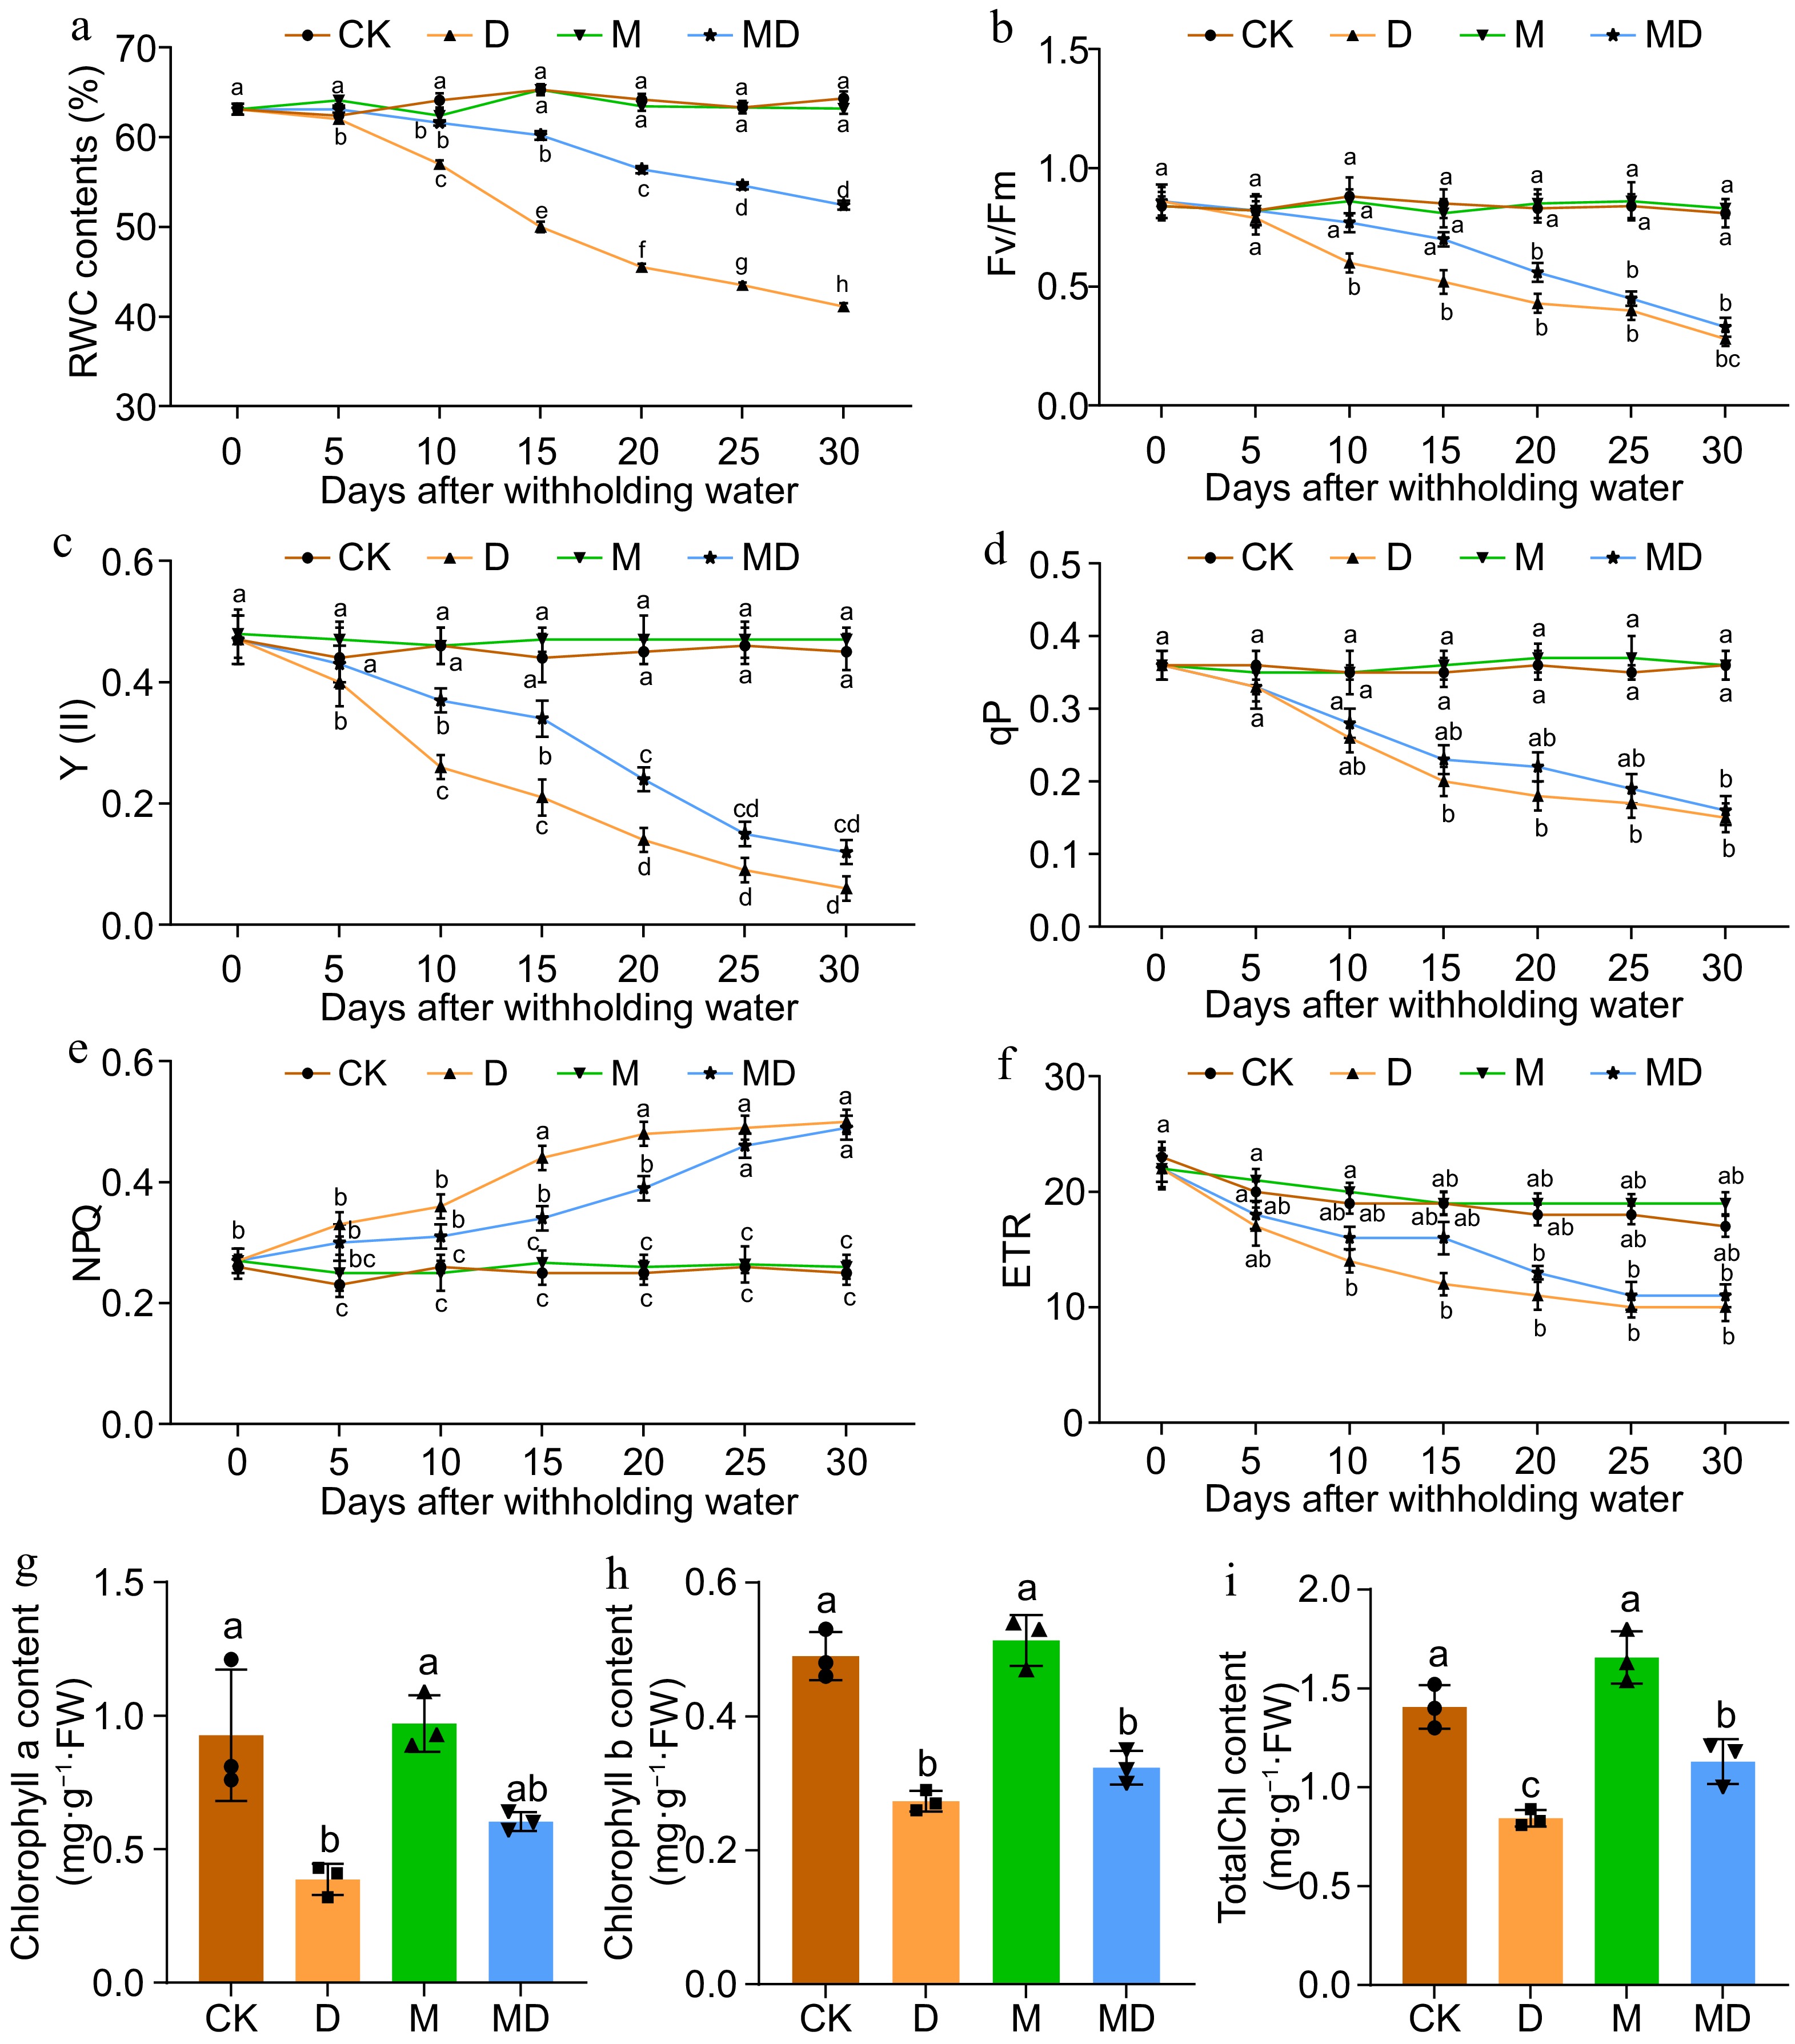
Figure 2.
This figure presents the impact of drought stress (D) and exogenous melatonin (M) treatment on photosynthetic efficiency and chlorophyll content in A.catechu seedlings. The experiment included four treatments: control (CK), melatonin (M), drought stress (D), and drought stress combined with melatonin (MD). The following parameters were measured: (a) relative water content (RWC), (b) maximum quantum yield of PSII photochemistry (Fv/Fm), (c) effective quantum yield of PSII photochemistry (Y(II)), (d) photochemical quenching (qP), (e) non-photochemical quenching (NPQ), (f) electron transport rate (ETR), (g) chlorophyll a content, (h) chlorophyll b content, and (i) total chlorophyll content. Each bar in the figure represents the mean ± standard deviation based on three biological replicates (n = 3). Statistically significant differences between treatments are denoted by different letters above the bars (p < 0.05), determined through Duncan's multiple range test. Treatment comparisons were performed using (a)−(f) two-way ANOVA, and (g)−(i) one-way ANOVA with a significance threshold of p < 0.05.
-
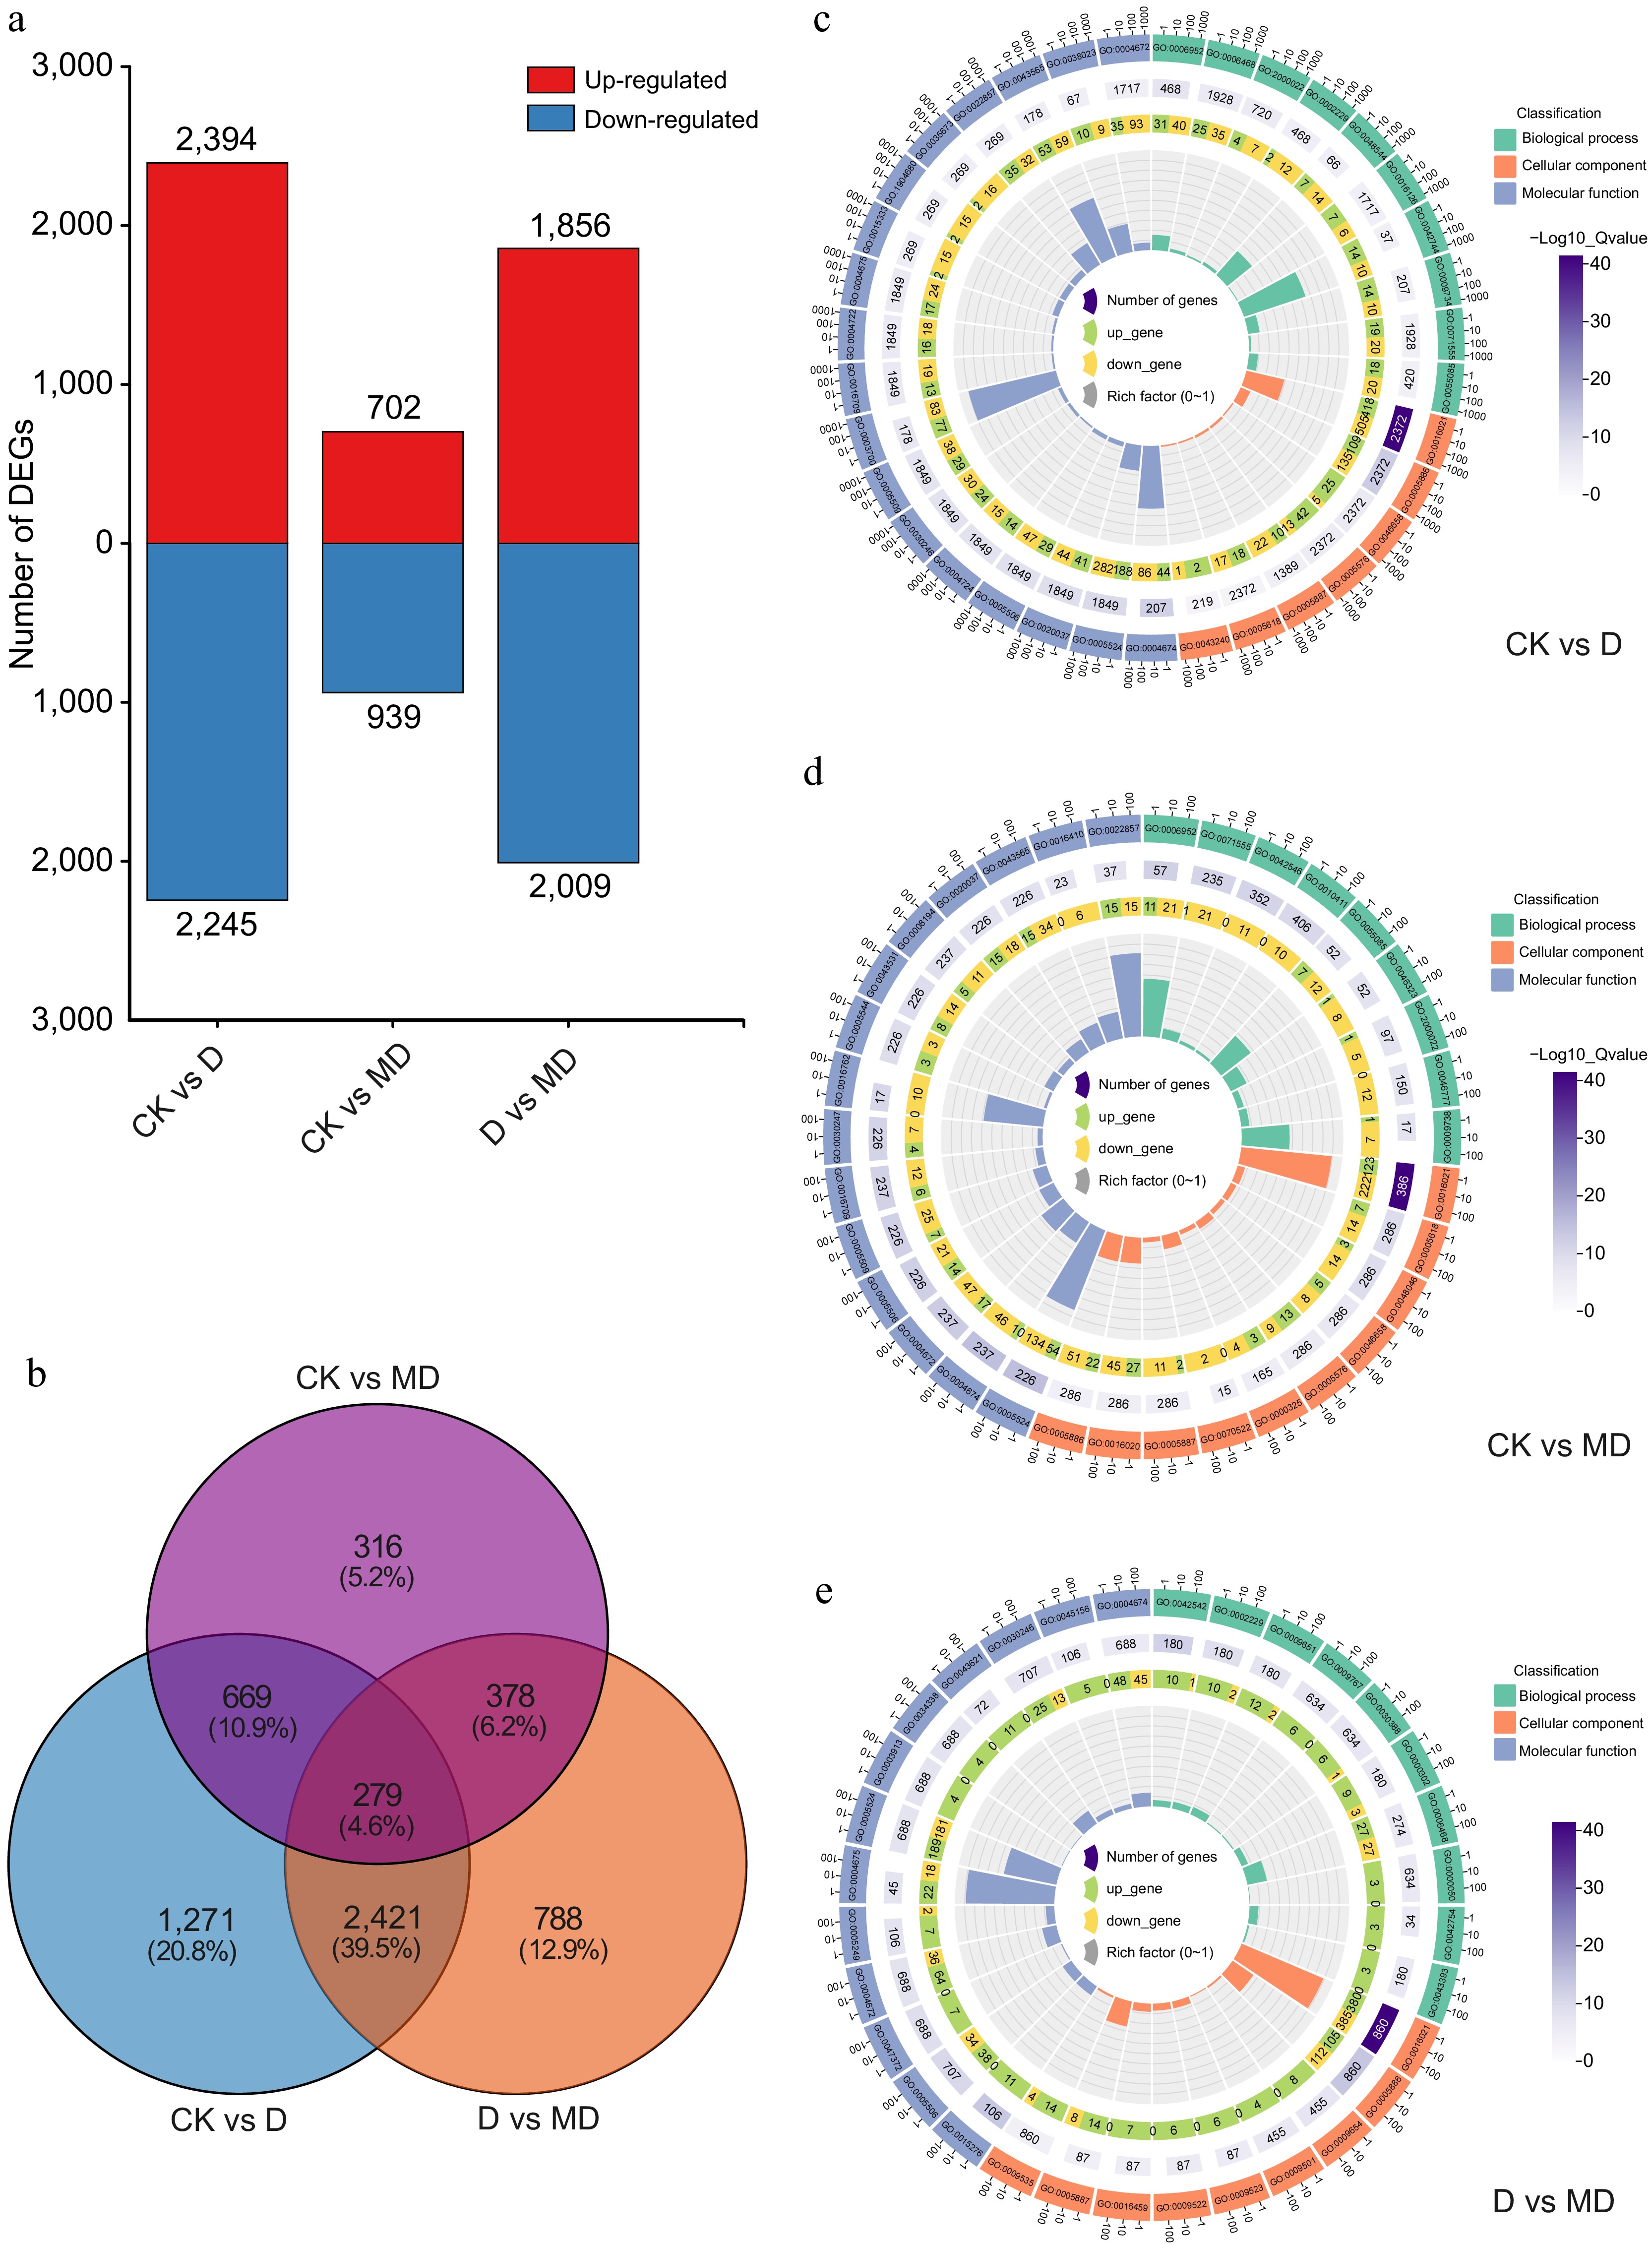
Figure 3.
Overview of differentially expressed genes (DEGs) and GO enrichment analysis in response to drought stresses and melatonin treatment in A. catechu. (a) Common DEGs under DS and melatonin treatment conditions. (b) Commonly expressed genes in a comparison Venn diagram. (c) - (e) Top GO term enriched DEGs analysis found via comparing the D vs MD, CK vs D, and CK vs D comparison.
-
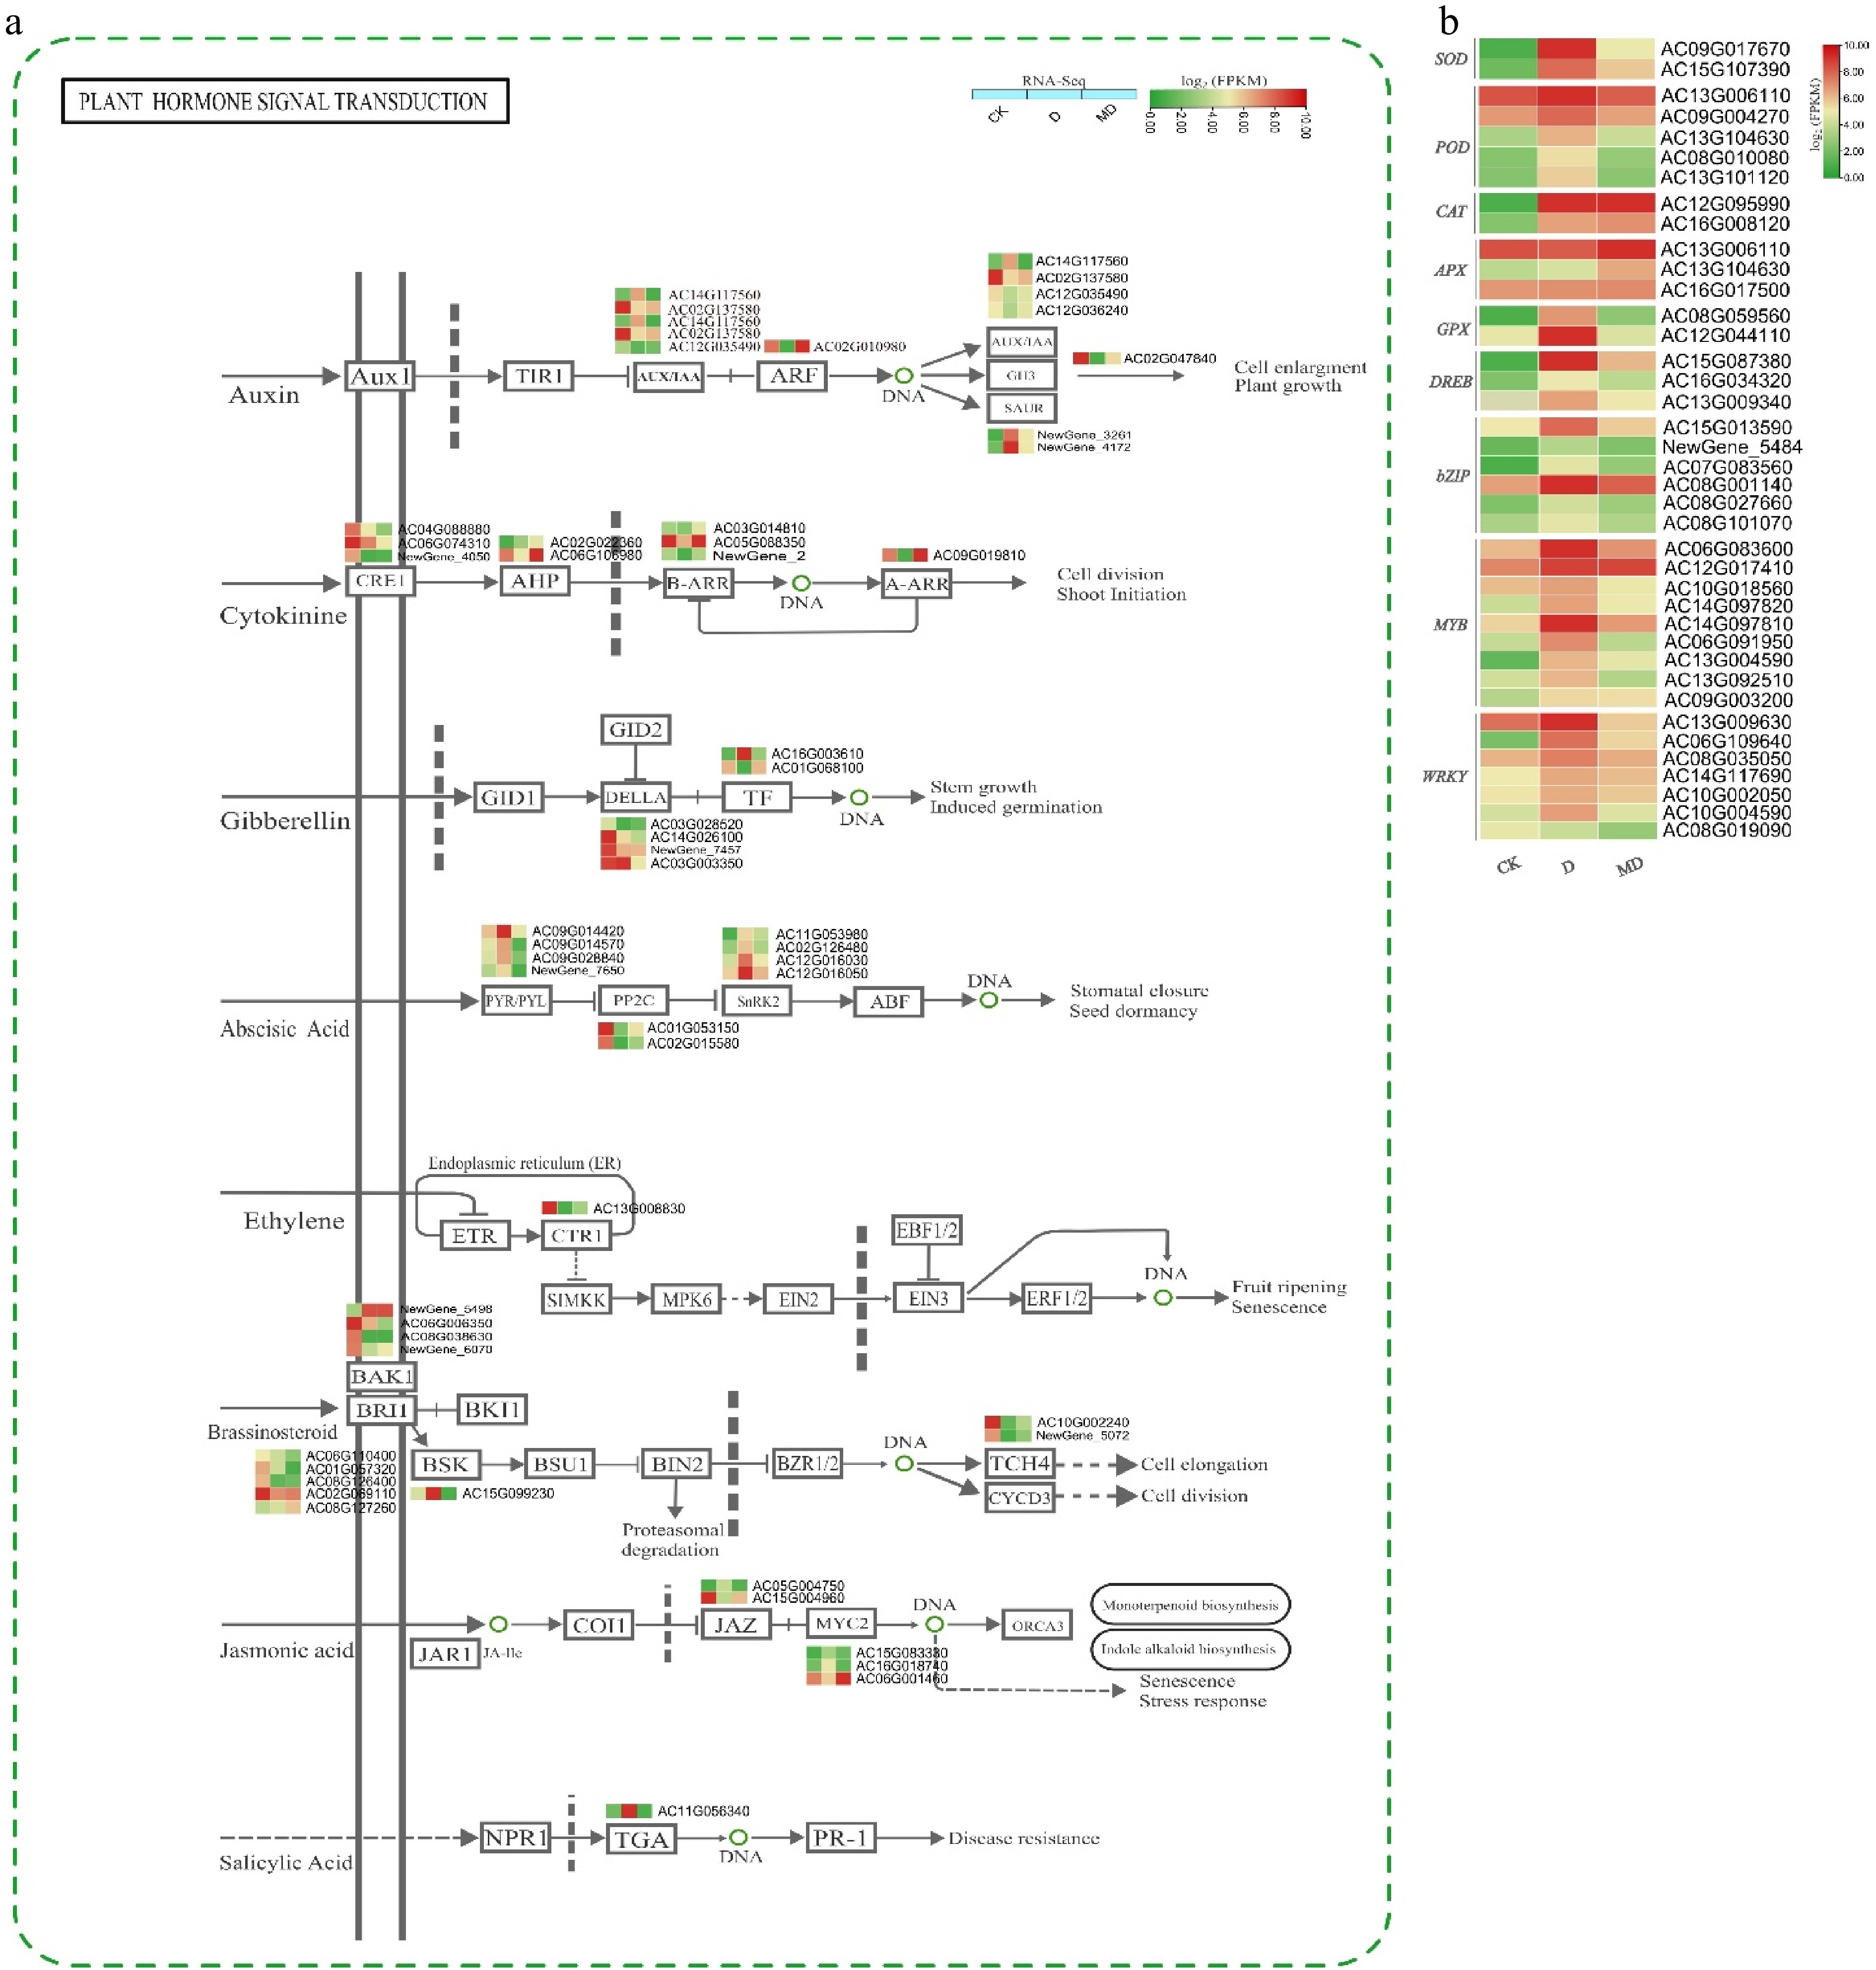
Figure 4.
Expression profiles of hormone signaling and ROS/TF DEGs in A. catechu during drought and melatonin treatment. (a) Key DEGs shaping hormonal signal transduction in A. catechu. (b) The heat map of DEGs related to ROS and TF. The heat map illustrates the fold change derived from log2FPKM values of DEGs. C, control; D, drought; MD, pre-melatonin + drought stress. The colors red and green indicate up-regulated and down-regulated genes, respectively. Values denote mean ± SE (n = 3). The figure adopted using KEGG online data base[29].
-

Figure 5.
Module trait weighted gene co-expression network analysis (WGCNA). (a) Eigengene adjacency heatmap for each module, illustrating the correlation among the modules. Each column denotes distinct processing conditions. Each row represents a unique gene of the module. The Pearson correlation coefficient describes the relationship between the two variables in each cell, with the p-value provided in parenthesis. The cell color spectrum varies from red, signifying a robust positive association, to blue, denoting a strong negative correlation. (b) Eigengenes modules hierarchical clustering dendrogram; Genes fit into one of six modules. The top image shows the sequence diagram. The colorful gene modules and their bases are shown at the bottom of the figure. (c) Hub-gene clustering network of MEturquoise module. (d) Hub-gene clustering network of MEmagenta. Genes in red are at the core and have strong interactions, whereas genes in orange are near the periphery.
-
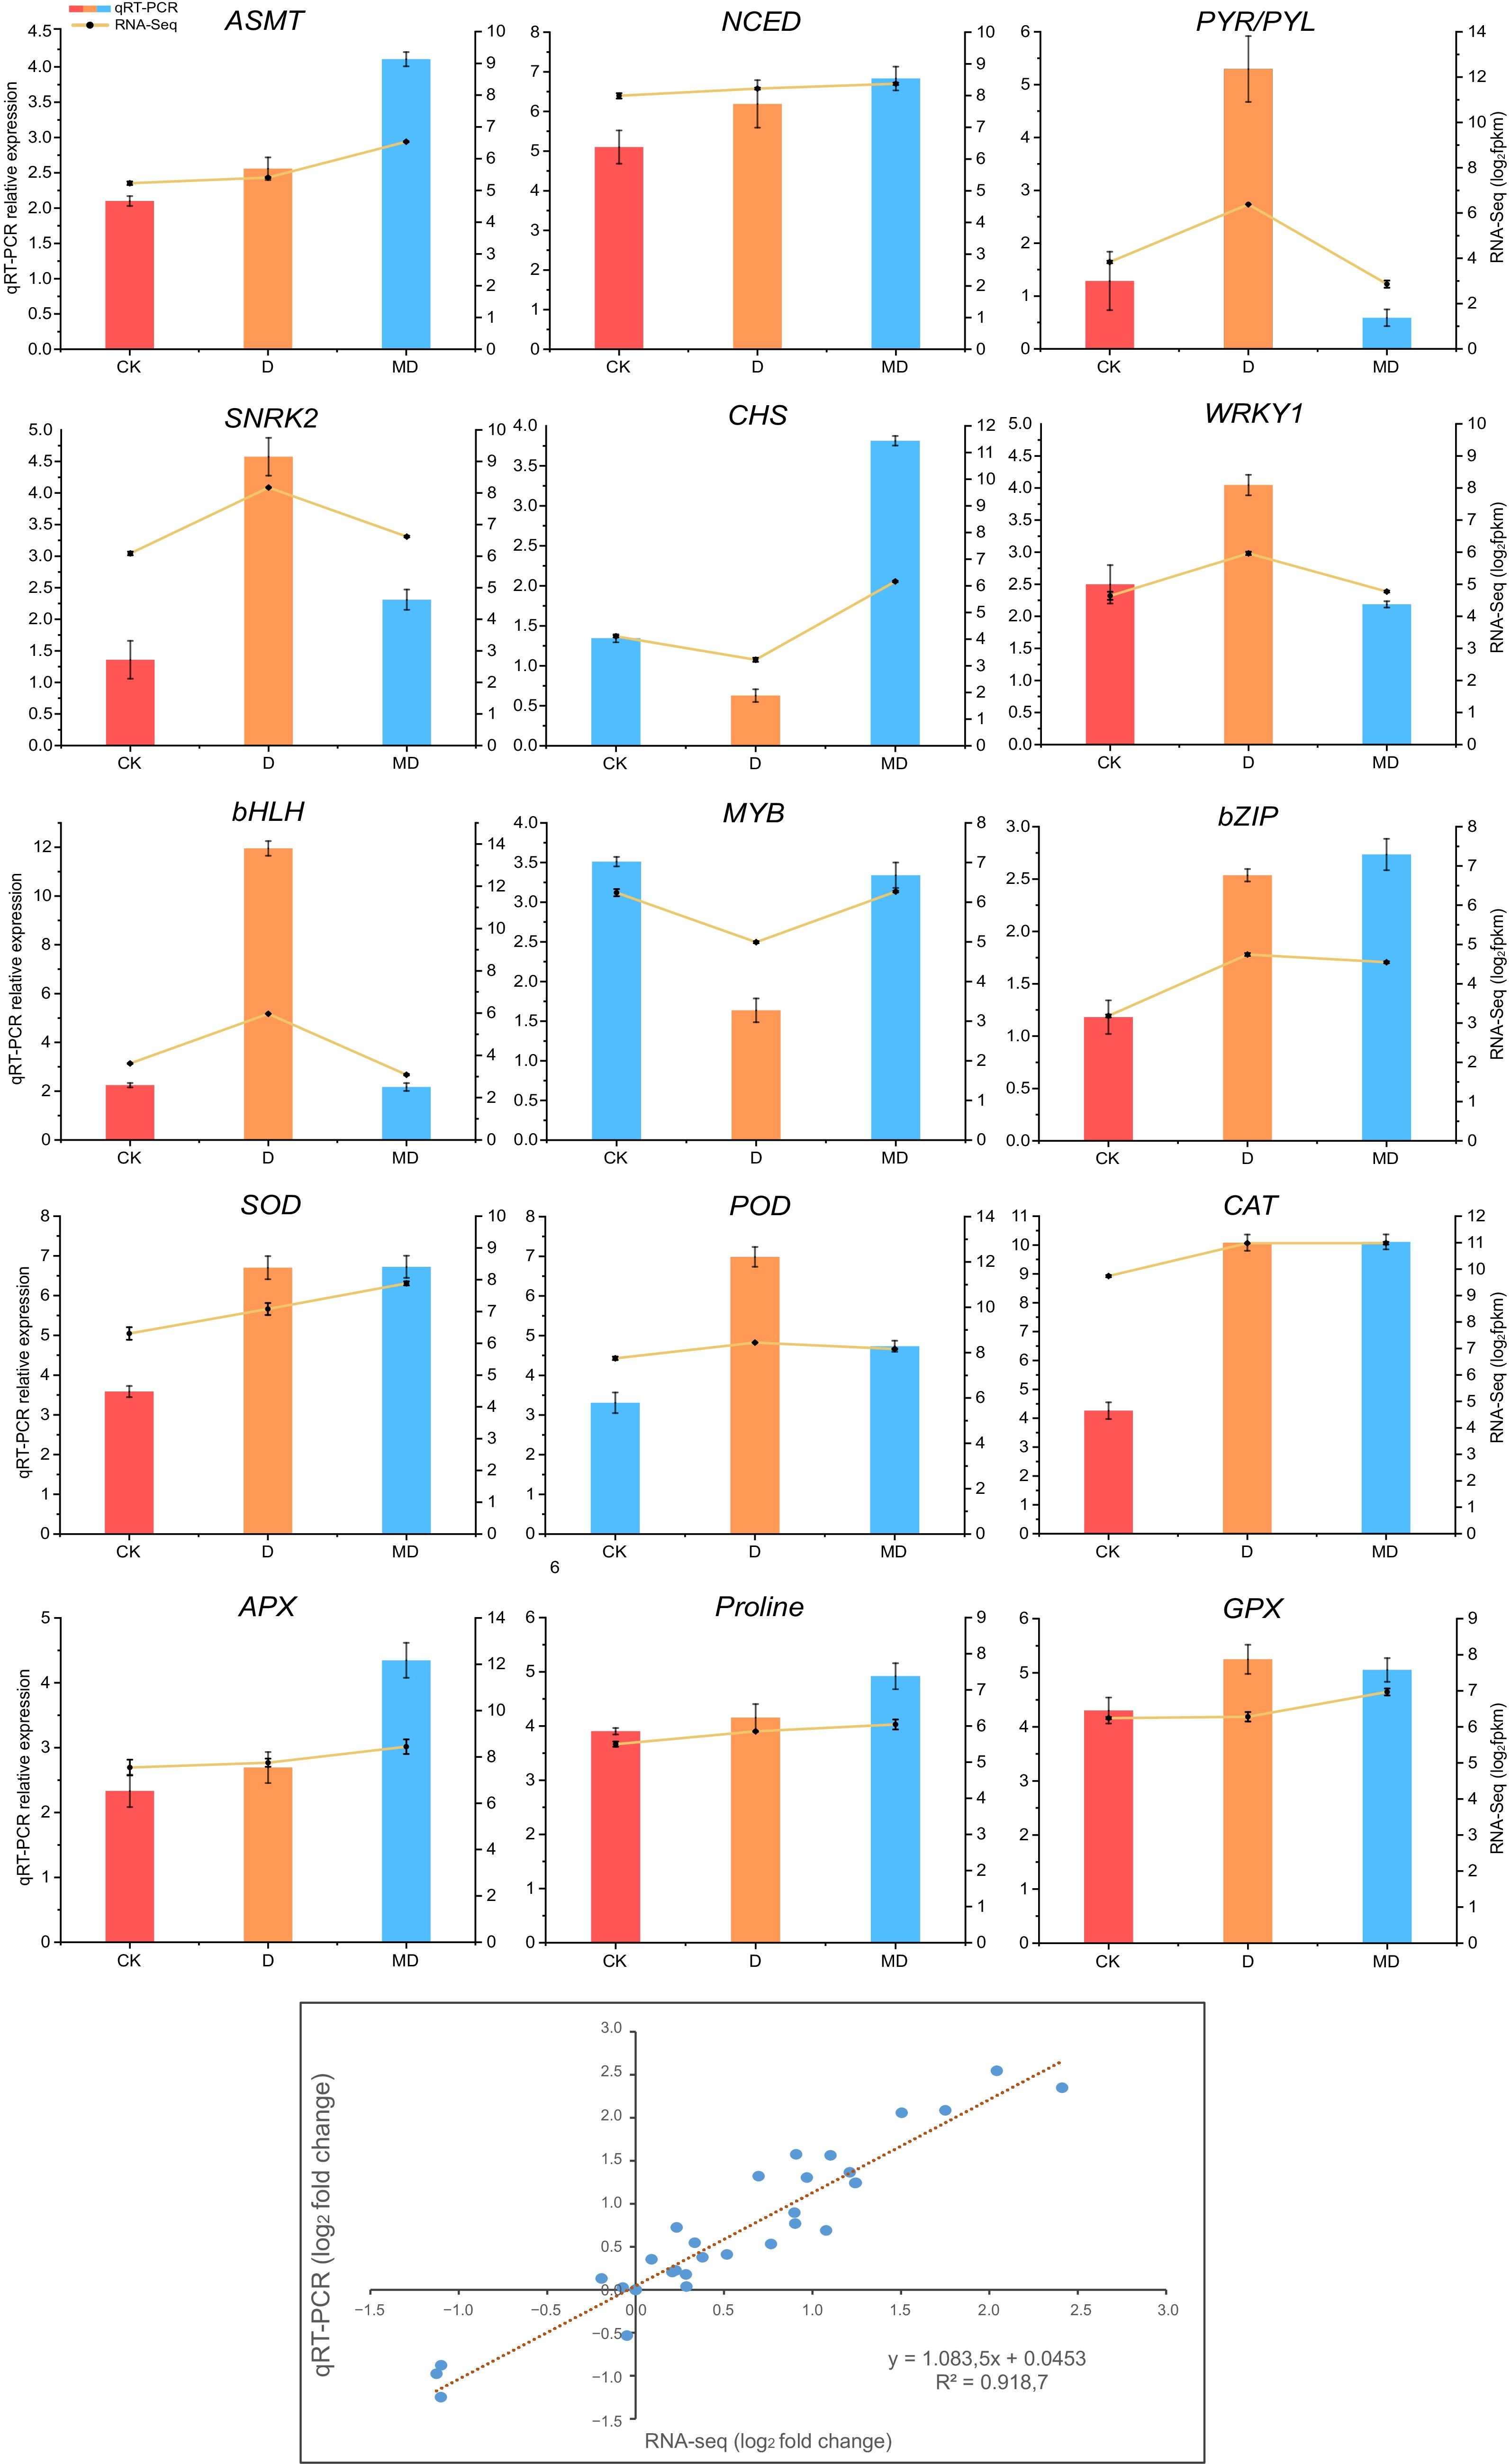
Figure 6.
Validation of differentially expressed genes associated with phytohormones, ROS, and transcription factors by RT-qPCR, followed by RNA-seq data. Analysis of correlation between RNA-seq and qRT-PCR methodologies. Log2 fold changes of RNA-seq data (x-axis) are displayed against log2 fold changes of qRT-PCR data (y-axis). The error bars represent the standard error of three biological replicates mean ± SE (n = 3). C, control; D, drought; MD, pre-melatonin + drought stress.
Figures
(6)
Tables
(0)