-
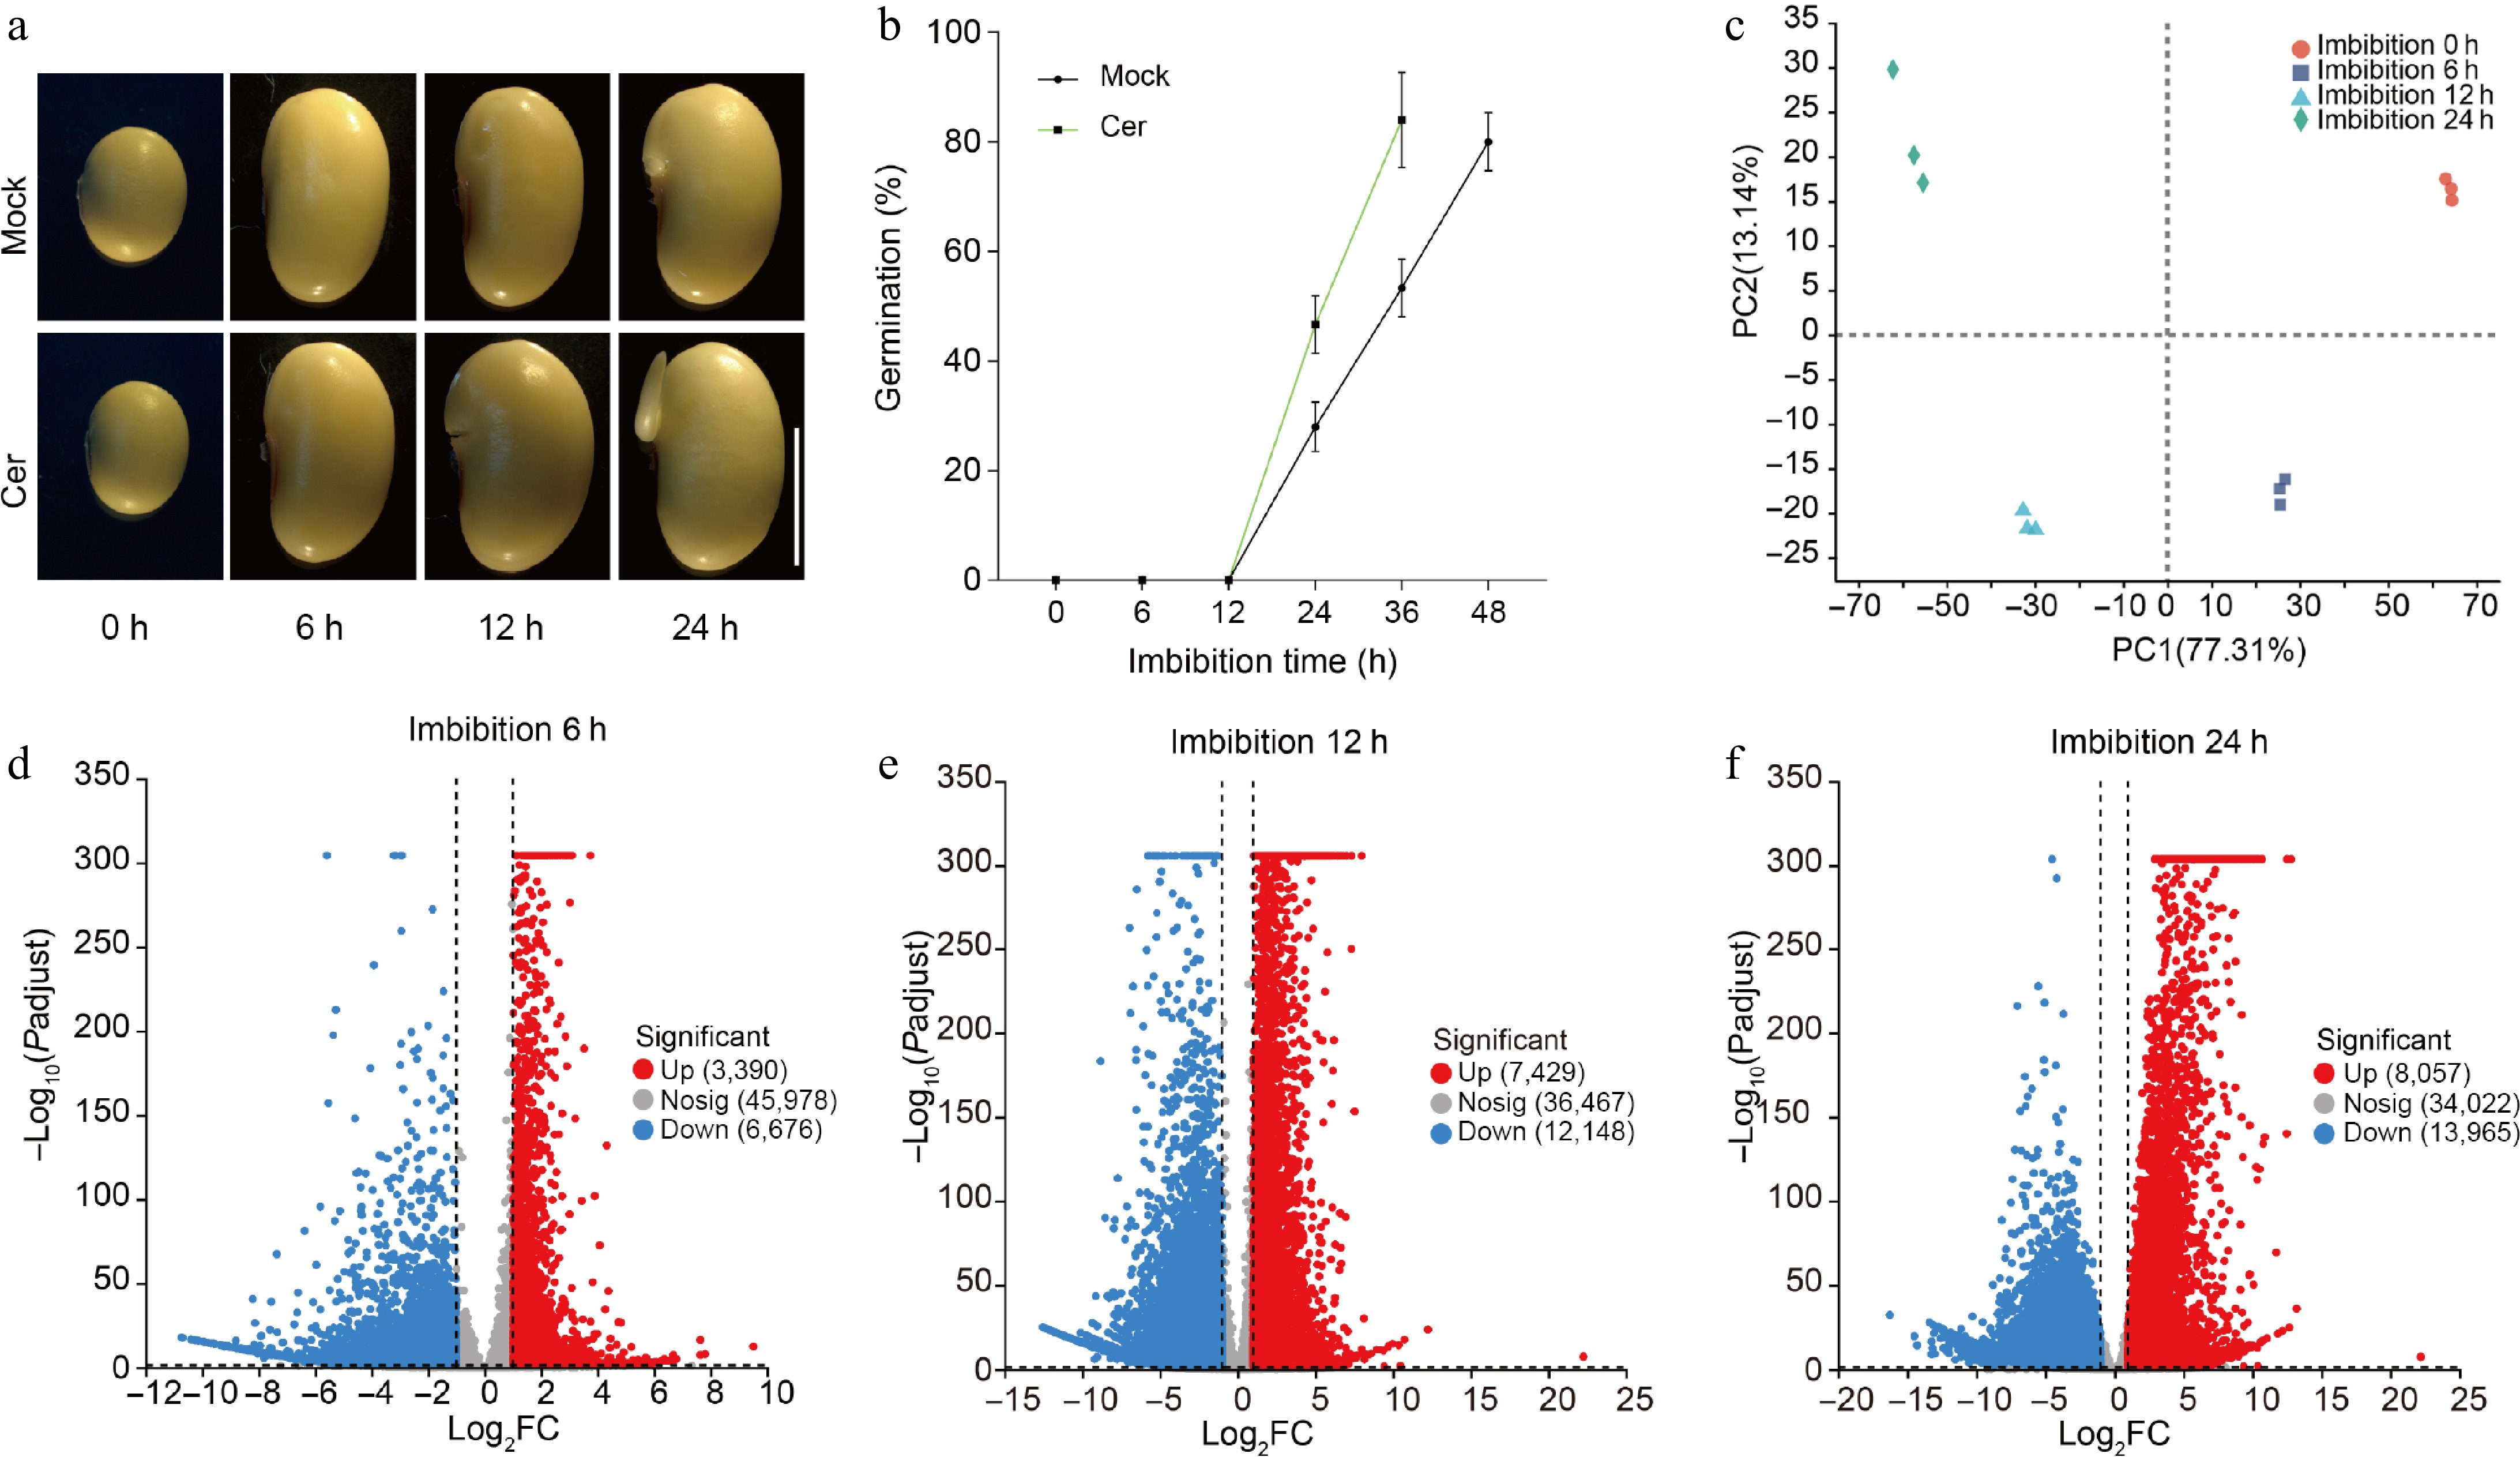
Figure 1.
Germination phenotypes of soybean seeds. (a) Time-course germination phenotypes of freshly harvest soybean seeds with or without C24 phytoceramide t18:0/24:0 (Cer) treatment. (b) Germination percentages of soybean seeds with or without C24 phytoceramide t18:0/24:0 (Cer) treatment. Germination test was repeated with five biological replicates, and 90 seeds were used for each replicate. Photos were taken as indicated. (c) Principal component analysis of the time-course RNA-Seq data. The volcano diagram of up- and down-regulated genes in germination seeds after (d) 6 h, (e) 12 h, and (f) 24 h imbibition.
-
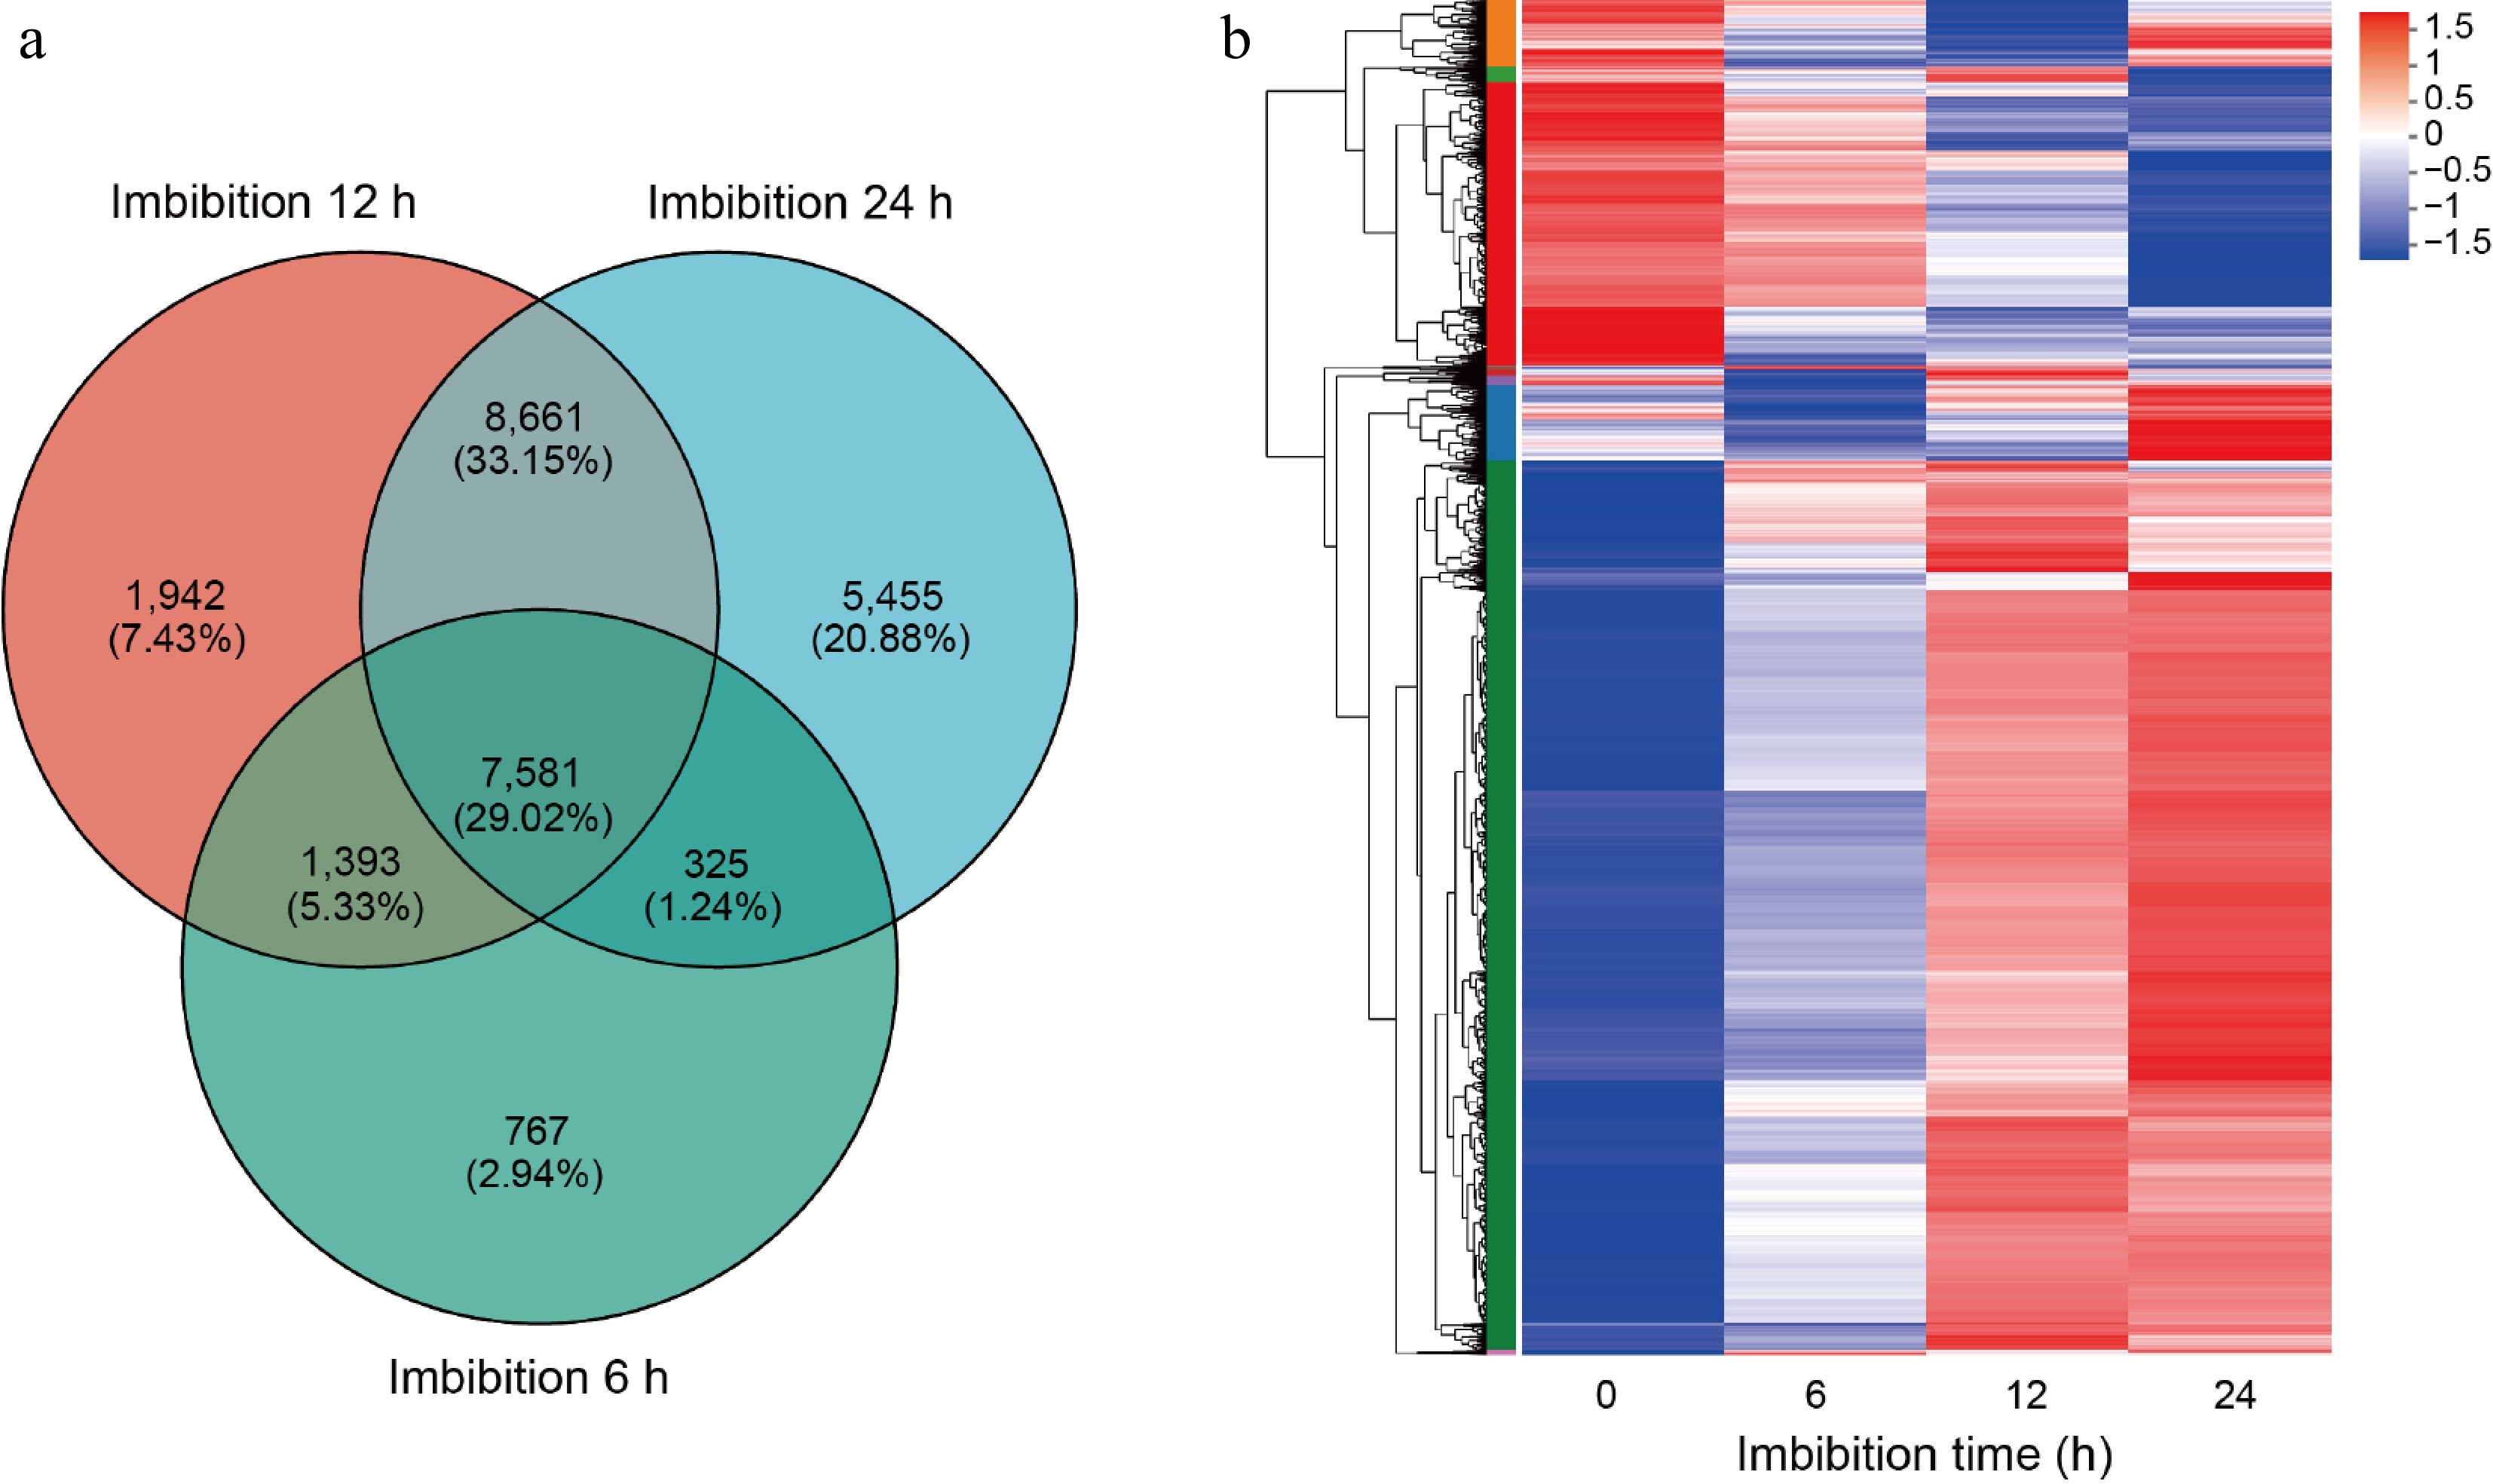
Figure 2.
Cluster analysis of differentially expressed genes. (a) Venn diagrams of differentially expressed genes (DEGs) in germination seeds after 6, 12, and 24 h imbibition. (b) Heat-map hierarchical clustering the common 7,581 DEGs identified in (a). Each column in the chart represents a sample, each row represents a gene, and the color in the chart represents the expression value of the gene after standardized treatment in each sample. Red represents the higher expression level of the gene in the sample, and blue represents the lower expression level. For the specific change trend of the expression level, please see the digital annotation under the color bar on the upper left. On the left are the tree diagrams of gene clusters and the module diagram of sub-clusters.
-
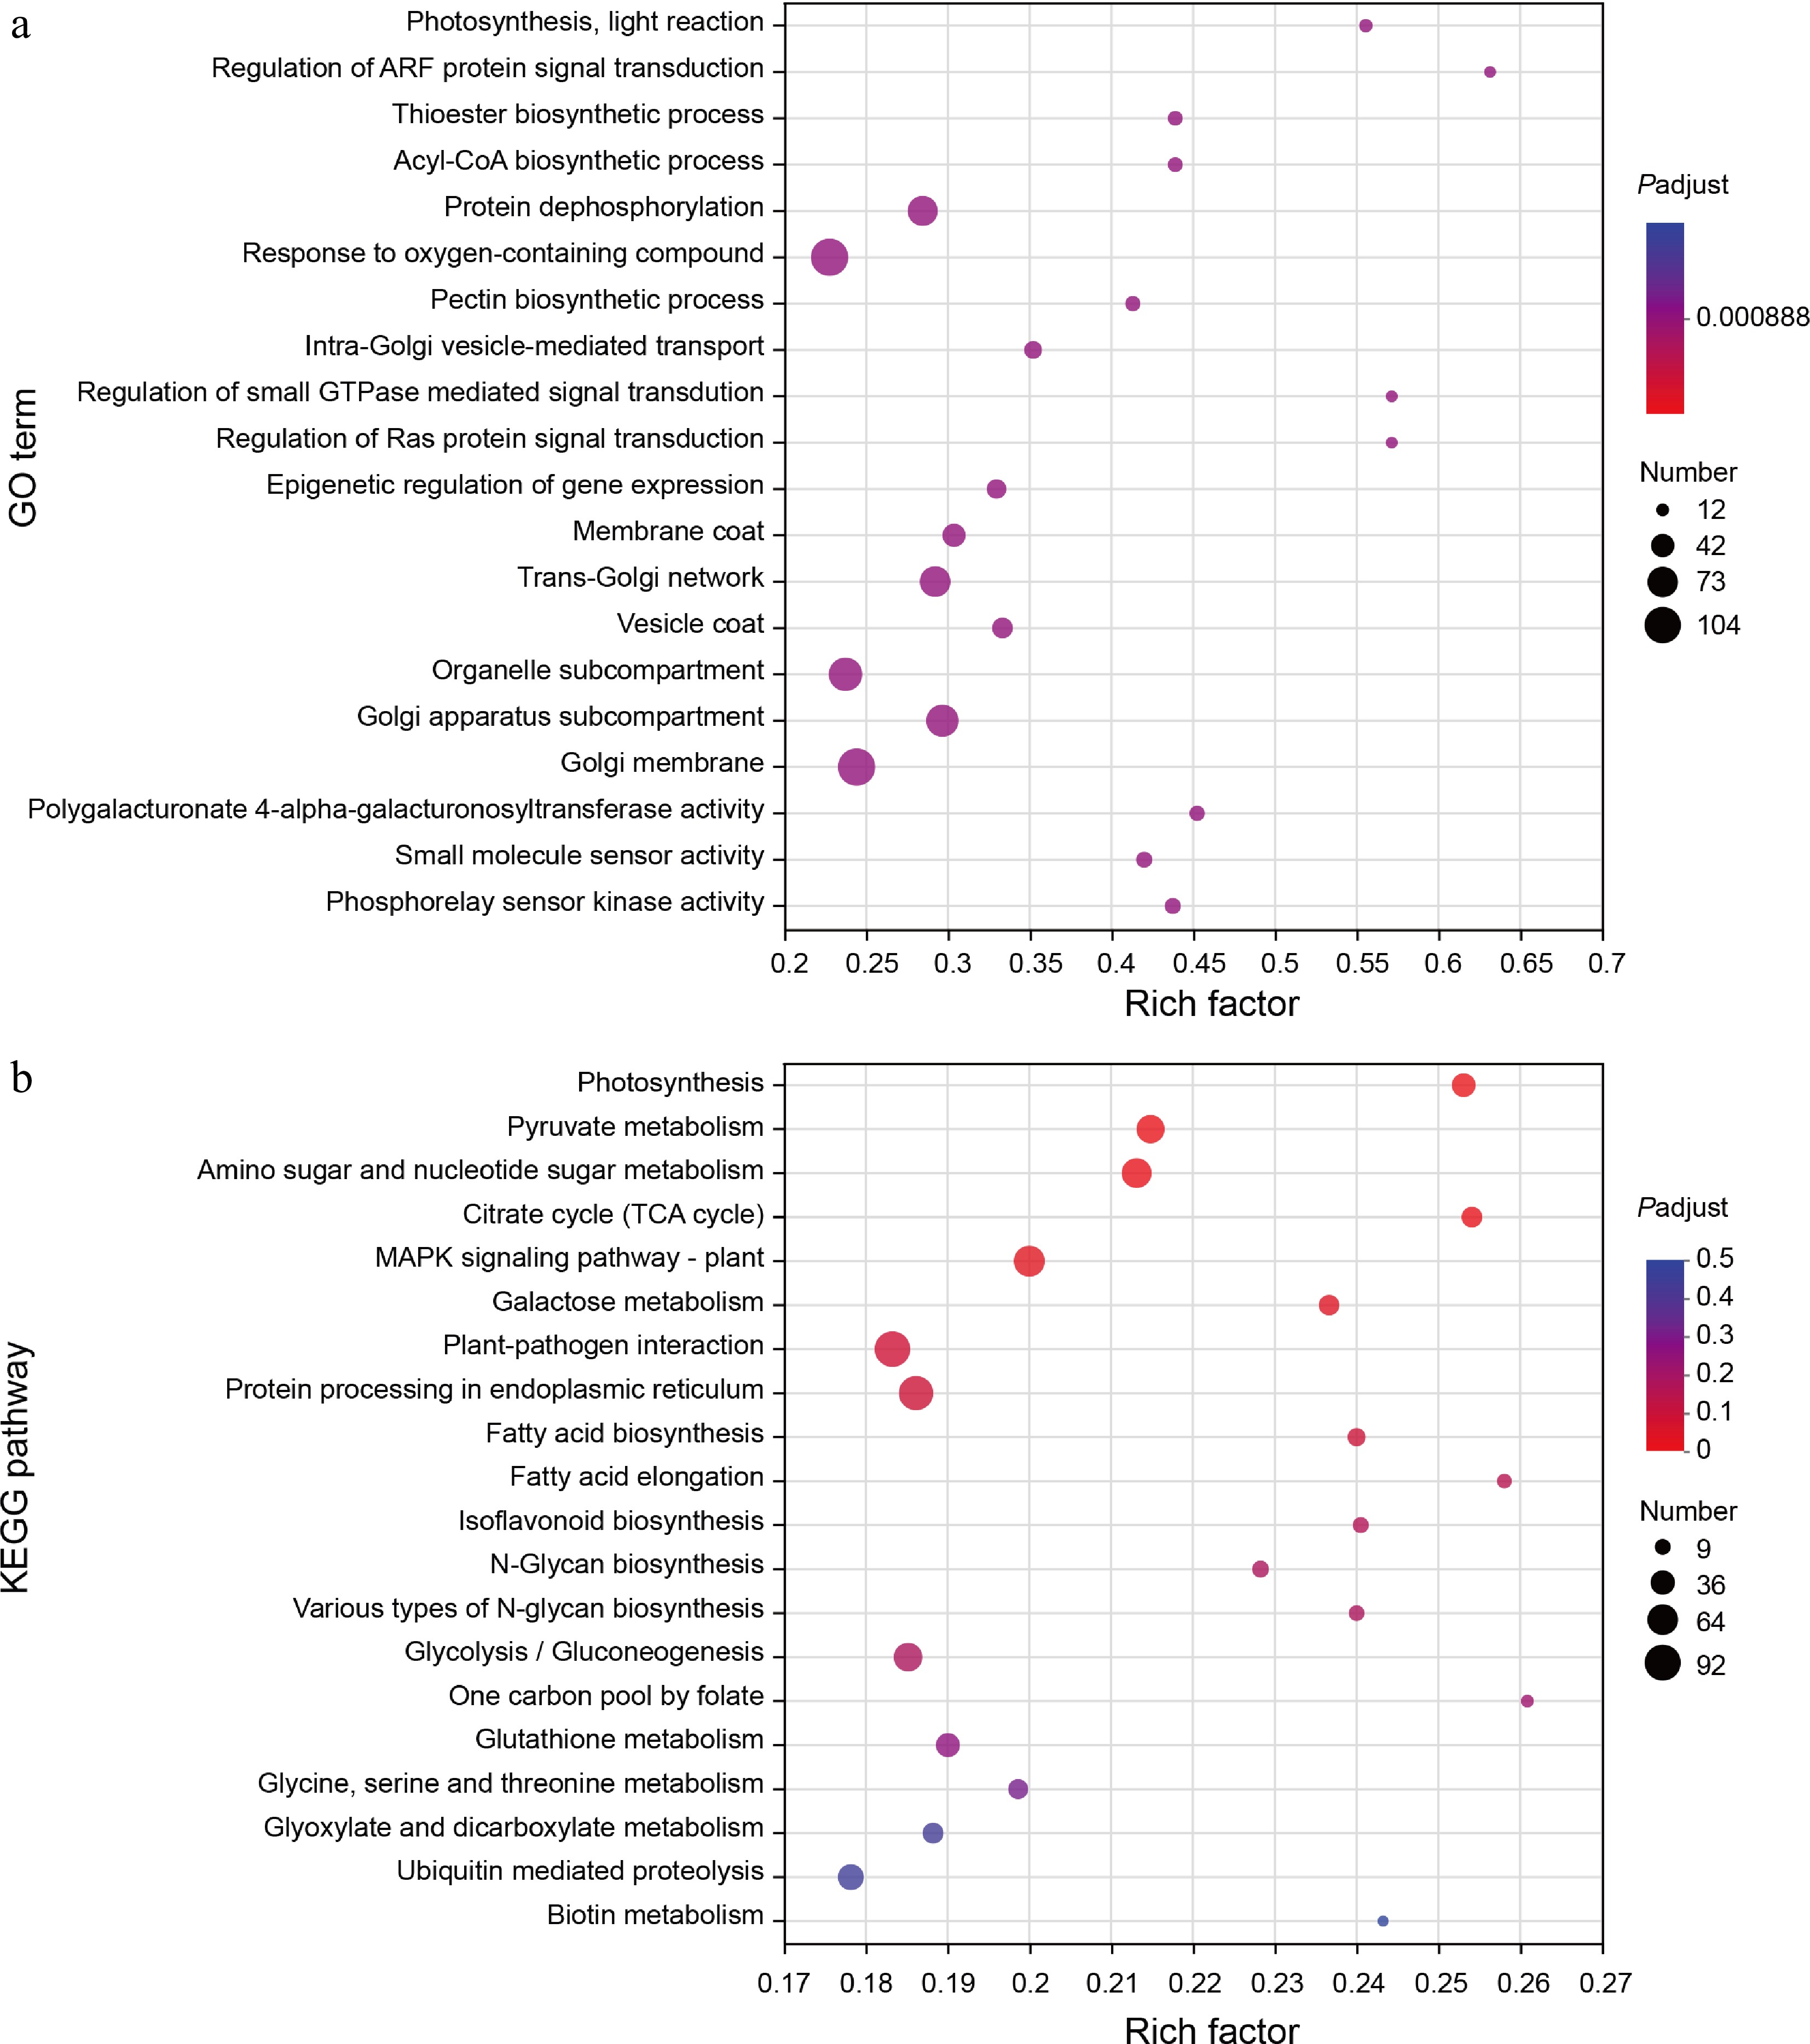
Figure 3.
GO and KEGG enrichment analysis of DEGs. (a) The scatter plot shows detailed descriptions of the pathway within the top 20 GO enrichment analysis of the common DEGs. GO, gene ontology. (b) The scatter plot shows detailed descriptions of the pathway within the top 20 KEGG enrichment analysis of the common DEGs. KEGG, Kyoto Encyclopedia of Genes and Genomes. Analyses of the GO and KEGG enrichments were based on the condition (log2FC > 1, FDR < 0.05). The vertical axis represents the GO term or KEGG pathway, and the horizontal axis represents the ratio of the Rich factor (sample number of genes enriched in the GO term or KEGG pathway) to the annotated gene number. The larger the Rich factor, the greater the degree of enrichment, the size of the dots indicates the number of genes in this GO term or KEGG pathway, and the color of the dots corresponds to different padjust ranges.
-
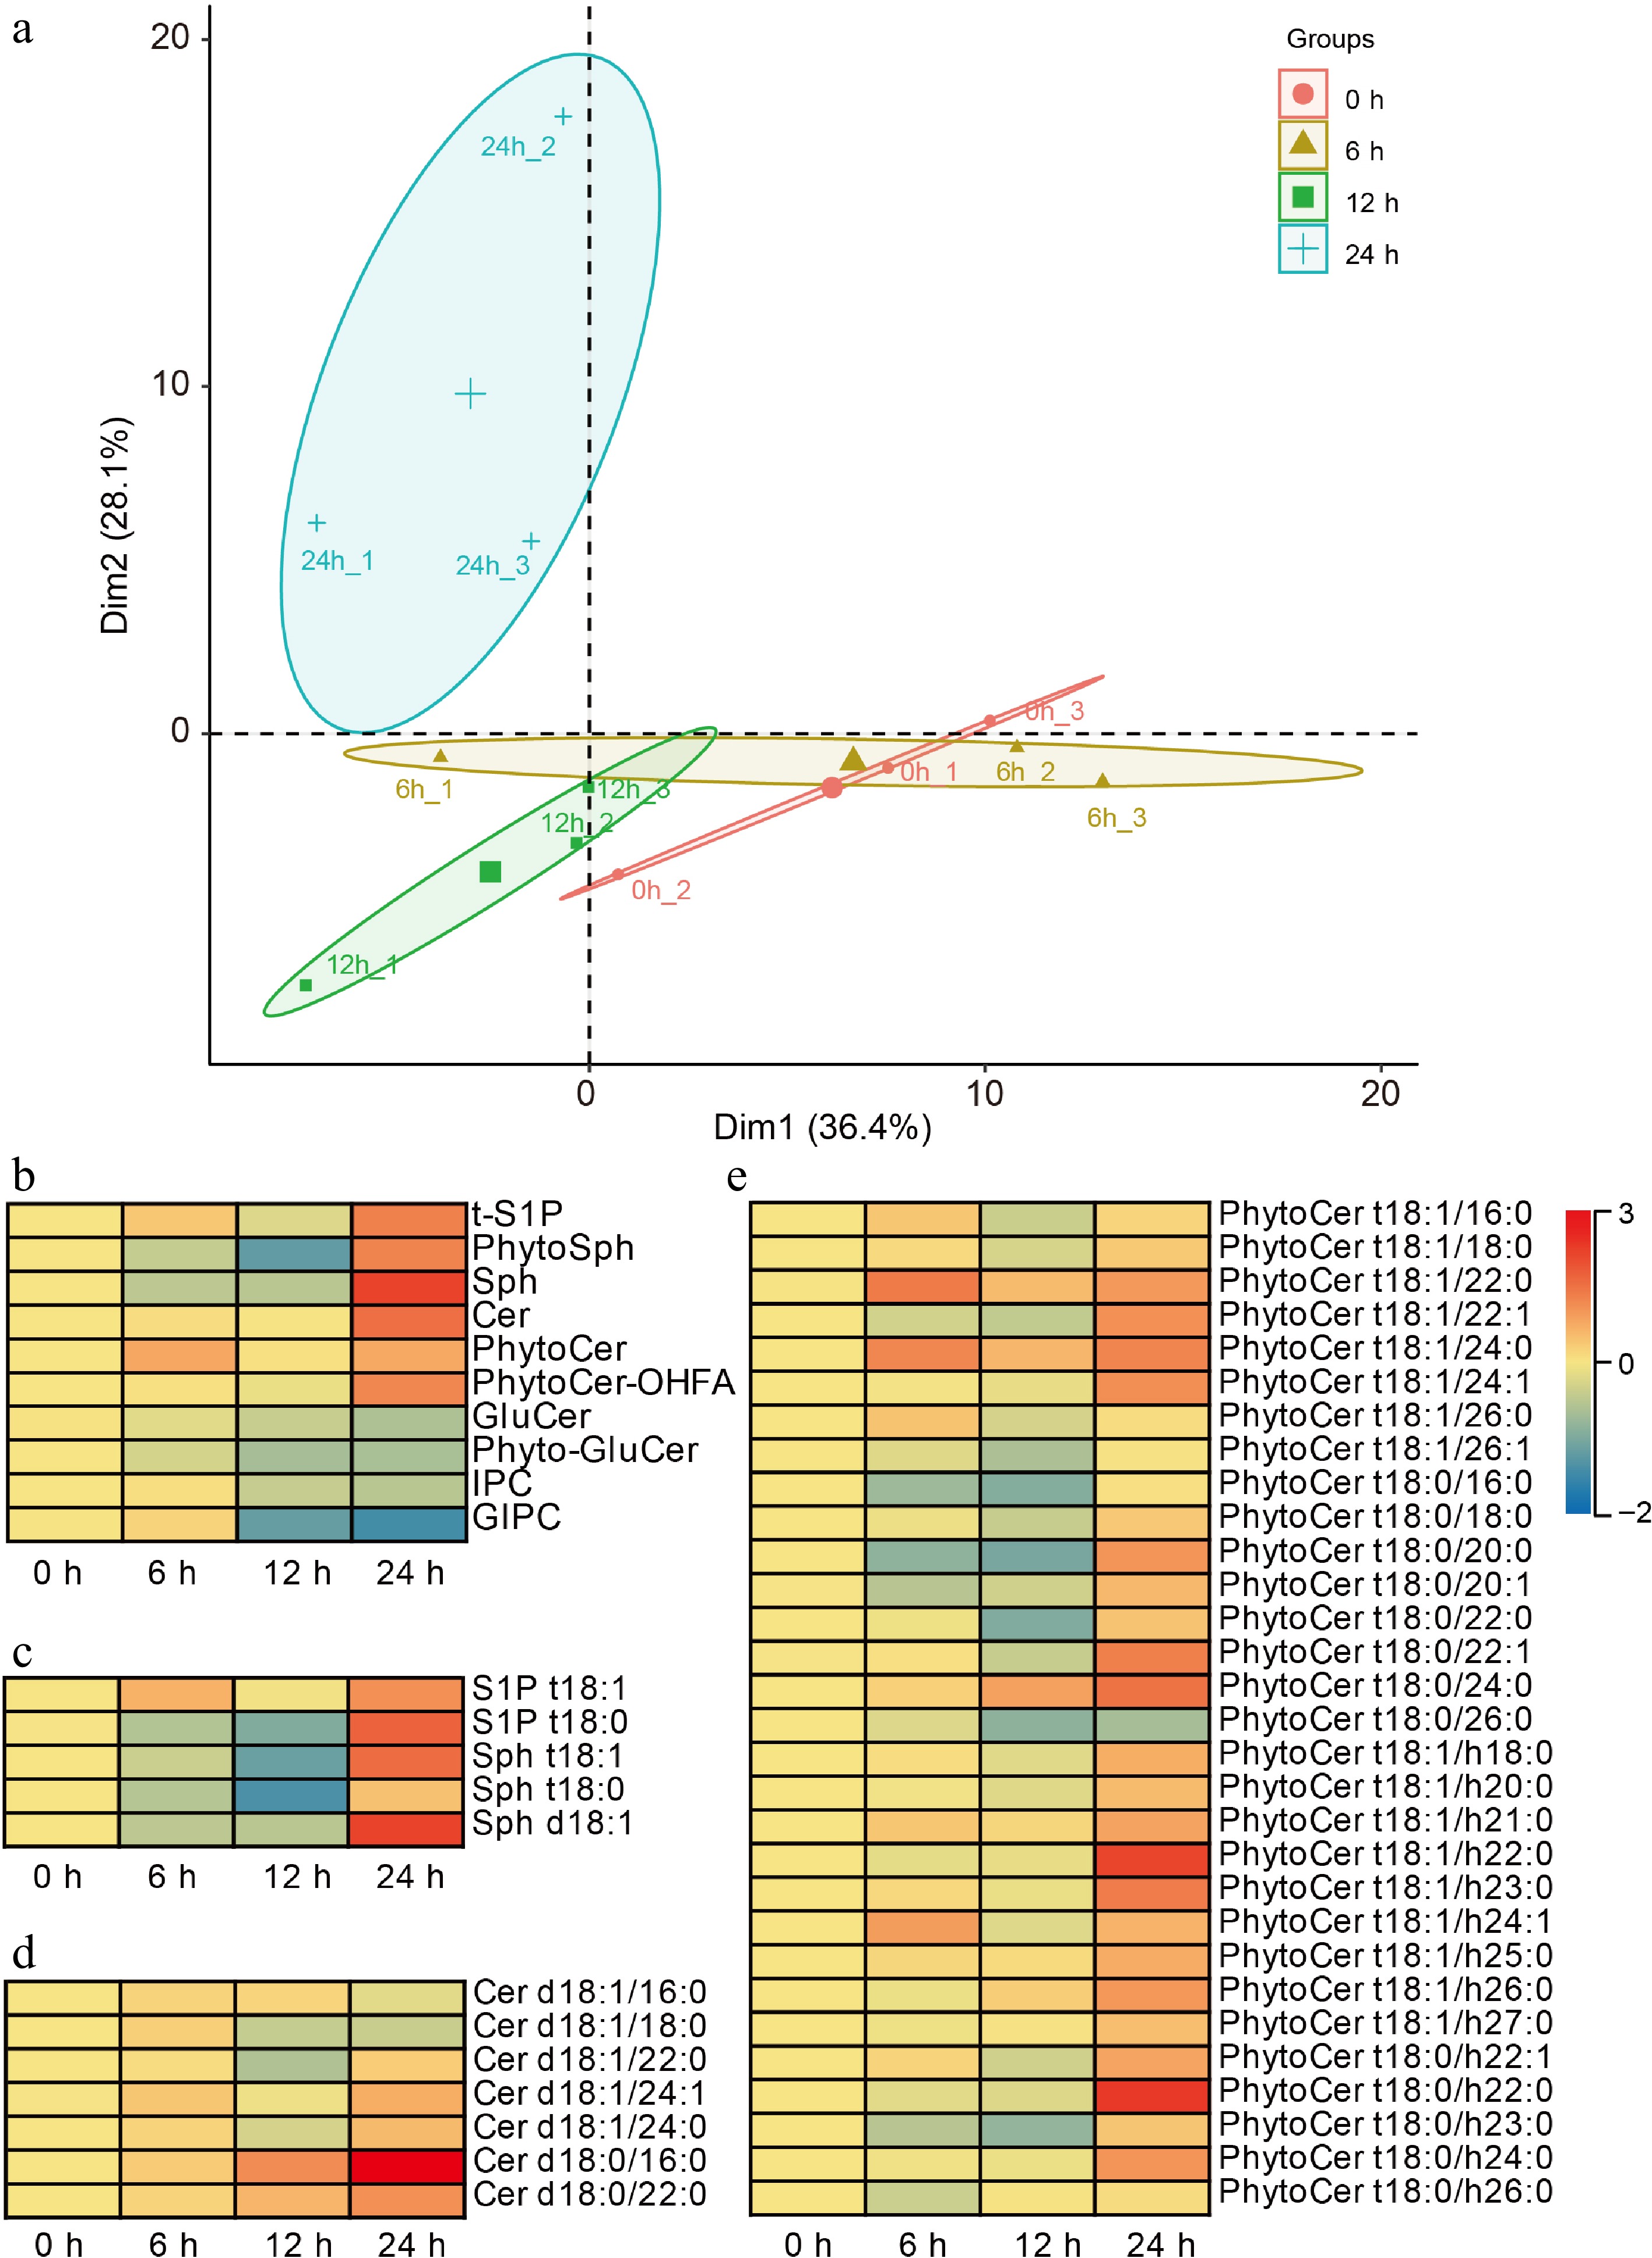
Figure 4.
Sphingolipidomics analysis during soybean seed germination. (a) Principal component analysis of the time-course sphingolipidomics data. (b) Heat-map indicated the amounts of ten-species sphingolipids during soybean seed germination. tS1P, phytosphingosine-1-phosphate; PhytoSph, phytosphingosines; Sph, sphingosines; Cer, ceramides, PhytoCer, phytoceramides; PhytoCer-OHFA, phytoceramides with hydroxylated fatty acyls; GluCer, glucosylceramides; Phyto-GluCer, phyto-glucosylceramides; IPC, inositol phosphorylceramide; and GIPC, glycosyl inositol phosphorylceramide. (c), (d) Heat-maps indicate the amounts of each detected molecules in the ten species. The scale on the right represents the amounts of indicated sphingolipids, and the higher the value, the higher the contents. 'd18:0' and 't18:0' indicates that the long-chain bases (LCB) of sphingolipids has two hydroxyl groups and 18 carbon atoms and no double bonds, or three hydroxyl groups and 18 carbon atoms and no double bonds, respectively. '16:0' and 'h16:0' indicates that the long-chain fatty acid (LCFA) of sphingolipids has 16 to 26 carbon atoms and no double bonds, or is hydroxylated fatty acyls and has 16 to 26 carbon atoms and no double bonds, respectively. Each analysis was repeated with three biological replicates. Heat-maps were generated by applying a base 2 logarithmic transformation to the original dataset.
-
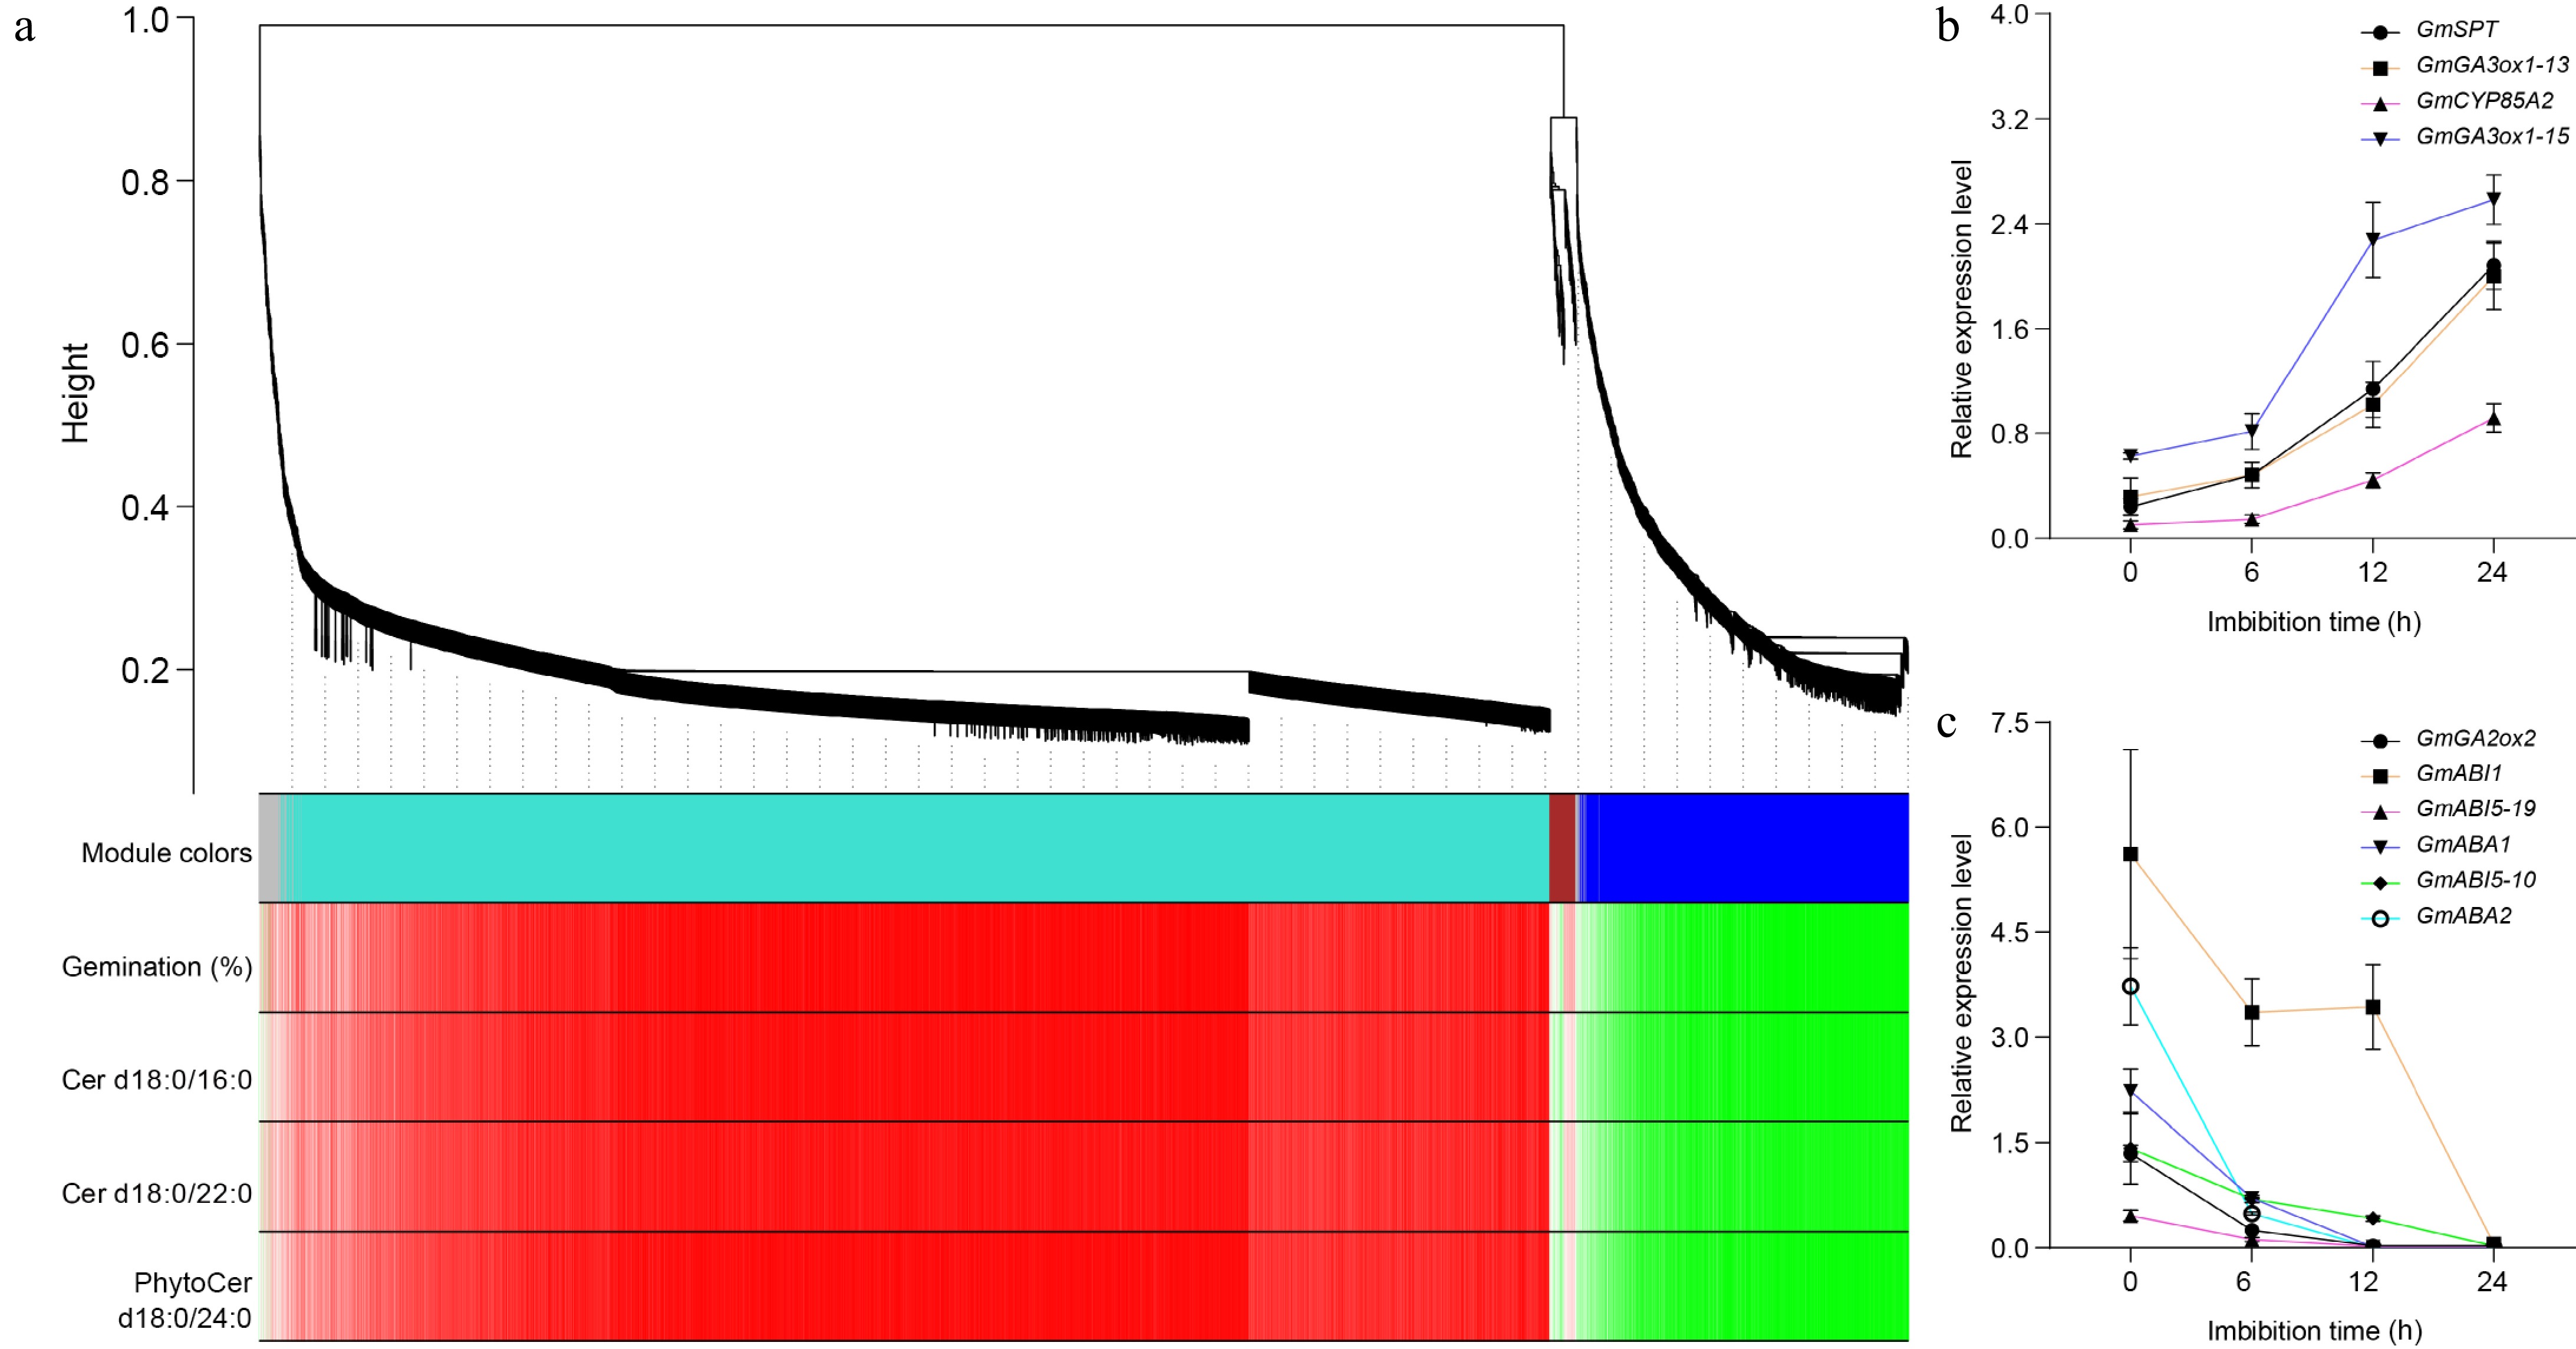
Figure 5.
Weighted gene co-expression network analysis of DEGs. (a) Hierarchical cluster tree showing co-expression modules identified by WGCNA during soybean seed germination. Each leaf in the tree represents one gene. The major tree branches constitute four modules, labeled with different colors, including gray, turquoise, brown, and blue. Red color represents the positive correlation between genes and traits; Green color represents the negative relationships between genes and traits. Traits including germination percentages, the amounts of Cer d18:0/16:0, Cer d18:0/22:0, and PhytoCer d18:0/24:0. (b) The expression of turquoise module genes during seed germination detected by Quantitative real-time PCR. (c) The expression of blue module genes during seed germination detected by Quantitative real-time PCR. GmGA3ox1-13 indicates the GmGA3ox1 gene is on chromosome 13, and so on. GmActin11 was used as an internal control. Each analysis was repeated with three biological replicates for Quantitative real-time PCR. Error bar, ± SEM.
-
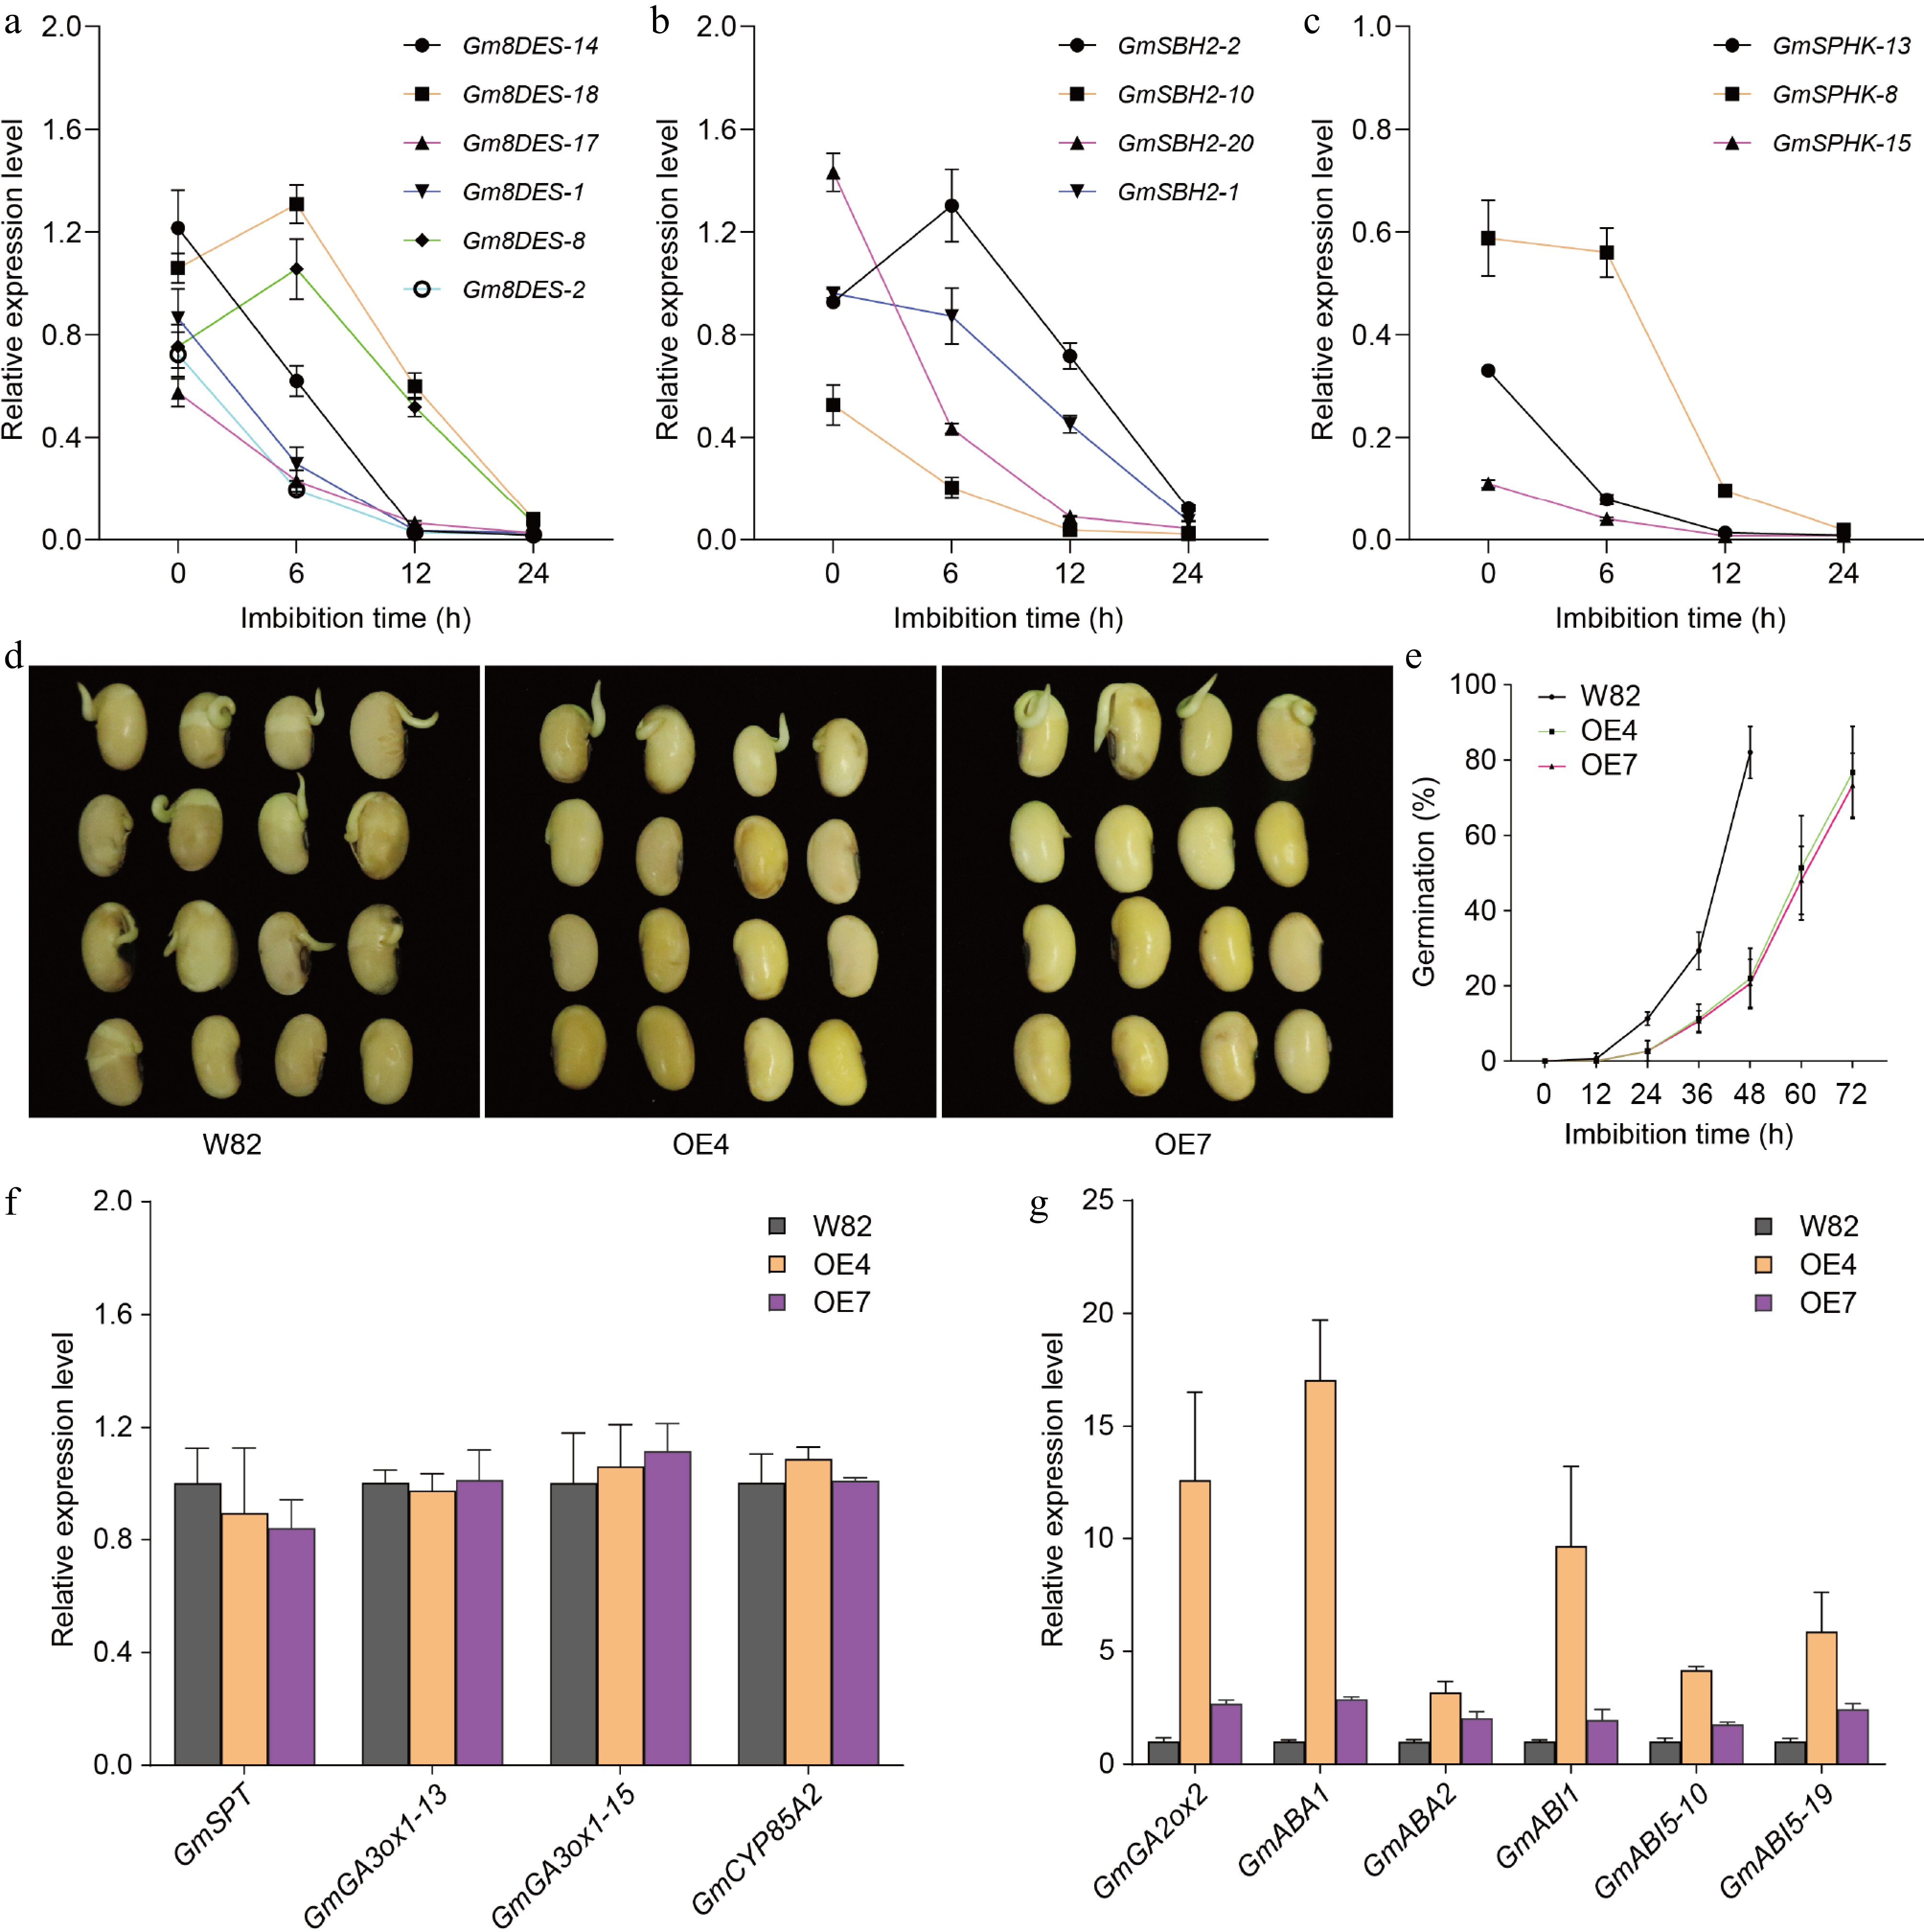
Figure 6.
The expression levels of sphingolipid biosynthetic genes. (a) The expression of Gm8DES genes during seed germination detected by Quantitative real-time PCR. (b) The expression of GmSBH2 genes during seed germination detected by Quantitative real-time PCR. (c) The expression of GmSPHK genes during seed germination detected by Quantitative real-time PCR. Gm8DES-14 indicates the Gm8DES gene is on chromosome 14. GmActin11 was used as an internal control. Each analysis was repeated with three biological replicates for Quantitative real-time PCR. Error bar, ± SEM. (d) Germination performance of freshly harvest seeds of GmSLD1 overexpression lines after 48 h imbibition. (e) Time-course germination percentage of GmSLD1 overexpression lines. Each analysis was repeated with four biological replicates. Error bar, ± SEM. (f) The expression of turquoise module genes in GmSLD1 overexpression lines detected by Quantitative real-time PCR. (g) The expression of blue module genes in GmSLD1 overexpression lines detected by Quantitative real-time PCR. GmGA3ox1-13 indicates the GmGA3ox1 gene is on chromosome 13, and so on. GmActin11 was used as an internal control. Each analysis was repeated with three biological replicates for Quantitative real-time PCR. Error bar, ± SEM.
-
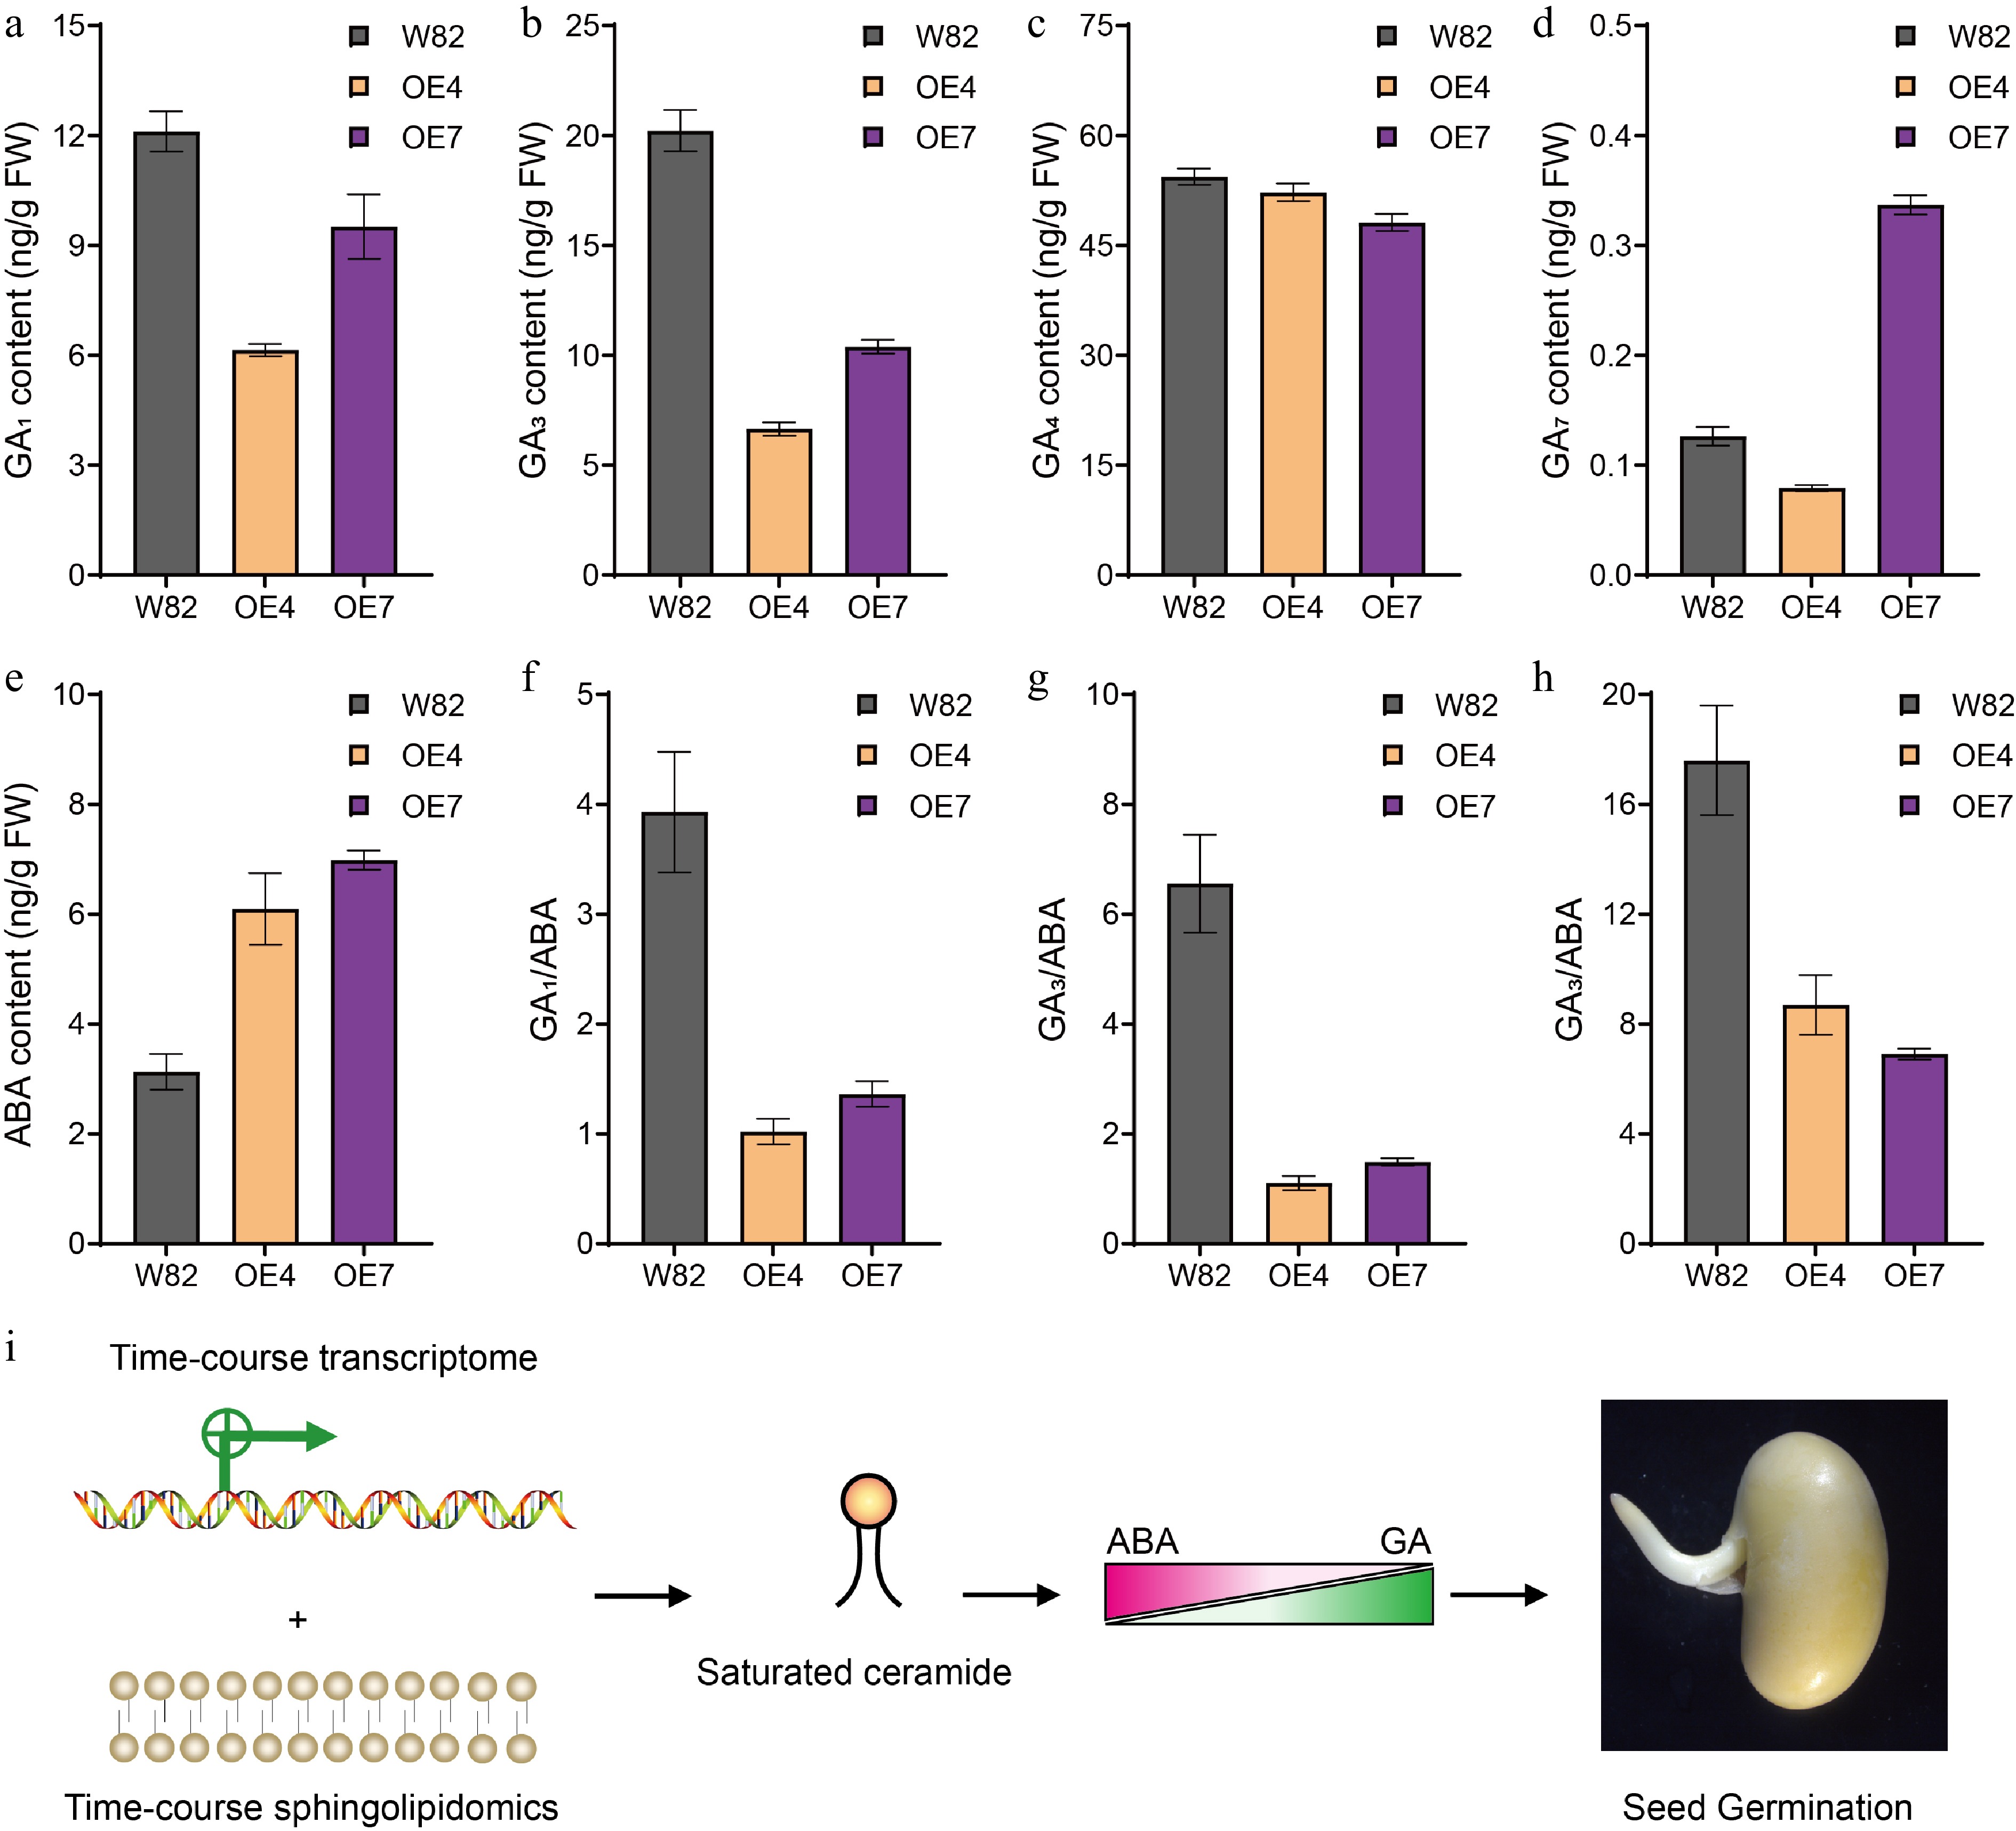
Figure 7.
The GA and ABA contents in seeds of GmSLD1 overexpression lines. The content of (a) GA1, (b) GA3, (c) GA4, and (d) GA7, in seeds of GmSLD1 overexpression lines. (e) The content of ABA in seeds of GmSLD1 overexpression lines. The (f) GA1/ABA, (g) GA3/ABA, and (h) GA4/ABA in seeds of GmSLD1 overexpression lines. Each analysis was repeated with three biological replicates. Error bar, ± SEM. (i) Through the integration of time-course transcriptomic and sphingolipidomic analyses of germinated soybean seeds, we found that saturated ceramides promoted seed germination in soybean. Furthermore, our genetic evidence demonstrated that this promotion was mediated by modulating the GA/ABA ratio within seeds.
Figures
(7)
Tables
(0)