-
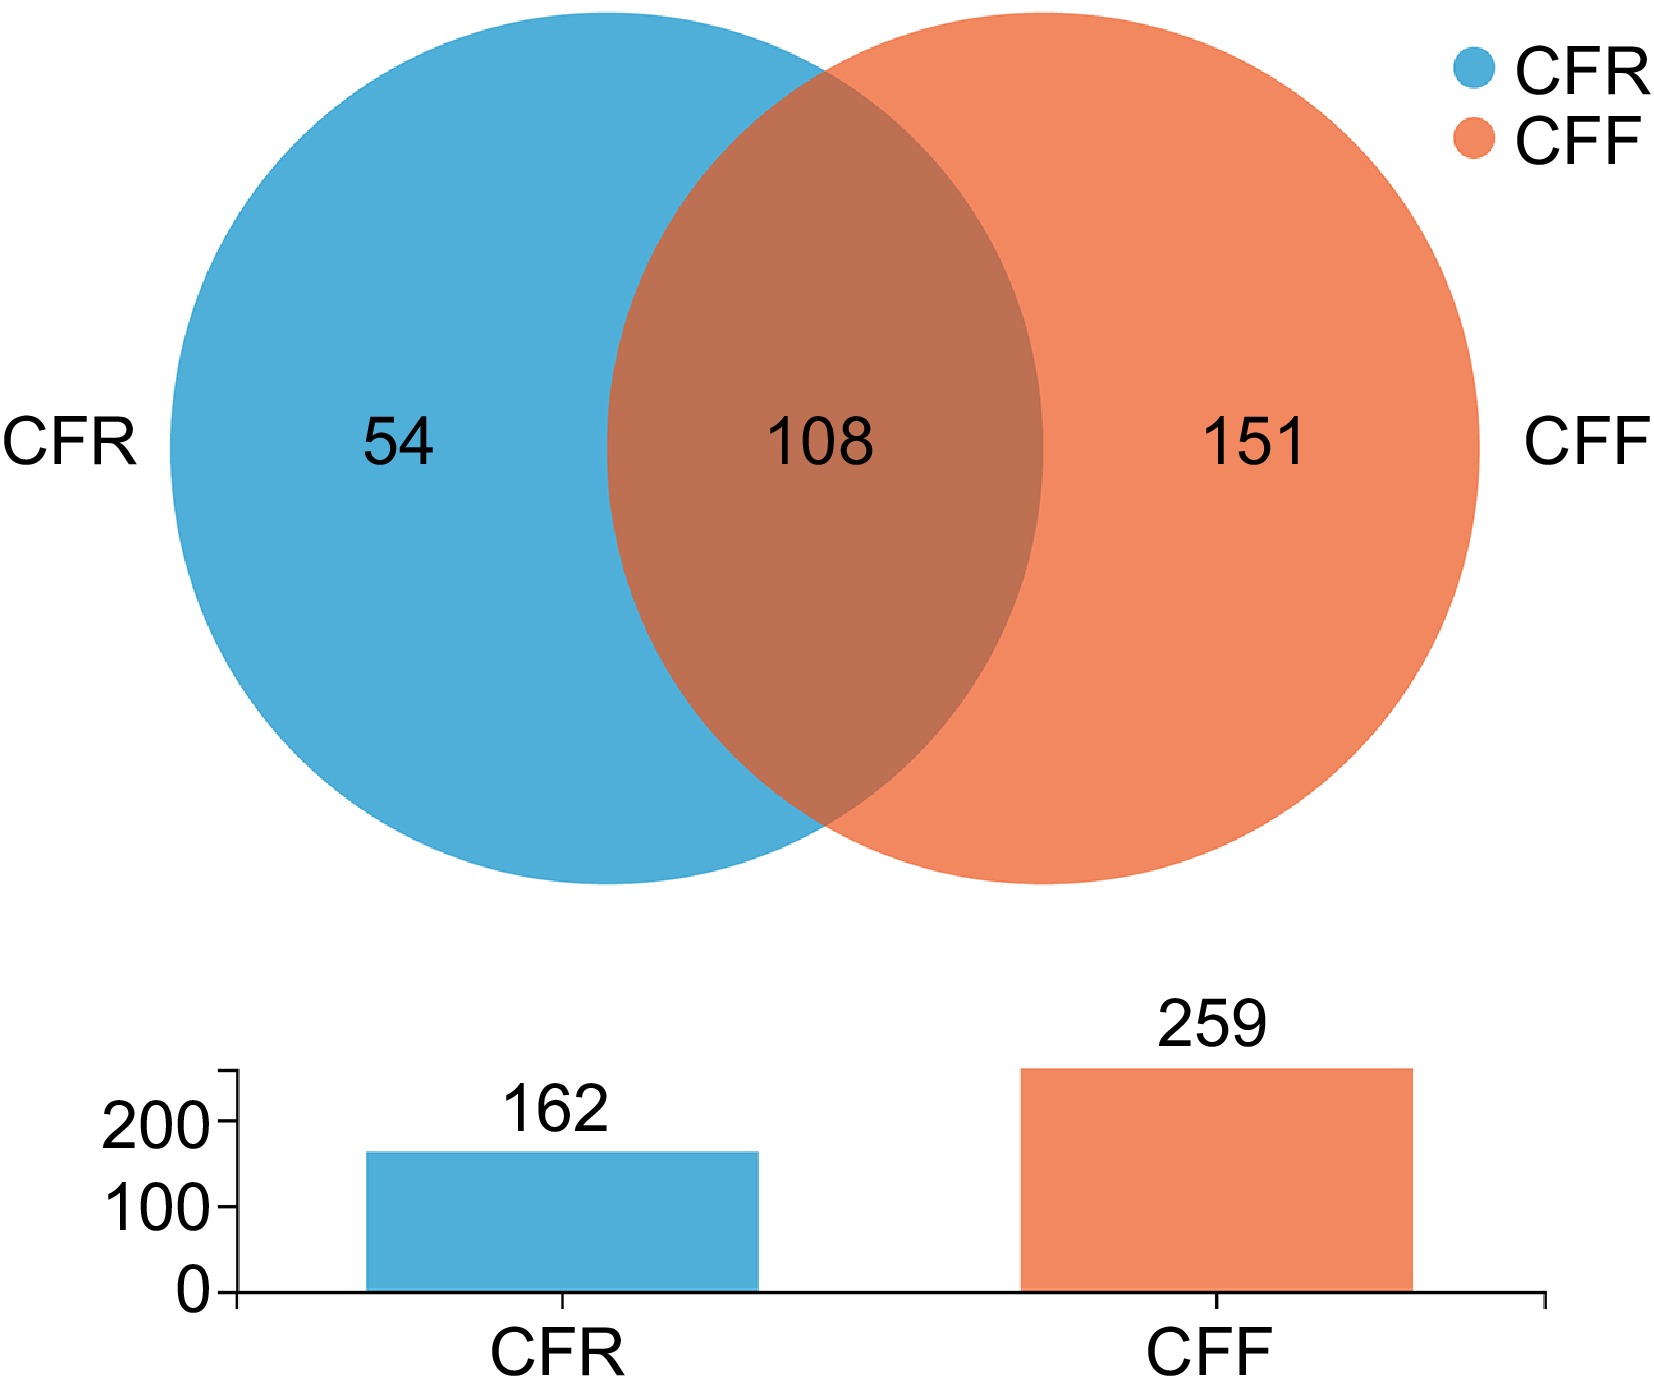
Figure 1.
Venn diagram of OTUs in CFF and CFR groups.
-
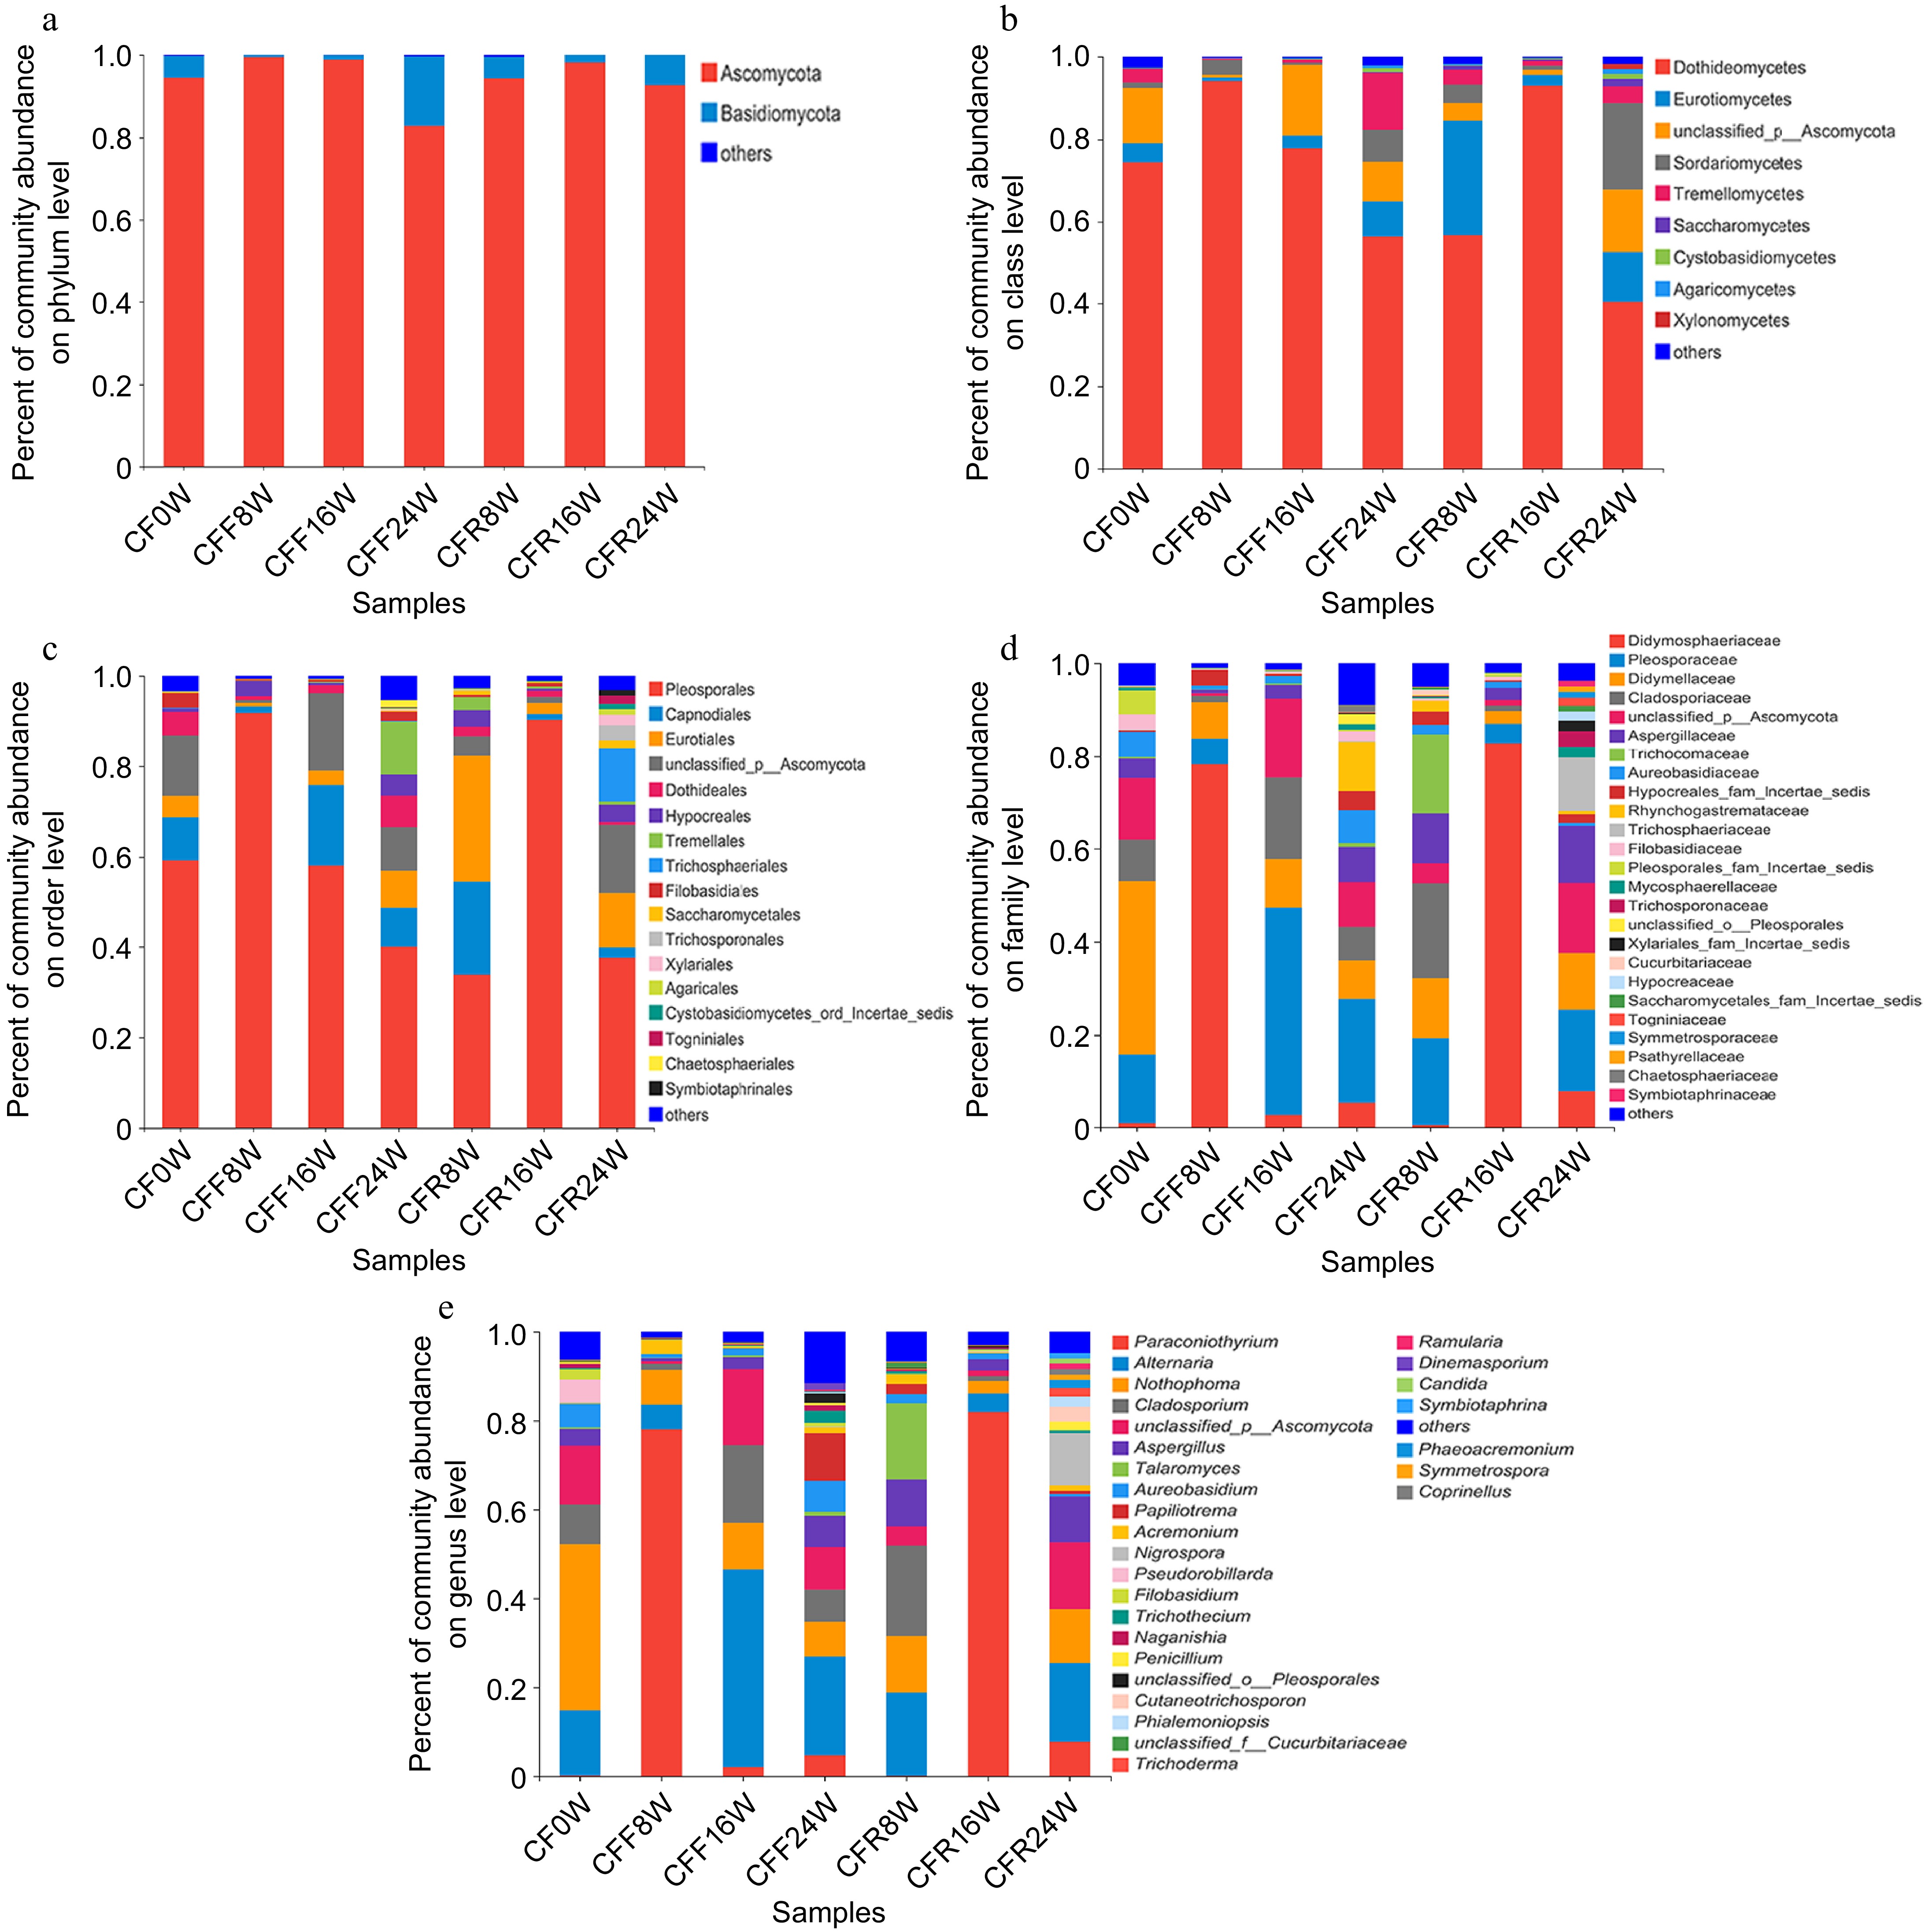
Figure 2.
Analysis of fungal community composition of seven CF samples. (a) Phylum level; (b) class level; (c) order level; (d) family level; (e) genus level.
-
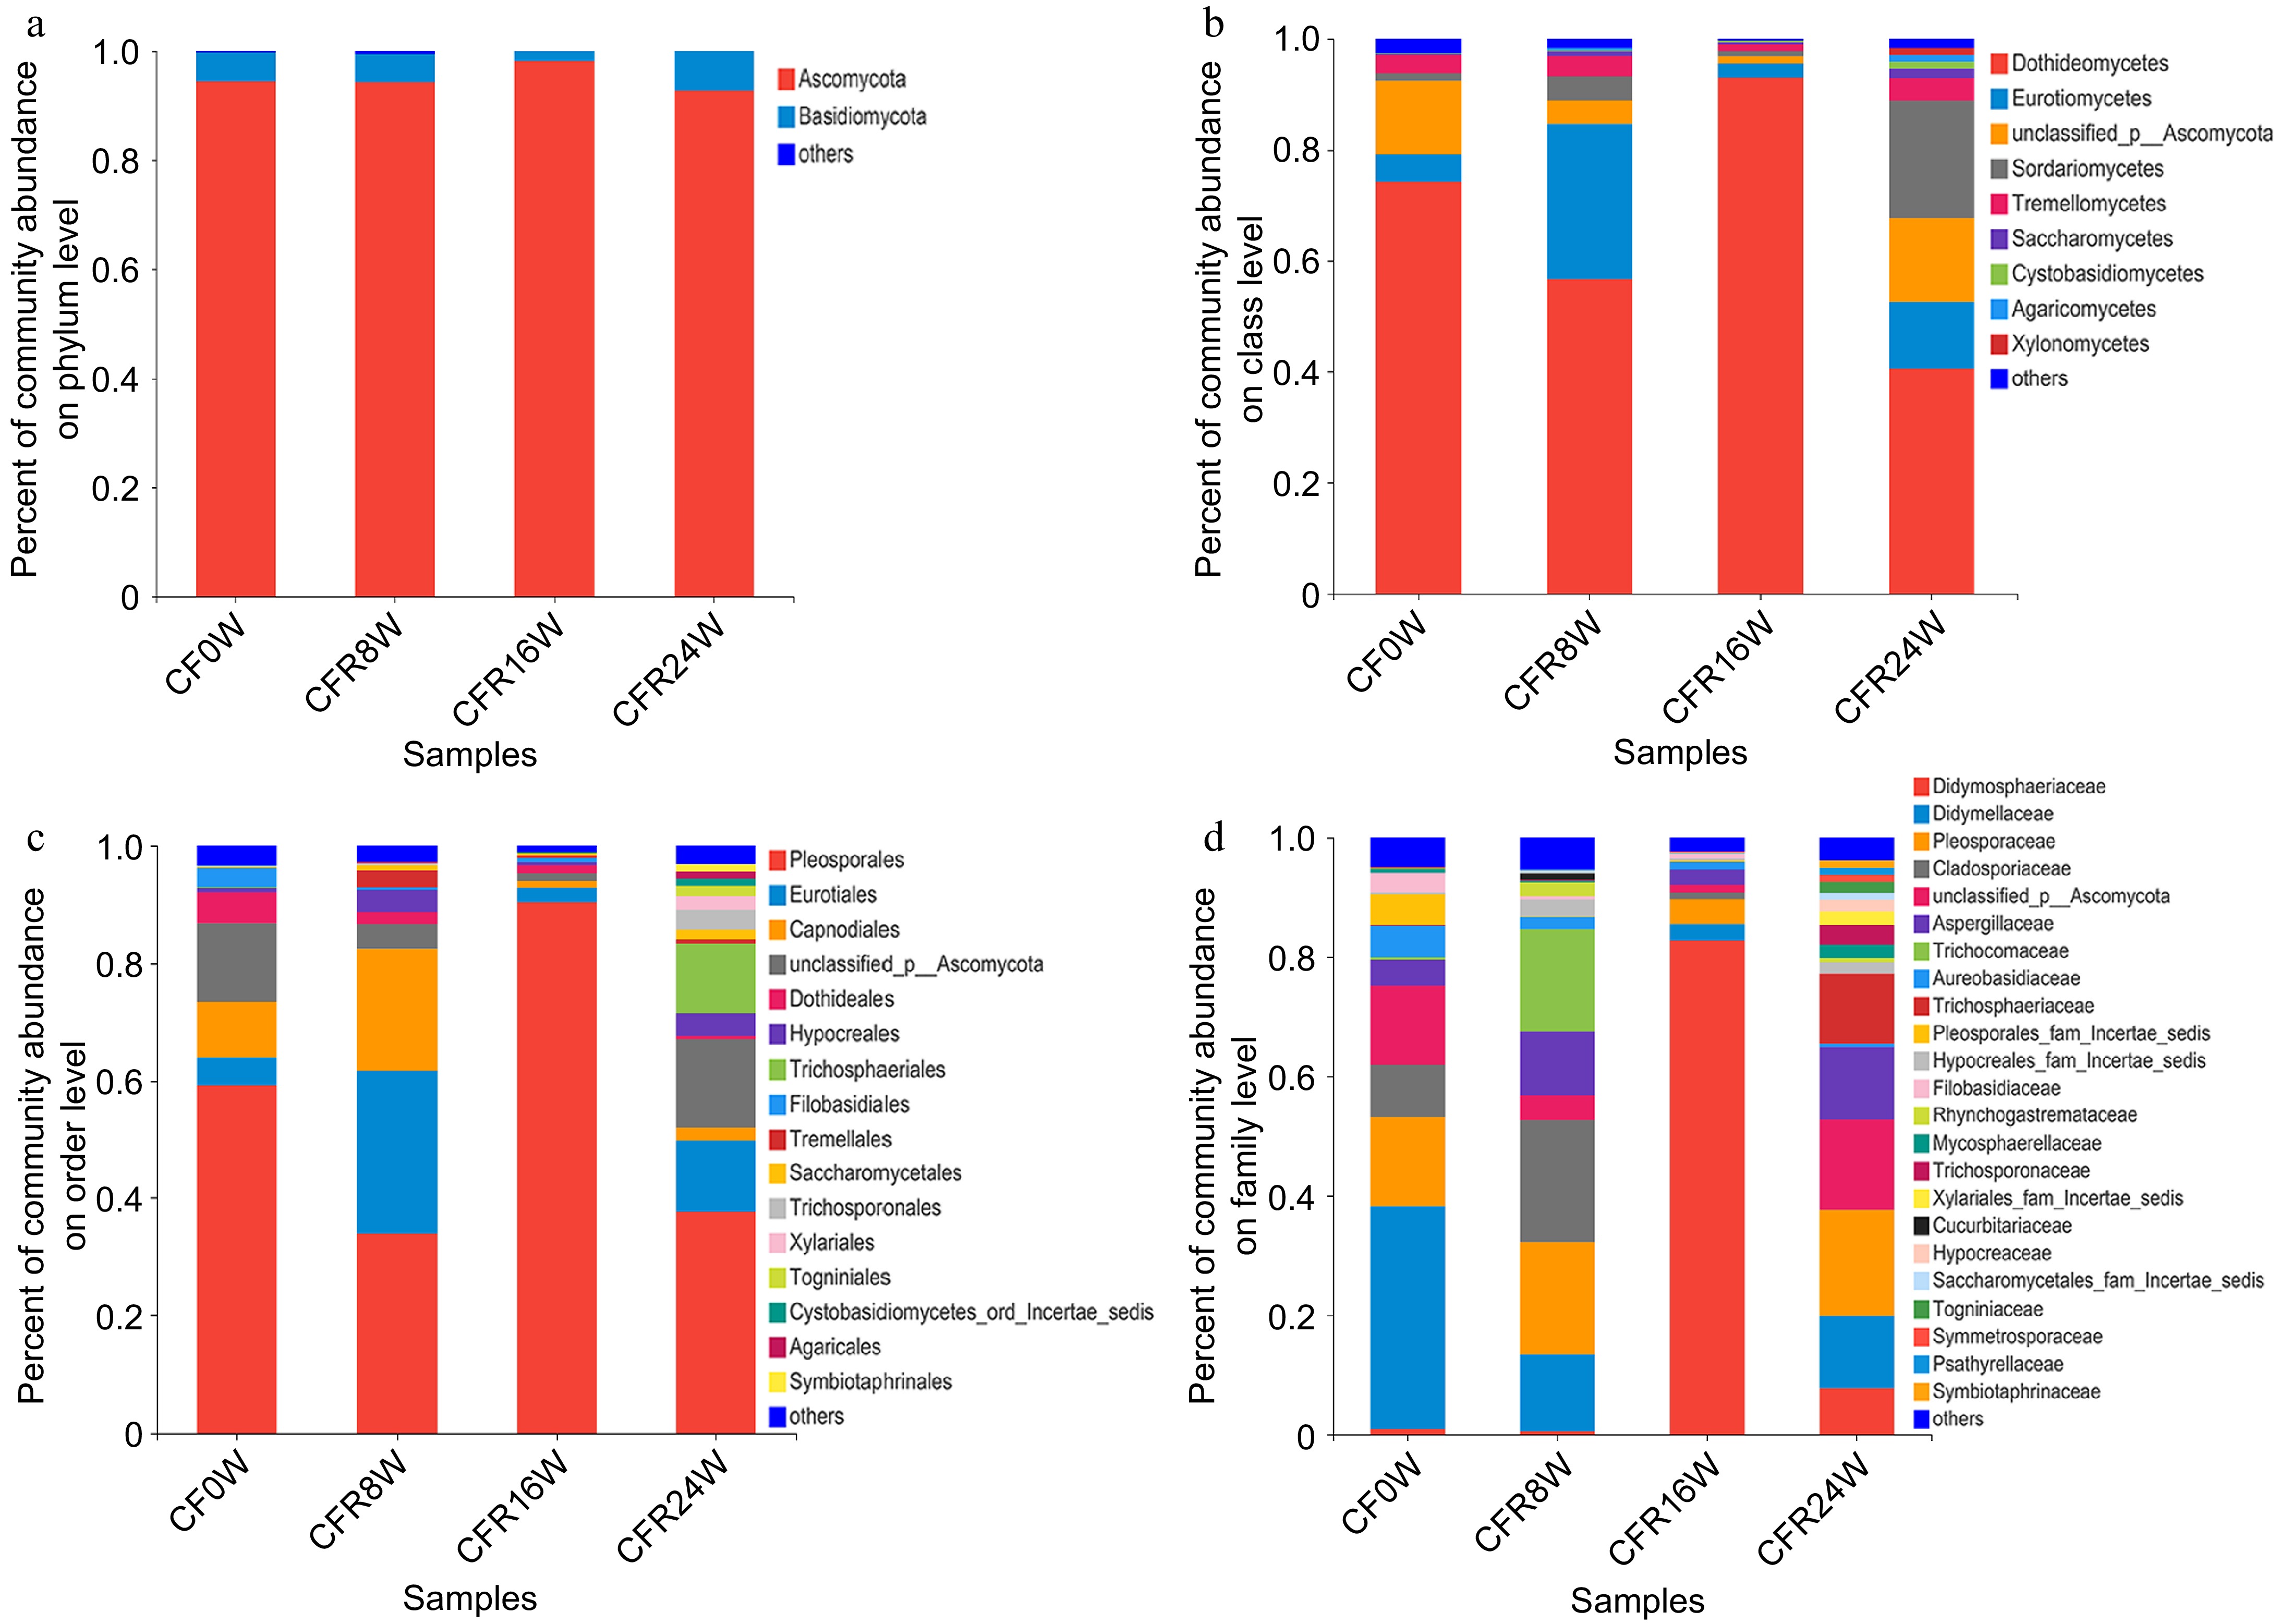
Figure 3.
Analysis of fungal community composition of the CFR samples. (a) Phylum level; (b) class level; (c) order level; (d) family level.
-
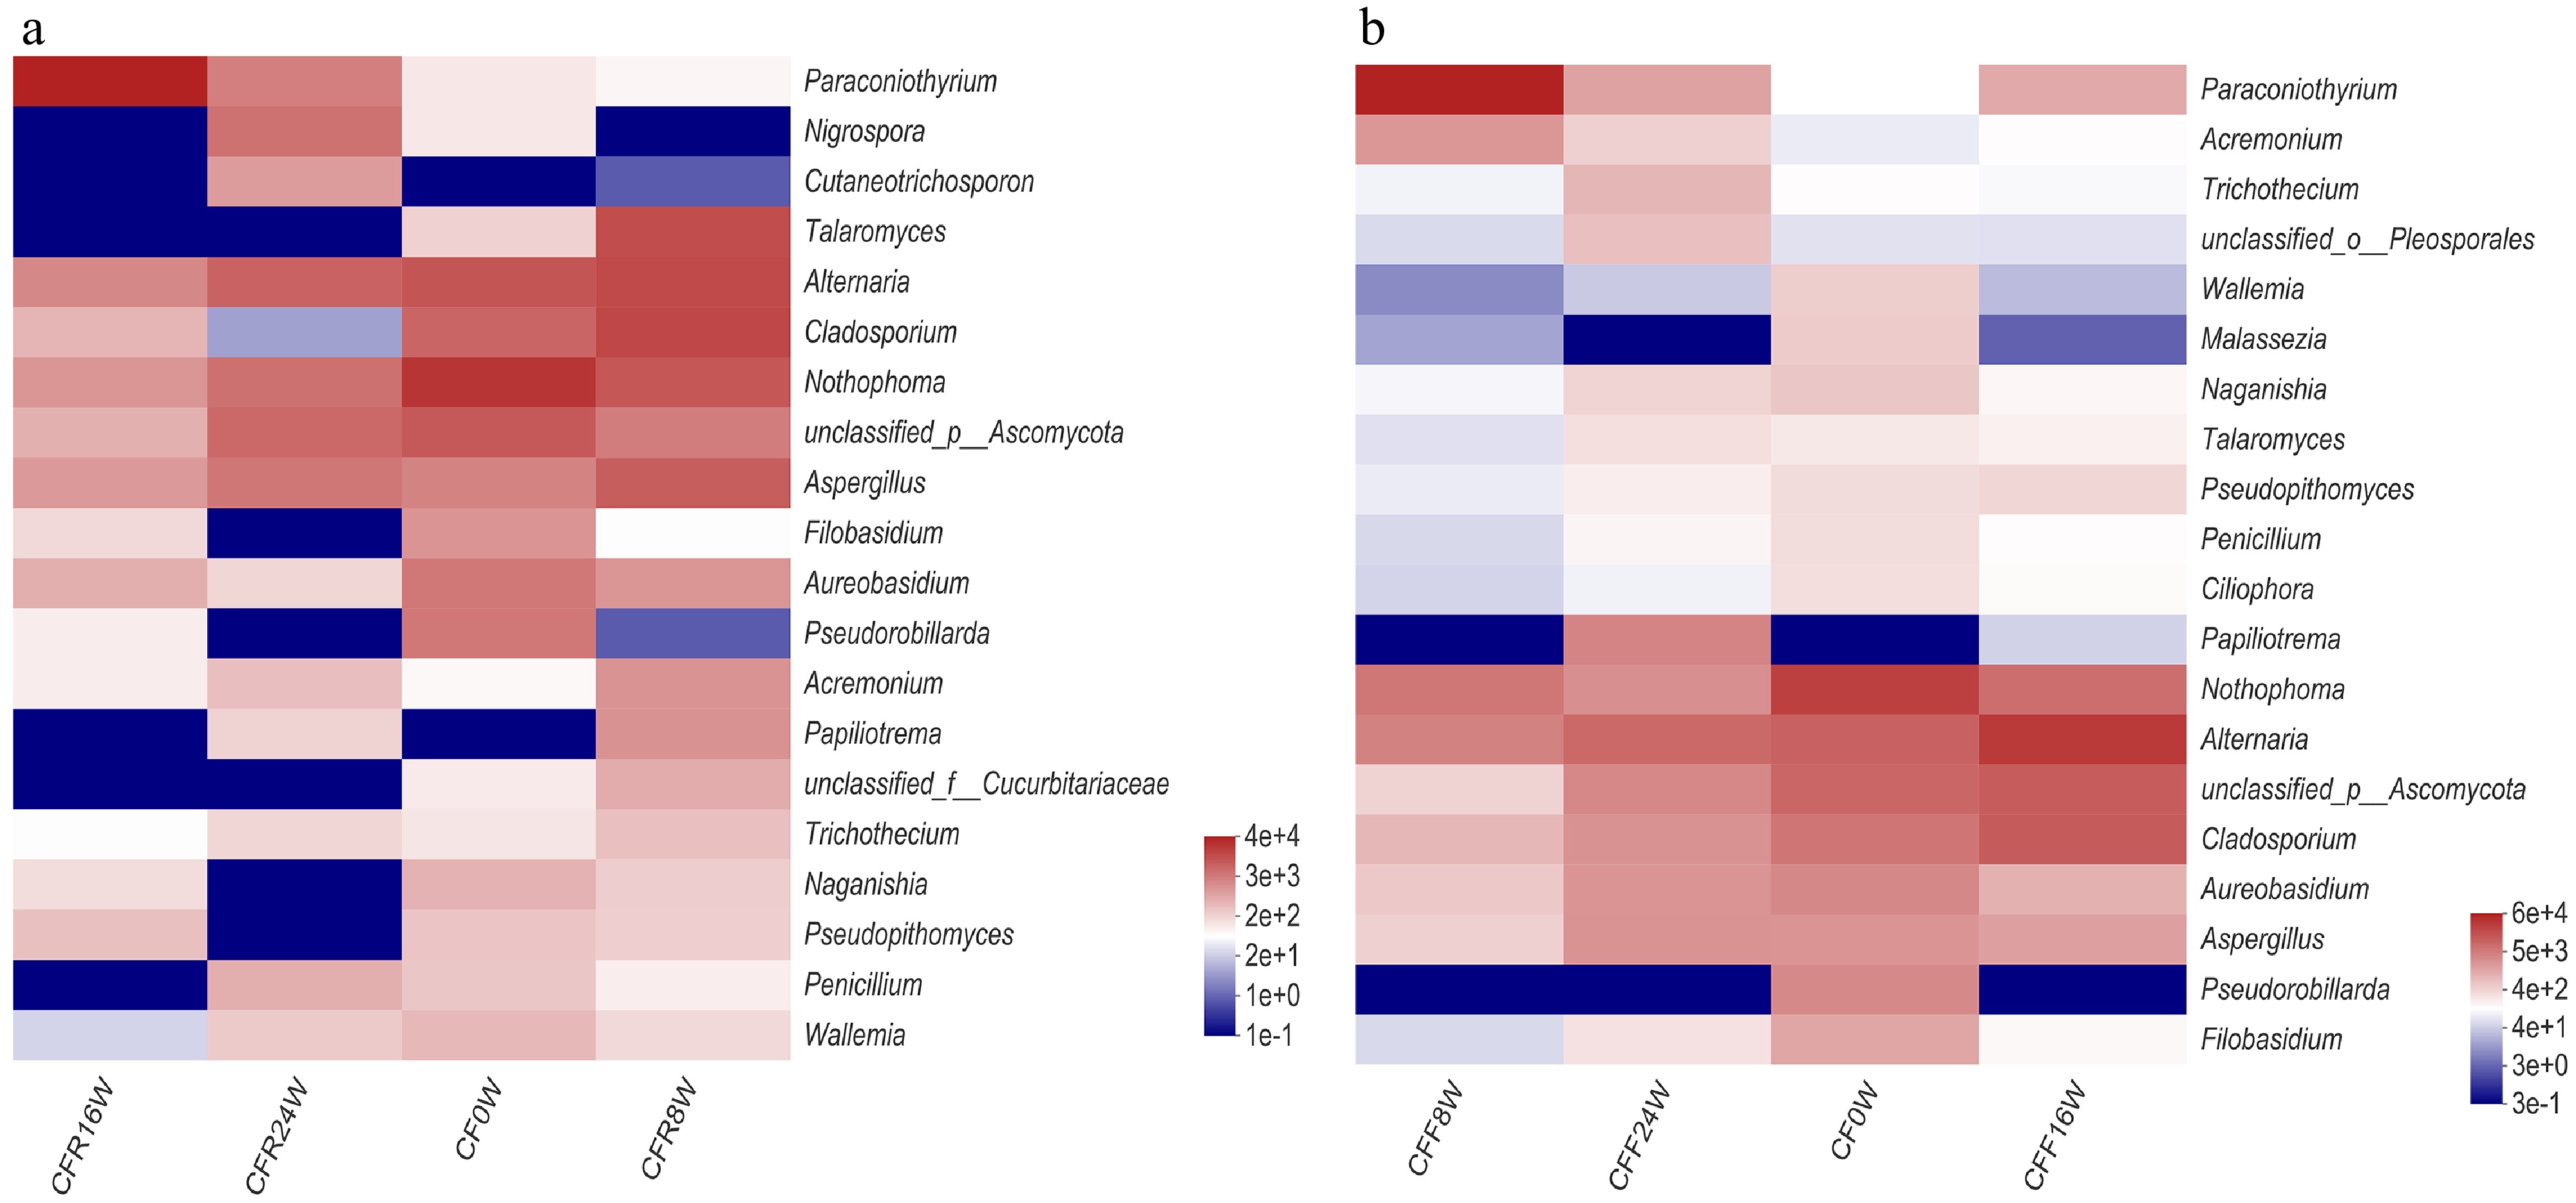
Figure 4.
Differences of fungal community at the genus level in (a) the CFR samples and (b) the CFF samples.
-
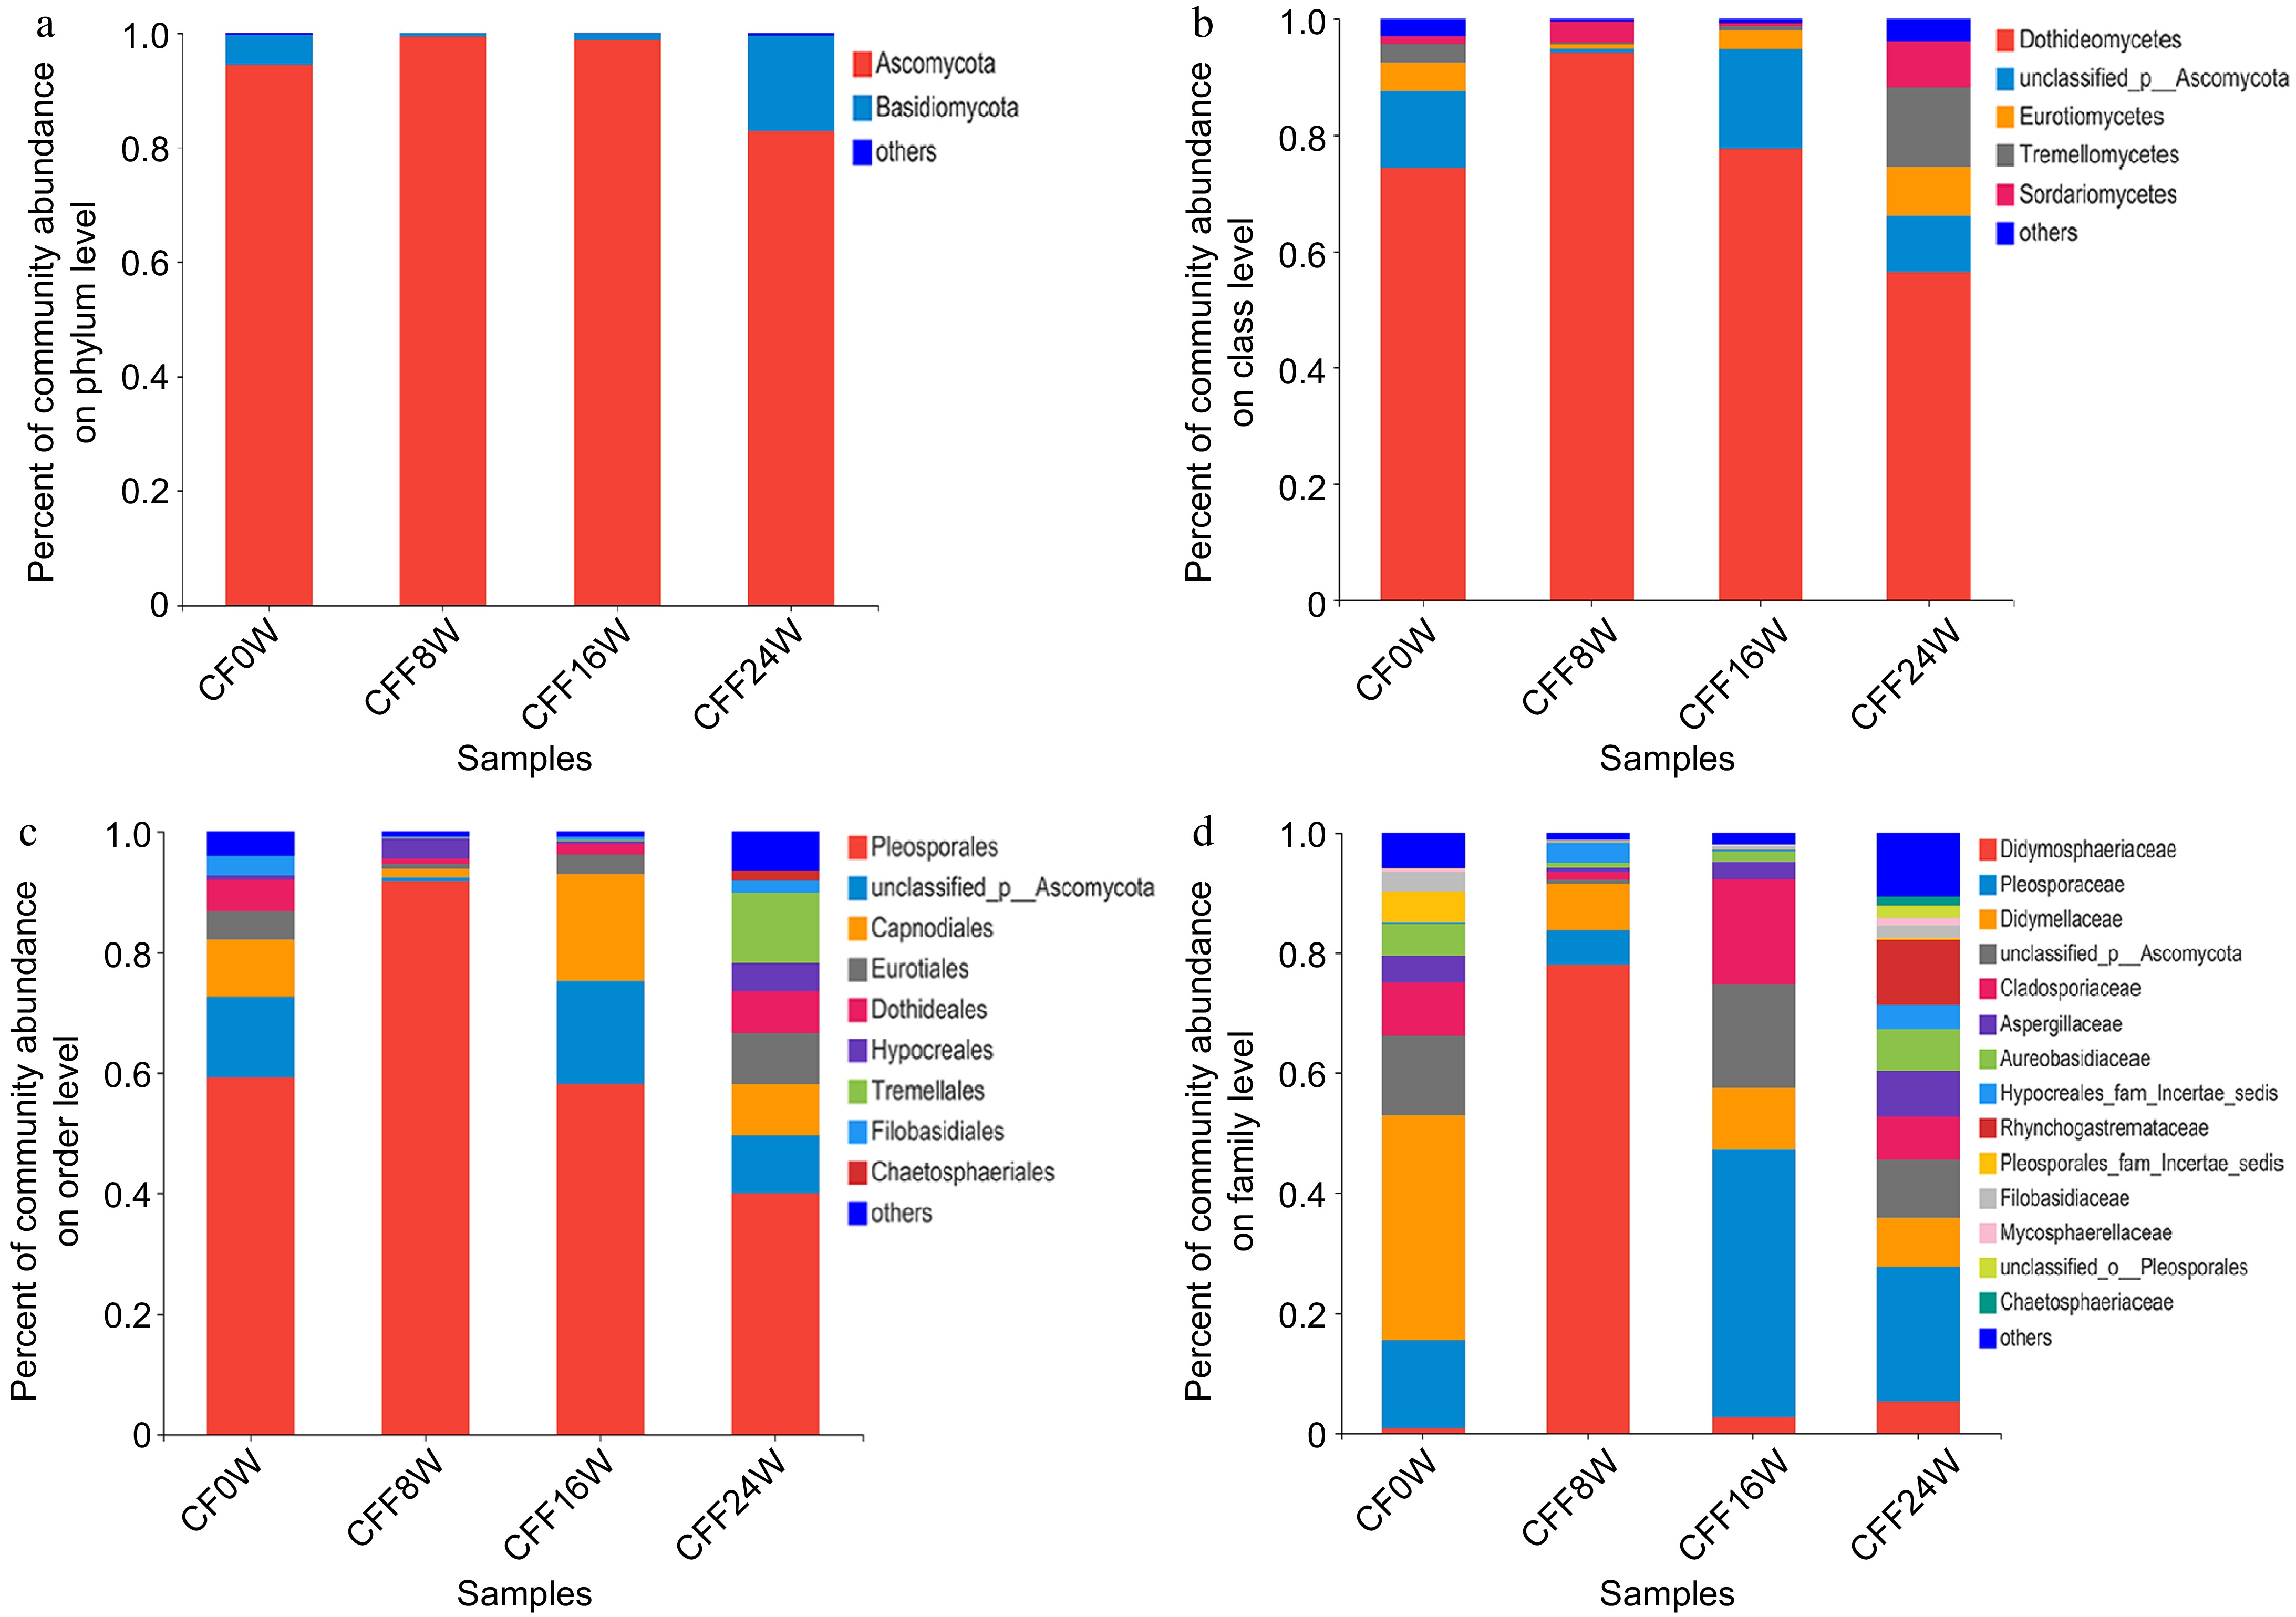
Figure 5.
Analysis of fungal community composition in the CFF samples. (a) Phylum level; (b) class level; (c) order level; (d) family level.
-
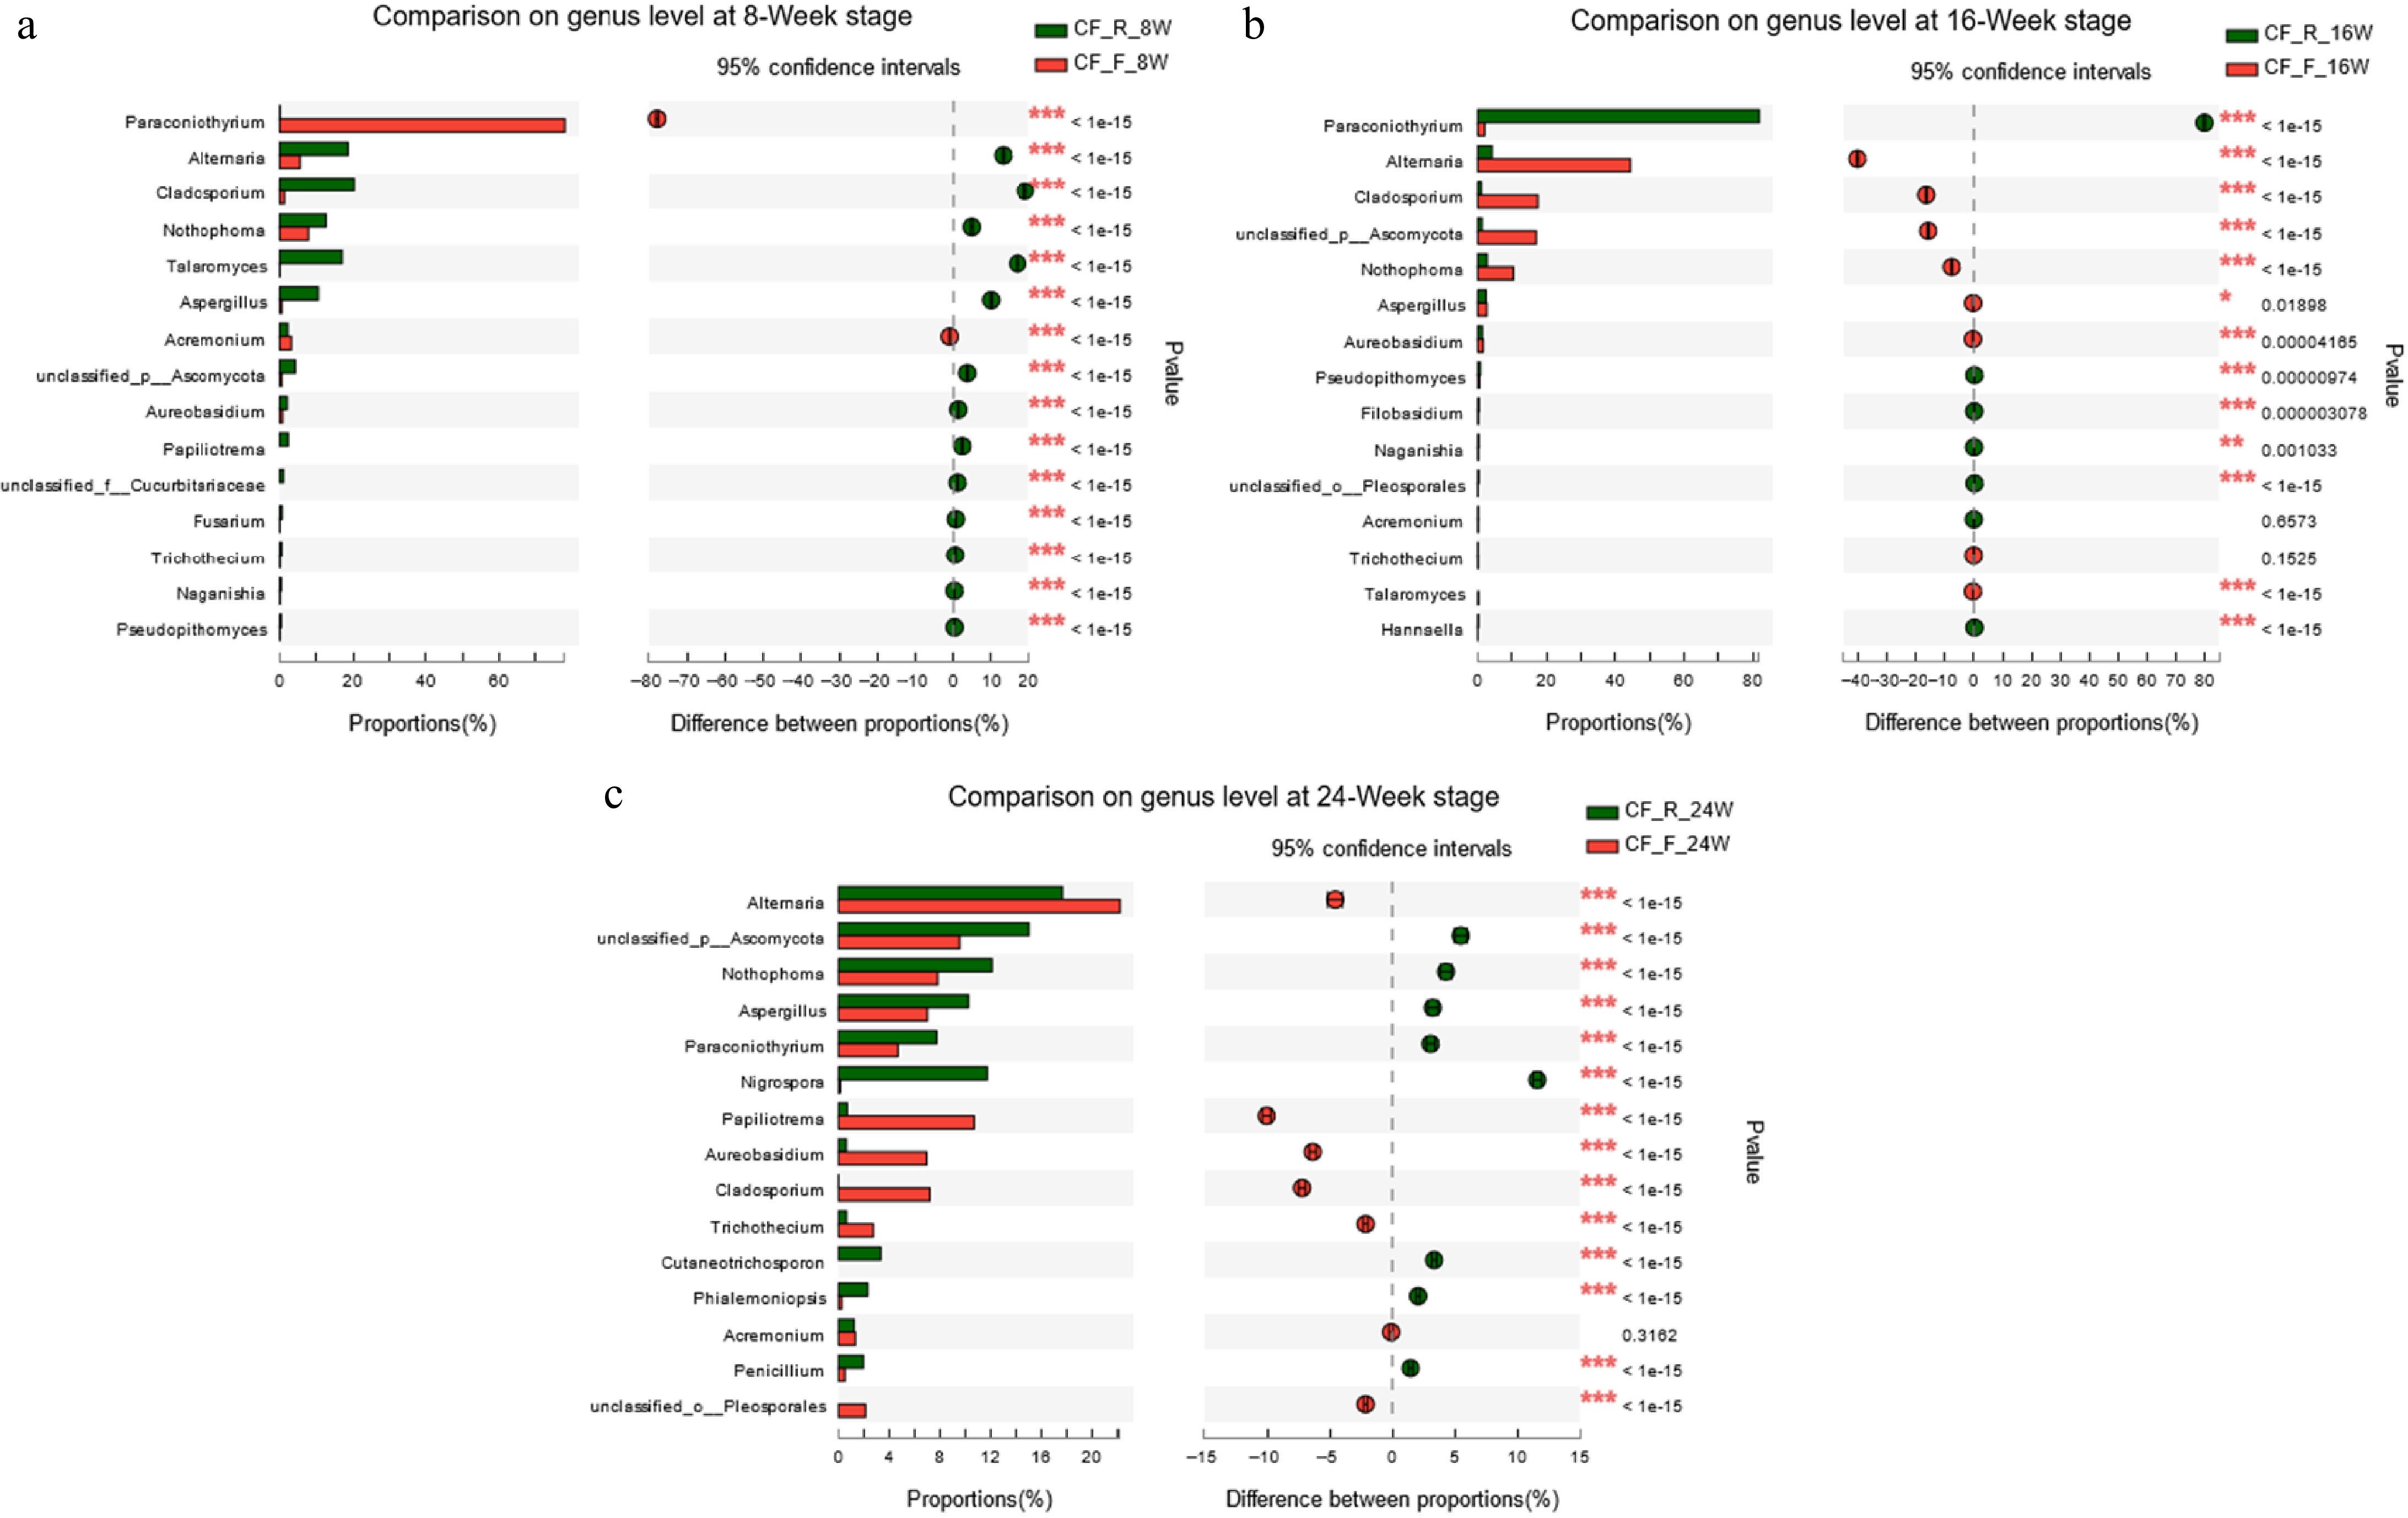
Figure 6.
Comparison of the differences of fungal community at the genus level between samples stored at RT and 4 °C for (a) 8-Week; (b) 16-Week; (c) 24-Week.
-
Storage time Storage temperature Room temperature 4 °C 0-Week CF0W CF0W 8-Week CFR8W CFF8W 16-Week CFR16W CFF16W 24-Week CFR24W CFF24W Table 1.
Sample information for the CF investigated in this study.
-
Sample Observed
OTU numbersShannon Simpson Chao Coverage Genbank
accession No.CF0W 81 2.45 0.18 81.00 1.000000 SAMN18864584 CFR8W 126 2.63 0.12 129.33 0.999928 SAMN20297327 CFR16W 51 1.01 0.67 51.00 0.999980 SAMN20297328 CFR24W 38 2.95 0.08 38.00 1.000000 SAMN20297329 CFF8W 128 1.02 0.62 129.62 0.999902 SAMN20297324 CFF16W 196 2.00 0.25 208.00 0.999627 SAMN20297325 CFF24W 131 3.29 0.08 136.00 0.999859 SAMN20297326 Table 2.
Observed OTU numbers and alpha diversity indices of CF samples.
-
Sample No. The relative abundances of potentially toxigenic fungi in CF samples Rhizopus microsporus Penicillium oxalicum Trichothecium roseum Candida tropicalis Penicillium brevicompactum Beauveria bassiana Talaromyces rugulosus CF0W — — 47 18.29% 139 6.86% — — — — — — — — CFR8W — — 59 22.96% 422 20.82% — — 29 46.03% 16 66.67% 164 99.39% CFR16W — — — — 68 3.35% — — — — — — — — CFR24W — — — — 218 10.75% 448 100.00% — — — — — — CFF8W — — 12 4.67% 96 4.74% — — 26 41.27% — — — — CFF16W 3 100.00% 89 34.63% 112 5.53% — — 8 12.70% 8 33.33% 1 0.61% CFF24W — — 50 19.46% 972 47.95% — — — — — — — — Total 3 100.00% 257 100.00% 2027 100.00% 448 100.00% 63 100.00% 24 100.00% 165 100.00% Table 3.
Proportion of potentially toxigenic fungi in seven CF samples.
Figures
(6)
Tables
(3)