-
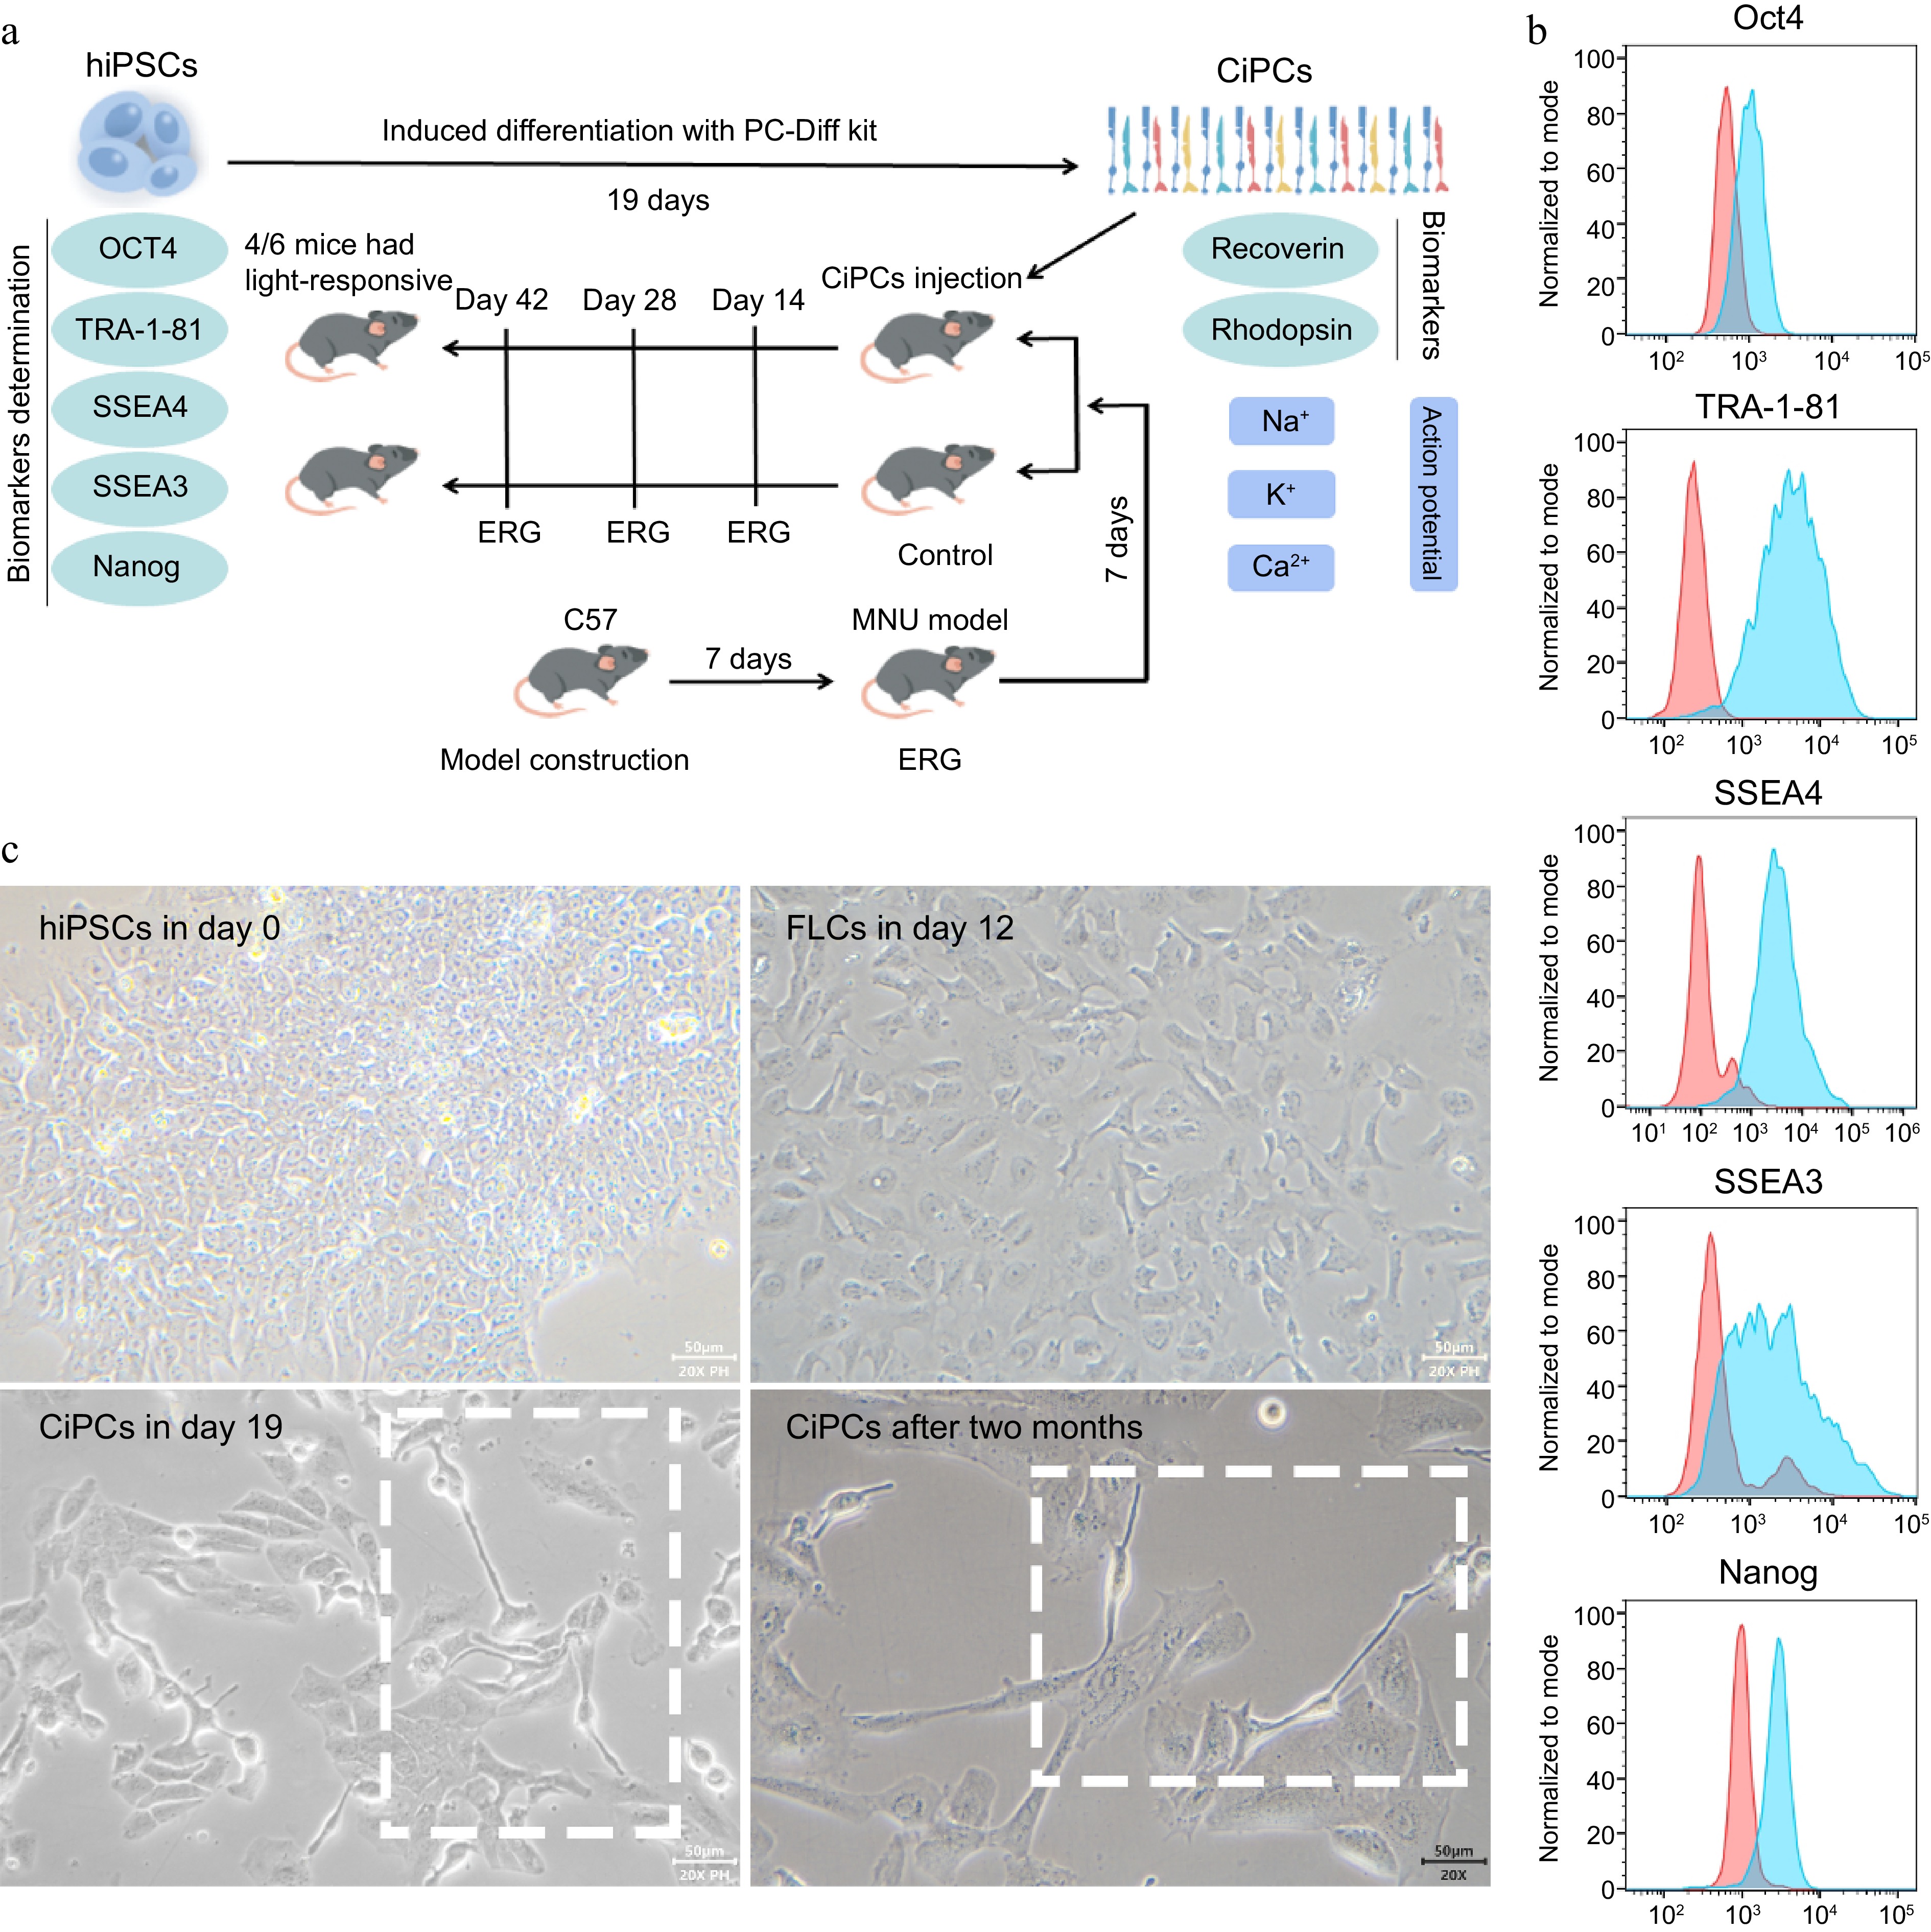
Figure 1.
The character determination and induced differentiation of hiPSCs. (a) Schematic of CiPC generation and the experiment. (b) The biomarkers of hiPSCs used in the study. The positive signals of hiPSCs were presented as blue peaks and the negative controls were as red peaks. (c) The differentiation from hiPSCs to CiPCs which maintained morphology for at least two months.
-
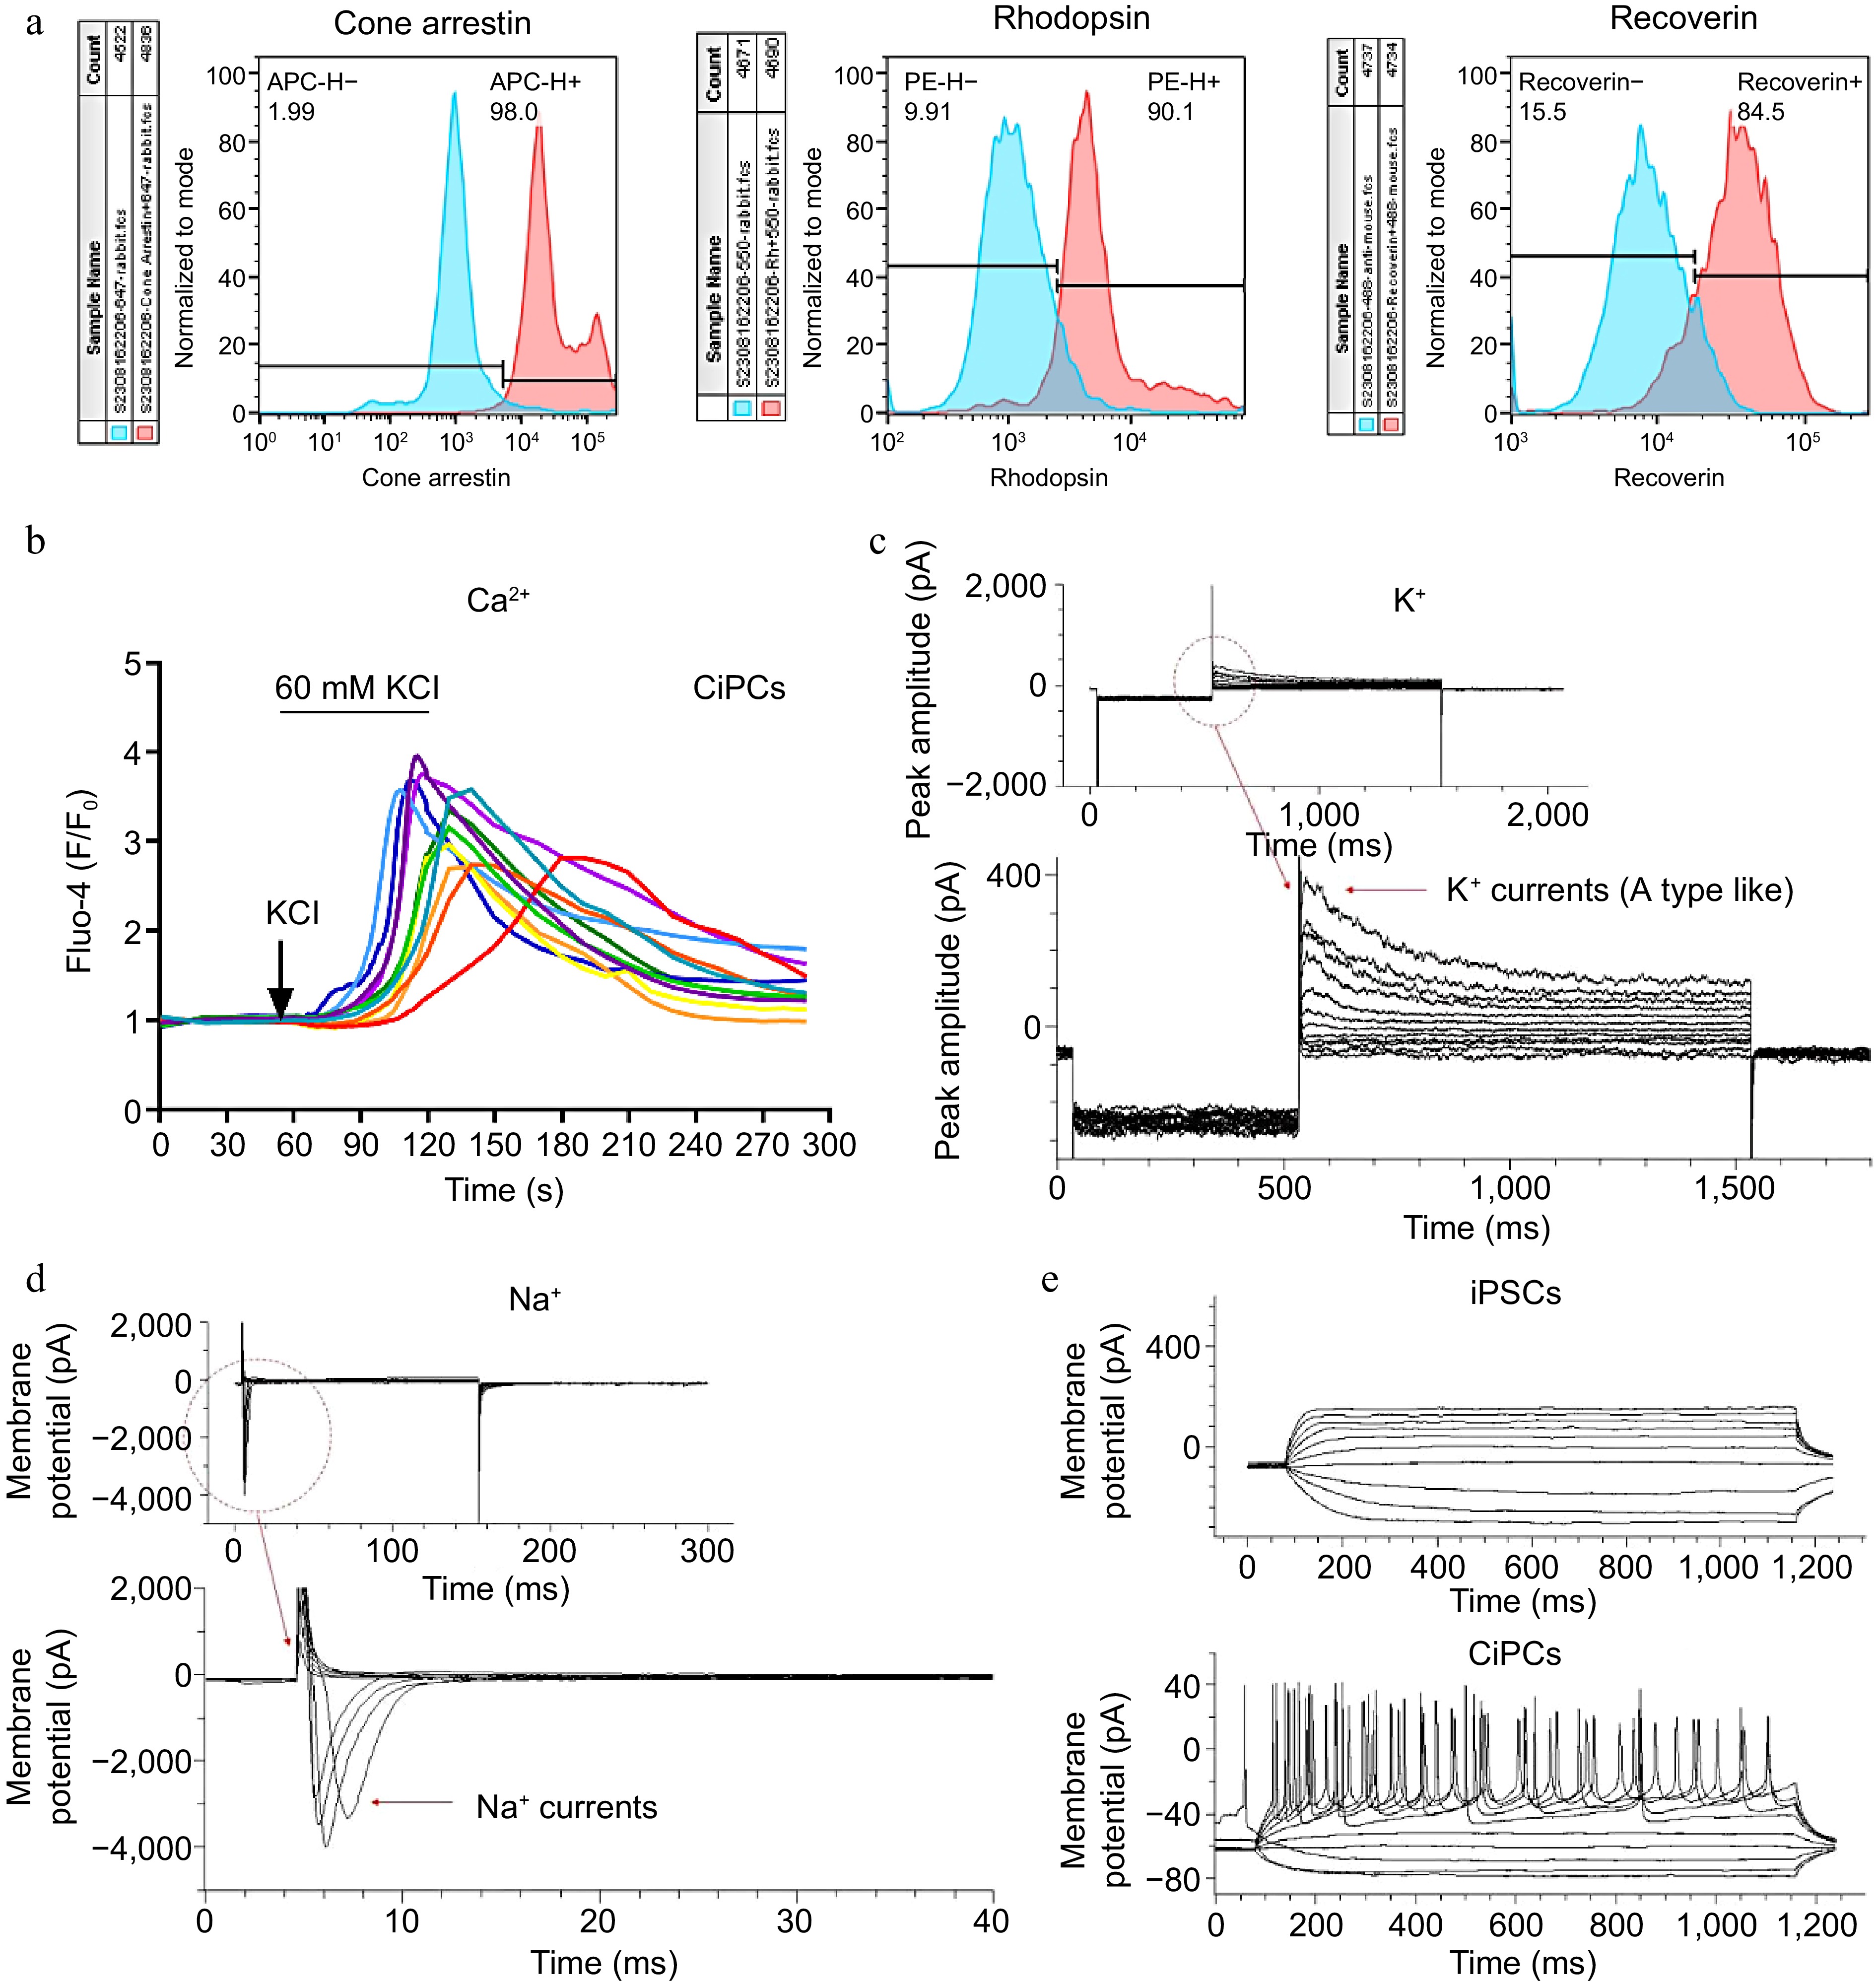
Figure 2.
The biomarker and function detection of CiPCs. (a) The expression of Cone-Arrestin, Rhodopsin, and Recoverin on CiPCs. The positive signals of CiPCs were presented as red peaks and the undifferentiated hiPSCs were used for negative controls as blue peaks. (b) The Ca2+-relevant fluorescence changes on CiPCs when it was perfused with the high K+ buffer. With continued stimulation, the signal intensity gradually decreased from the initial purple trace to the final red trace. (c) K+ currents on CiPCs. (d) Na+ currents on CiPCs. (e) Action potential of CiPCs.
-
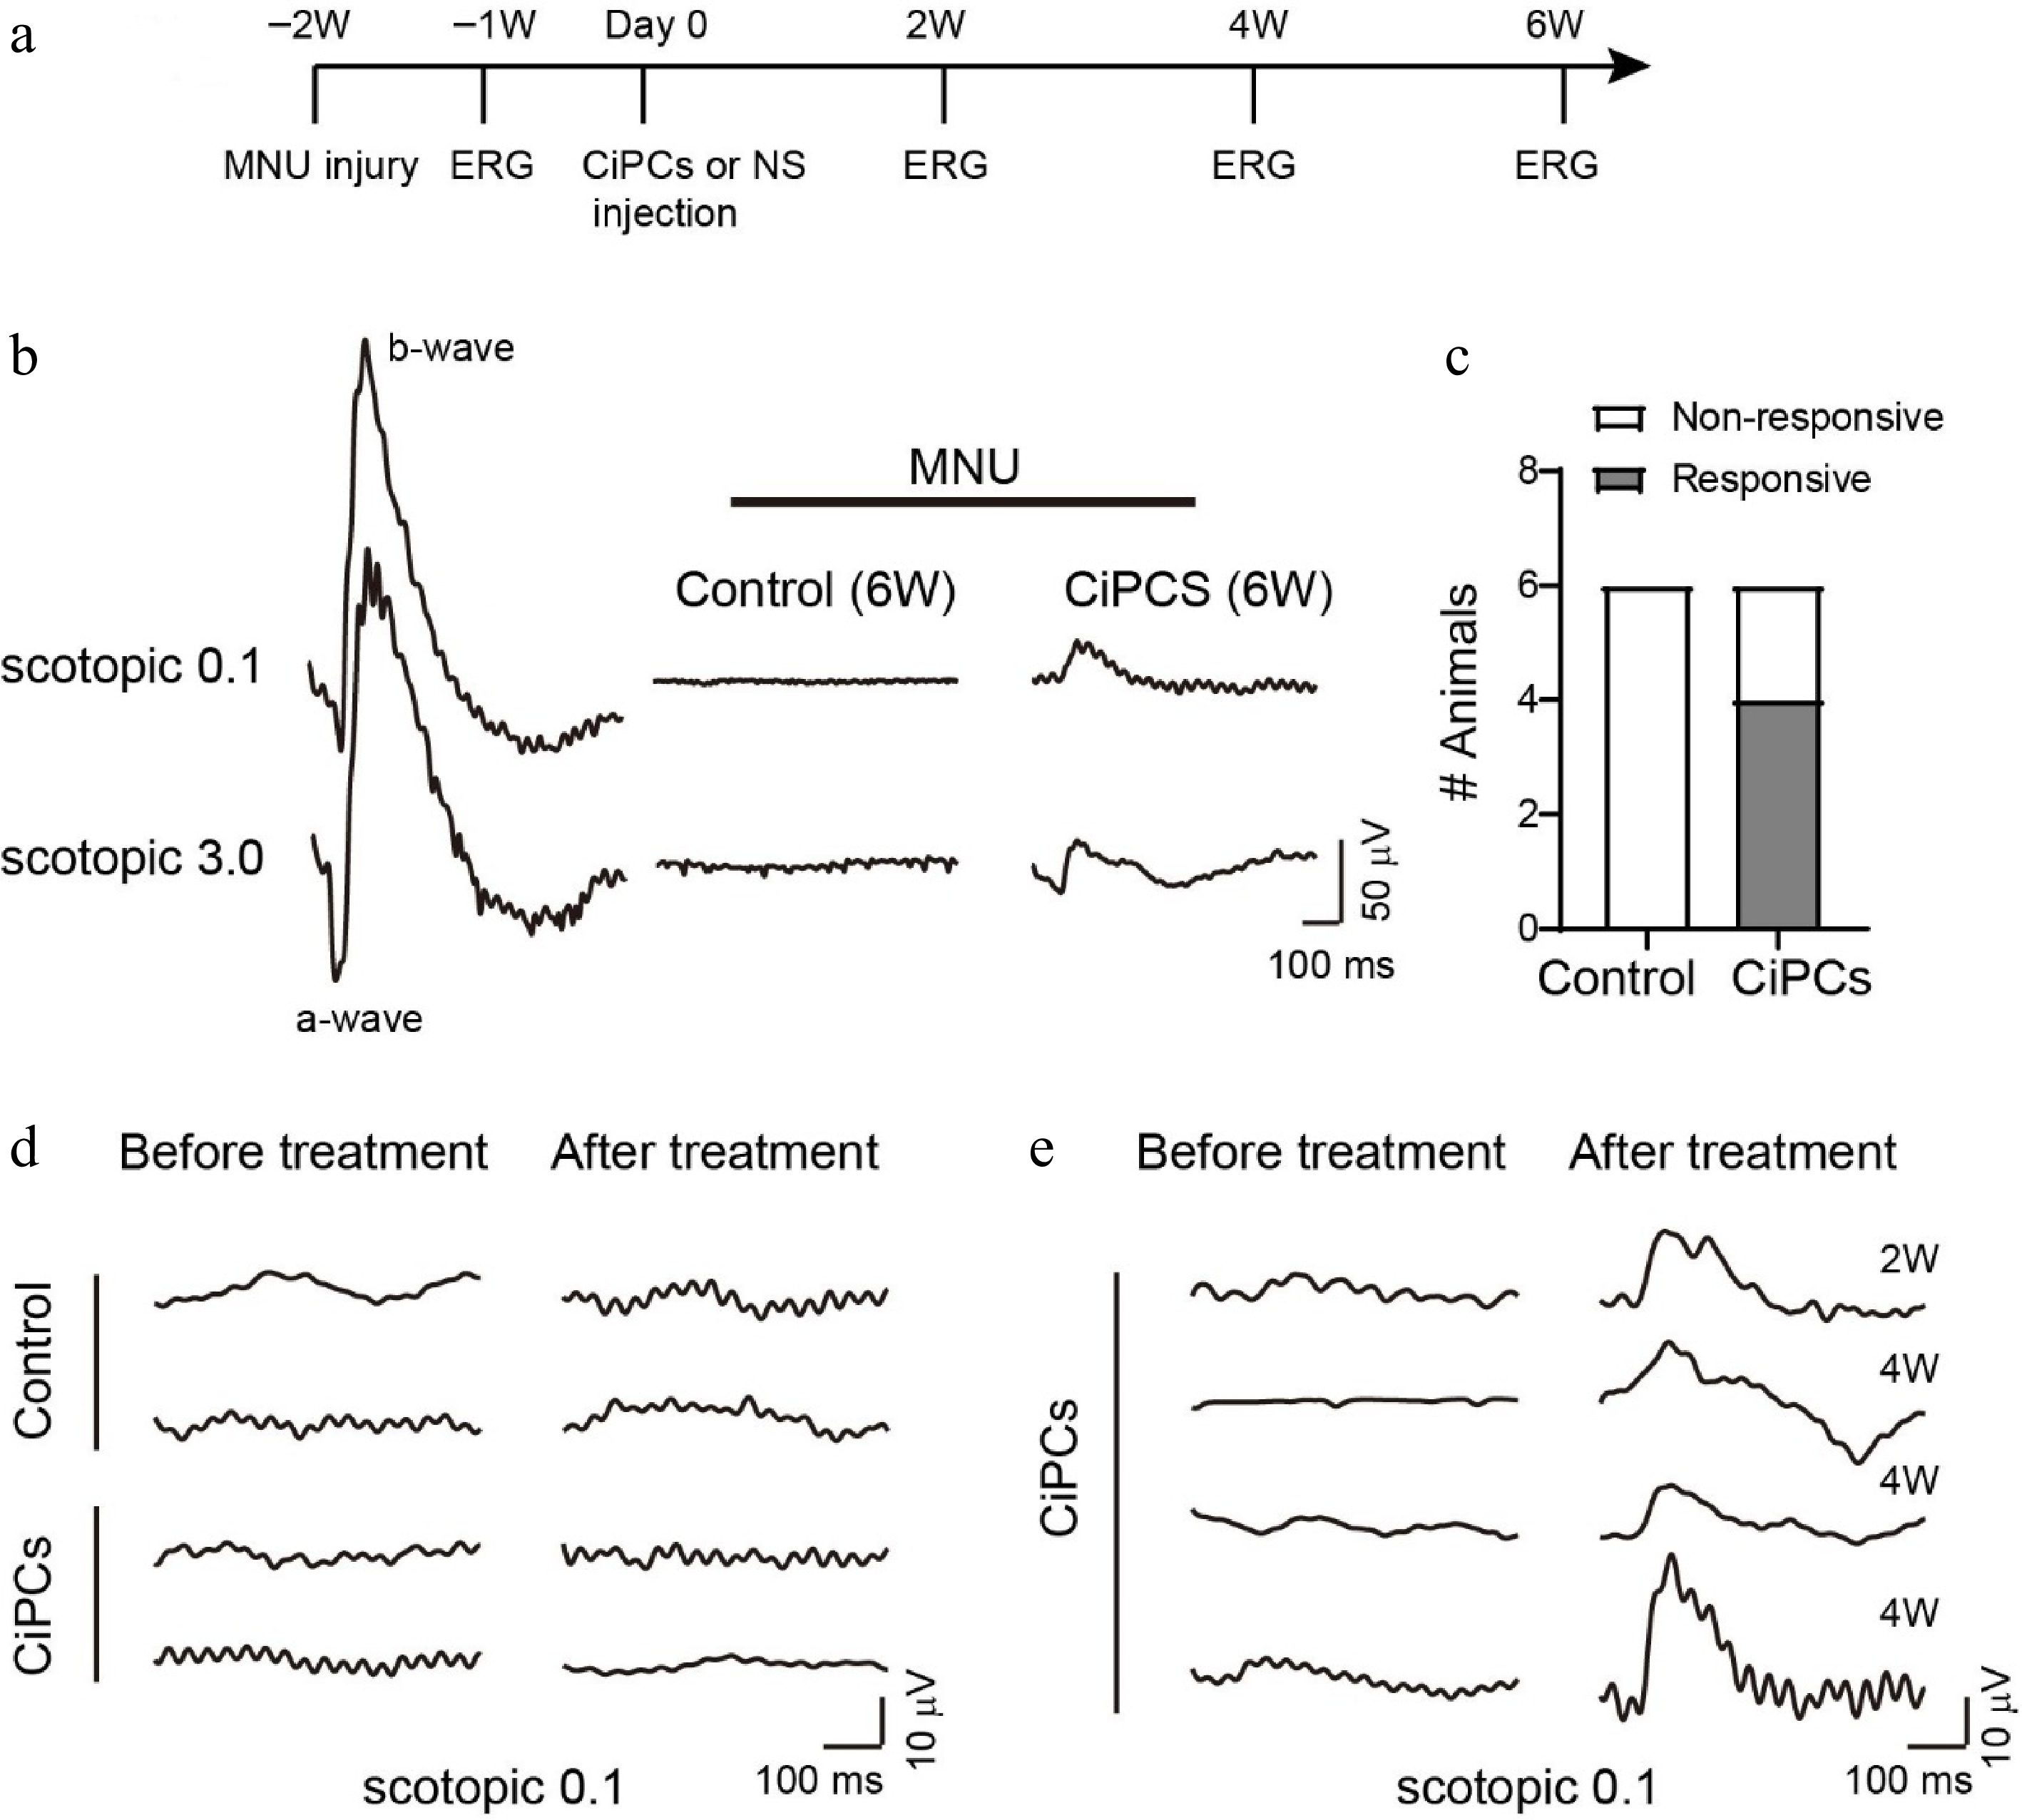
Figure 3.
CiPCs restored retinal light response in MNU-injured mice. (a) Experimental schedule. (b) Examples of ERG traces from a normal mouse and MNU-injured mice after 6 weeks of CiPCs injection or control solution. (c) The number of animals tested with light-responsive and non-responsive in the control and CiPCs treatment group. (d) Example ERG traces of control (top) or CiPCs (bottom) treated animals showing no light response before (left) and at 6 weeks after treatment (right). (e) ERG traces of four CiPCs treated animals that partially restored light responses at 2 weeks or 4 weeks after treatment.
-
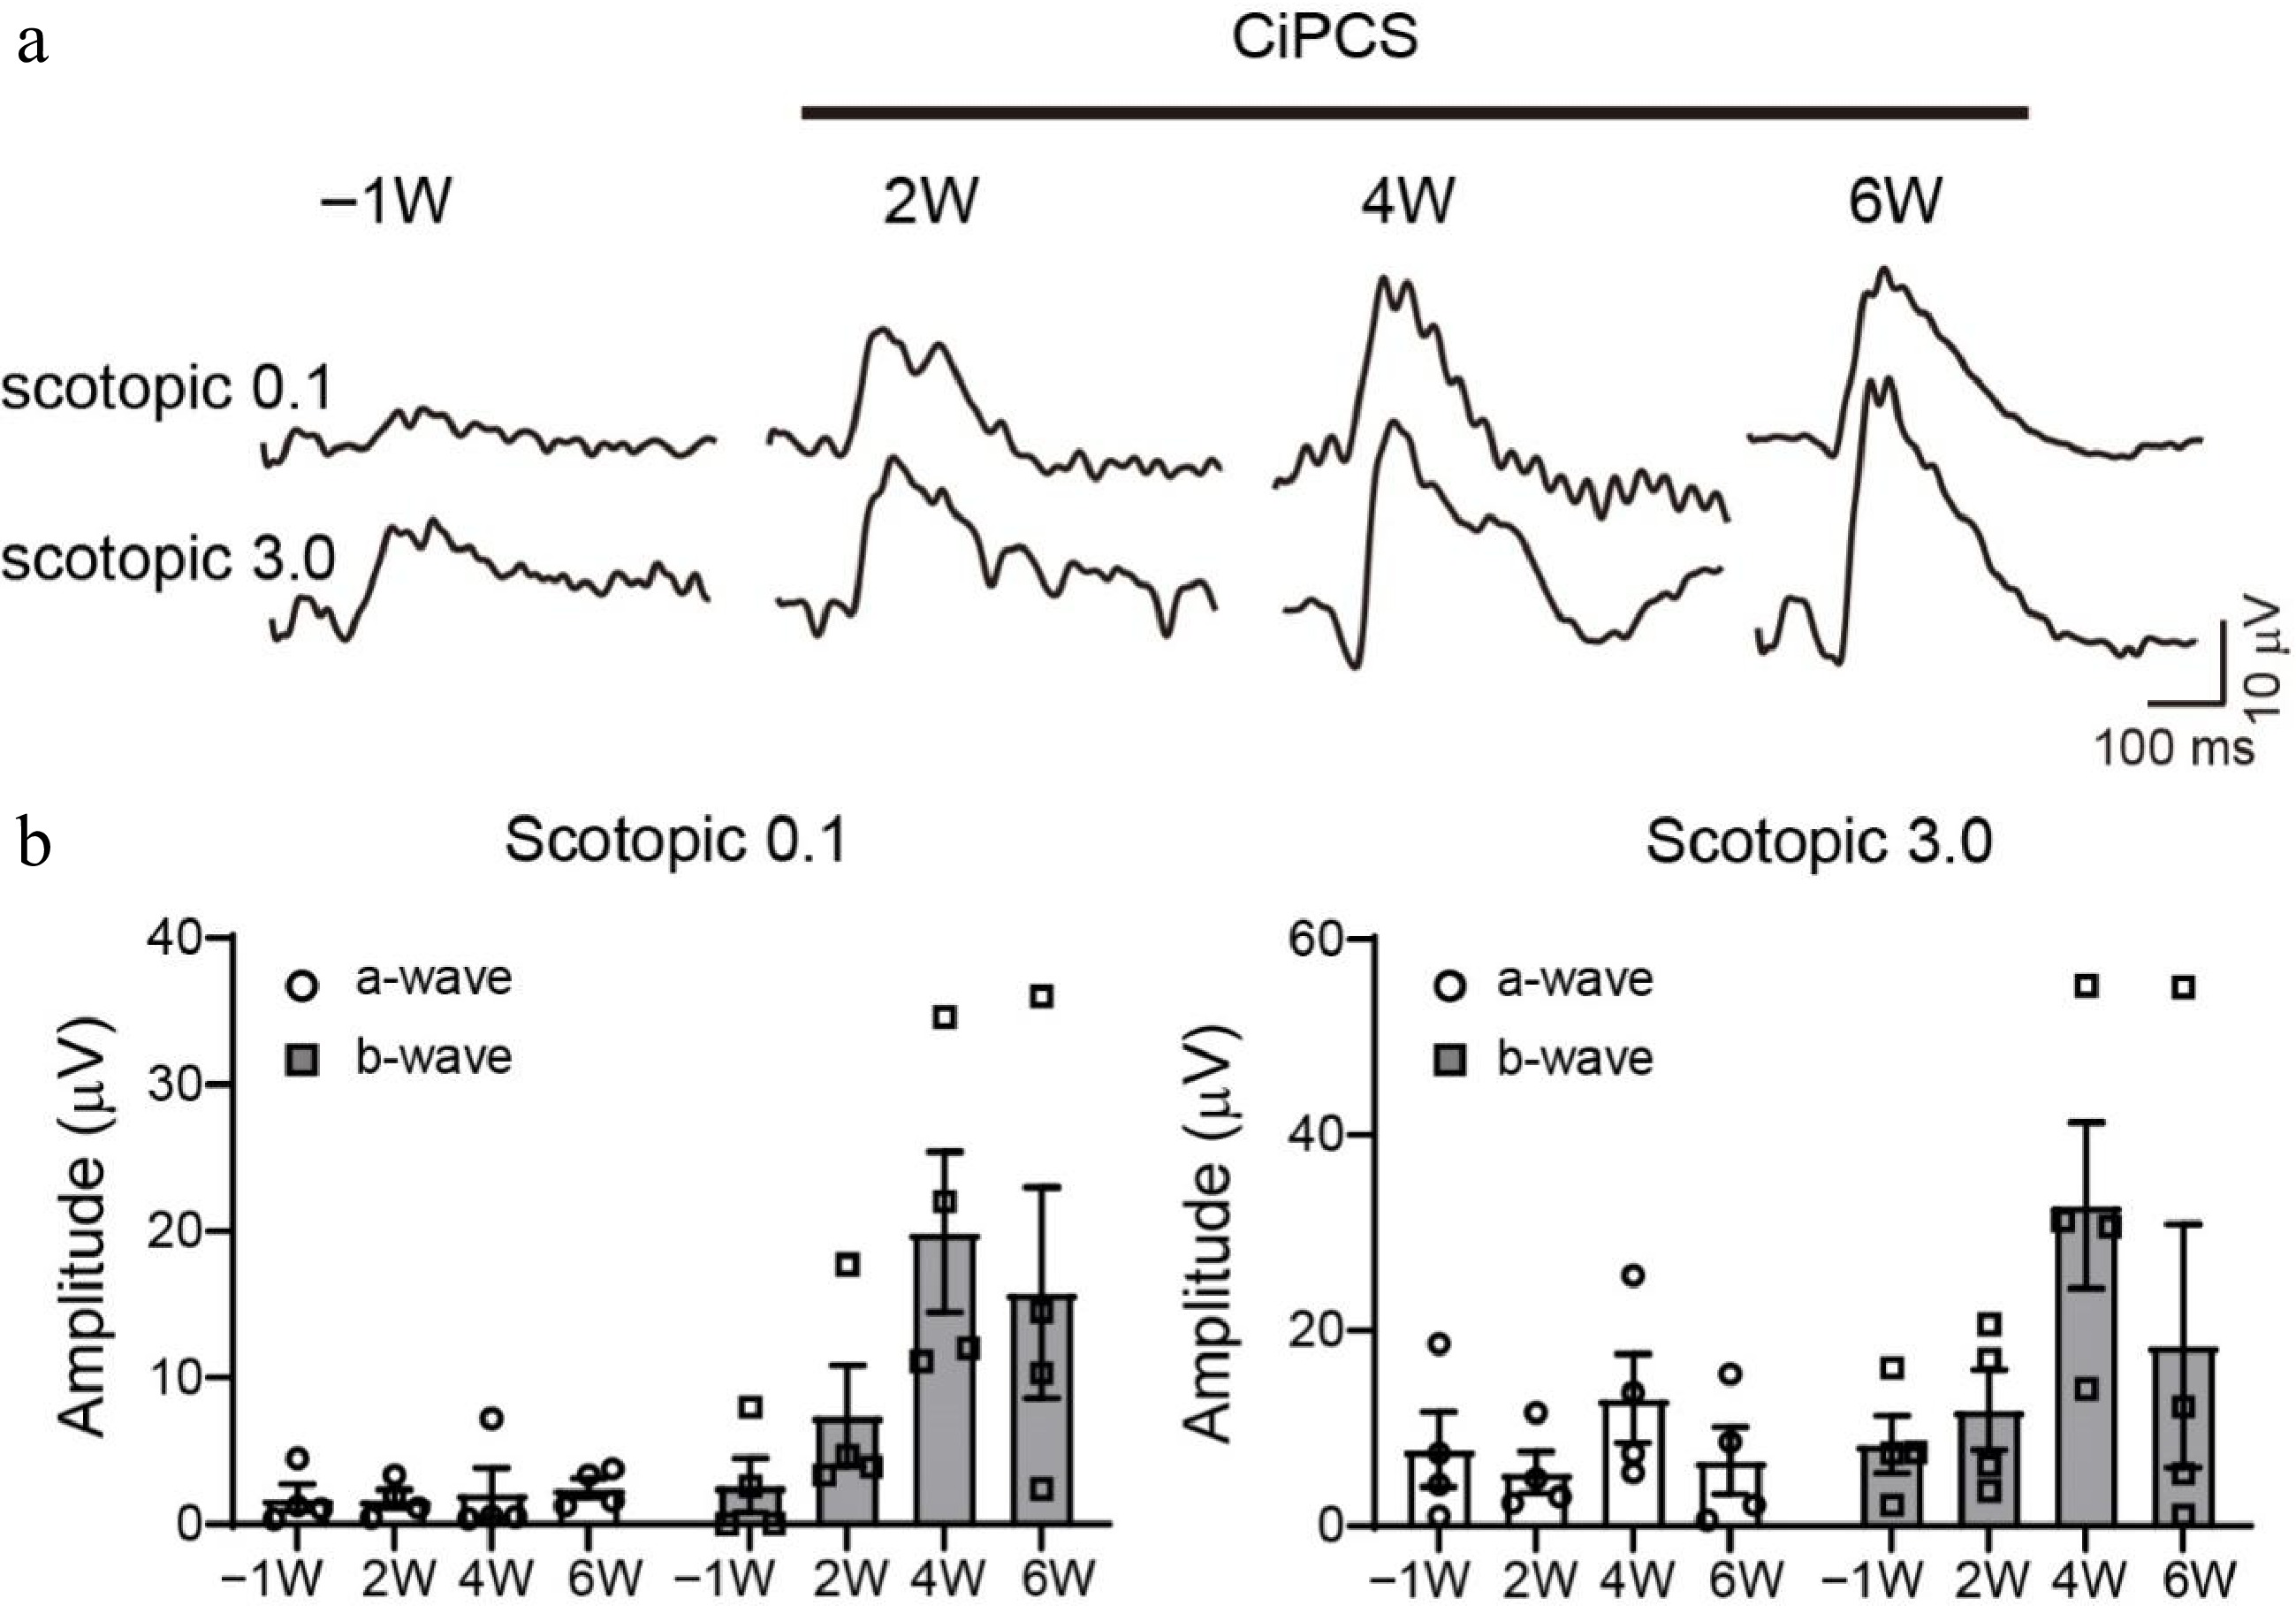
Figure 4.
Time course of retinal light responses of MNU-injured mice after CiPC-treatment. (a) Example ERG traces of a CiPC-treated mouse. (b) Average amplitude of a-, b-waves under scotopic 0.1 (left) and 3.0 cd/m2 (right) of four light responsive mice after CiPC-treatment over time.
Figures
(4)
Tables
(0)