-
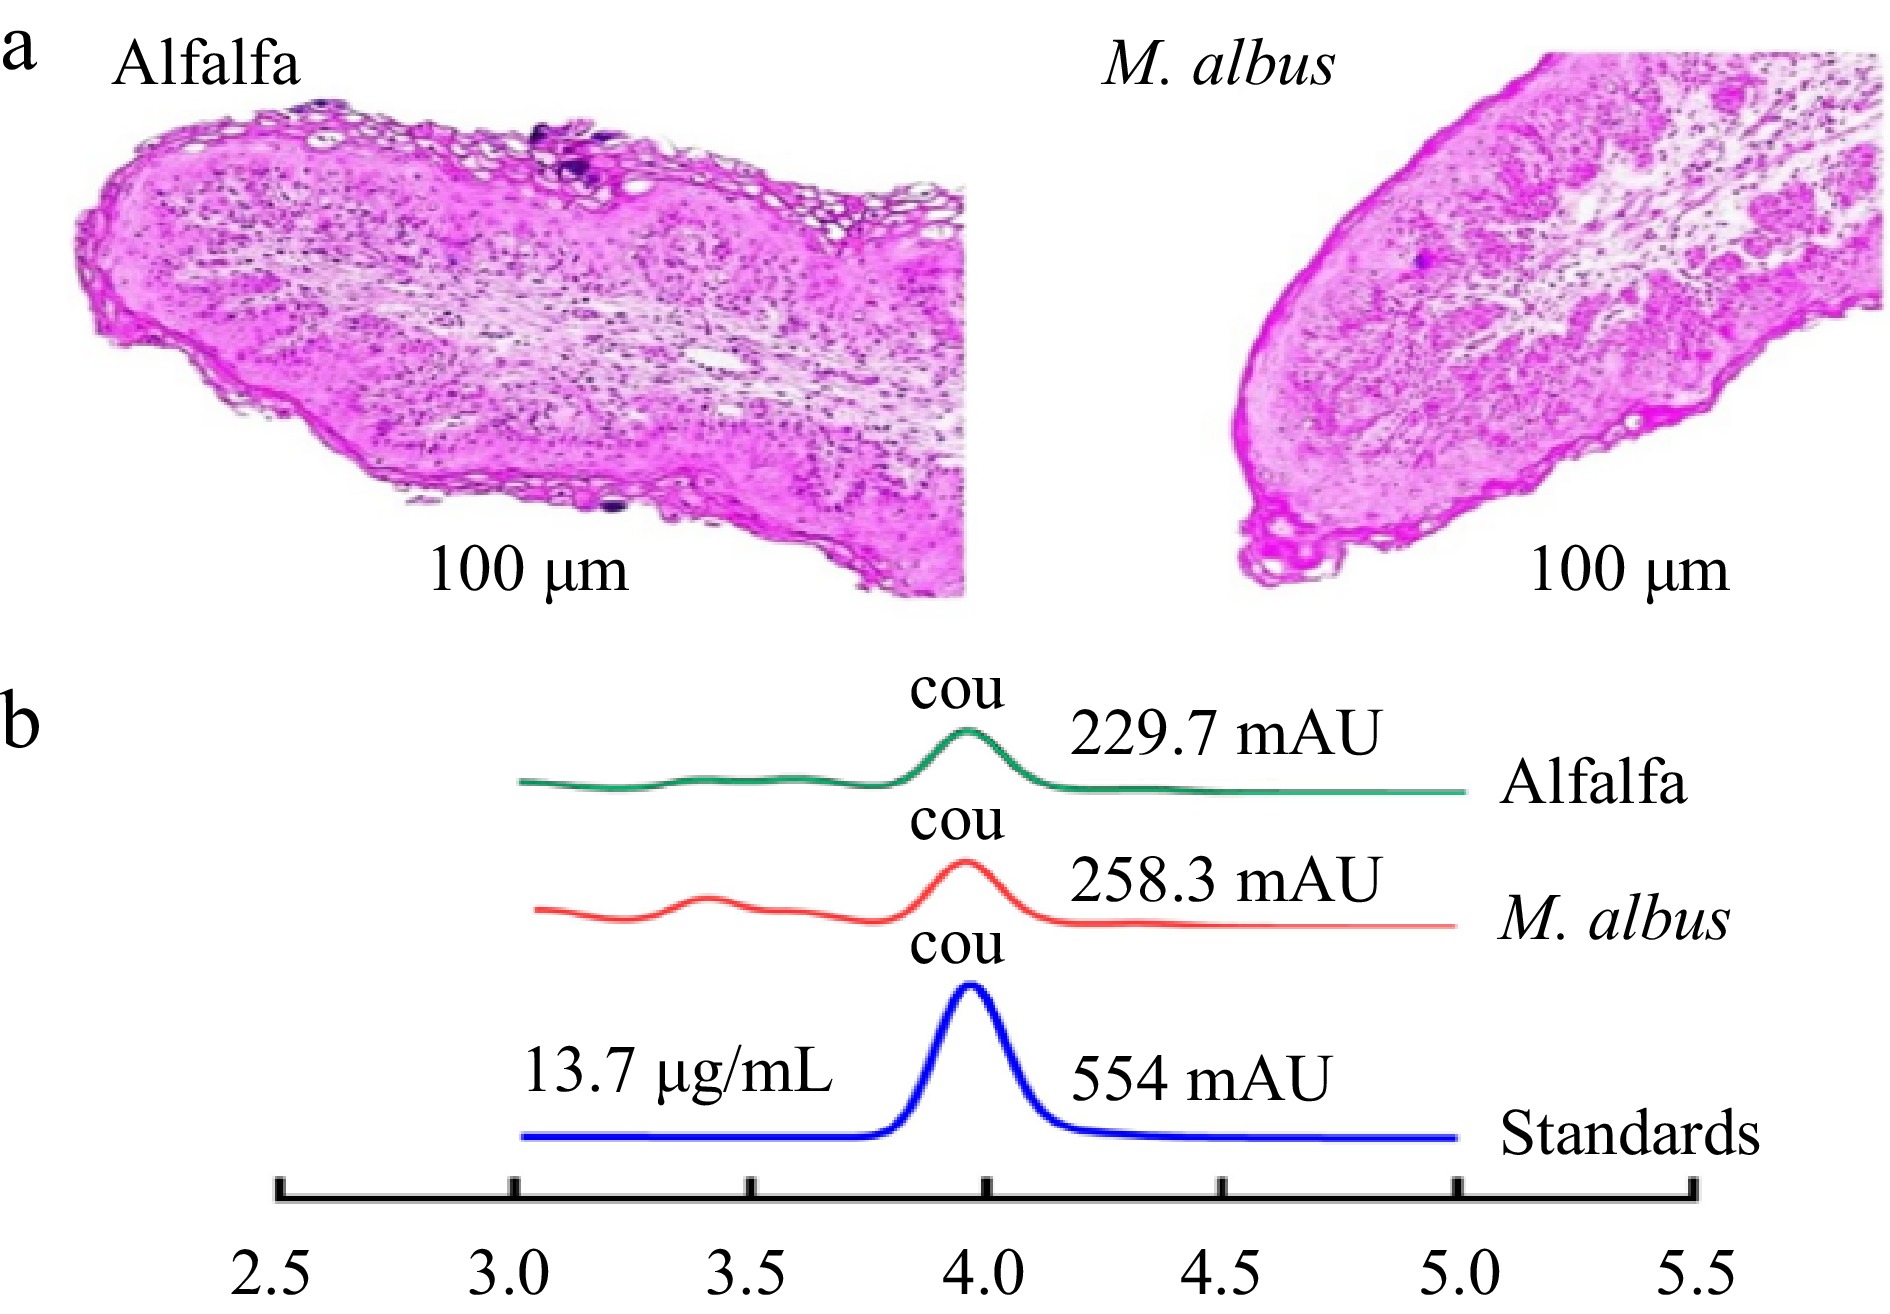
Figure 1.
(a) Tissue morphology of rumen epithelial papillae under optical microscope; (b) Peak coumarin in rumen fluid. (Peak coumarin at 4 min, COU: coumarin, Standard coumarin=13.7 µg/mL).
-
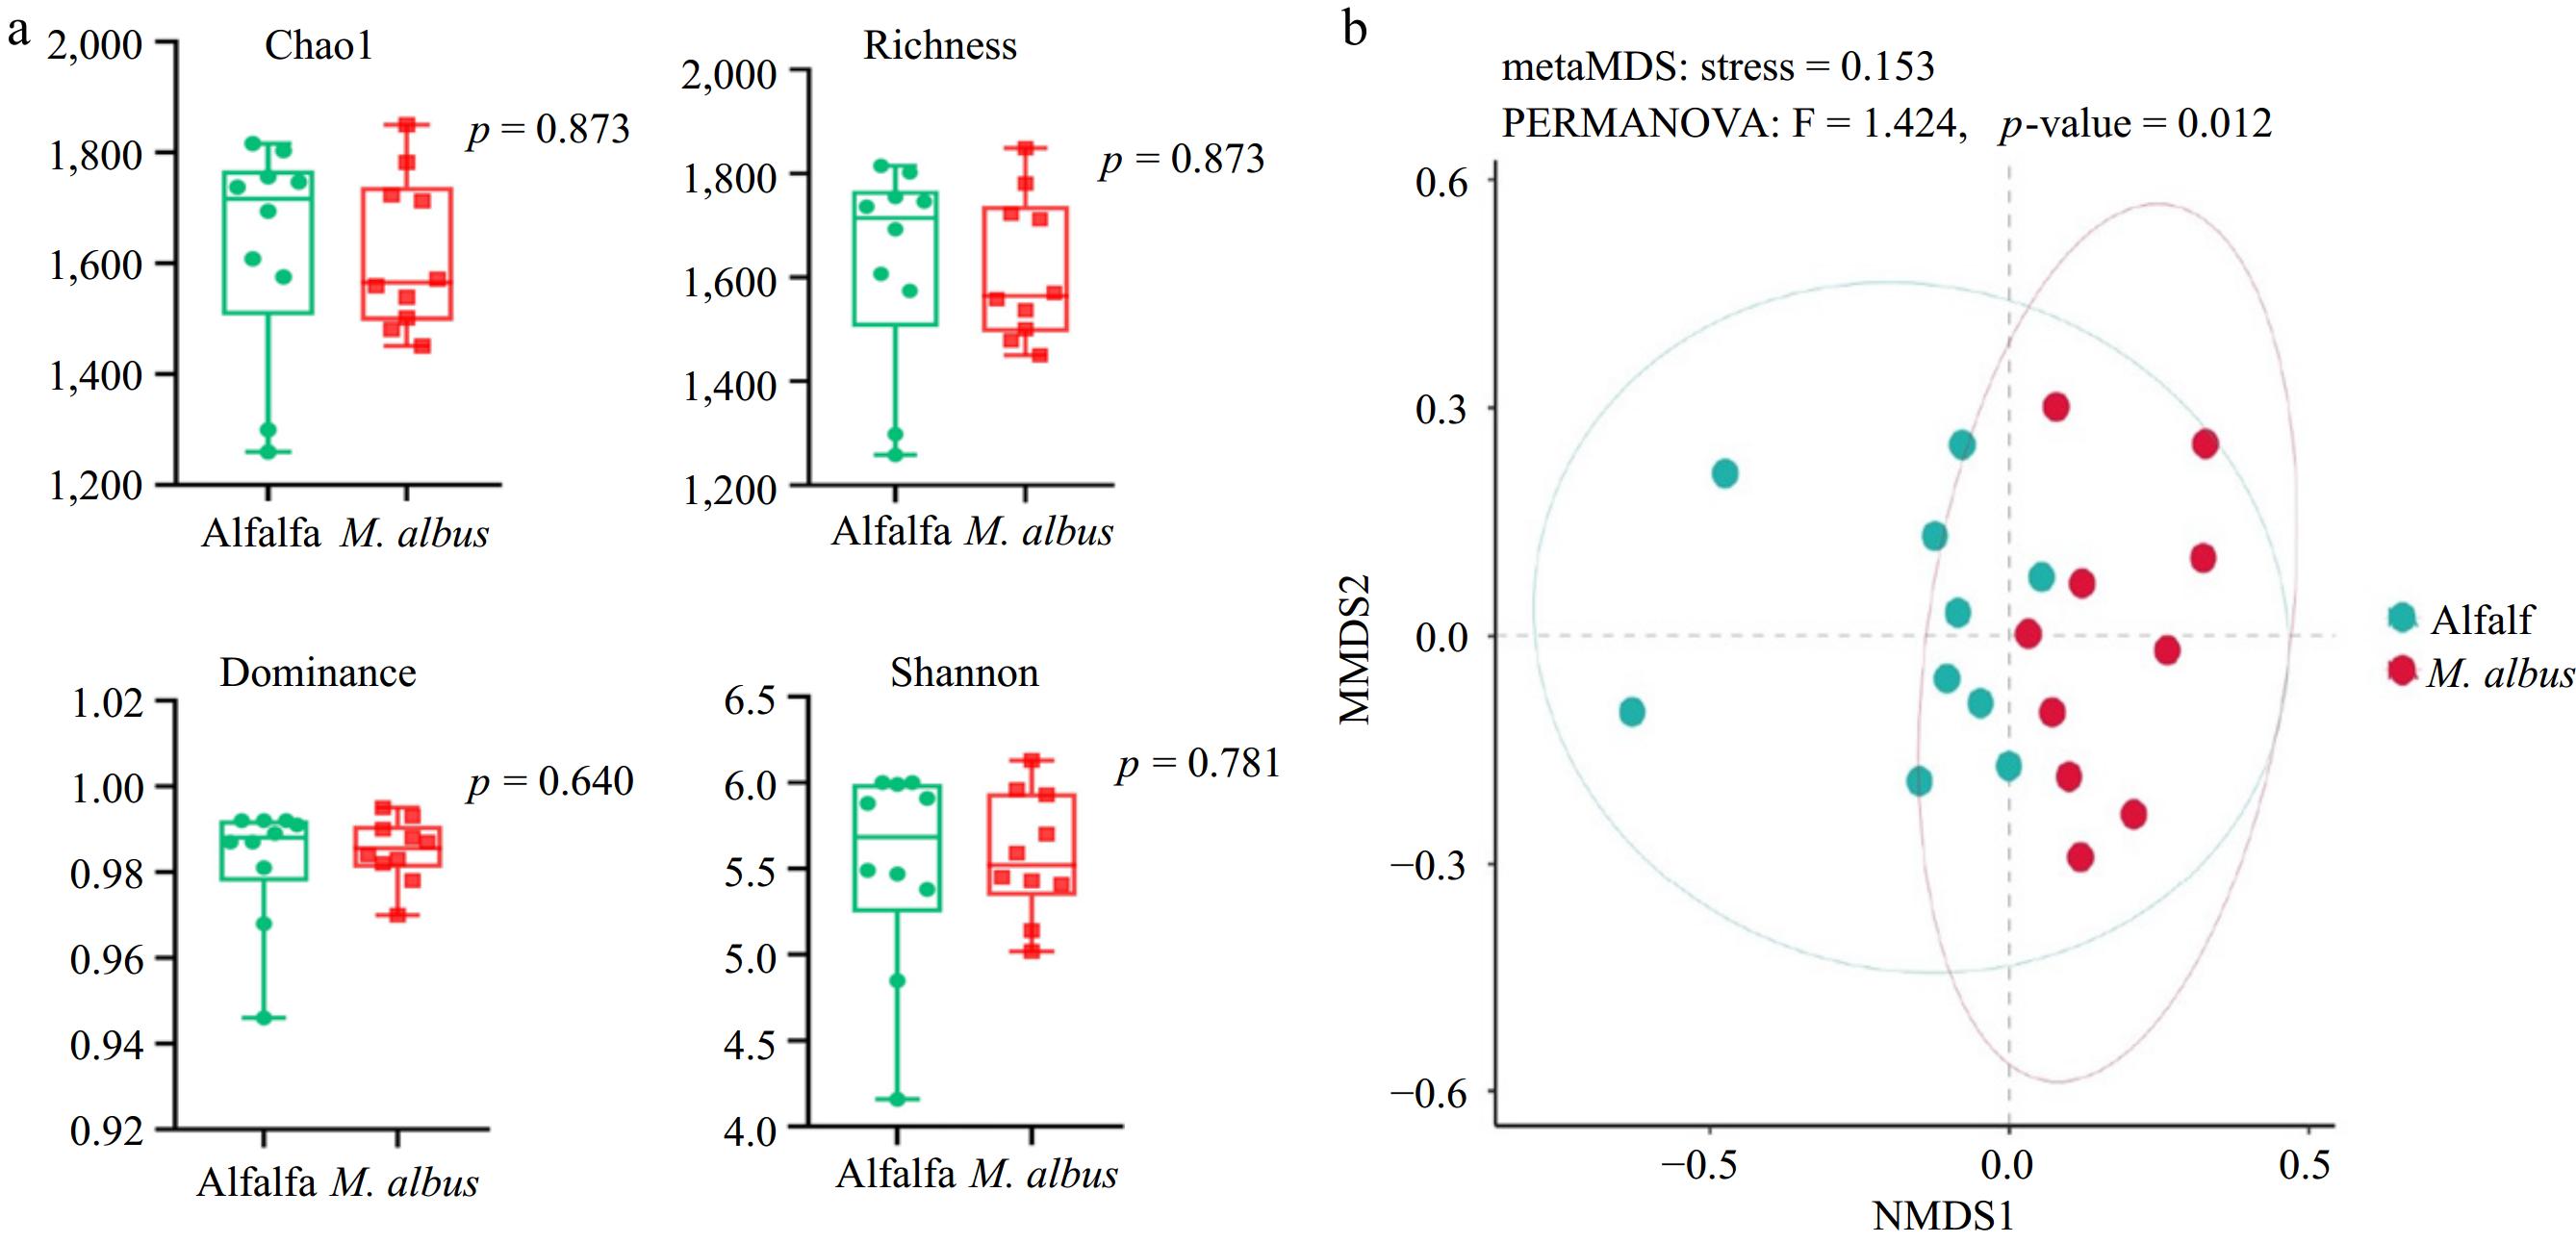
Figure 2.
(a) Effects of feeding M. albus on alpha diversity of Hu sheep. (b) Bray-Curtis NMDS results of feeding M. albus on rumen microbial diversity of Hu sheep.
-
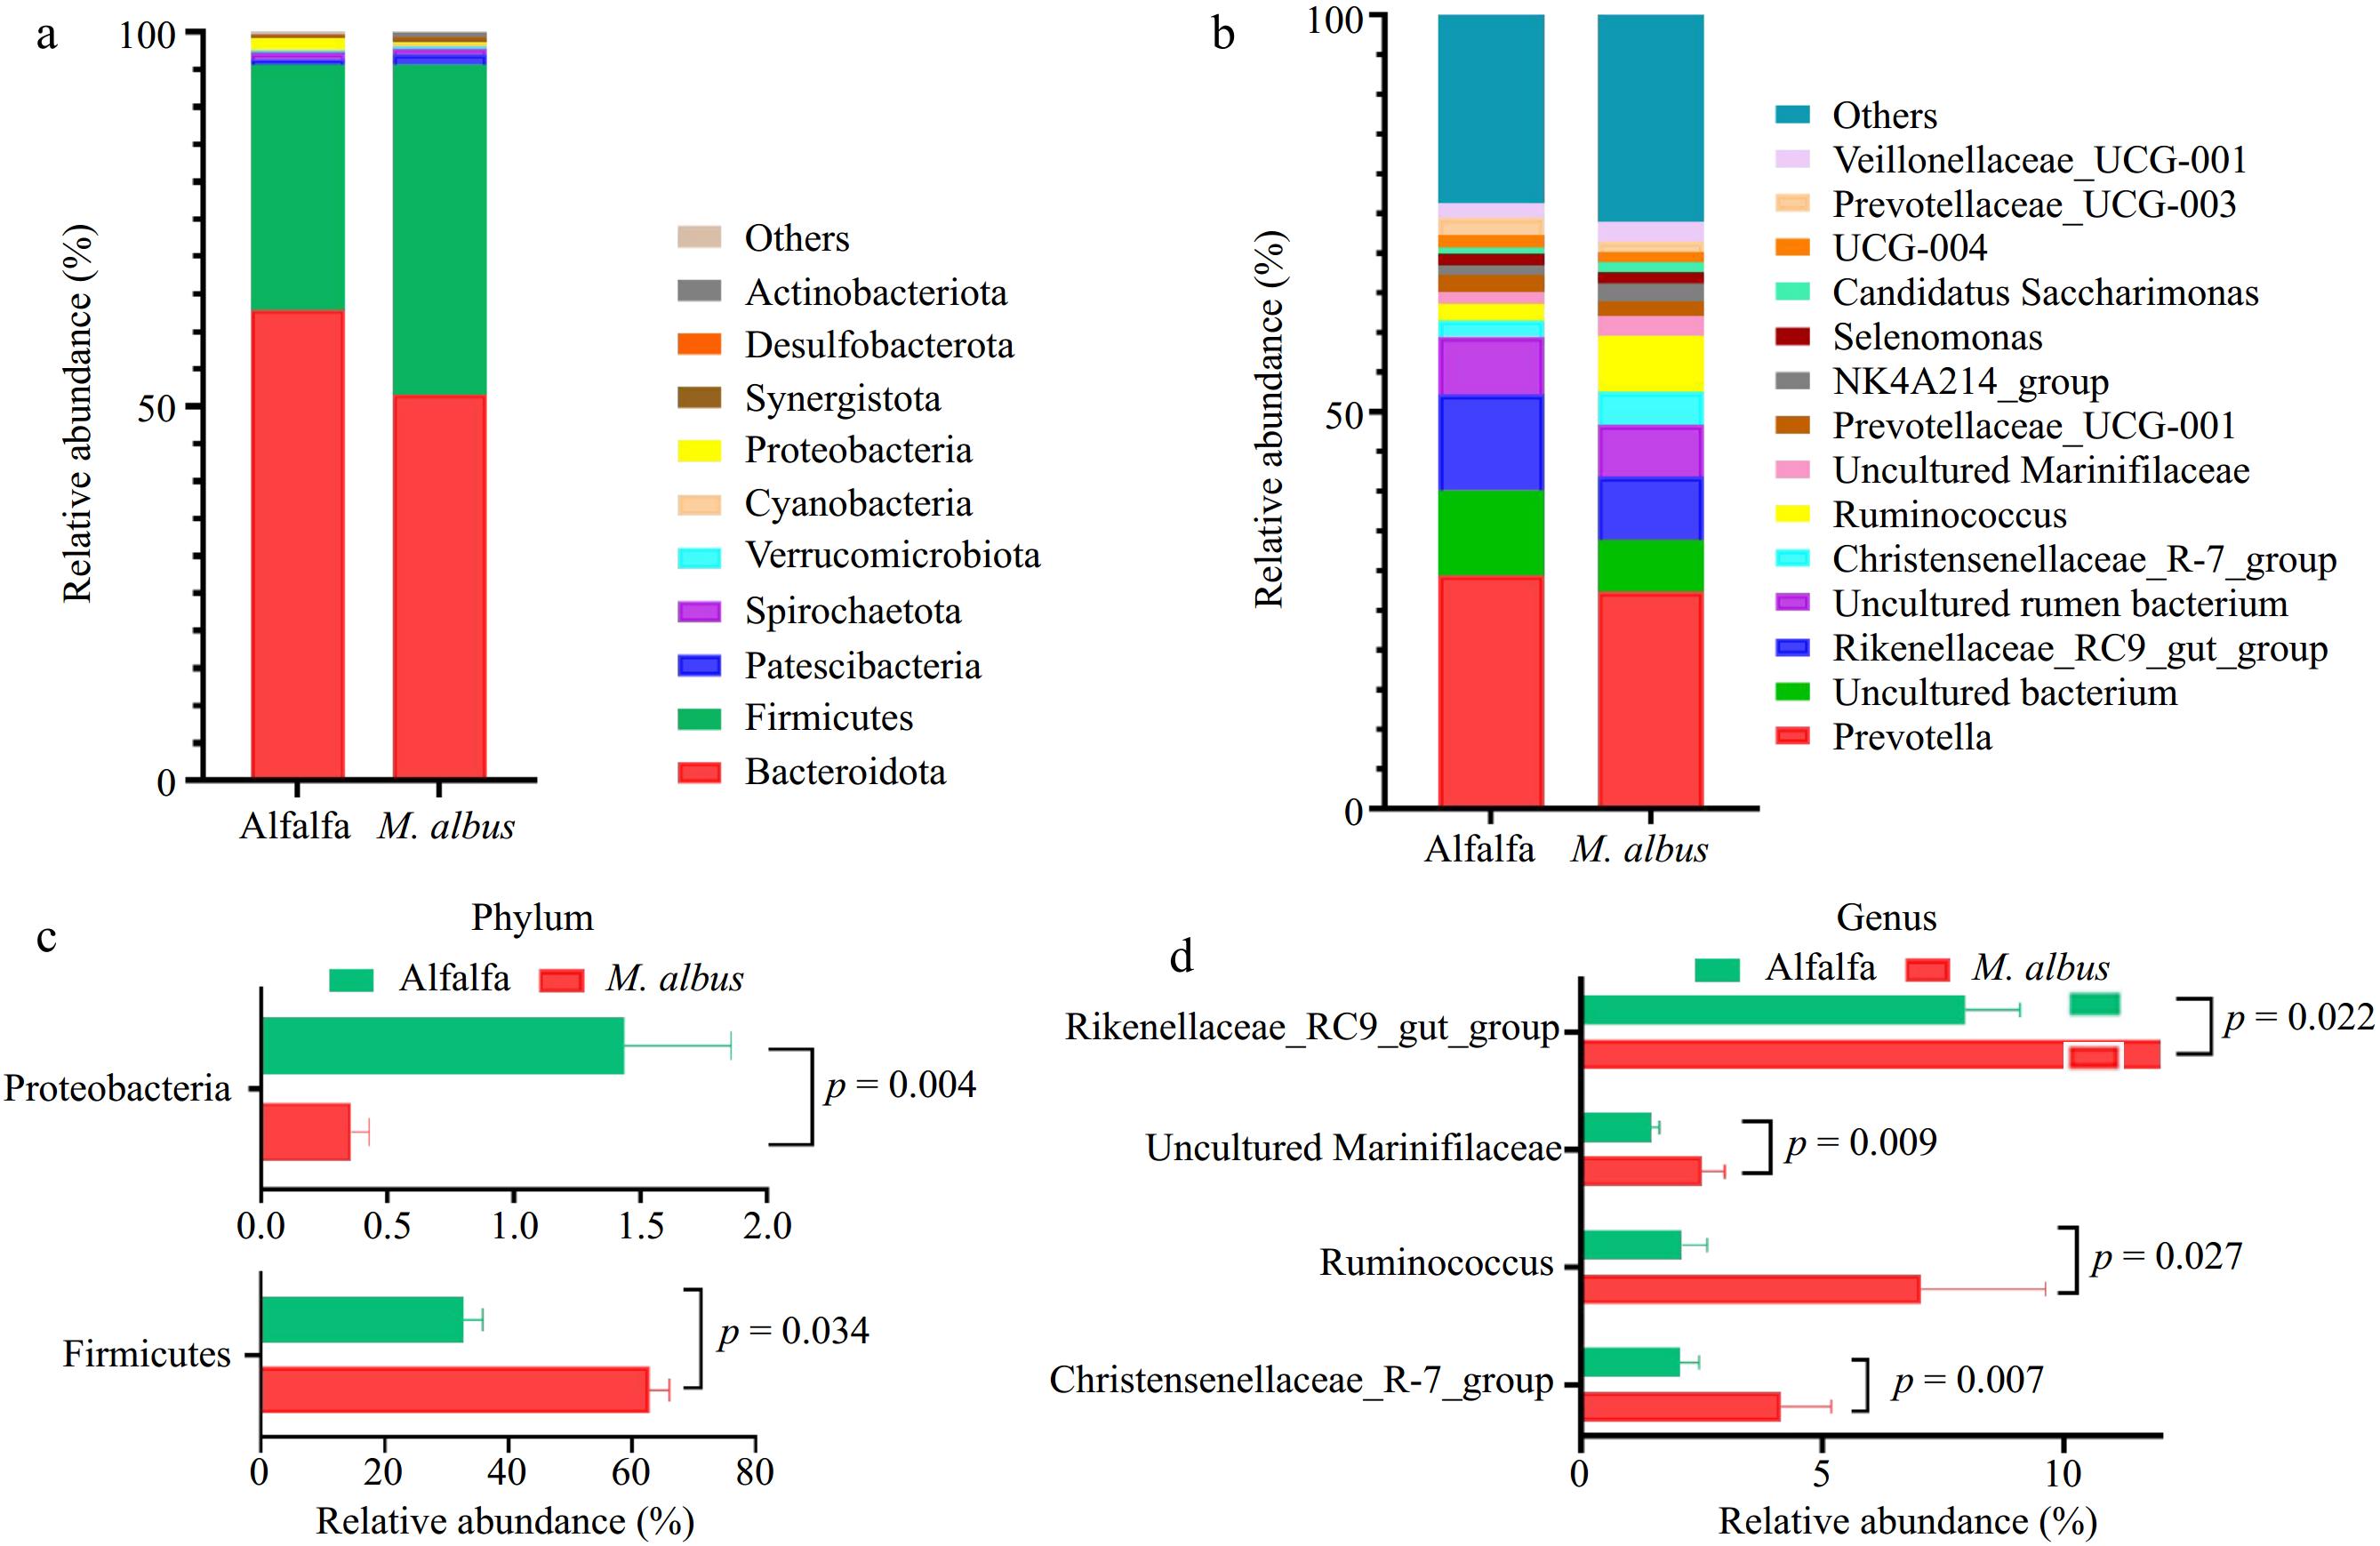
Figure 3.
Microbial diversity analysis. (a) Relative abundance at the phylum level. (b) Relative abundance at the genus level. (c), (d) Relative abundance of differential bacterial genera analyzed by LEfSe.
-
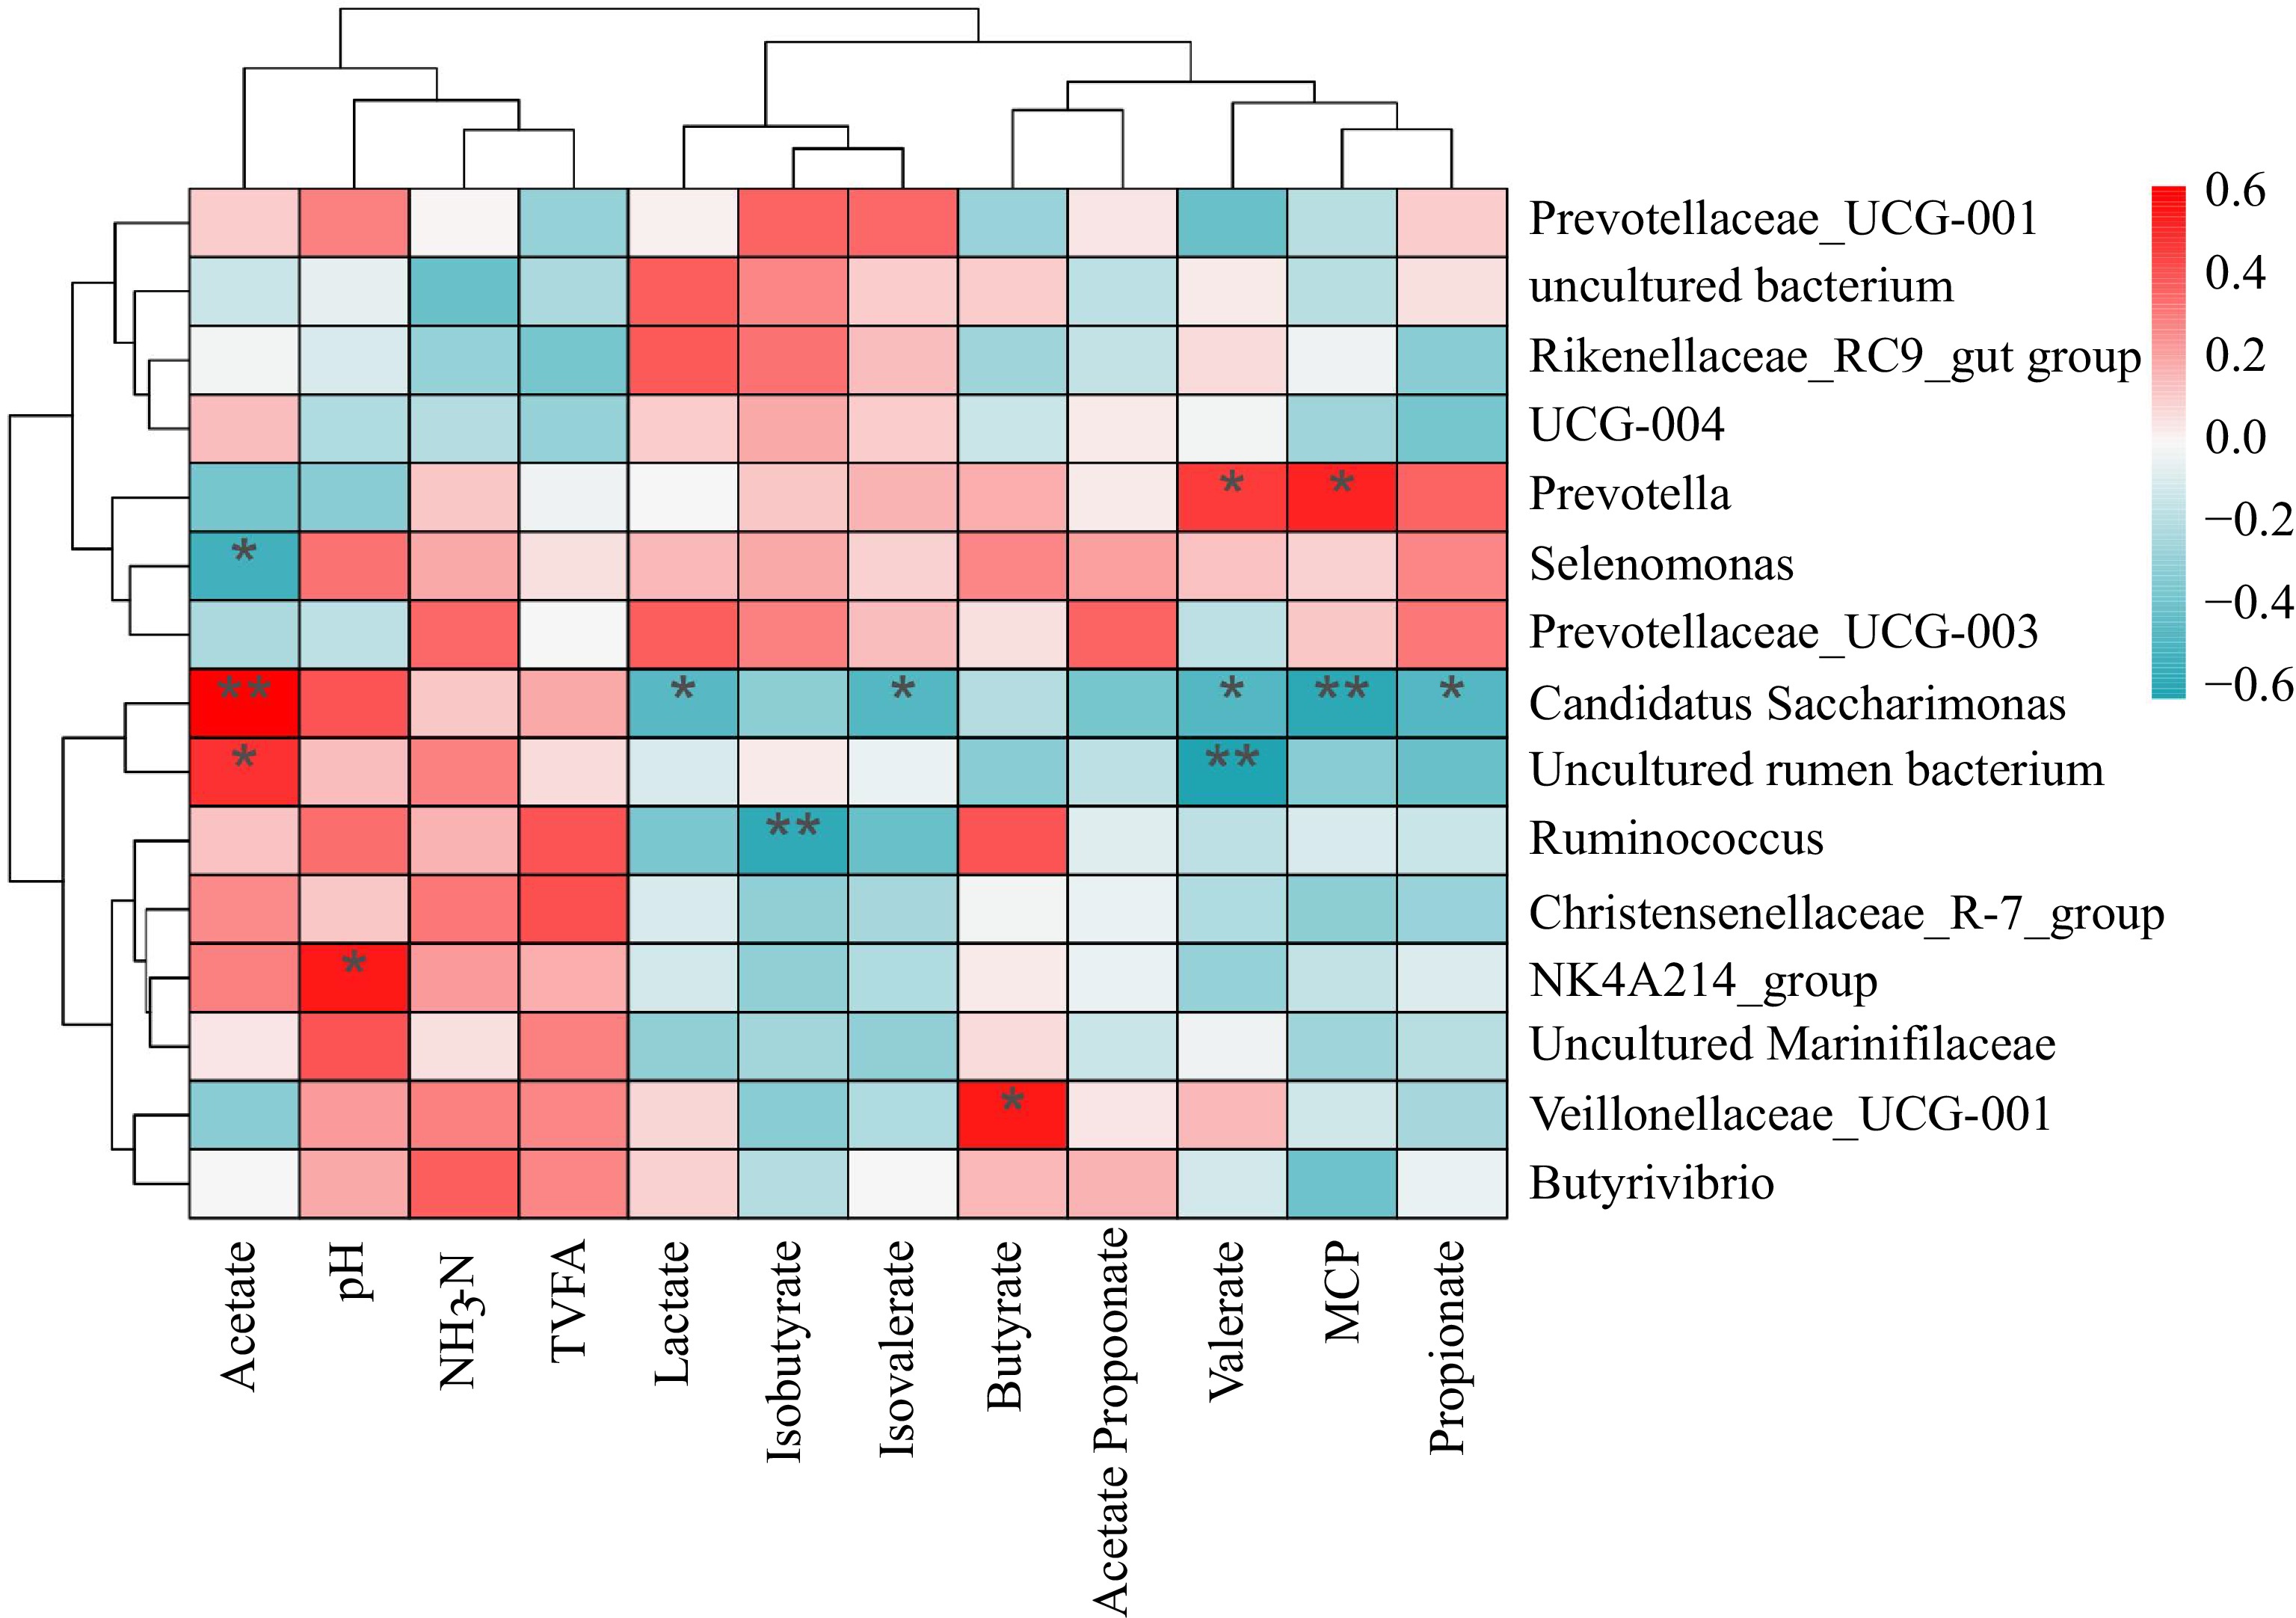
Figure 4.
Heatmap of correlation between microbial genera and fermentation parameters. Note: Red represents positive correlation, blue represents negative correlation, * indicates p < 0.05, ** indicates p < 0.01.
-
Alfalfa M. albus Nutrient composition Corn 29.85 20.70 Alfalfa 30.00 0 M. albus 0 30.00 Wheat straw 20.00 20.00 Wheat bran 5.00 7.30 Soybean meal 9.50 9.20 Premix 2.00 2.00 DCP 1.15 3.50 Zeolite 0.50 2.69 Salt 1.00 1.00 CGM 0.00 2.61 Baking soda 2.00 2.00 Total 100 100 Nutrient composition ME (MJ/kg) 8.53 8.59 CP (%) 14.13 14.24 NDF (%) 32.43 32.14 ADF (%) 49.46 41.59 Calcium (%) 1.19 2.53 Phosphorus (%) 0.52 1.53 * Each kg of premix contains vit. A; 150−600 KIU, vit. D2; 30−100 KIU, vit. E; 600 IU, Vit. B; 12,000 g, vit. B; 225 mg, vit. B 625 mg, vit. B 1,230 g, niacinamide 100 mg, Manganese 1.0−3.6 g, vit. B; 1,230 g. Zinc 1.0-3.6 g, copper 0.1−0.8 g, iron 3.0−18.0 g, Selenium 5.0−12.0 mg, cobalt 3.0−50.0 mg, iodine 1.0−250.0 mg, total phosphorus 1.0%−5.0%, calcium 3.0%−25.0%, sodium chloride 6.0%−30.0%. * DCP, dibasic calcium phosphate; CGM, corn gluten meal; ME, metabolic energy; CP, crude protein; NDF, neutral detergent fiber; ADF, acid detergent fiber. Table 1.
Dietary composition and nutrient composition (dry matter basis).
-
Item Group p value Alfalfa M. albus Initial body weight (kg) 27.70 ± 1.10 28.26 ± 1.08 0.719 Final body weight (kg) 40.78 ± 0.75 38.59 ± 0.65 0.042 Body weight gain (kg) 13.08 ± 0.45 10.33 ± 0.78 0.009 ADWG (kg/d) 0.16 ± 0.02 0.13 ± 0.03 0.009 DMI (kg) 1.12 ± 0.02 1.06 ± 0.02 0.044 Total feed intake (kg) 104.48 ± 7.03 98.88 ± 4.36 0.039 F/G 6.93 ± 0.27 8.59 ± 0.60 0.028 Dry matter (%) 0.75 ± 0.03 0.73 ± 0.04 0.160 Crude ash (%) 0.84 ± 0.04 0.81 ± 0.077 0.263 Crude protein (%) 0.74 ± 0.02 0.70 ± 0.02 0.002 NDF (%) 0.52 ± 0.04 0.41 ± 0.05 0.001 ADF (%) 0.55 ± 0.03 0.41 ± 0.03 0.001 ADWG = average daily weight gain, DMI = dry matter intake, F/G = DMI/ADWG, NDF = Neutral detergent fiber, ADF = Acid detergent fiber. Table 2.
Effects of feeding M. albus on the growth performance and apparent digestible energy of Hu sheep.
-
Item Groups Alfalfa M. albus Total gain (kg) 13.08 10.33 Total feed intake (kg) 104 98 Feed cost (RMB)* 416.00 310.66 Gain price (RMB)** 654.00 516.50 Net revenue*** 238.00 205.84 Relative profit (%)**** 100 86.48 * = Total feed intake × price (the price of 1 kg diet was 4.0 RMB / alfalfa, and 3.17 RMB / M. albus). ** = Total gain × 50 (1 kg 50 RMB). *** = Gain price – Feed cost. **** = Net revenue for treatment / Net revenue for control × 100, according to Kamal et al.[67]. Table 3.
Input/output analysis and economic efficiency of experimental groups.
-
Item Group p value Alfalfa M. albus Final body weight (kg) 40.78 ± 0.75 38.59 ± 0.65 0.042 Carcass weight (kg) 21.02 ± 0.46 18.62 ± 0.32 0.001 Dressing percentage* (%) 42.05 ± 0.04 39.19 ± 0.02 0.029 Liver proportion (%) 1.54 ± 0.03 1.38 ± 0.02 0.020 Liver weight (kg) 0.63 ± 0.01 0.54 ± 0.01 0.001 Jejunum proportion (%) 2.90 ± 0.23 3.25 ± 0.14 0.232 Jejunum weight (kg) 1.19 ± 0.09 1.25 ± 0.06 0.602 Colon proportion (%) 2.64 ± 0.13 2.88 ± 0.08 0.144 Colon weight (kg) 1.09 ± 0.08 1.12 ± 0.05 0.763 Rumen empty proportion (%) 0.73 ± 0.02 0.64 ± 0.01 0.003 Rumen empty weight (kg) 1.78 ± 0.04 1.66 ± 0.01 0.065 * Dressing percentage (%) = Carcass weight / Final body weight. Table 4.
Effects of feeding M. albus on slaughter performance of Hu sheep.
-
Item Group p value Alfalfa M. albus SFA (%) C10:0 0.26 ± 0.05 0.24 ± 0.05 0.319 C12:0 0.30 ± 0.18 0.19 ± 0.04 0.090 C13:0 2.34 ± 0.40 2.10 ± 0.23 0.119 C14:0 4.68 ± 1.49 3.72 ± 1.06 0.113 C16:0 21.74 ± 2.32 22.27 ± 3.35 0.683 C18:0 23.34 ± 2.27 22.39 ± 2.74 0.410 MUFA (%) C14:1 0.77 ± 0.19 0.82 ± 0.12 0.440 C16:1 1.35 ± 0.49 1.67 ± 0.48 0.171 C18:1 C9 35.93 ± 2.13 37.89 ± 1.30 0.023 C20:1 0.31 ± 0.07 0.29 ± 0.09 0.585 PUFA (%) C18:2 n-6 7.72 ± 0.72 7.82 ± 0.43 0.741 C20:5 n-3 0.39 ± 0.02 0.39 ± 0.07 0.894 C20:4 n-6 0.86 ± 0.01 0.22 ± 0.08 0.001 SFA (%) 52.66 ± 2.23 50.90 ± 1.08 0.038 UFA (%) 47.34 ± 2.23 49.10 ± 1.07 0.043 MUFA (%) 38.36 ± 1.97 40.67 ± 1.60 0.004 PUFA (%) 24.08 ± 0.69 24.97 ± 0.73 0.142 SFA = saturated fatty acids, UFA = Unsaturated fatty acids, MUFA = monounsaturated fatty acids, PUFA = polyunsaturated fatty acids. Table 5.
Effects of feeding M. albus on muscle fatty acids of Hu sheep.
Figures
(4)
Tables
(5)