-
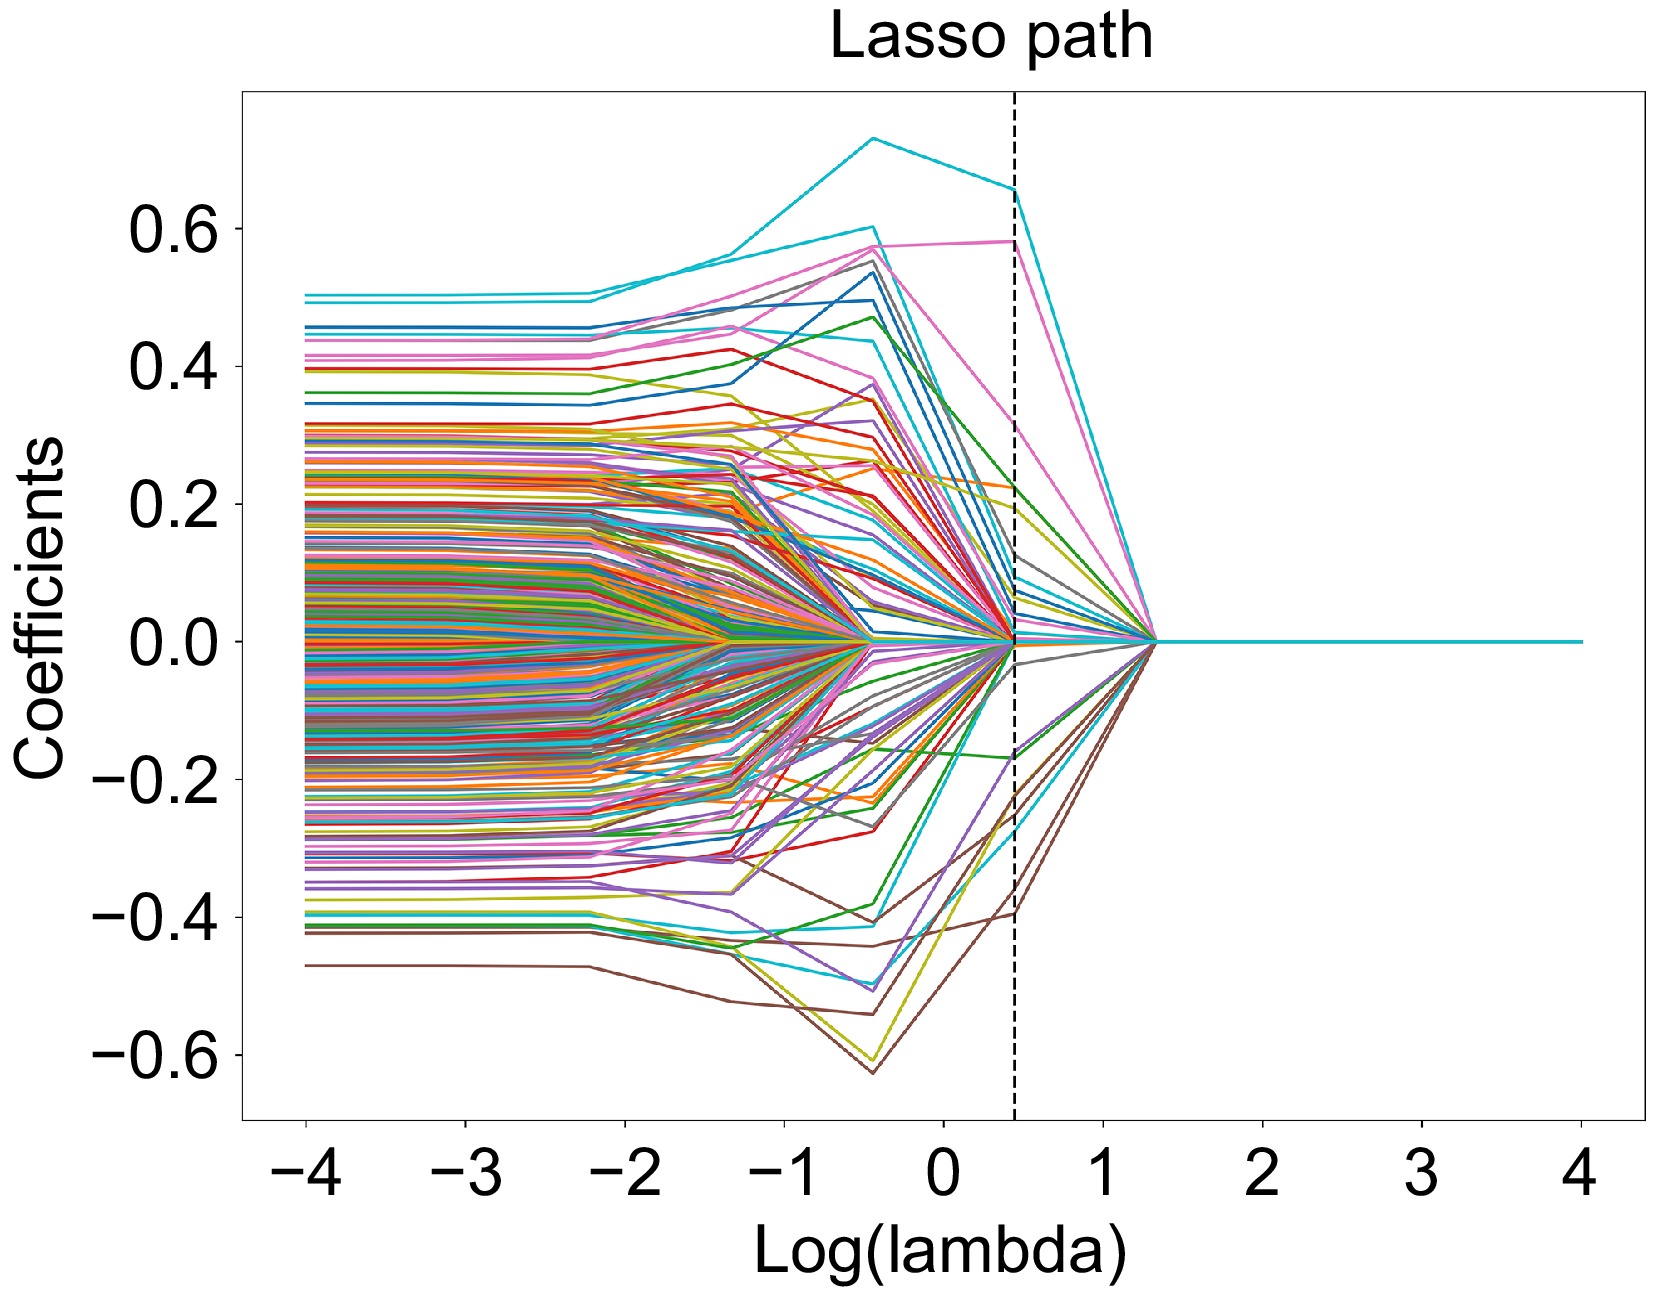
Figure 1.
The coefficient-lambda graph.
-
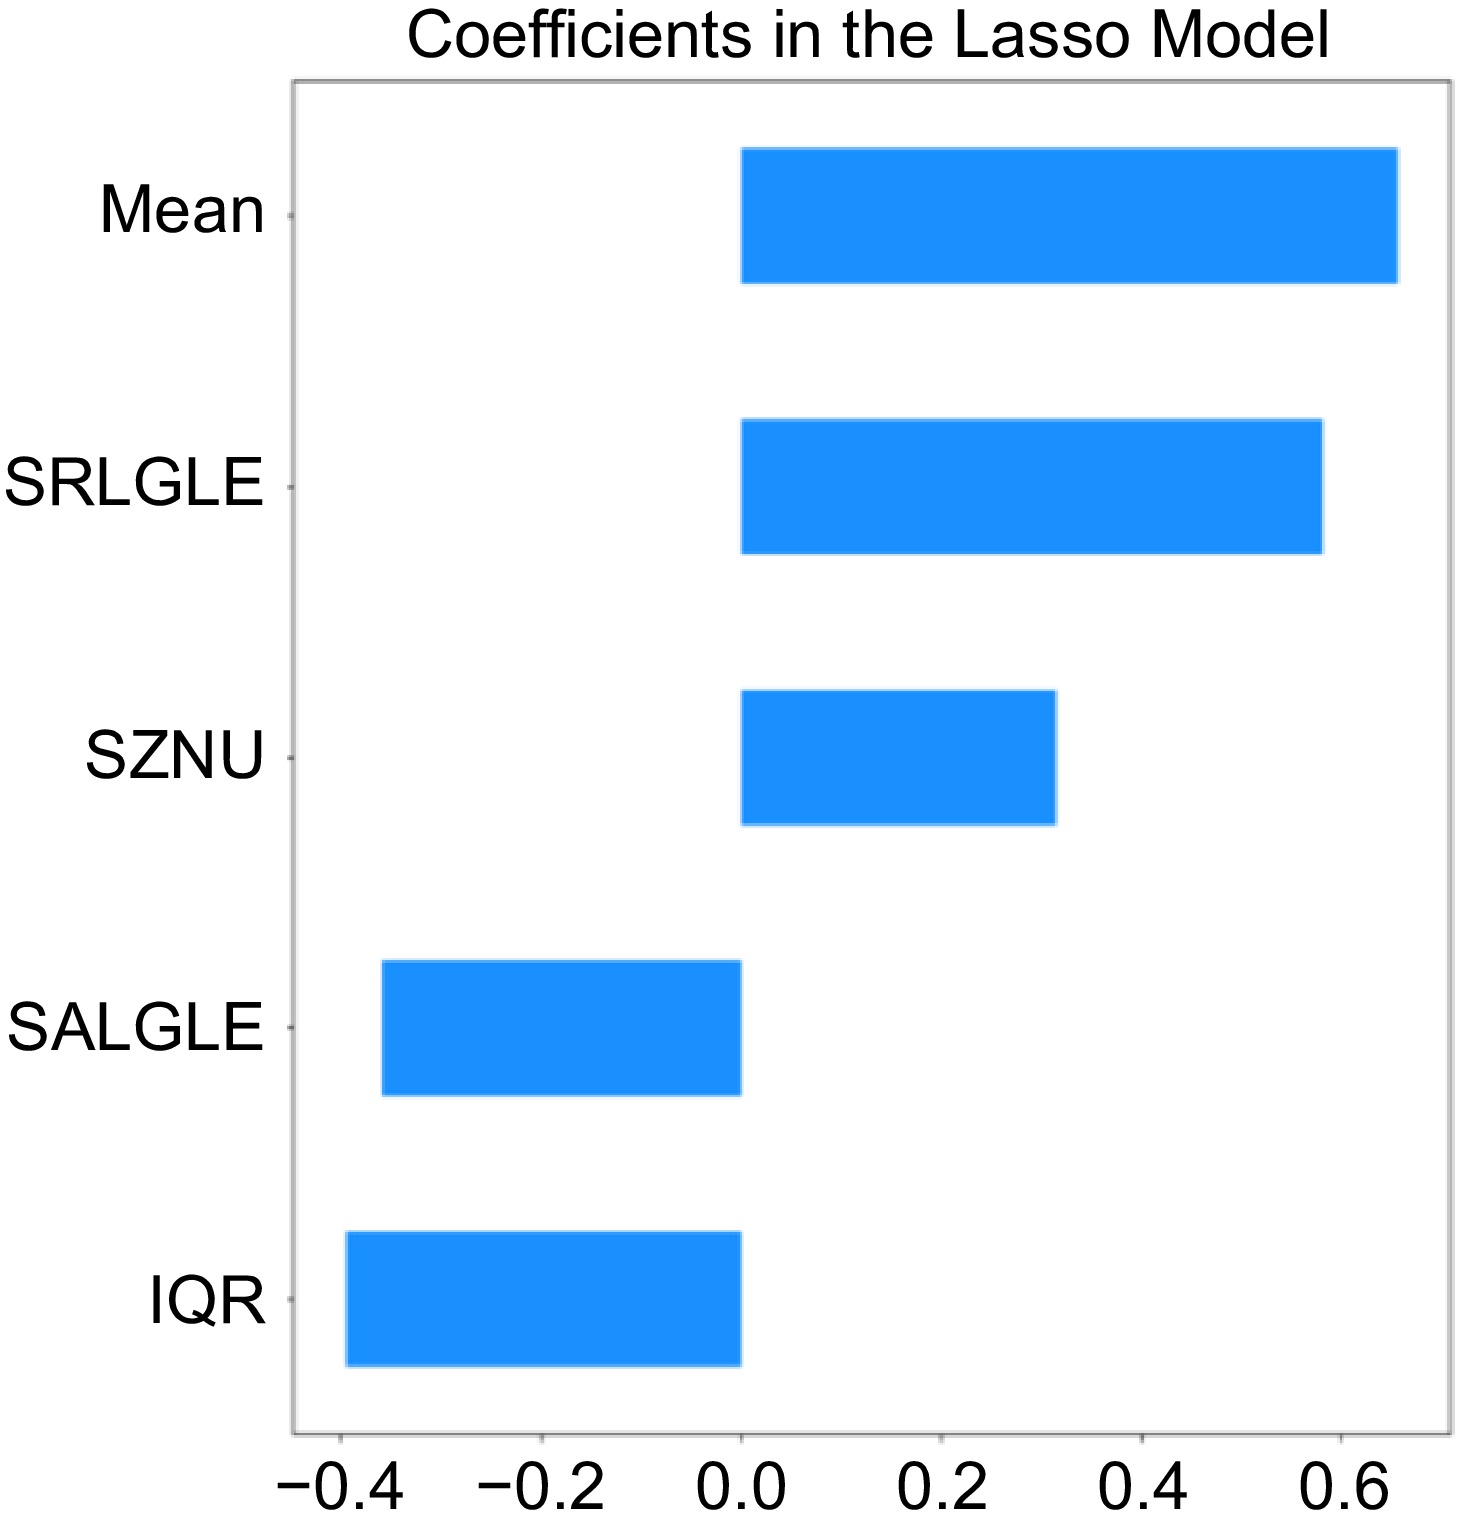
Figure 2.
The selected radiomic features and their specific gravity included in the SVM.
-
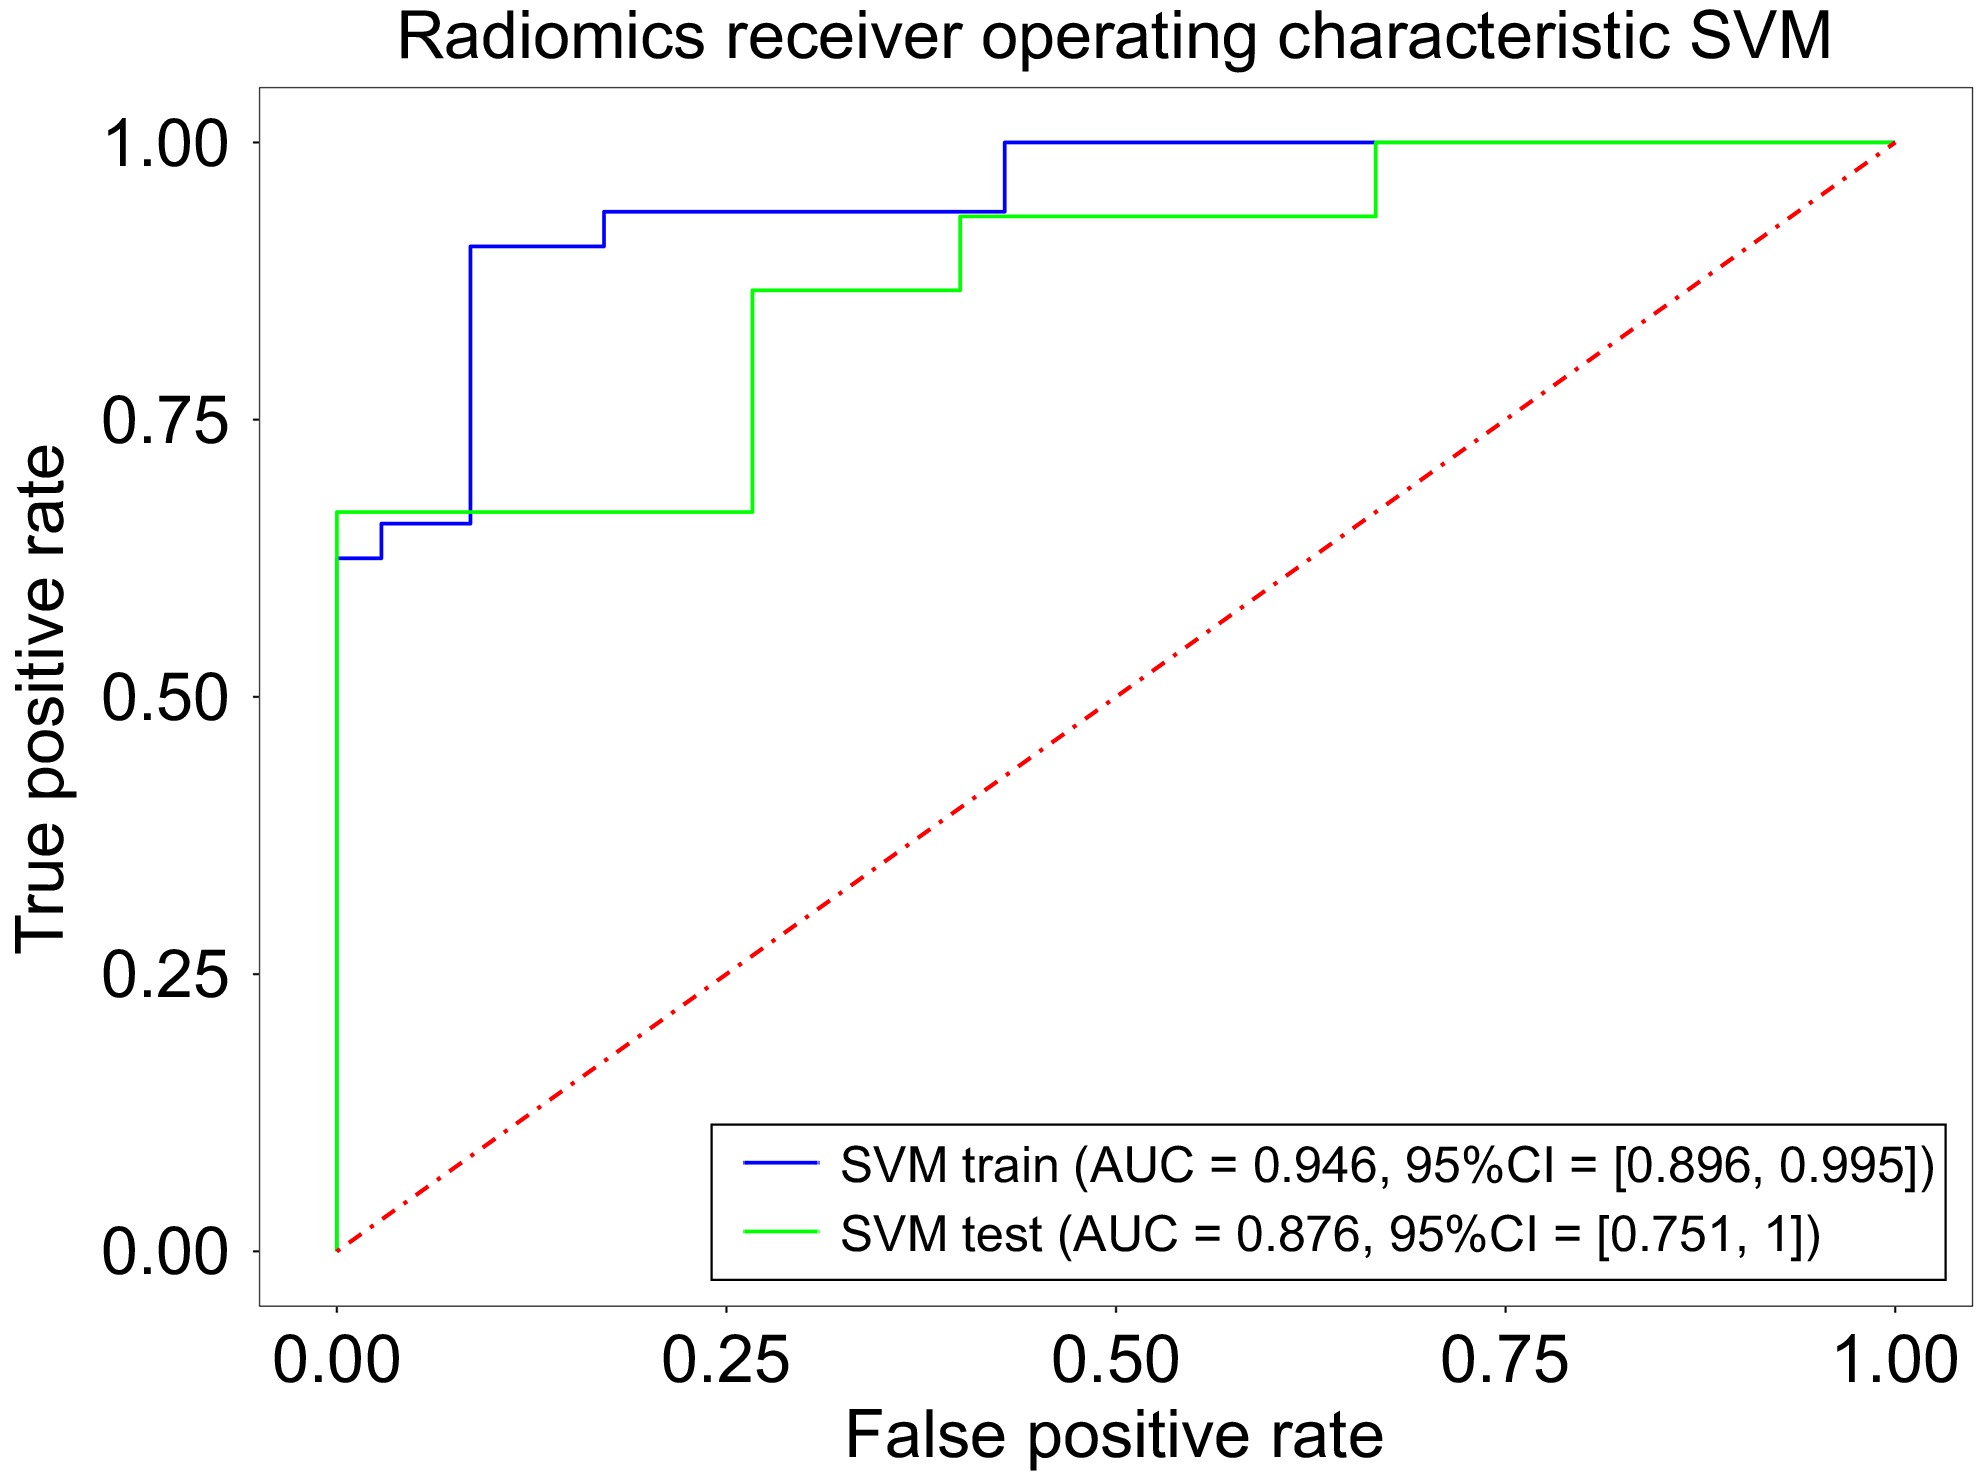
Figure 3.
The ROC curve for categorized smokers vs nonsmokers.
-
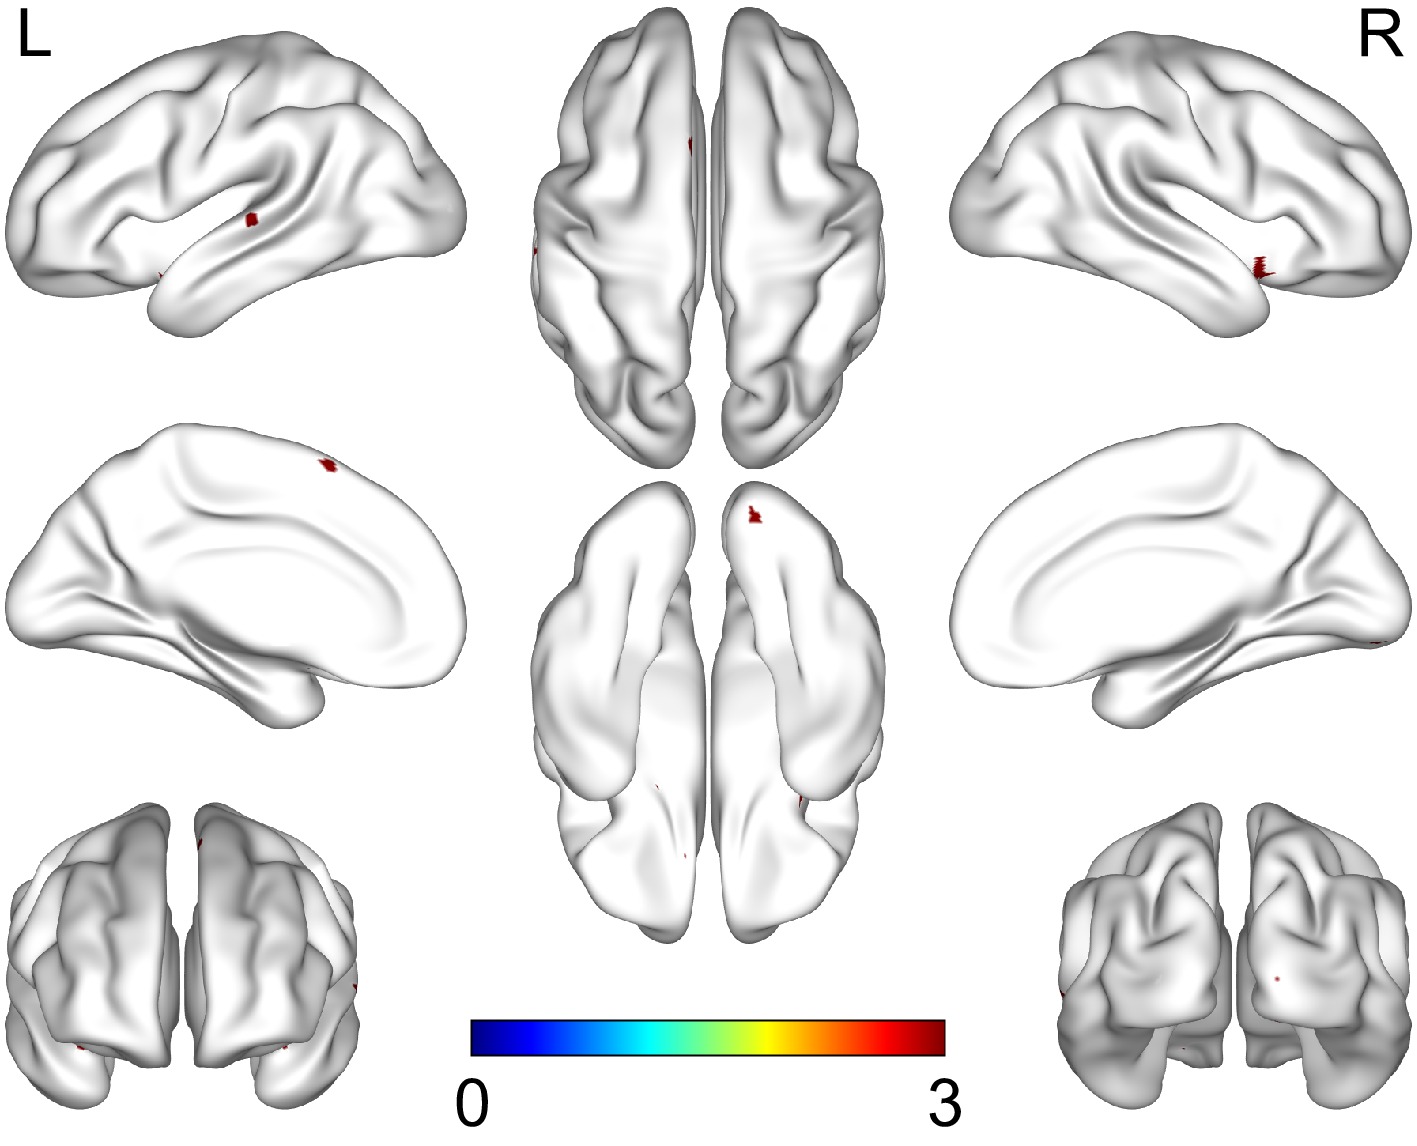
Figure 4.
Group differences in seed-based resting-state FC. The results were corrected for multiple comparisons (voxelwise p < 0.05, family-wise error [FWE] corrected).
-
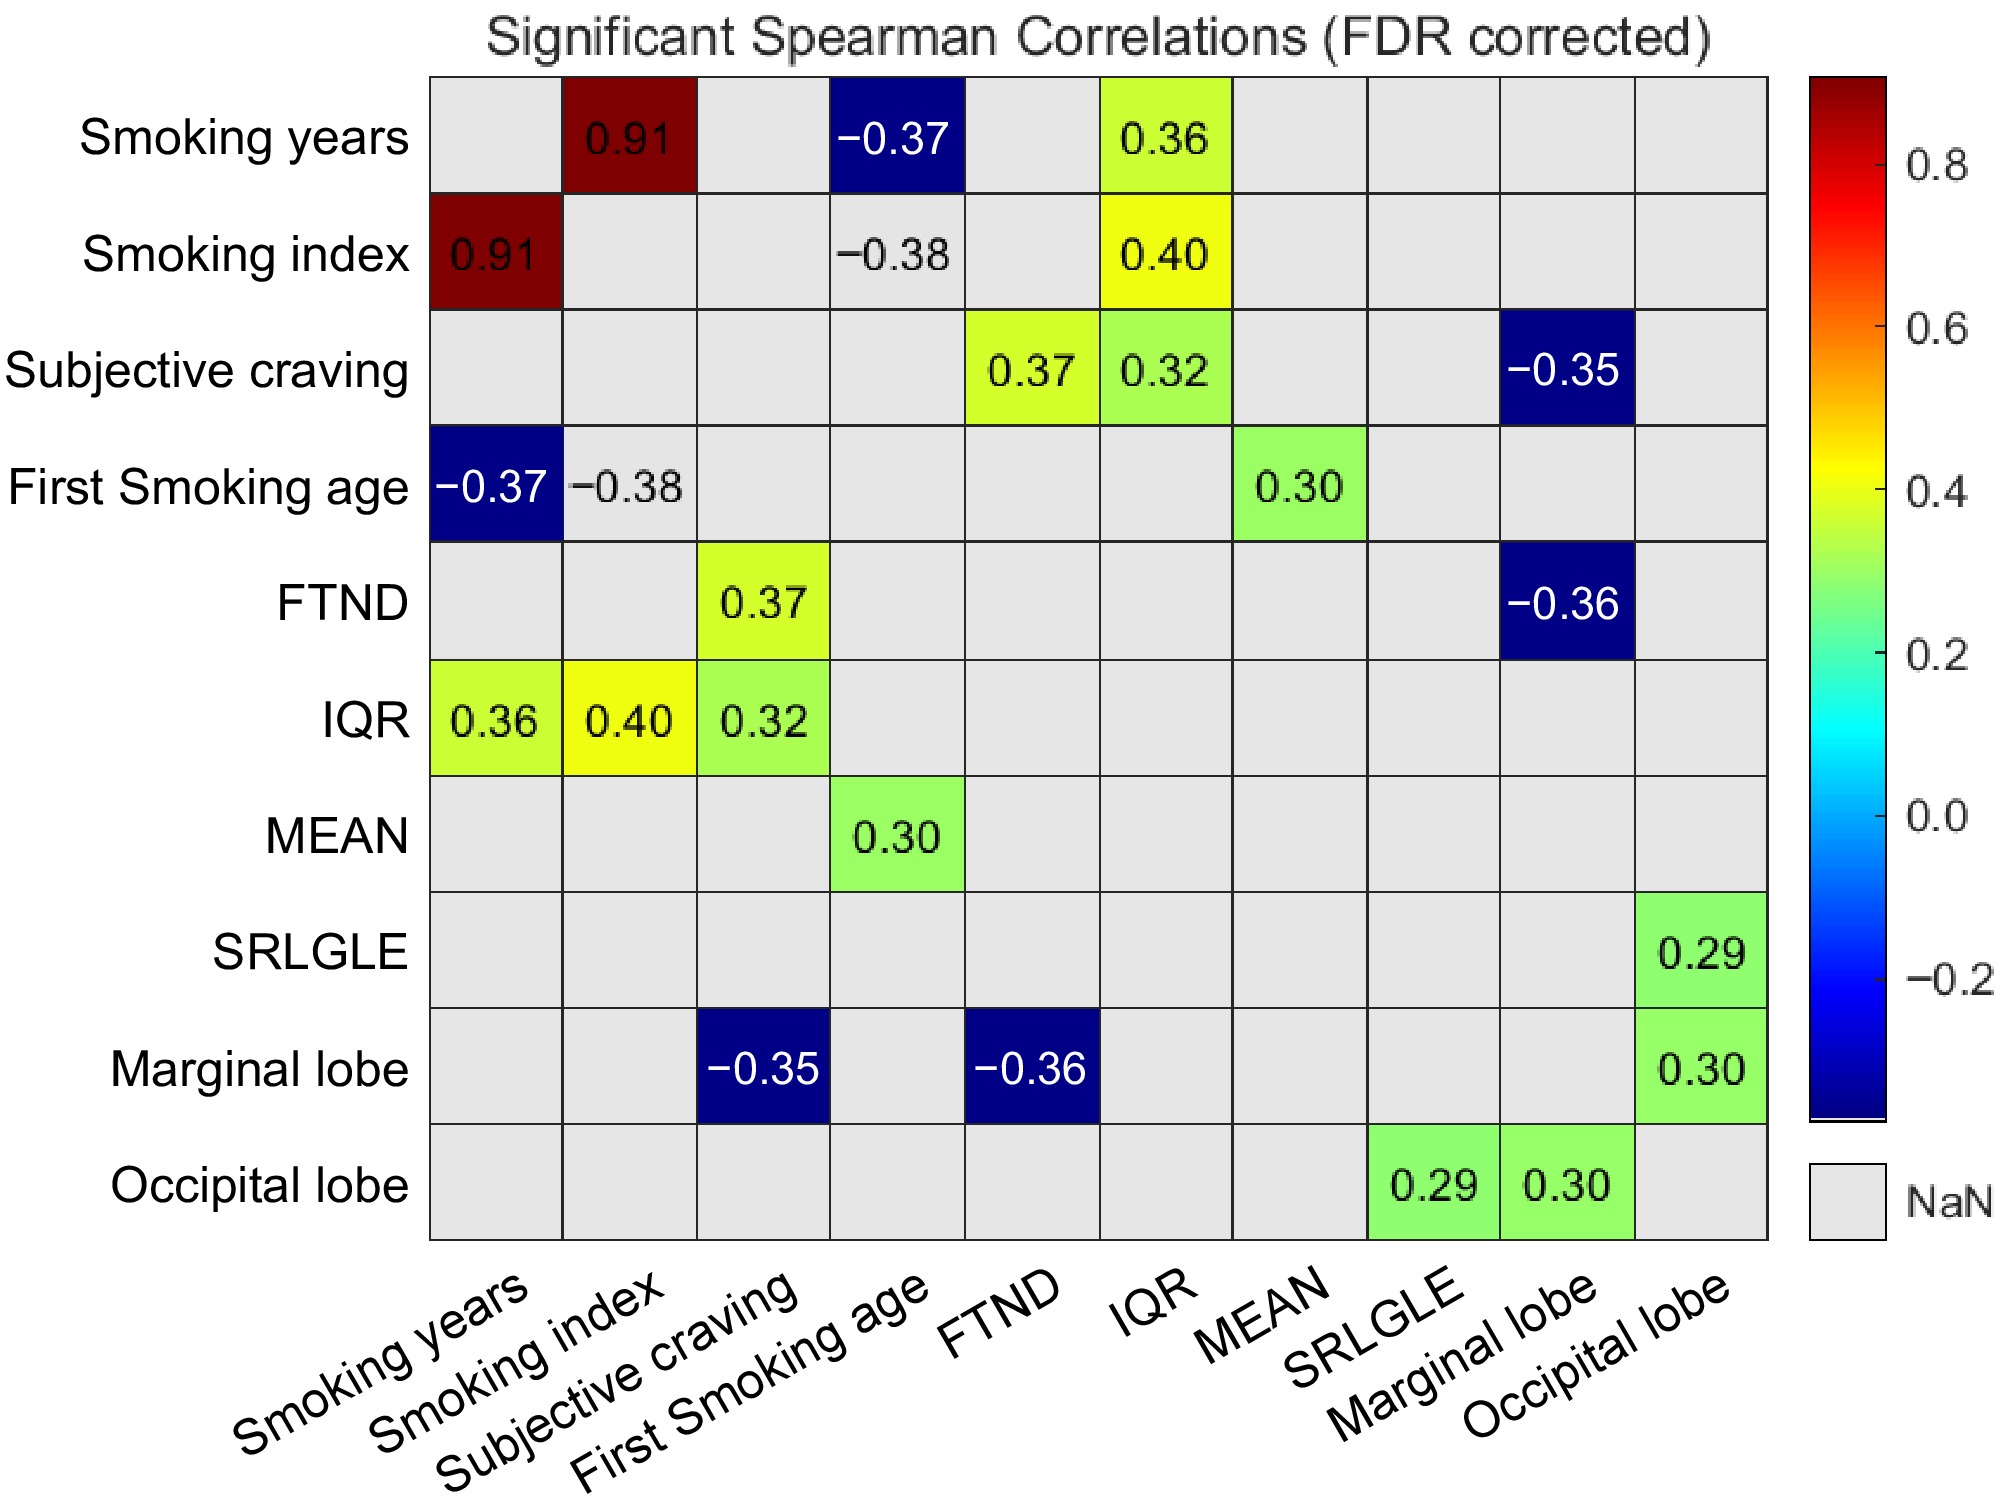
Figure 5.
Spearman correlation (FDR corrected) heat maps of imaging data and behavioral data.
-
Smokers Nonsmokers p value Number of individuals 50 47 − Age (year) 29.66 ± 6.63 27.43 ± 4.35 0.201 Gender, male (%) 49 (98.0%) 32 (68.1%) <0.001 Years of education 15.18 ± 2.96 17.57 ± 1.81 <0.001 Age at first smoking/first cigarette 12.46 ± 7.35 − − Smoking in years 14.98 ± 5.27 − − Smoking, cigarettes per day 5.1 ± 2.78 − − Craving score 17.04 ± 3.56 − − FTND 3.84 ± 2.02 − − Table 1.
Demographic and clinical characteristics of the smoking and healthy control groups.
-
ROI Regions T MNI coordinate Condition P-FWE_corr x y z Insula Right occipital
lingual gyrus4.64 18 −102 −3 NA > HC 0.000 Insula Right nucleus
accumbens5.13 33 3 −15 NA > HC 0.014 Insula Left marginal lobe
sulcal gyrus4.22 −27 0 −30 NA > HC 0.027 Insula Left nucleus
accumbens5.07 −12 9 −9 NA > HC 0.004 MNI, Montreal Neurological Institute. Table 2.
Group comparison of functional connections based on insula as seed points.
Figures
(5)
Tables
(2)