-
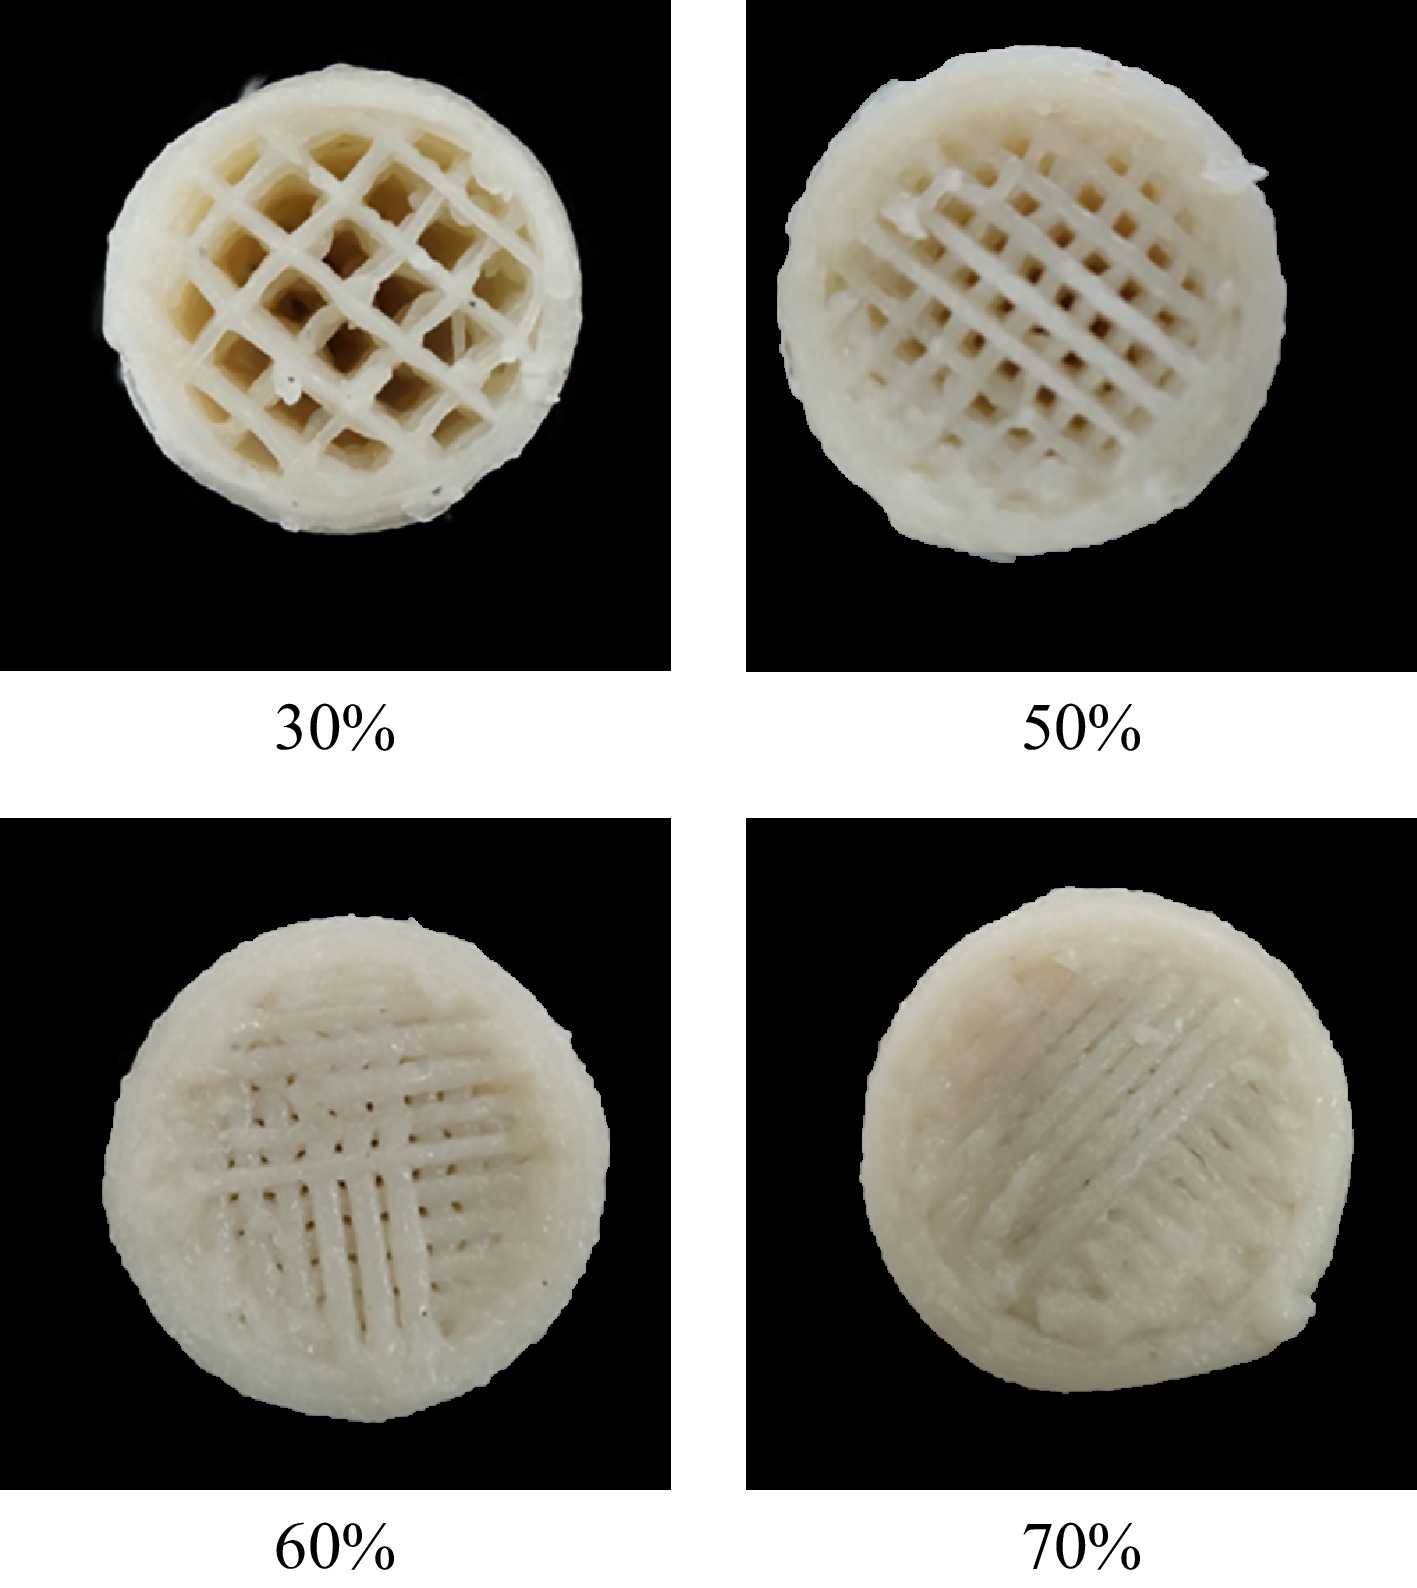
Figure 1.
3D printed surimi with different infill densities.
-
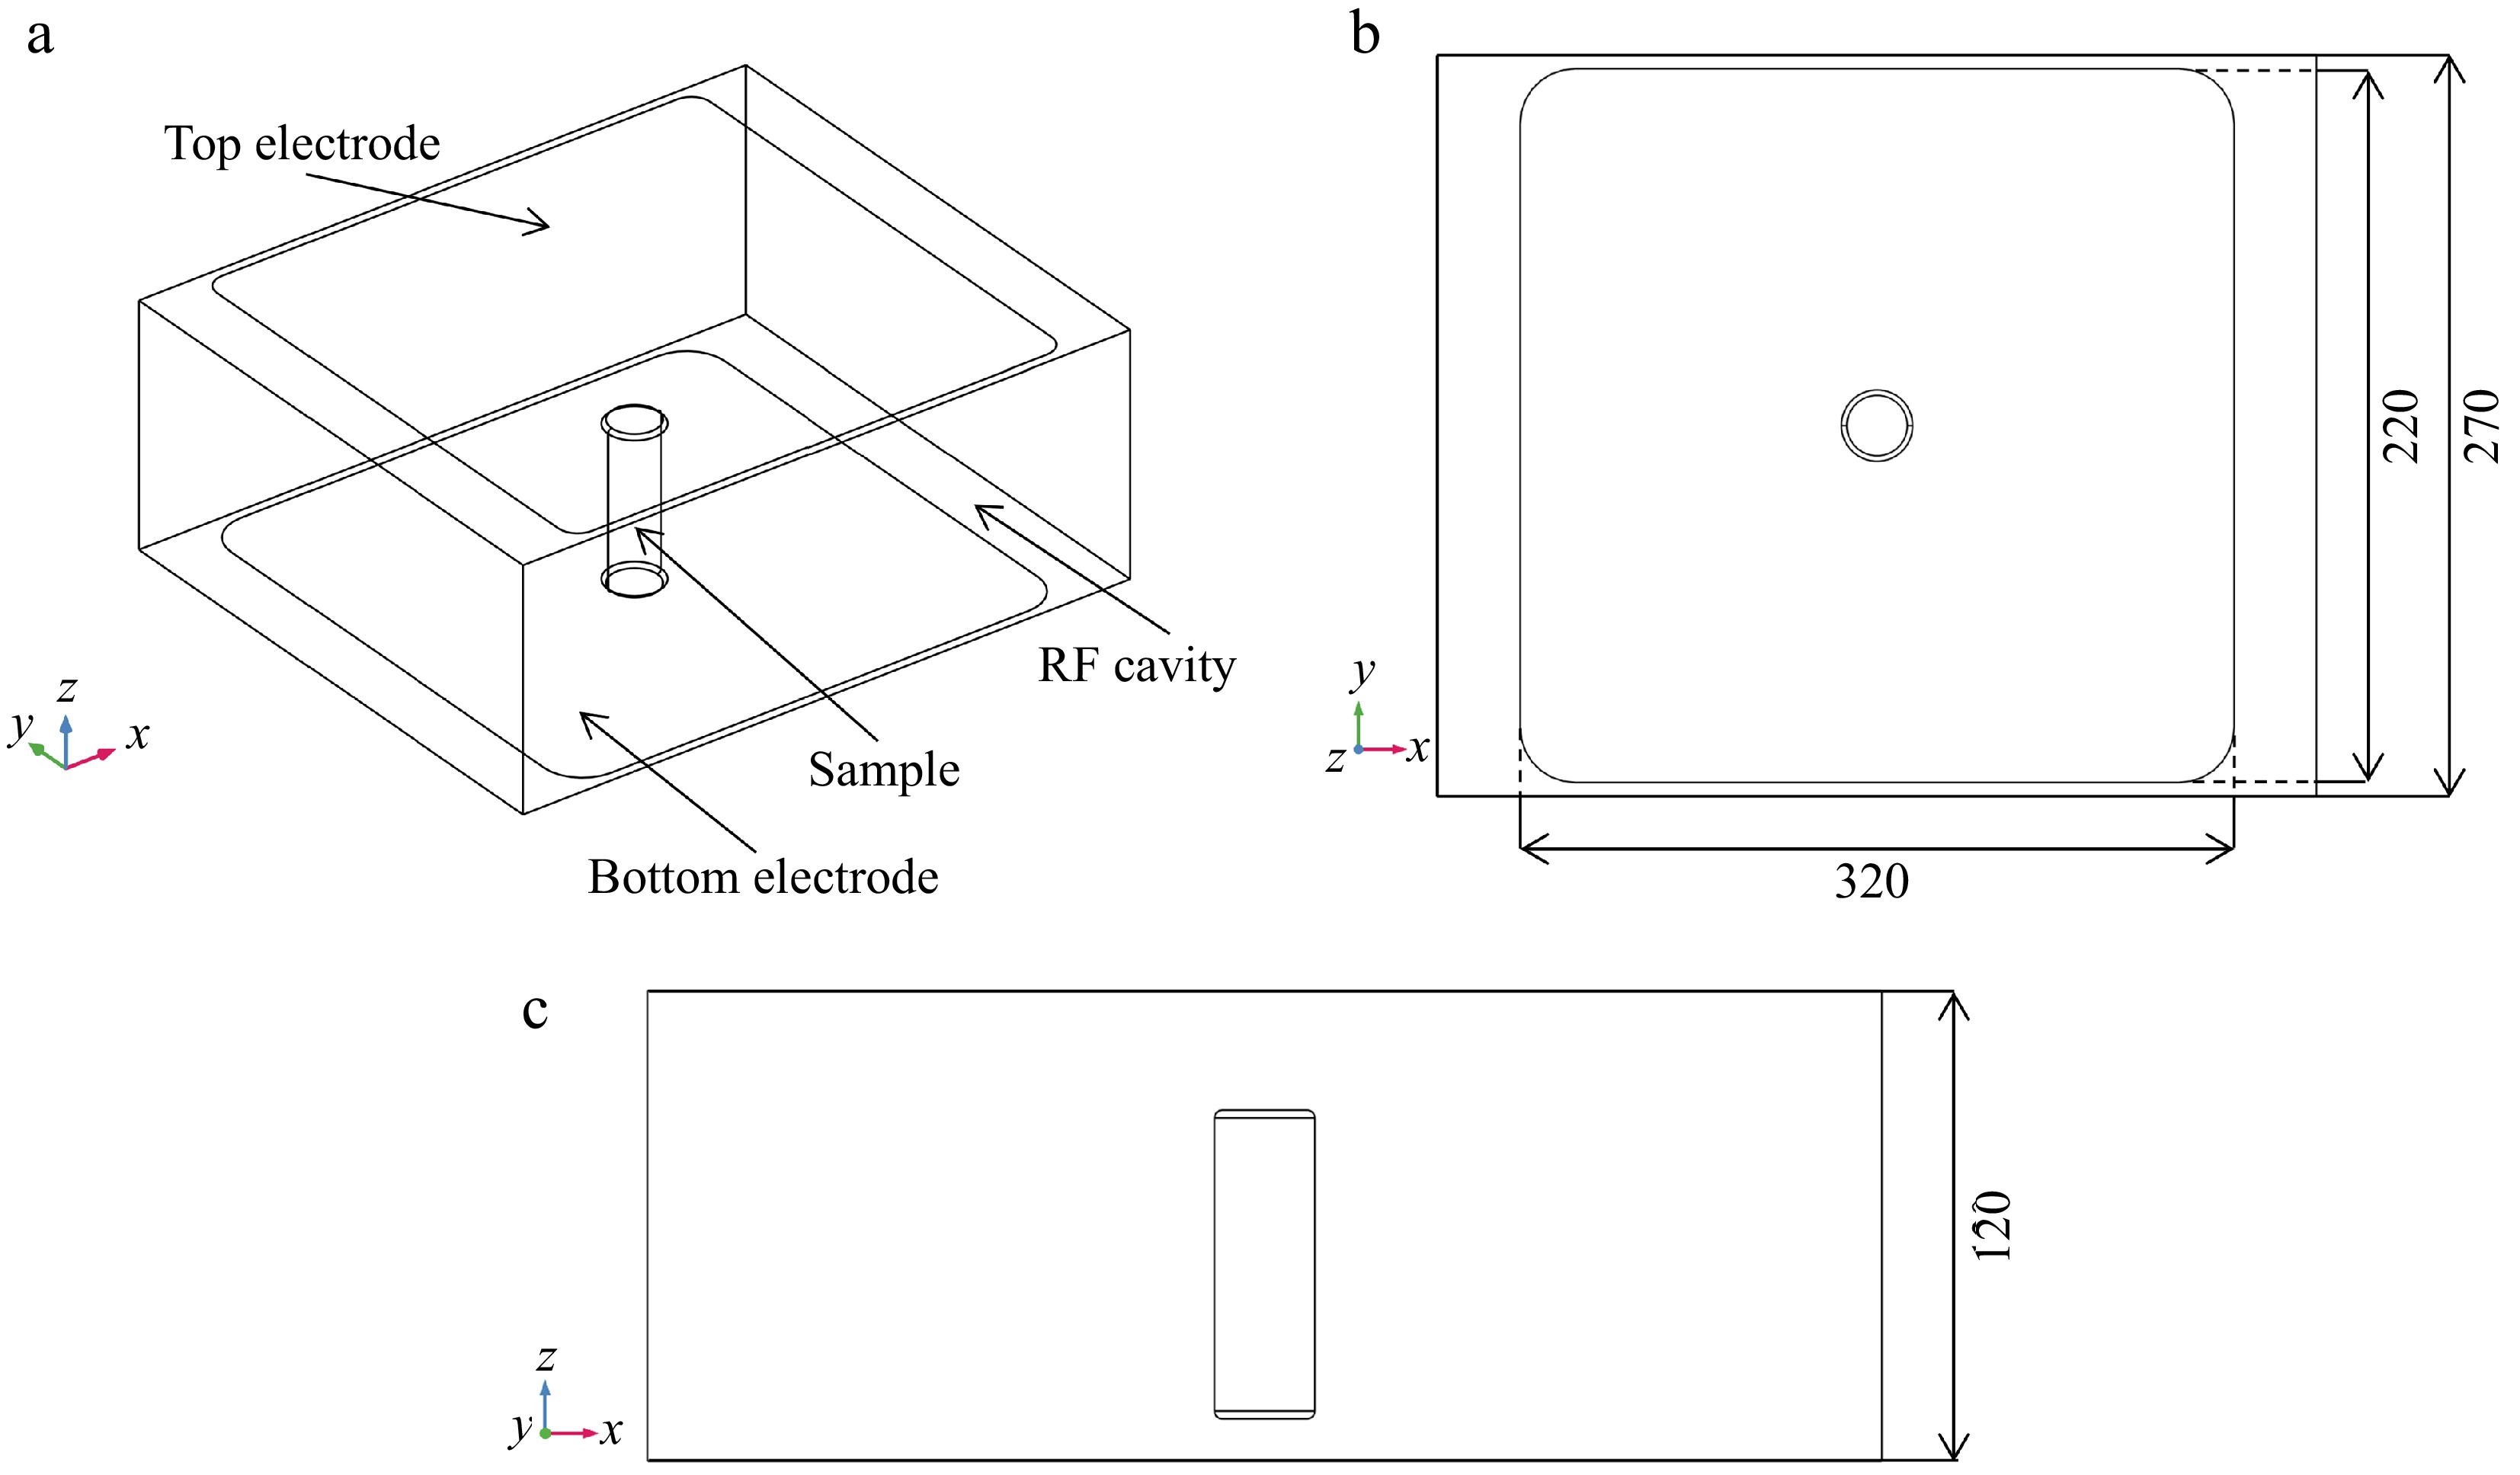
Figure 2.
Geometries of RF heating cavity and surimi sample: (a) 3-D view, (b) x-y plane, (c) x-z plane. (unit: mm).
-
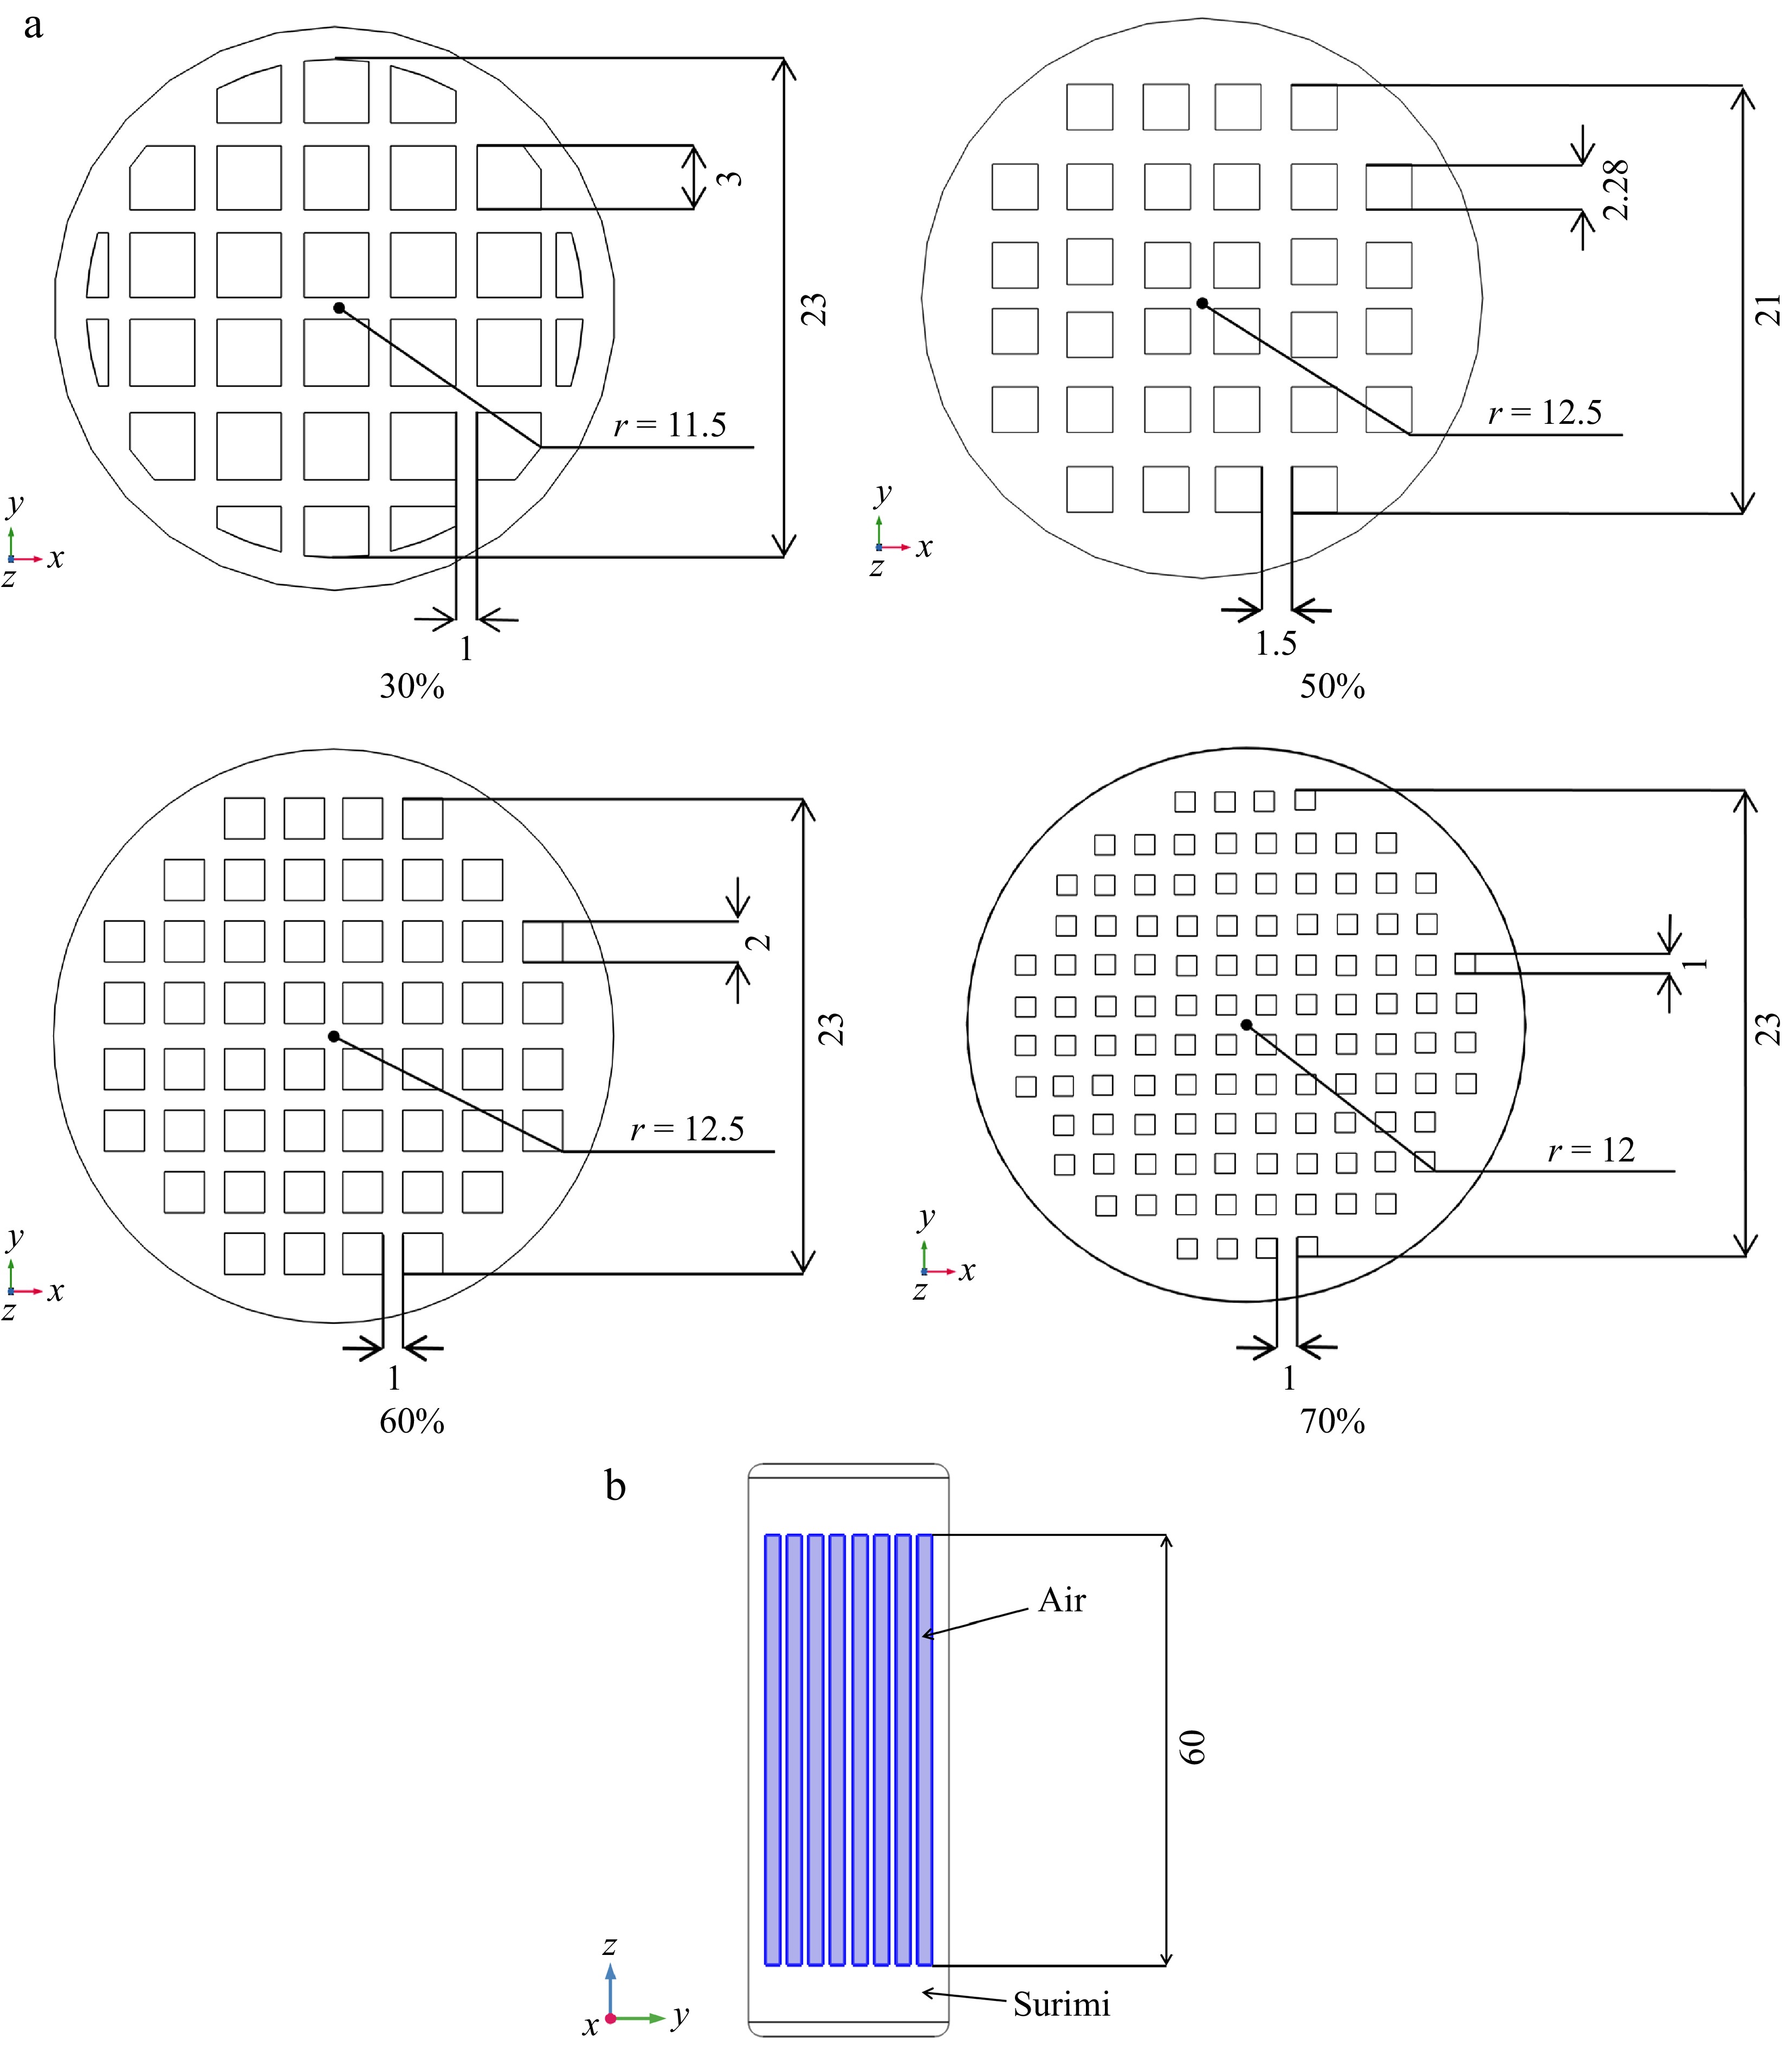
Figure 3.
Internal geometry of surimi samples with different infill densities: (a) x-y plane, (b) y-z plane (unit: mm).
-
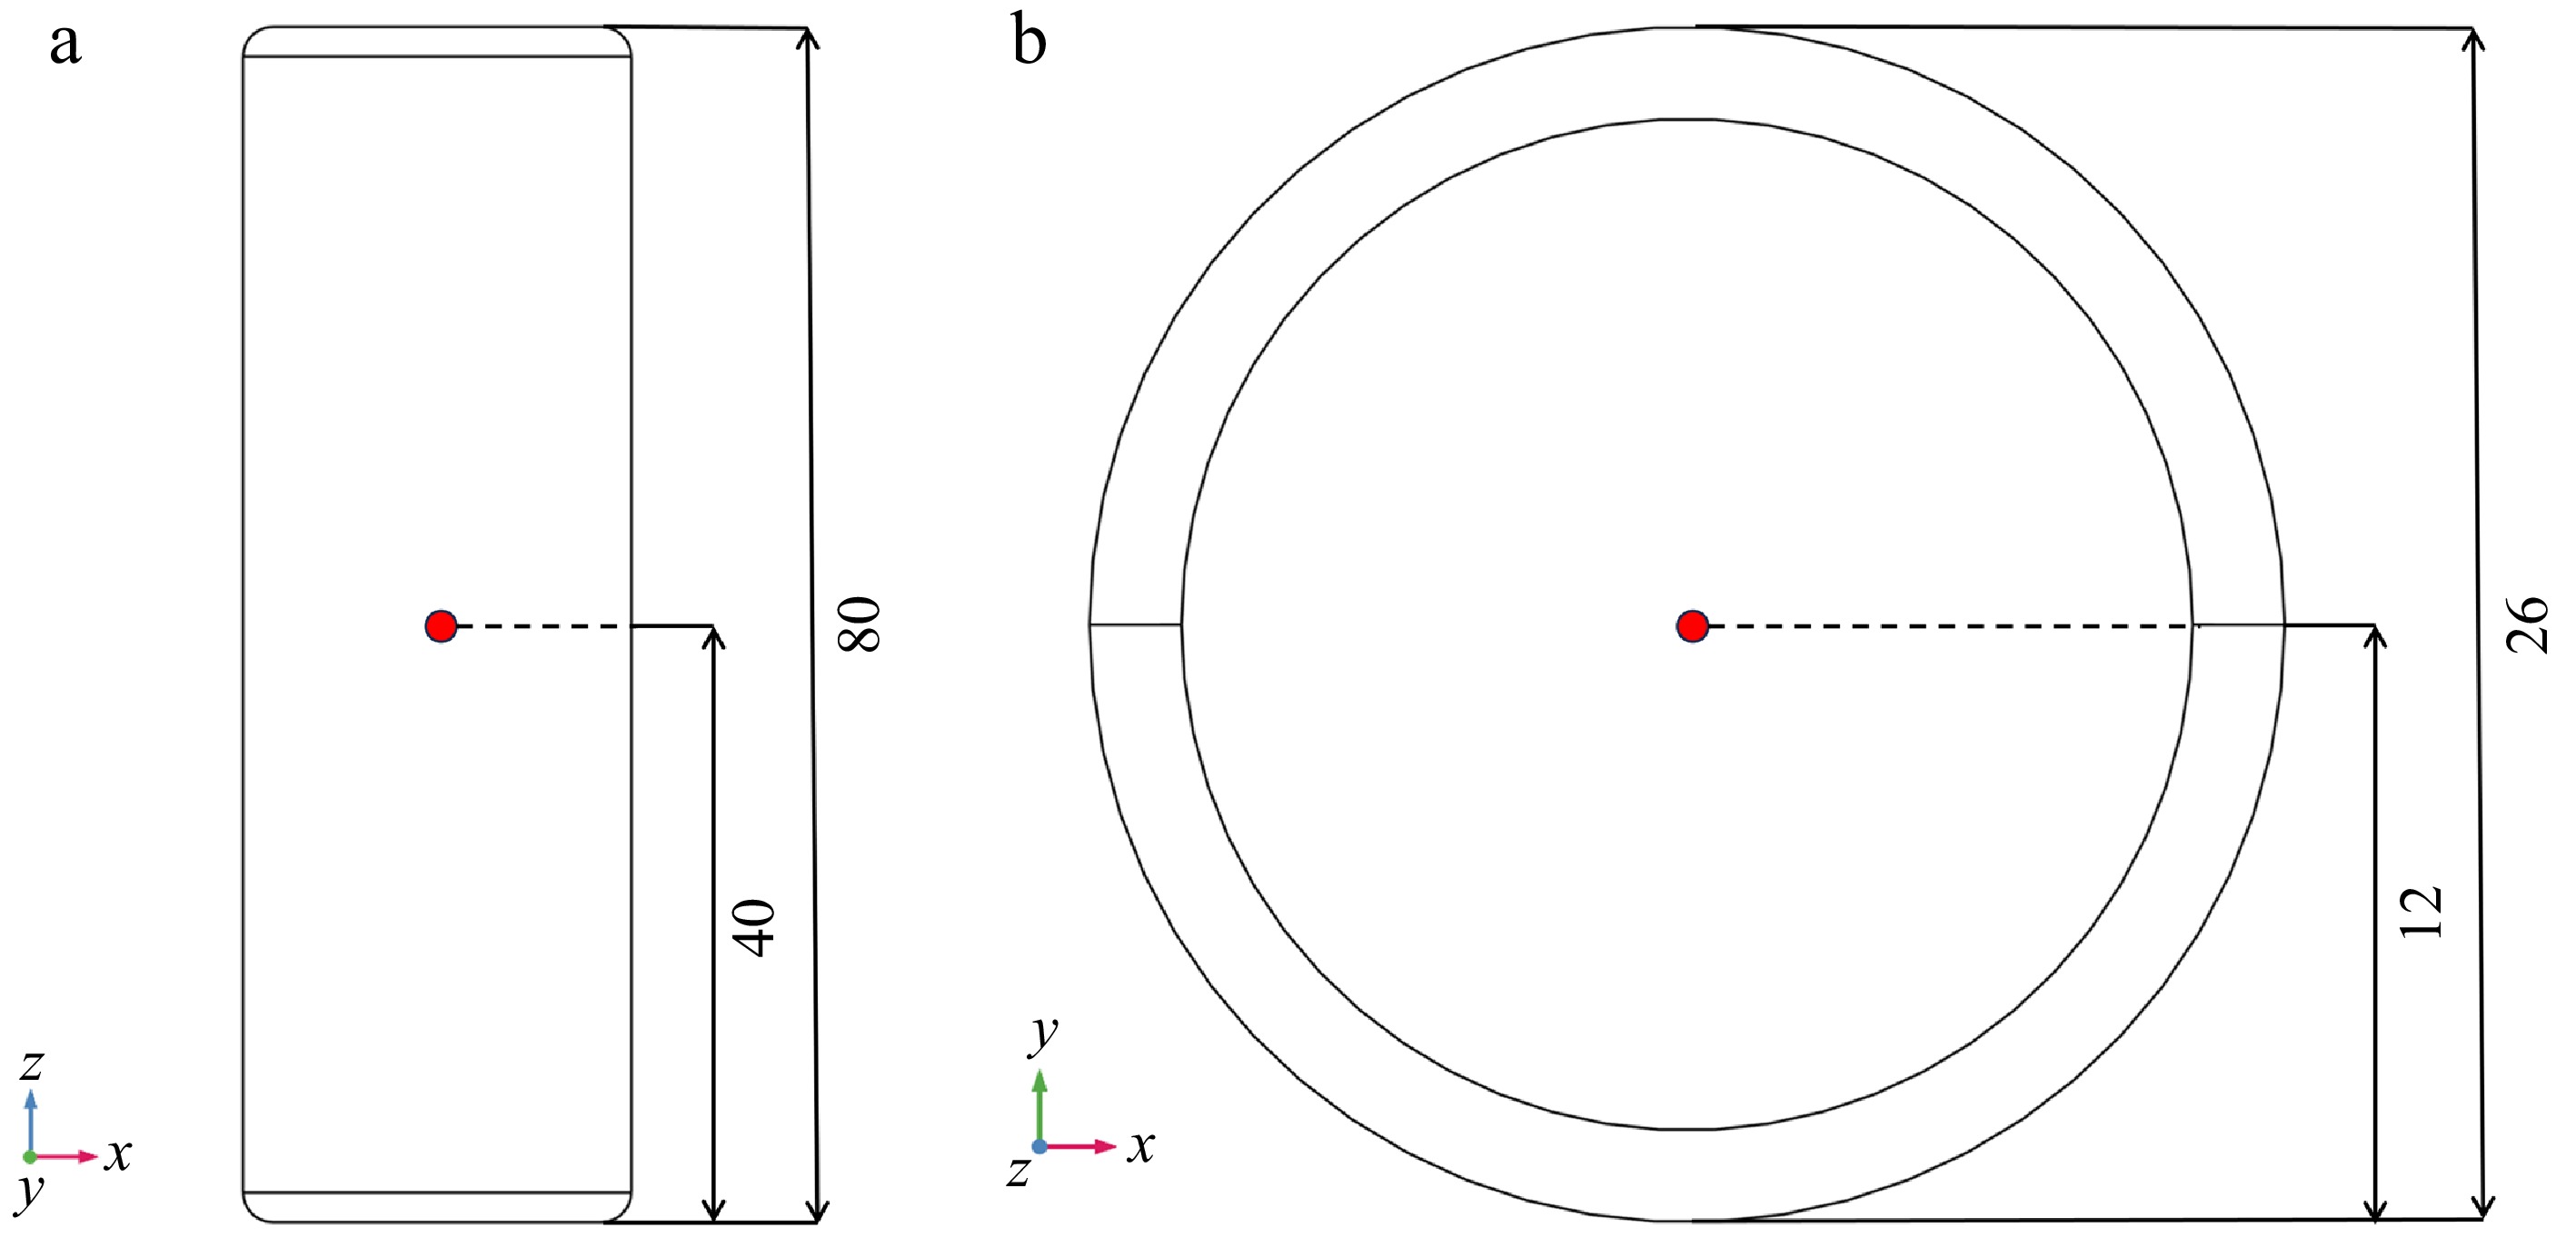
Figure 4.
Locations of the temperature measurement points in the sample (red dots indicate the measurement locations): (a) x-z plane, (b) x-y plane (unit: mm).
-
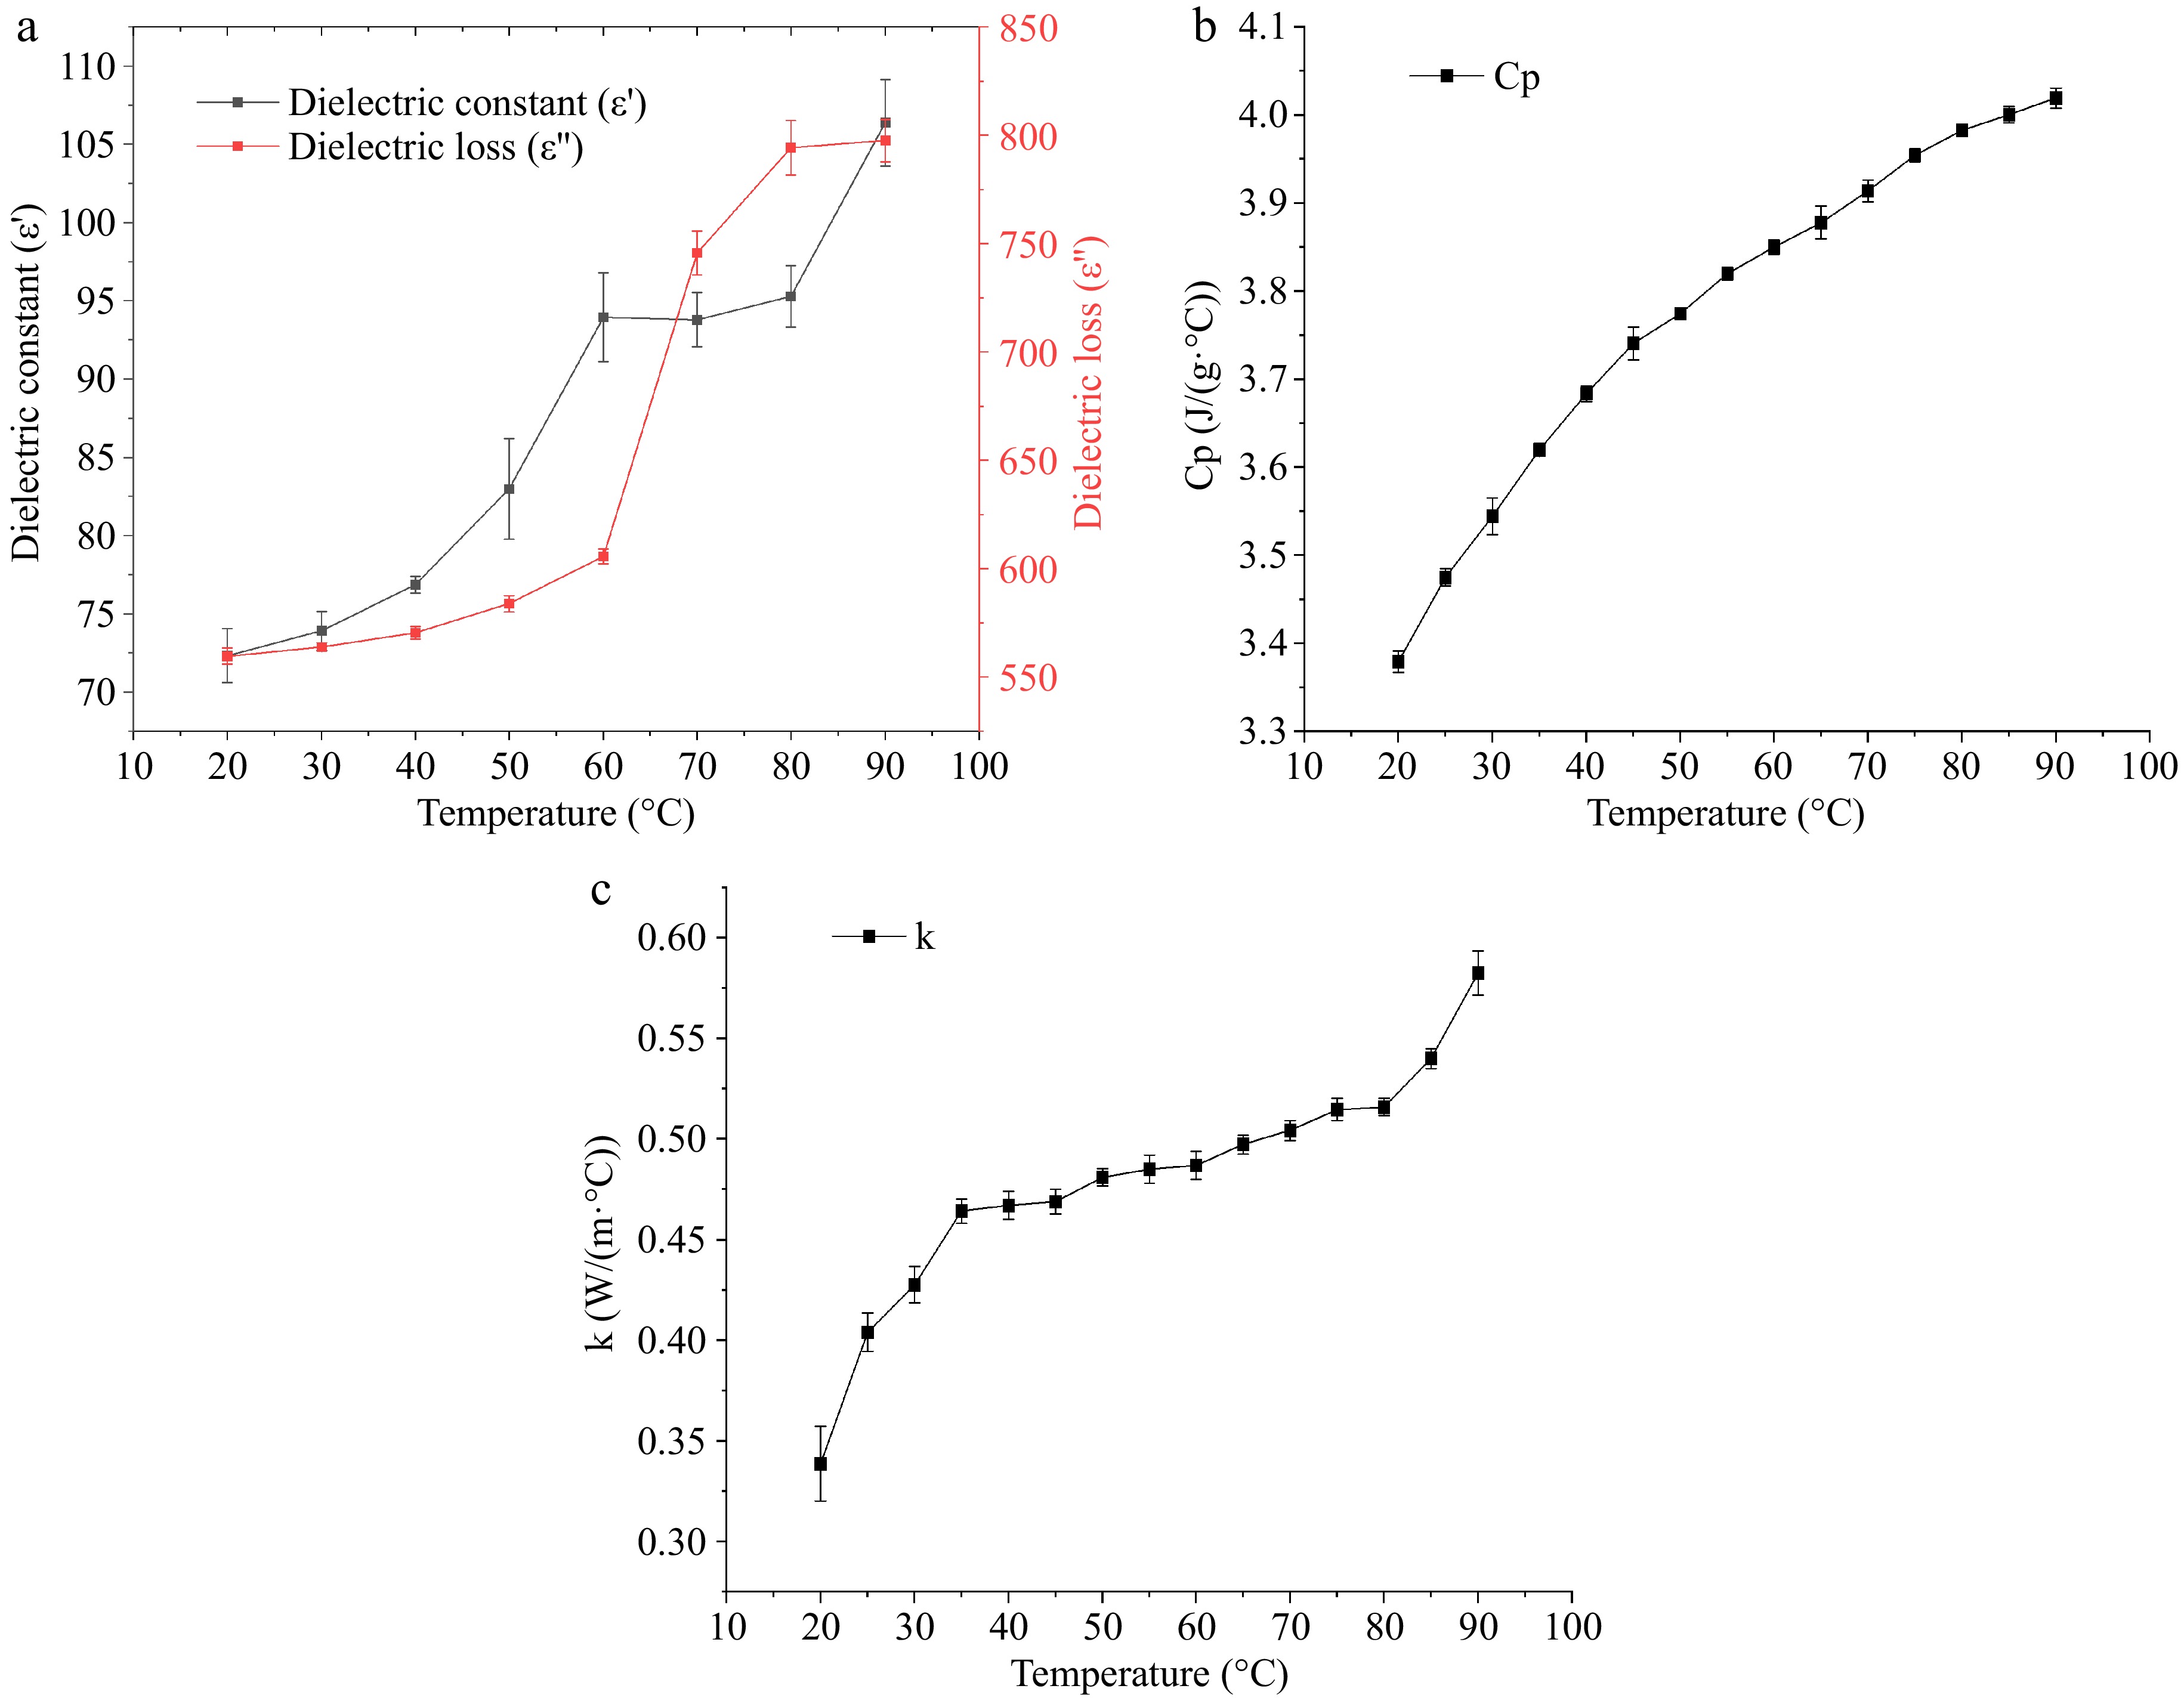
Figure 5.
The thermal and dielectric properties of surimi at 40.68 MHz within the temperature range of 20 to 90 °C: (a) dielectric constant (ε') and dielectric loss factor (ε"), (b) specific heat capacity, (c) thermal conductivity.
-
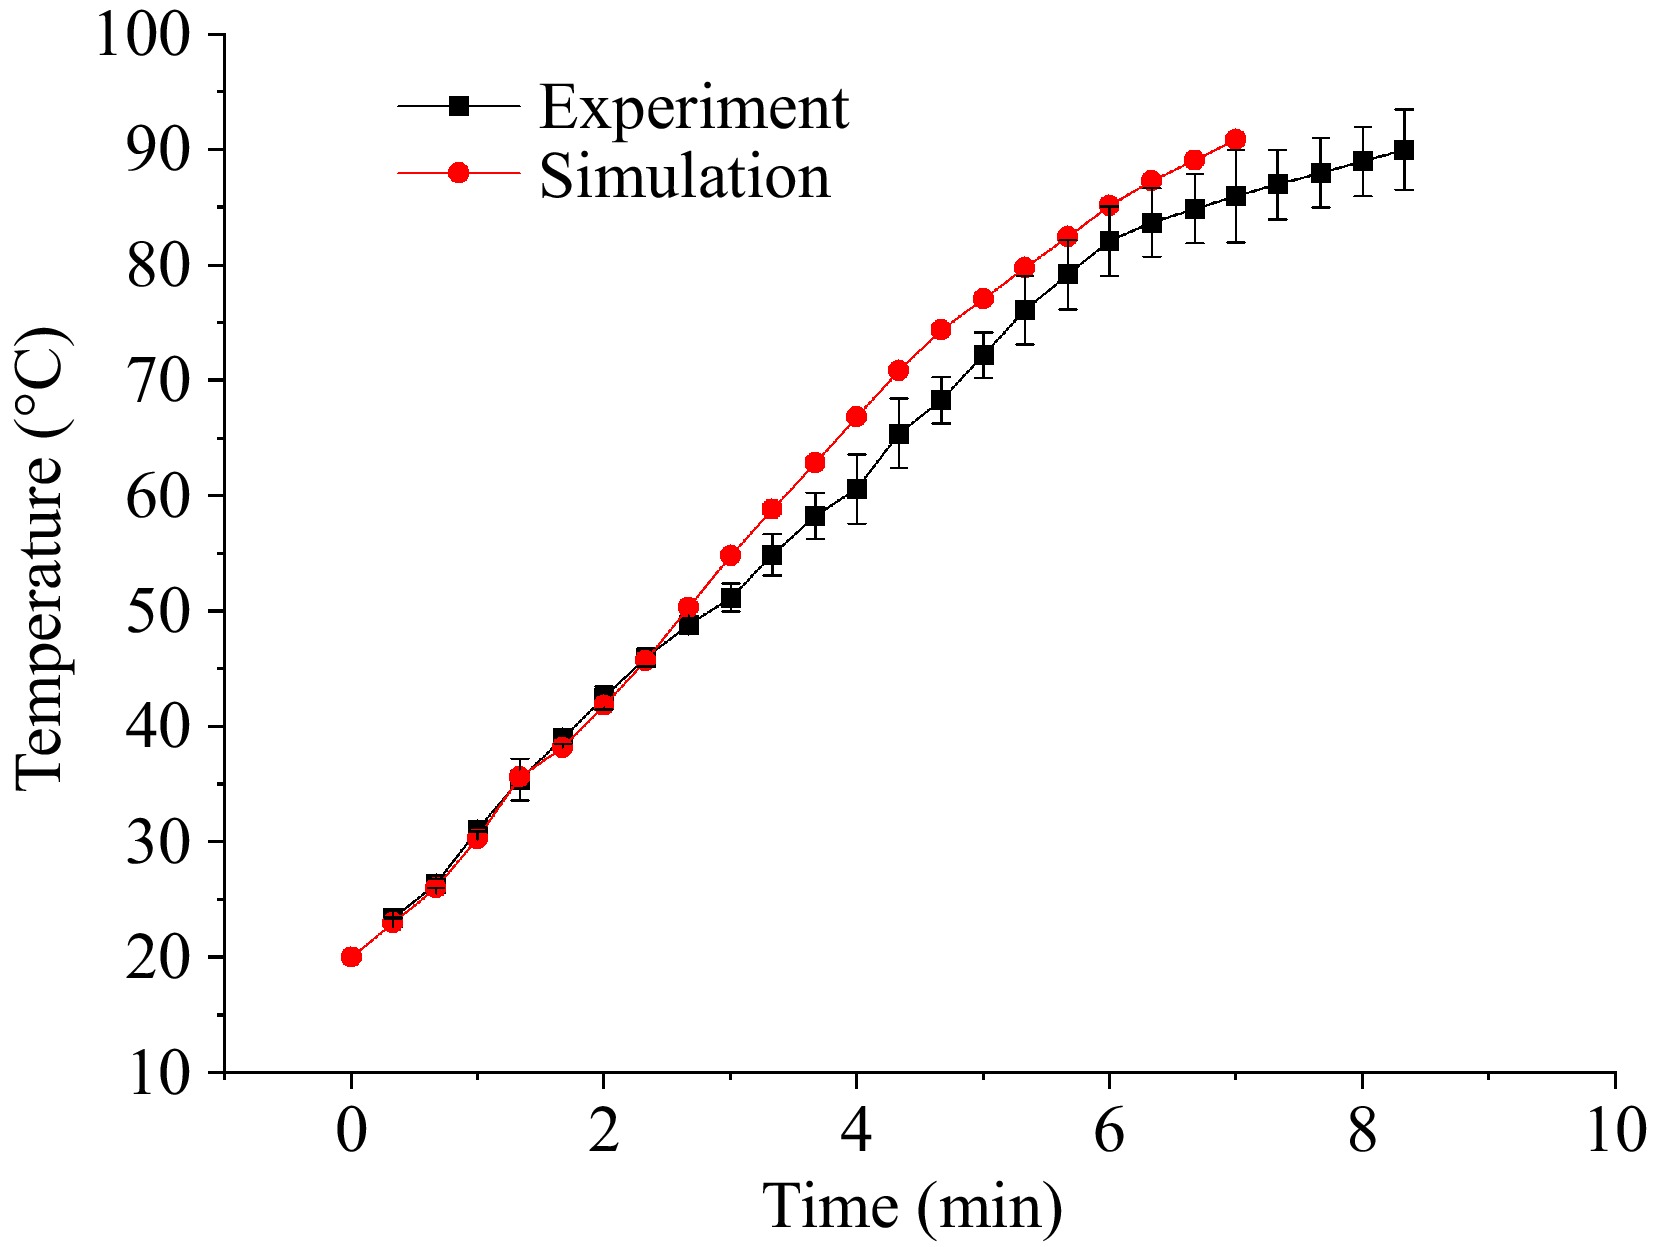
Figure 6.
Comparison of temperature curve from experiment and simulation under RF heating.
-
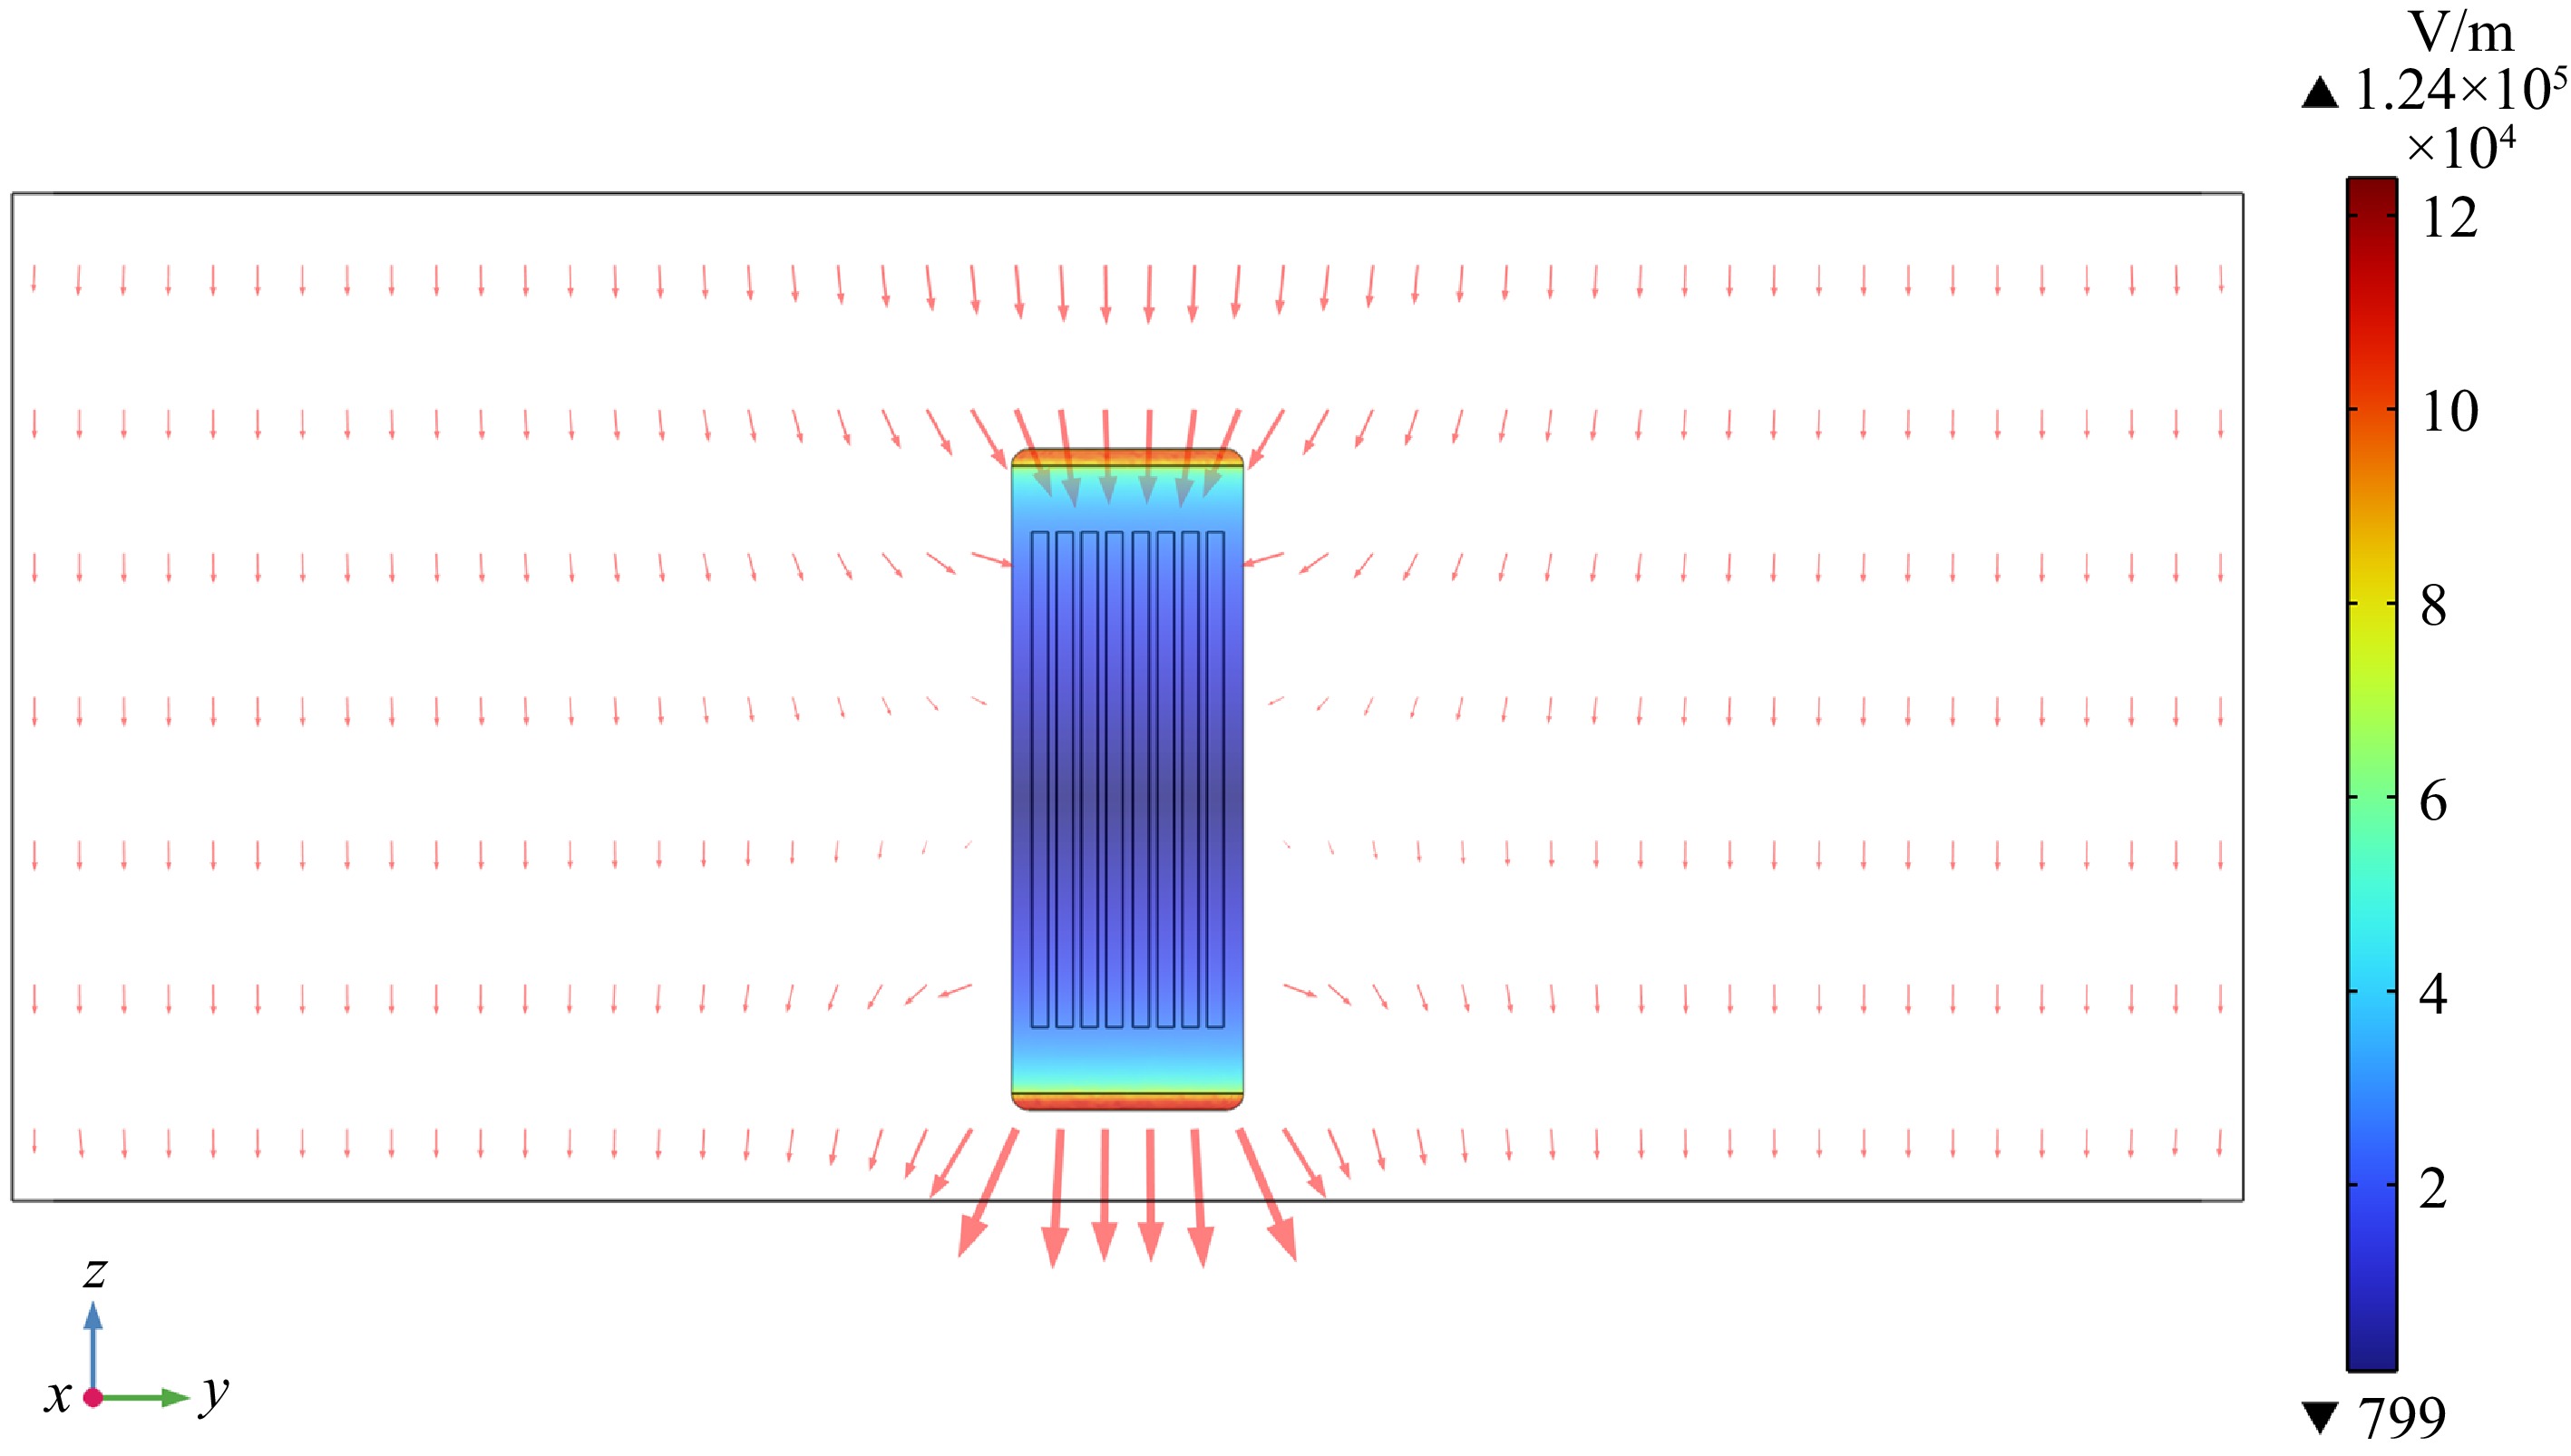
Figure 7.
The electric field intensity within the cavity during the RF heating process of the surimi samples.
-
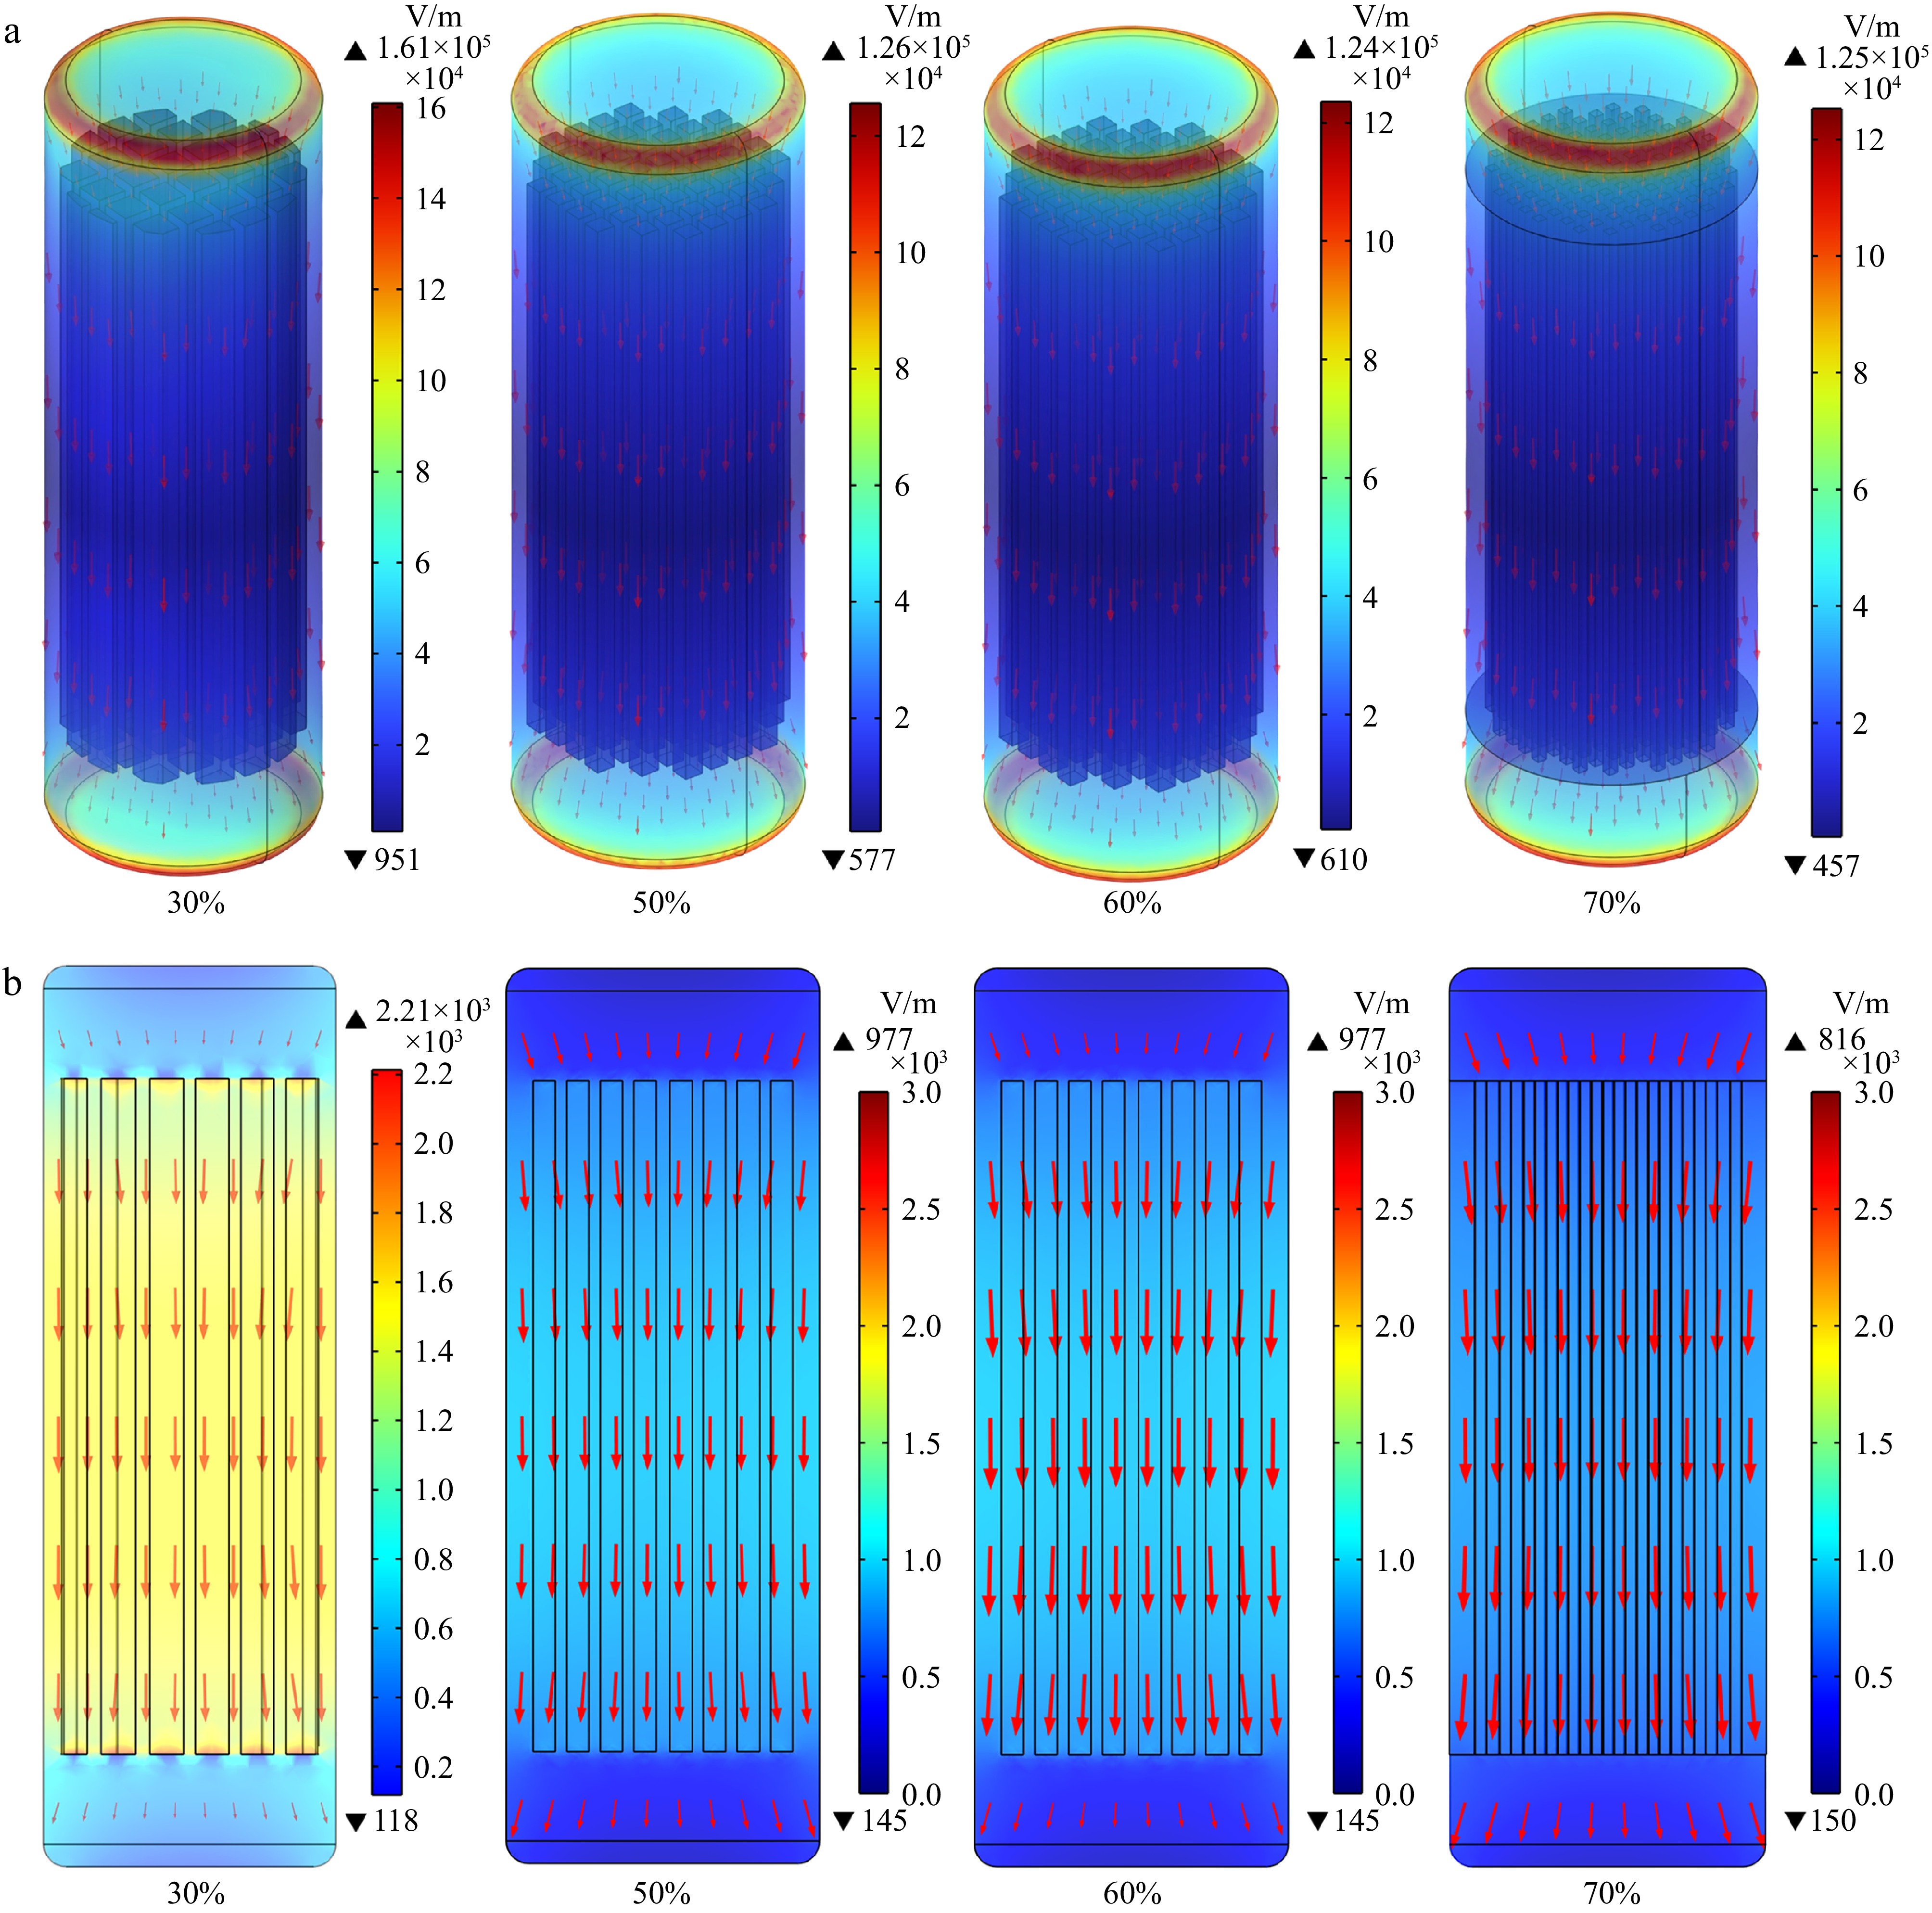
Figure 8.
The electric field distribution in the surimi with different infill density of RF heating: (a) surface, (b) cross-sectional.
-
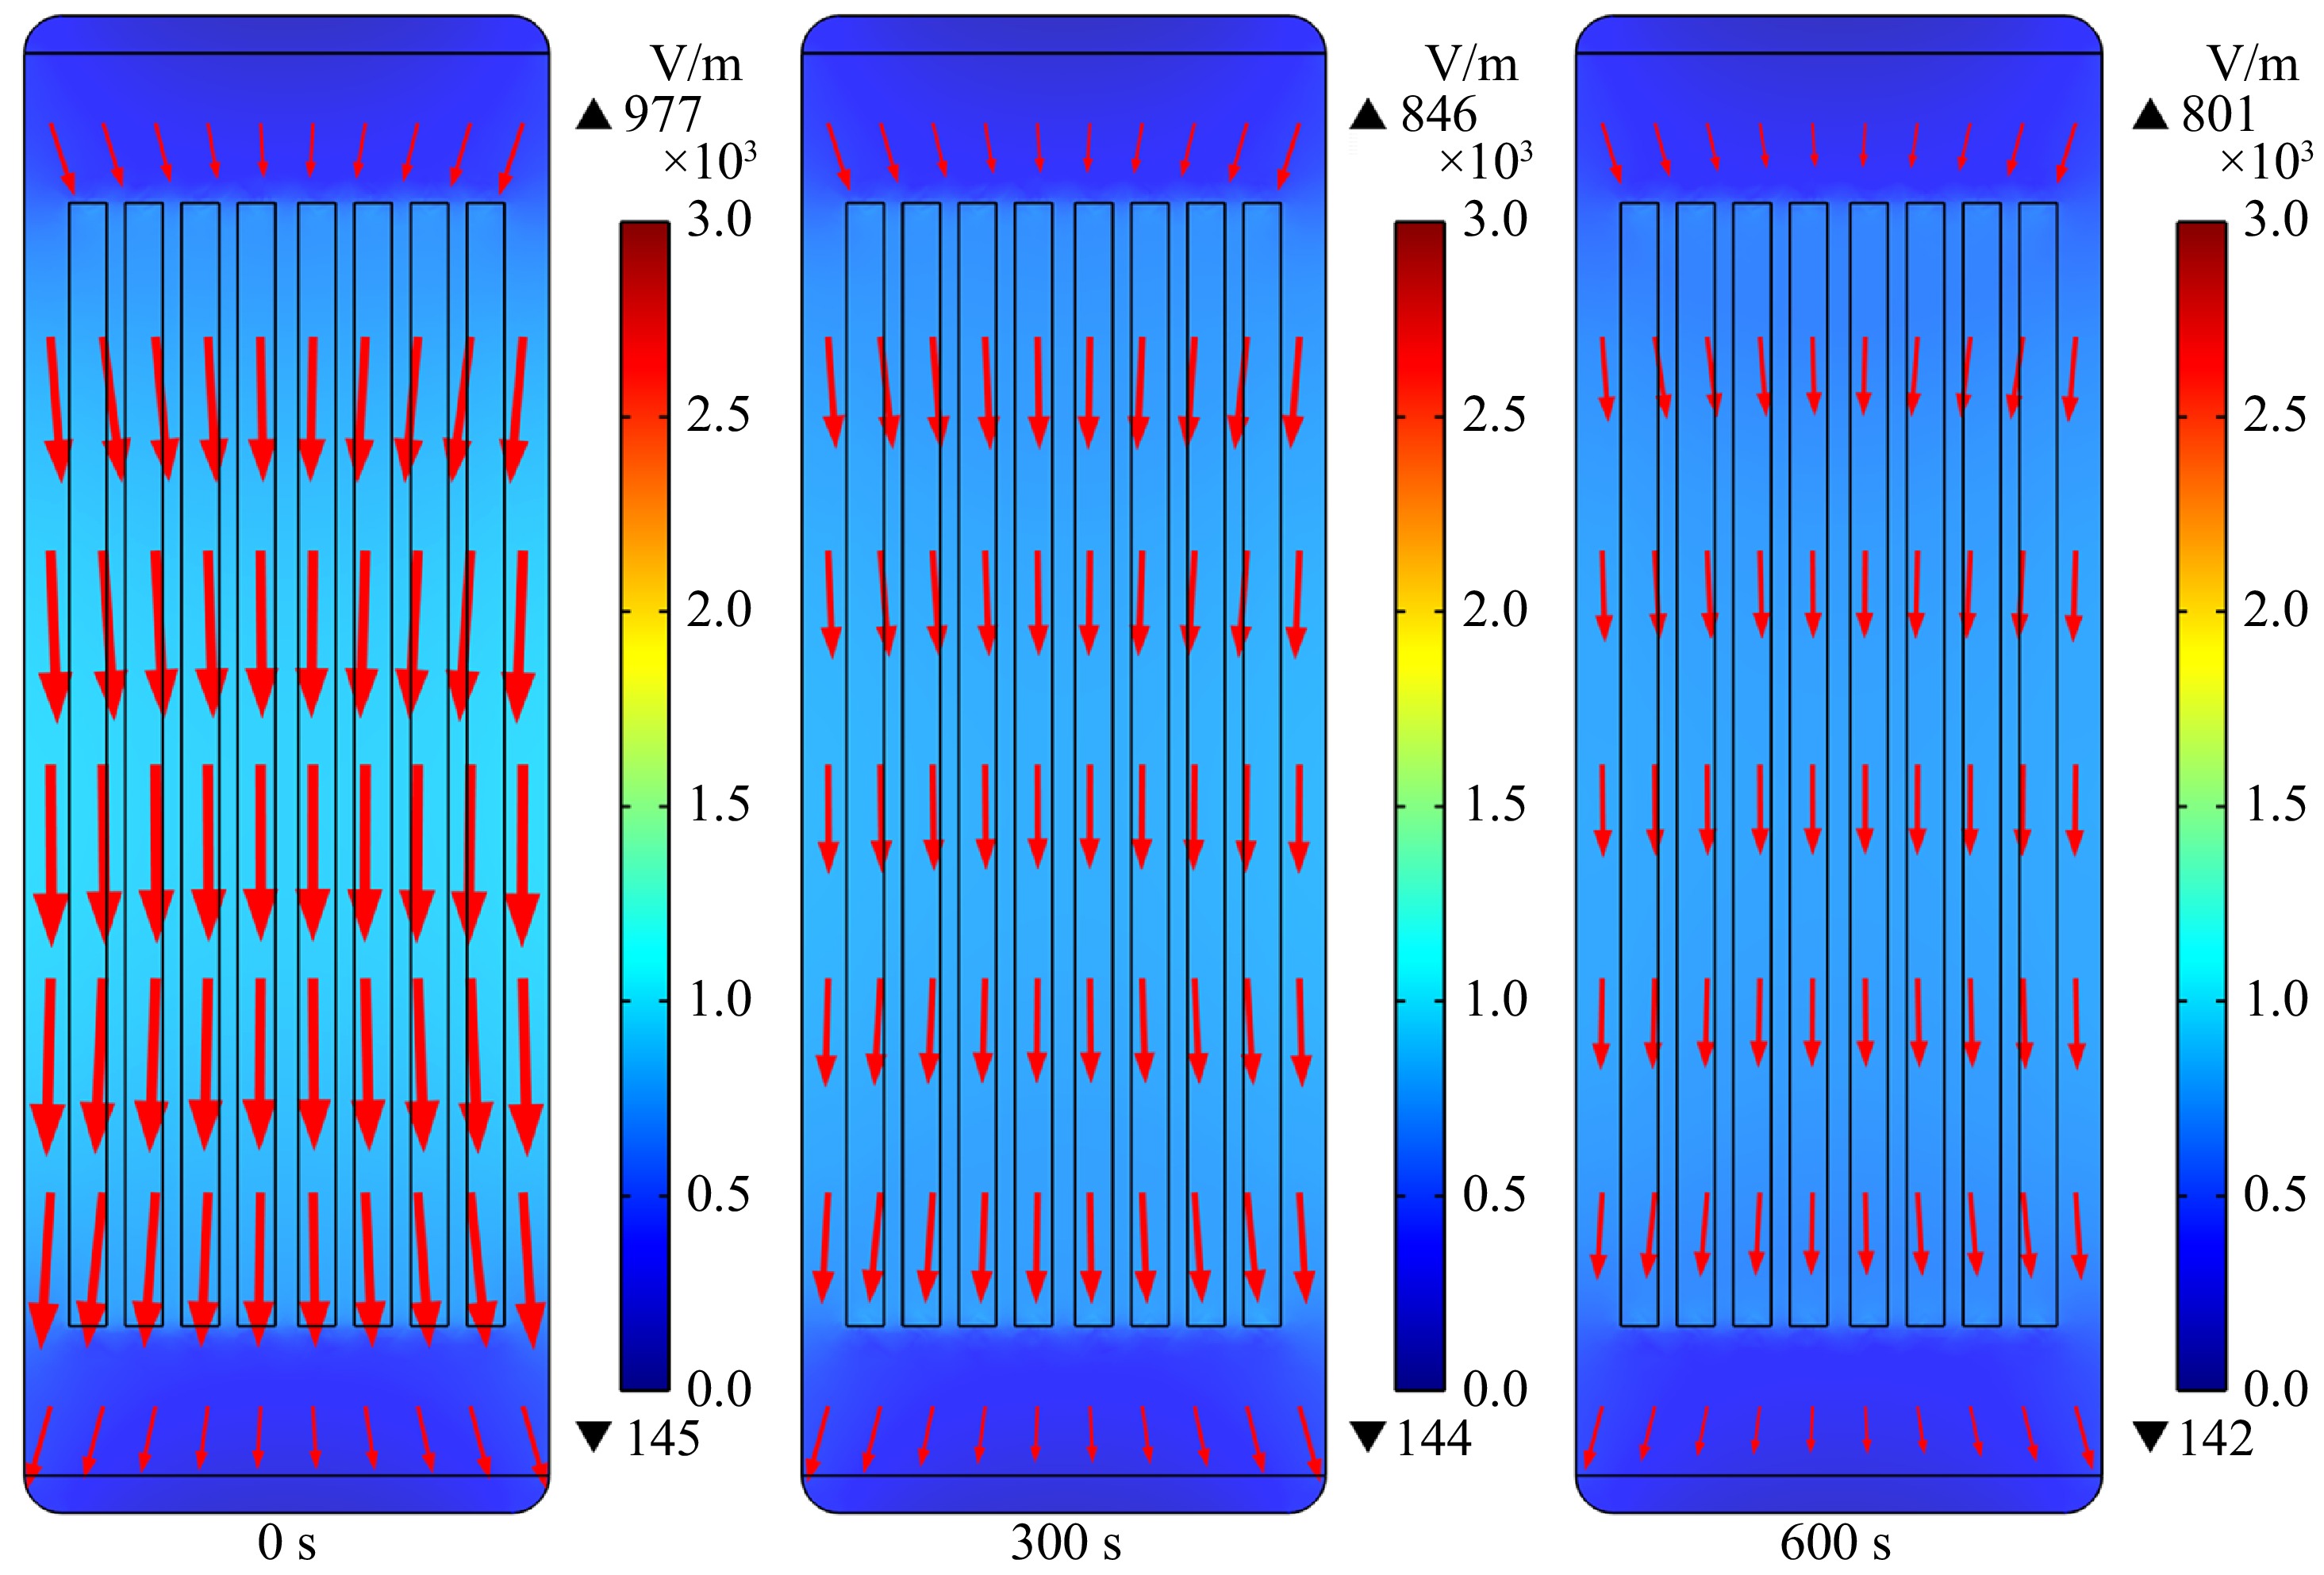
Figure 9.
The electric field intensity in the cavity and within the sample at different times during the RF heating of 3D printed surimi.
-
Initial and boundary conditions Value Initial temperature (°C) 20.0 Surrounding air temperature (°C) 20.0 Frequency (MHz) 40.68 Plate spacing (mm) 120 Outer surface convective heat transfer coefficient (W/(m2·K)) 15 Inner surface convective heat transfer coefficient (W/(m2·K)) 5 Table 1.
Initial and boundary conditions of RF heating simulation with COMSOL Multiphysics®.
-
Infill density (%) Number of mesh Tetrahedral Degrees of freedom 30 174,351 516,660 50 162,116 438,711 60 170,995 657,565 70 181,792 700,713 100 135,565 329,200 Table 2.
The mesh numbers of the model with different infill densities.
-
Side surface Longitudinal cross-sectional surface Experiment 


Simulation 


Table 3.
Comparison of experimental and simulated temperature distributions after RF heating.
-
Infill density Experimental temperature gradient Simulated temperature gradient Temperature Uniformity Index (TUI) 30% 


0.308 50% 

0.245 60% 

0.191 70% 

0.198 Table 4.
Comparison of experimental and simulated temperature distributions at different infill densities after RF heating.
Figures
(9)
Tables
(4)