-
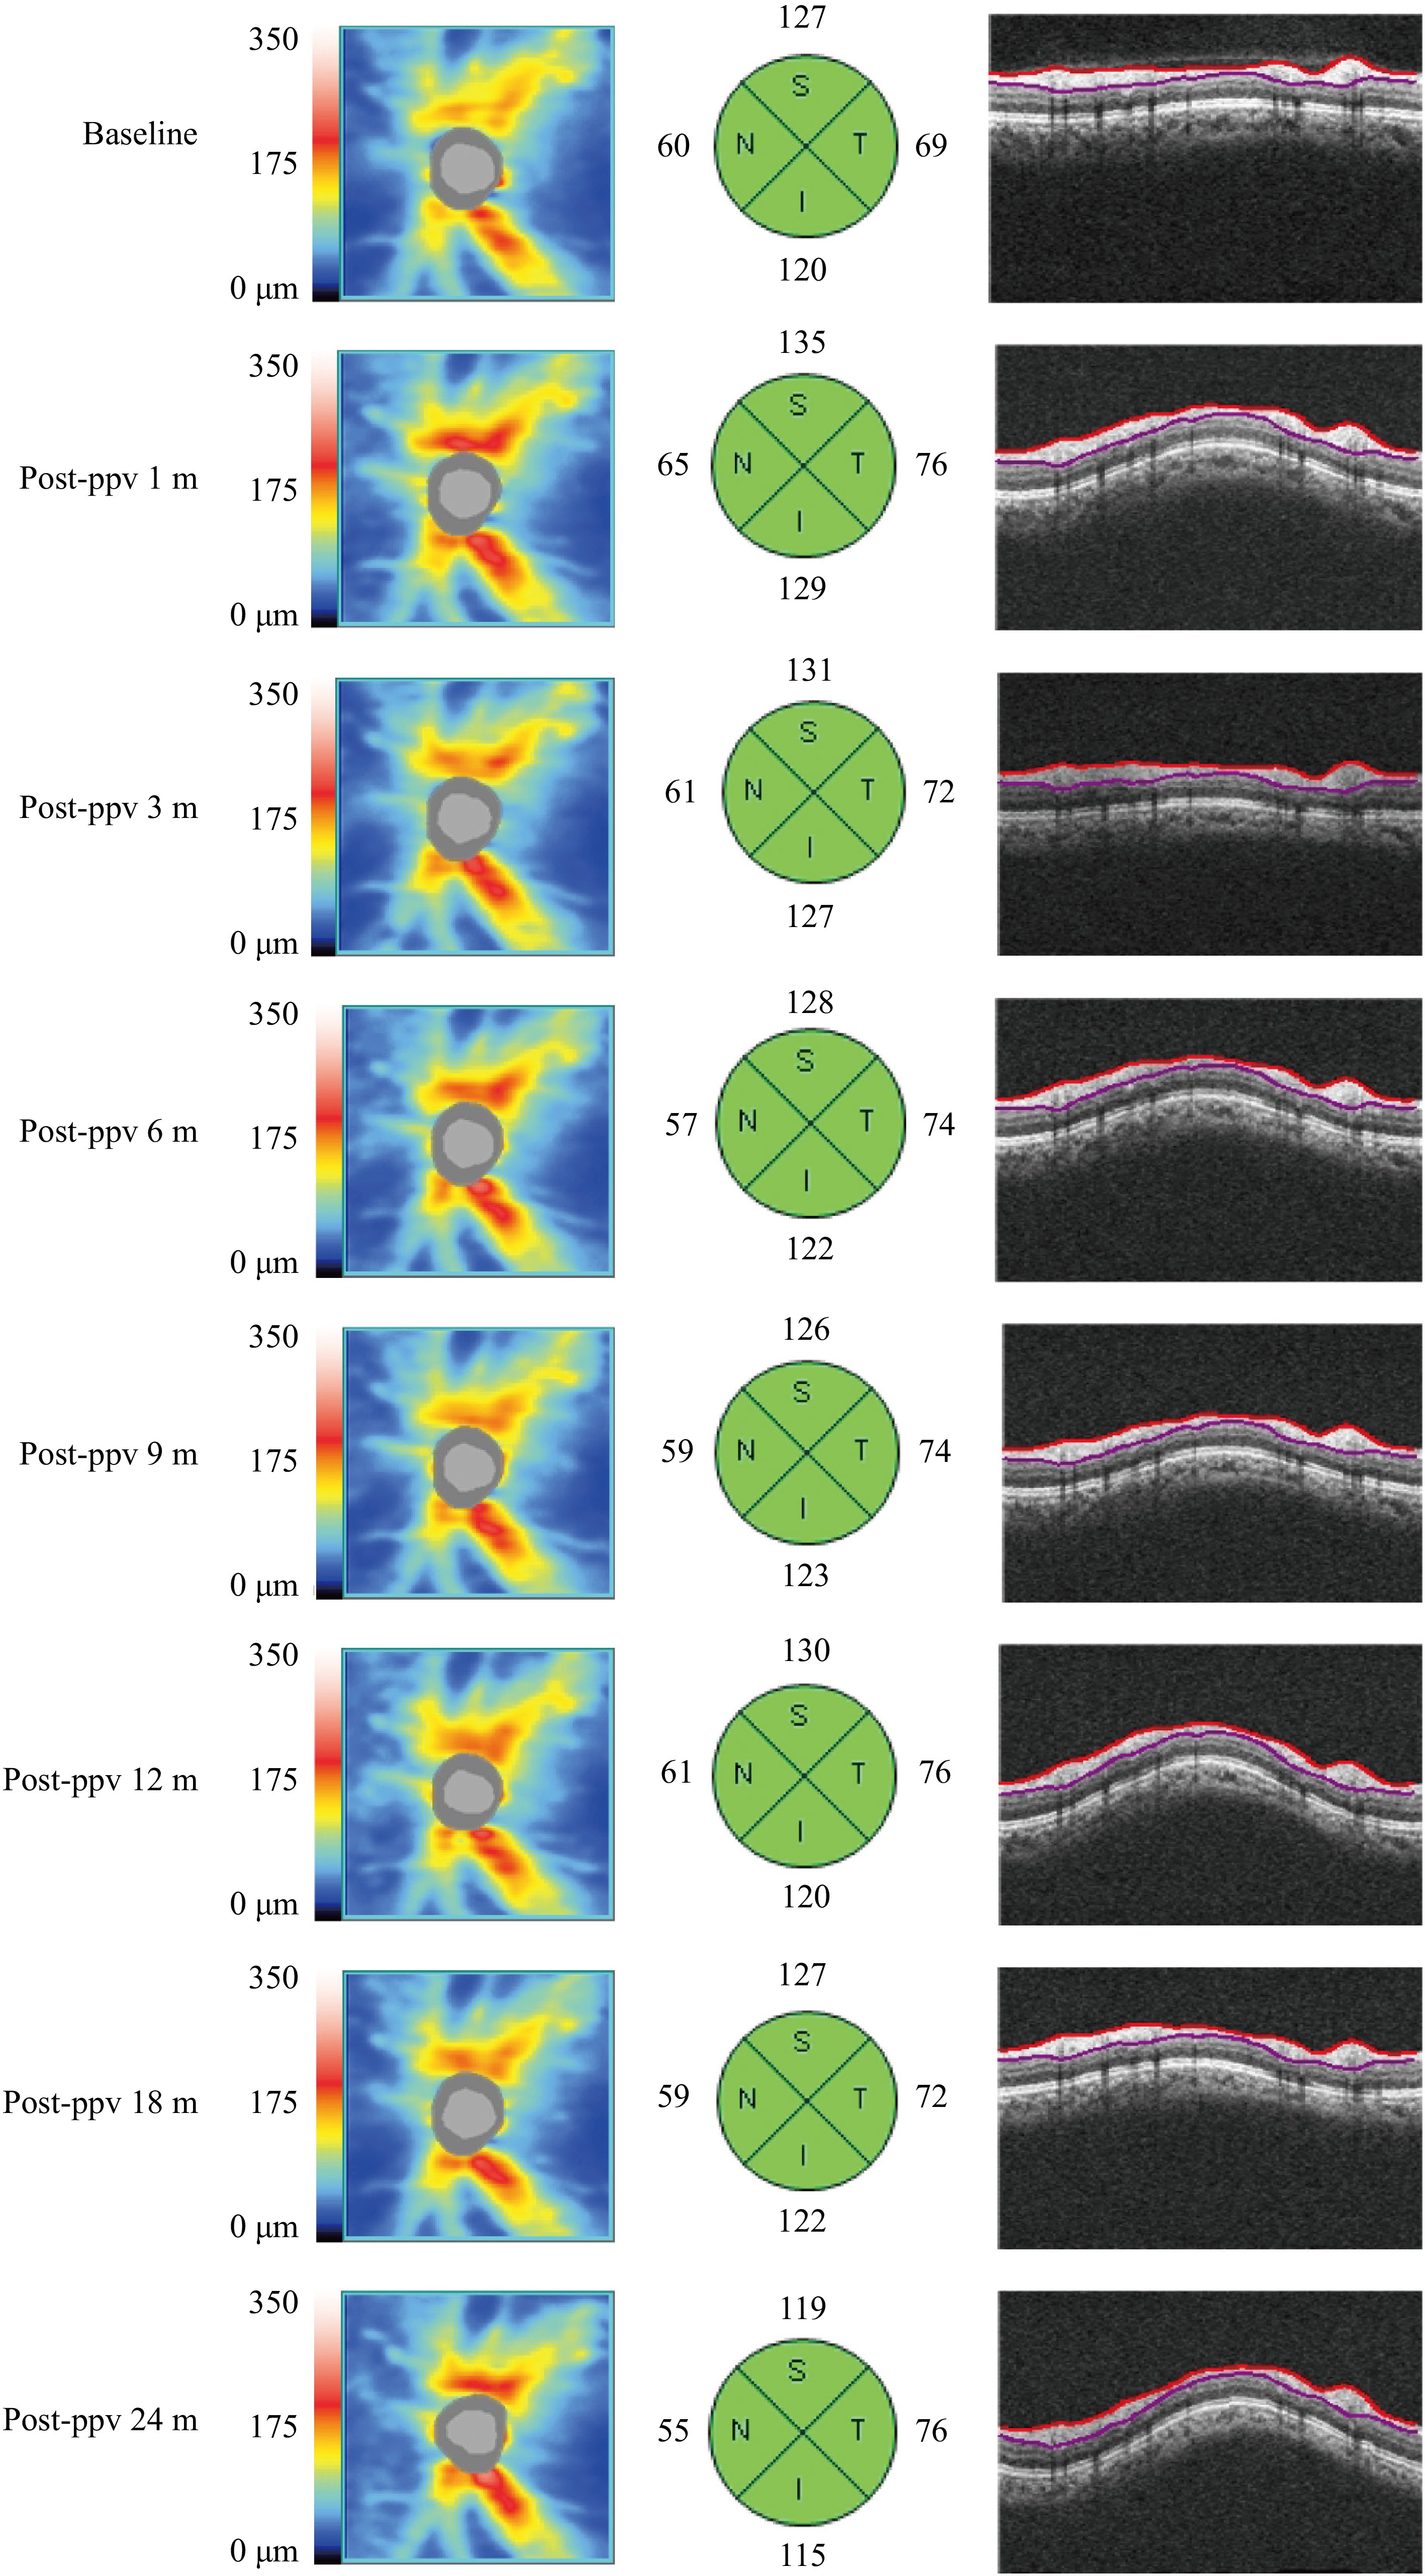
Figure 1.
A typical case of pRNFL changes in the PPV group. In an sNPDR patient, the pRNFL thickness in the superior, inferior, and nasal quadrants increased 1 month after PPV returned to baseline levels between 3 and 6 months, and steadily declined from 12 to 24 months. In contrast, the temporal pRNFL thickness increased 1 month post surgery and remained elevated at the long-term follow-up.
-
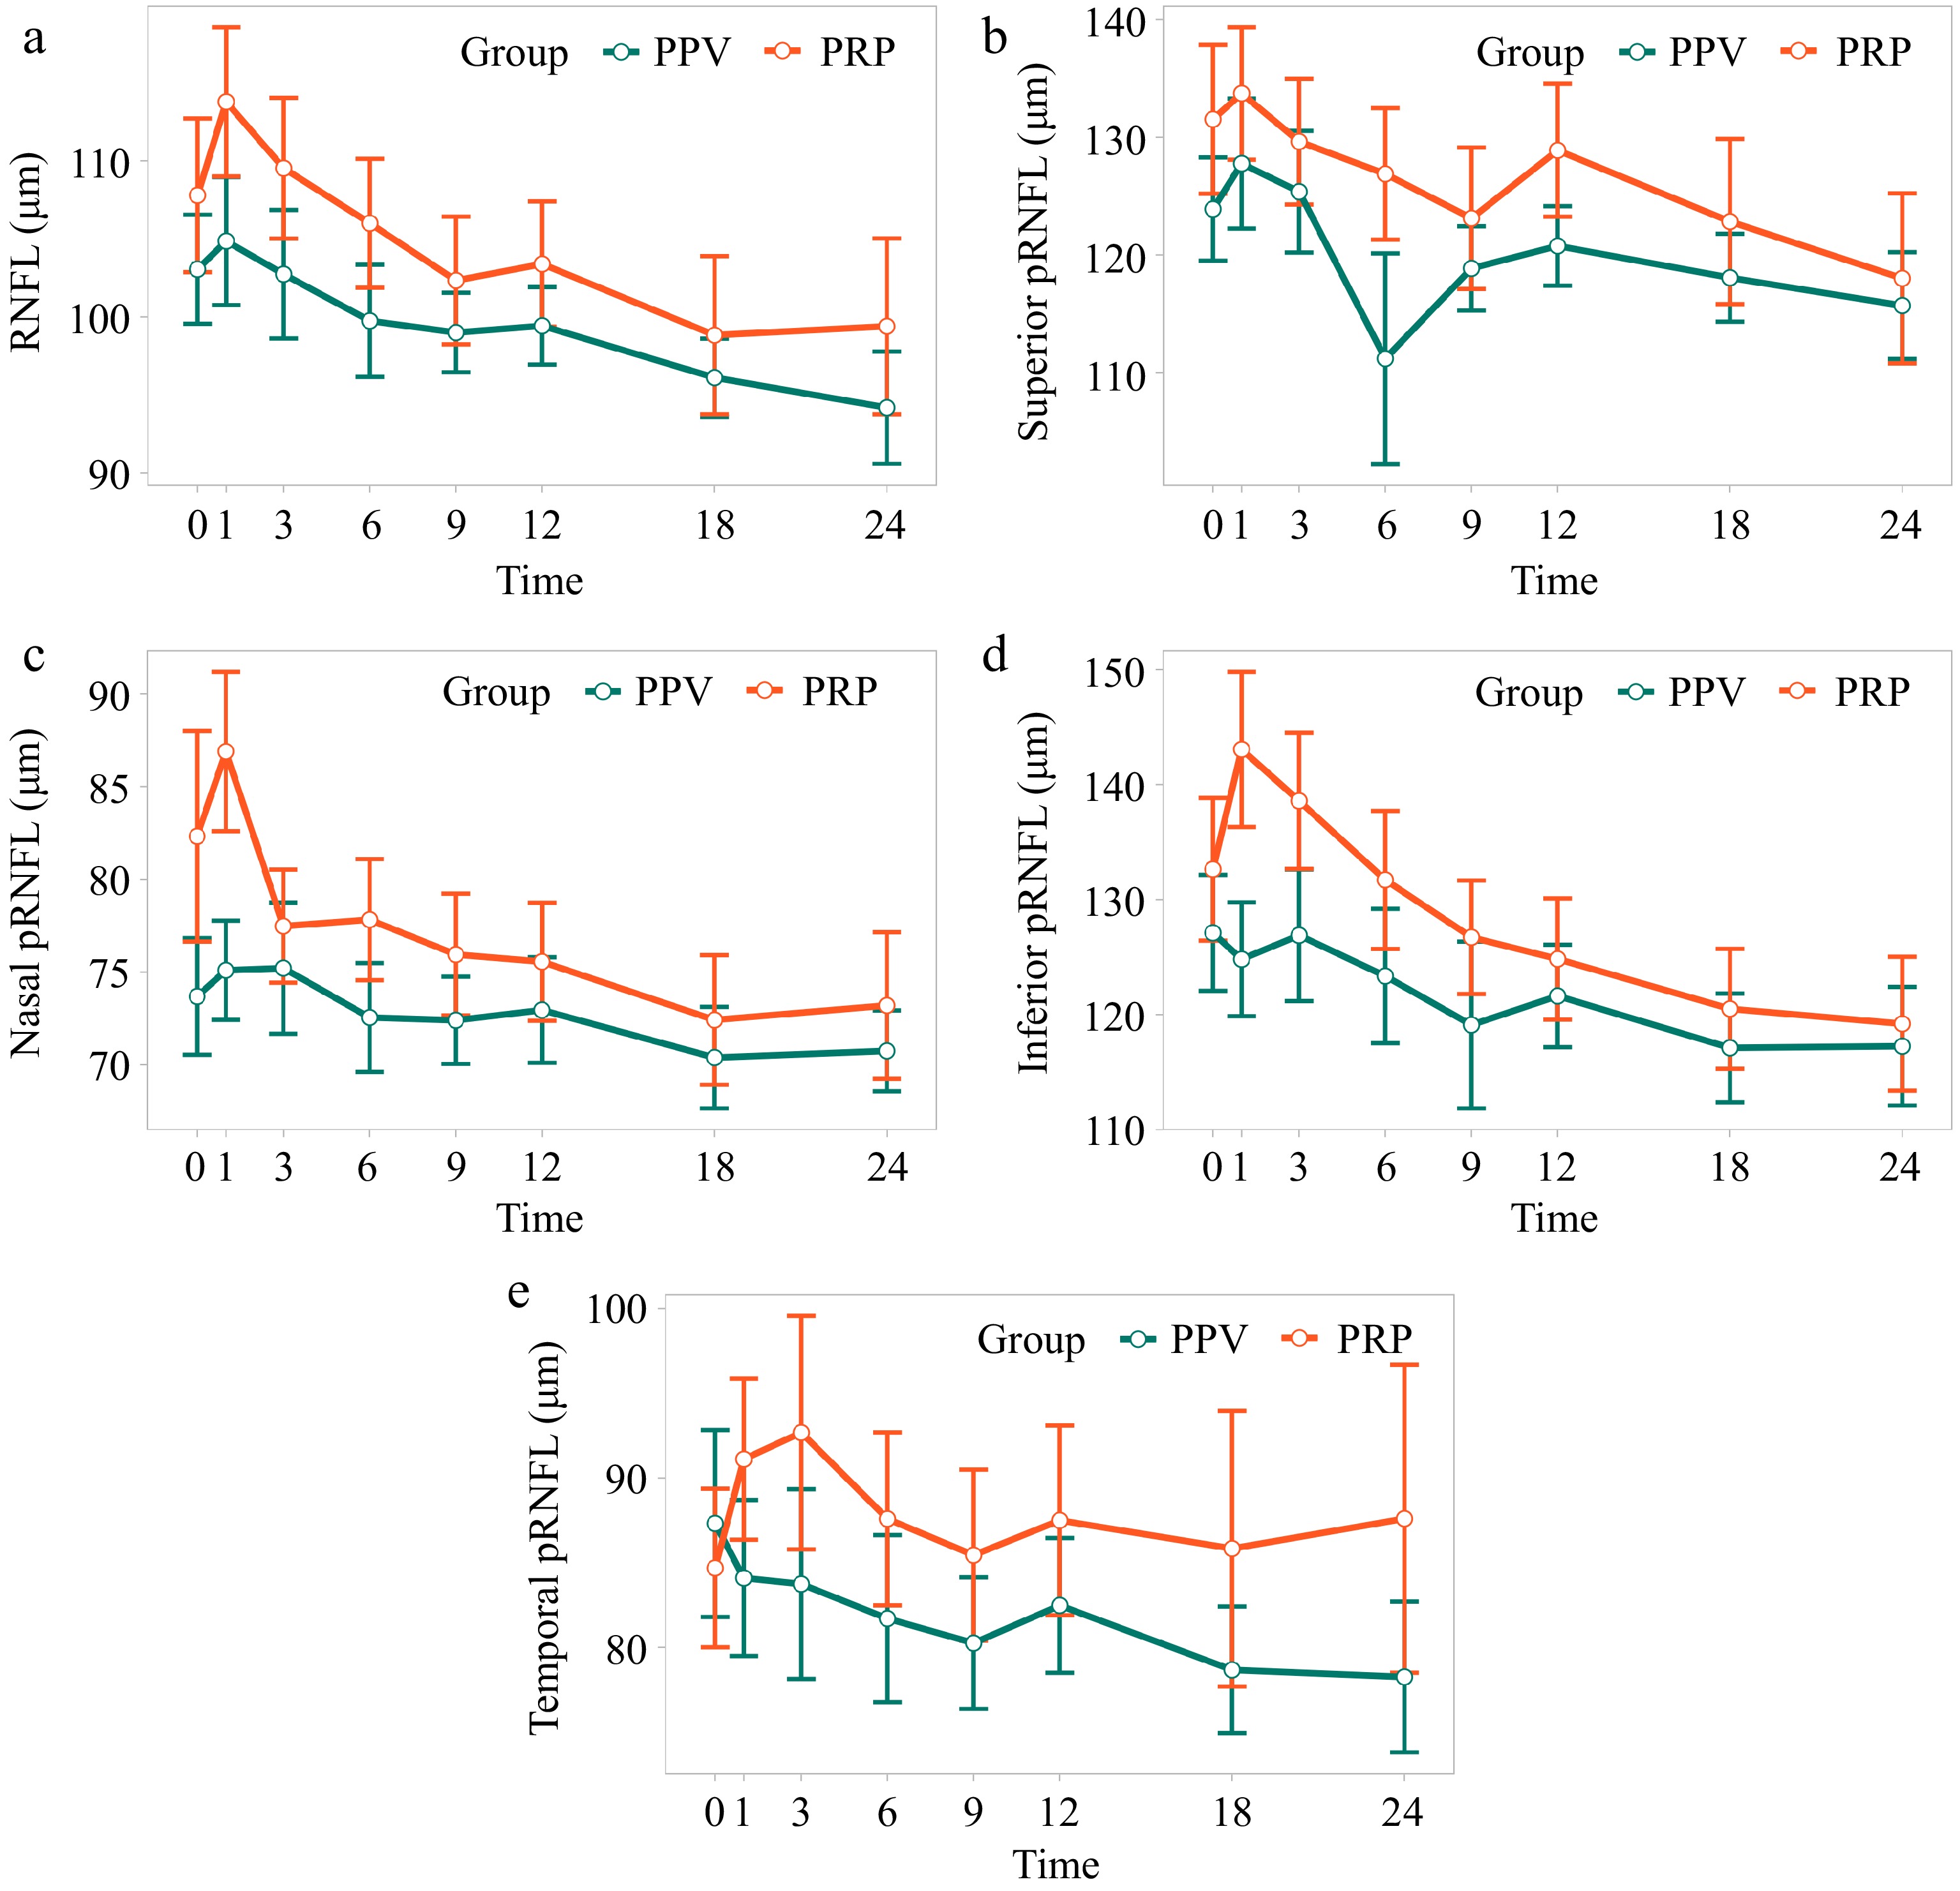
Figure 2.
Changes in pRNFL thickness in sNPDR patients with PRP and PPV. (a) Average pRNFL thickness. (b) Superior pRNFL thickness. (c) Nasal pRNFL thickness. (d) Inferior pRNFL thickness. (e) Temporal pRNFL thickness.
-
All PRP PPV p value N 38 19 19 / Age (years) 60.45 ± 8.80 62.00 ± 8.40 58.89 ± 9.14 0.28 Female (%) 18 (47%) 11 (58%) 7 (37%) 0.33 Pseudophakic eye (%) 16 (42%) 7 (39%) 9 (47%) 0.74 Duration of diabetes (years) 11.40 ± 7.48 11.49 ± 6.35 11.32 ± 8.64 0.989 Insulin therapy (yes, %) 19 (50%) 8 (42%) 11 (58%) 0.52 History of hypertension ( yes, %) 18 (47%) 10 (53%) 8 (42%) 0.75 SBP (mmHg) 131.32 ± 19.13 128.26 ± 16.12 134.37 ± 21.75 0.33 DBP (mmHg) 73 ± 9.82 71.58 ± 10.98 74.42 ± 8.57 0.42 BMI 24.78 ± 4.47 25.21 ± 6.11 24.36 ± 2.92 0.86 Blood biomarker Total cholesterol (mmol/L) 4.95 ± 1.20 5.08 ± 1.44 4.81 ± 0.92 0.51 Triglyceride (mmol/L) 1.77 ± 1.05 1.95 ± 1.27 1.559 ± 0.77 0.54 BUN (mmol/L) 7.33 ± 3.32 7.95 ± 4.24 6.70 ± 1.98 0.51 ALT (U/L) 31.41 ± 18.95 35.29 ± 23.59 27.53 ± 12.22 0.60 AST (U/L) 26.93 ± 12.78 26.85 ± 11.92 27.00 ± 13.92 0.75 Creatinine (μmol/L) 77.96 ± 39.92 83.28 ± 47.47 72.63 ± 31.03 0.17 HbA1c (%) 7.79 ± 1.35 7.87 ± 1.61 7.71 ± 1.07 0.95 DME (yes, %) 16 (42%) 8 (42%) 8 (42%) 1.00 Average pRNFL (μm) 105 ± 18.50 107.79 ± 21.46 103.05 ± 15.21 0.56 Average mGCIPL (μm)a 83.35 ± 9.12 85.45 ± 9.32 81.42 ± 8.89 0.34 PPV, pars plana vitrectomy; PRP, pan-retinal photocoagulation; SBP, systolic blood pressure; DBP, diastolic blood pressure; BMI, body mass index; BUN, blood urea nitrogen; ALT, alanine transaminase; AST, aspartate aminotransferase; HbA1c, hemoglobin A1c; DME, diabetic macular edema, which defined as central subfield thickness ≥ 300 μm; pRNFL, parapapillary retinal nerve fiber layer. mGCIPL, macular ganglion cell inner plexus layer. a, Due to inaccuracies in the identification line, the PPV group included 12 participants and the PRP group included 11 participants in the mGCIPL thickness statistical analysis. Table 1.
Demographics and clinical characteristics of participants at baseline.
-
Average pRNFL thickness Temporal pRNFL thickness Nasal pRNFL thickness Superior pRNFL thickness Inferior pRNFL thickness Intercept 105.85 (3.67) *** 86.56 (4.71) *** 78.11 (3.18) *** 128.94 (4.89) *** 129.76 (5.16) *** T0−T1 5.64 (1.42) *** 3.23 (2.28) 3.23 (1.63) * 5.34 (1.92) ** 5.31 (2.14) * T0−T3 1.83 (1.46) 4.44 (2.31) −1.56 (1.66) 0.57 (1.97) 3.99 (2.18) T0−T6 −1.76 (1.63) −0.84 (2.46) −2.81 (1.77) −2.58 (2.15) −0.60 (2.35) T0−T9 −2.97 (1.85) −1.45 (2.65) −3.16 (1.93) −4.55 (2.39) −3.02 (2.58) T0−T12 −3.45 (2.10) −1.11 (2.84) −3.70 (2.09) −3.49 (2.65) −5.40 (2.82) T0−T18 −8.94 (2.85) ** −5.69 (3.64) −8.13 (2.69) ** −9.13 (3.54) * −12.00 (3.70) ** T0−T24 −10.72 (3.62) ** −5.09 (4.46) −8.13 (3.31) * −12.12 (4.45) ** −15.03 (4.60) ** PPV −0.86 (4.00) −1.13 (5.52) −0.23 (3.15) −2.46 (5.97) −0.23 (6.09) Observation 259 259 259 259 259 AIC 1,879.67 2,092.71 1,905.59 2,036.73 2,079.71 BIC 1,925.91 2,138.95 1,951.82 2,082.97 2,125.95 logLik −926.84 −1,033.36 −939.79 −1,005.37 −1,026.86 pRNFL, parapapillary retinal nerve fiber layer; T0, baseline; T1−T24, 1 month to 24 months post-PPV; Observation, the total number of observations included in the mode AIC, Akaike information criterion; BIC, Bayesian information criterion; logLik, log-likelihood. The values in the table represent the estimated effect and corresponding standard error, rounded to two decimal places. * p < 0.05; ** p < 0.01; *** p < 0.001. Table 2.
Time and group effects on pRNFL thickness in sNPDR patients.
Figures
(2)
Tables
(2)