-
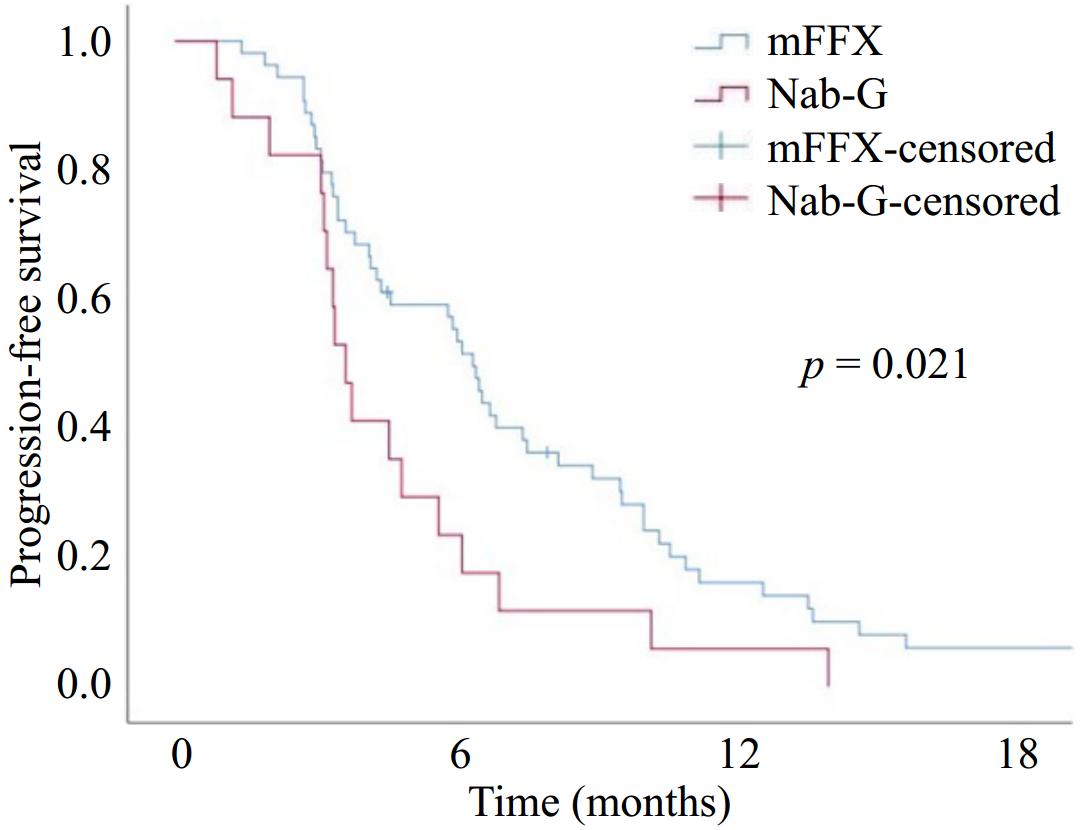
Figure 1.
Progression-free survival with modified FOLFIRINOX (mFFX) and Nab-paclitaxel + Gemcitabine (Nab-G).
-
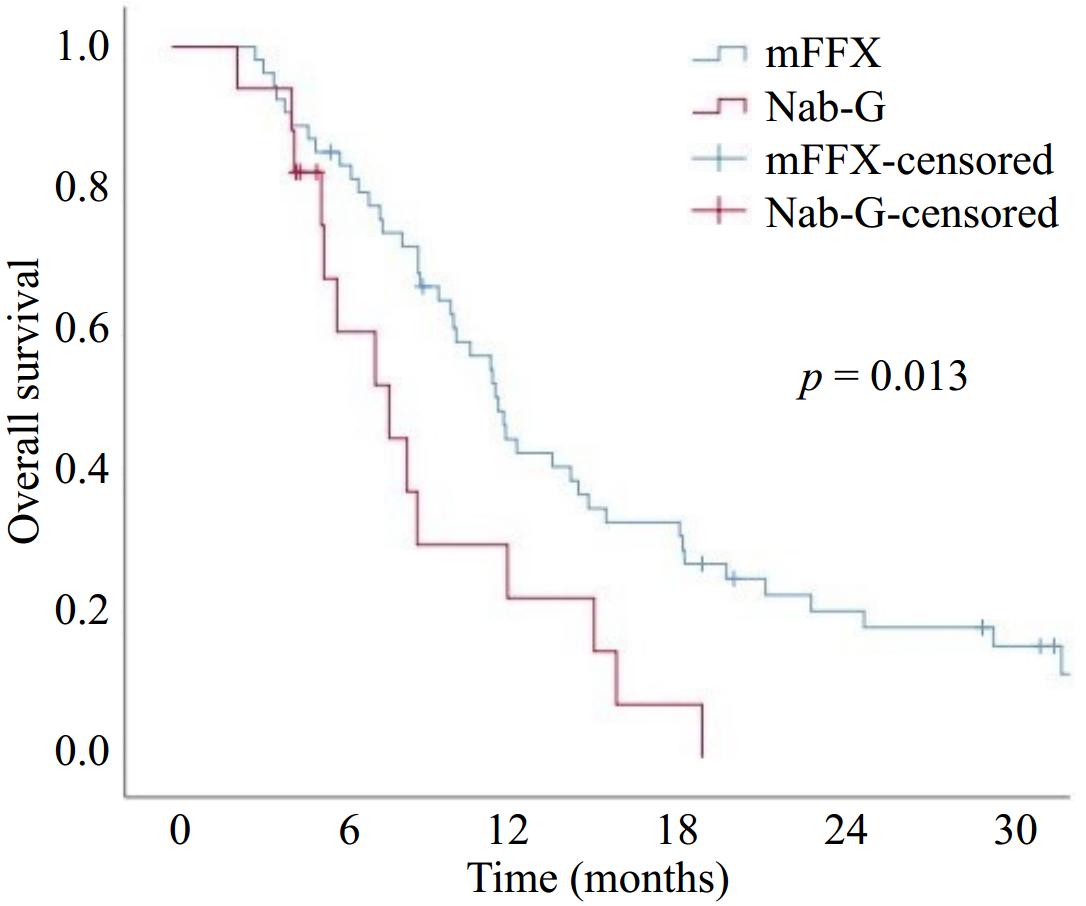
Figure 2.
Overall survival with modified FOLFIRINOX (mFFX) and Nab-paclitaxel + Gemcitabine (Nab-G).
-
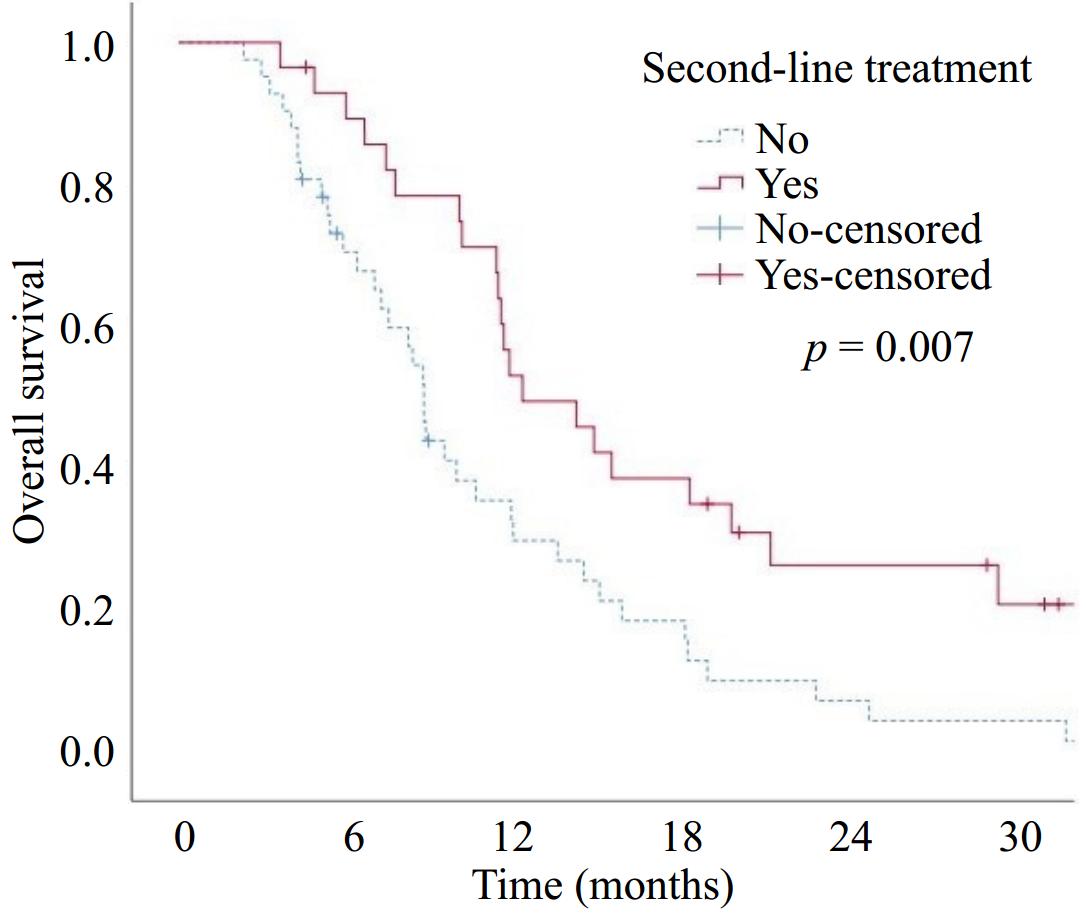
Figure 3.
Overall survival according to second-line treatment.
-
Variables Total
(n = 71)mFFX
(n = 54)Nab-G
(n = 17)p-value Age, median (min-max) 63.0 (37−82) 63.0 (37−82) 63.0 (42−77) 0.762 Gender, n (%) Female 25 (35.2) 17 (31.5) 8 (47.1) 0.241 Male 46 (64.8) 37 (68.5) 9 (52.9) ECOG PS, n (%) 0 14 (19.7) 13 (24.1) 1 (5.9) 0.197 1 40 (56.3) 30 (55.6) 10 (58.8) 2 17 (23.9) 11 (20.4) 6 (35.3) T stage, n (%) T2 19 (26.8) 17 (31.5) 2 (11.8) 0.207 T3 35 (49.3) 26 (48.1) 9 (52.9) T4 17 (23.9) 11 (20.4) 6 (35.3) Median tumor diameter, cm (IQR) 4.5 (2.7) 4.5 (2.9) 4.5 (1.8) 0.267 Tumor diameter, cm, n (%)* ≤ 4.50 38 (53.5) 29 (53.7) 9 (52.9) 0.839 > 4.50 31 (43.6) 23 (42.6) 8 (47.1) Primary tumor location, n (%) Head 35 (49.3) 24 (44.4) 11 (64.7) 0.443 Corpus 18 (25.4) 15 (27.8) 3 (17.6) Tail 18 (25.4) 15 (27.8) 3 (17.6) CA 19.9 (U/ml), median (IQR) 1,361 (4,882.6) 1,506.6 (4,956.8) 698.8 (6,364.1) 0.370 Liver metastasis, n (%) No 21 (29.6) 18 (33.3) 3 (17.6) 0.055 Yes 50 (70.4) 36 (66.7) 14 (82.4) Lung metastasis, n (%) No 57 (80.3) 42 (77.8) 15 (88.2) 0.493 Yes 14 (19.7) 12 (22.2) 2 (11.8) Bone metastasis, n (%) No 65 (91.5) 50 (92.6) 15 (88.2) 0.625 Yes 6 (8.5) 4 (7.4) 2 (11.8) Lymph node metastasis, n (%) No 23 (32.4) 16 (29.6) 7 (41.2) 0.375 Yes 48 (67.6) 38 (70.4) 10 (58.8) Other metastasis sites, n (%) No 60 (84.5) 43 (79.6) 17 (100) 0.055 Yes** 11 (15.5) 11 (20.4) 0 (0) mFFX, modified FOLFIRINOX; Nab G, Nab-paclitaxel + Gemcitabine; ECOG PS, Eastern Cooperative Oncology Group Performance Status. * The maximum tumor diameter of two patients on imaging was not specified, ** Periton or surrenal gland metastasis. Table 1.
Baseline demographic and clinicopathologic characteristics of the patients.
-
Best response, n (%) First-line treatment p-value mFFX Nab-G Objective response rate (CR + PR) 22 (40.7) 4 (23.5) 0.199 Disease control rate (CR + PR + SD) 35 (64.8) 5 (29.4) 0.010 SD 13 (24.1) 1 (5.9) 0.068 PR 17 (31.5) 4 (23.5) CR 5 (9.3) 0 (0) PD 19 (35.2) 12 (70.6) mFFX, modified FOLFIRINOX; Nab-G, nab-paclitaxel + Gemcitabine; SD, stable disease; PR, partial response; CR, complete response; PD, progressive disease; the number in bold indicates statistical significance. Table 2.
Efficacy of first-line treatments.
-
Variables Univariate analysis (PFS) Univariate analysis (OS) HR (95% CI) p-value HR (95% CI) p-value Gender (ref: male) 1.20 (0.73−1.98) 0.472 1.41 (0.82−2.41) 0.210 Age 1.01 (0.98−1.03) 0.731 1.02 (0.99−1.04) 0.129 ECOG PS (ref: 0) 0.244 0.101 1 0.94 (0.50−1.76) 0.852 0.85 (0.44−1.61) 0.621 2 1.55 (0.75−3.18) 0.230 1.70 (0.81−3.56) 0.157 T stage (ref: T2) 0.934 0.622 T3 0.95 (0.54−1.72) 0.887 0.79 (0.42−1.47) 0.465 T4 1.07 (0.51−2.11) 0.845 1.06 (0.51−2.22) 0.879 Tumor diameter, cm (ref: ≤ 4.50) 0.77 (0.47−1.26) 0.308 1.02 (0.60−1.72) 0.930 Primary tumor location (ref: head) 0.352 0.339 Corpus 0.68 (0.37−1.23) 0.207 0.87 (0.46−1.65) 0.678 Tail 0.72 (0.40−1.30) 0.278 0.62 (0.33−1.17) 0.142 CA 19.9 level (ref: < 1361 U/ml) 0.85 (0.51−1.42) 0.547 0.77 (0.44−1.34) 0.364 Liver metastasis (ref: no) 0.94 (0.56−1.58) 0.836 0.80 (0.46−1.39) 0.433 Lung metastasis (ref: no) 1.20 (0.66−2.19) 0.540 1.51 (0.80−2.85) 0.198 Bone metastasis (ref: no) 1.05 (0.45−2.46) 0.904 1.47 (0.62−3.44) 0.376 Lymph node metastasis (ref: no) 1.26 (0.75−2.13) 0.370 1.13 (0.65−1.98) 0.657 PFS, progression−free survival; OS, overall survival; HR, hazard ratio; CI, confidence interval; ref, reference; ECOG PS, Eastern Cooperative Oncology Group Performance Status. As no statistically significant variables were identified in the univariate analysis, multivariate analysis was not performed. Table 3.
Univariate Cox regression analysis for progression-free survival and overall survival.
-
First-line treatment Second-line treatment n (%) mFFX None 24 (47) Nab-G 18 (35.3) Gemcitabine 6 (11.8) Cisplatin + Gemcitabine 3 (5.9) Nab-G None 15 (88.2) mFFX 1 (5.9) mFOLFOX6 1 (5.9) mFFX, modified FOLFIRINOX; Nab-G, nab-paclitaxel + Gemcitabine. Table 4.
Second-line treatments.
-
Adverse event, n (%) mFFX (n = 54) Nab-G (n = 17) p-value Grade 1−2 Grade 3−4 Grade 1−2 Grade 3−4 Hematologic Neutropenia 9 (17) 18 (33) 2 (12) 5 (29) 0.596 Anemia 14 (26) 6 (11) 7 (41) 3 (18) 0.669 Thrombocytopenia 16 (29) 7 (13) 3 (18) 5 (29) 0.206 Non-hematologic Fatigue 27 (50) 1 (2) 12 (70) 2 (12) 0.254 Nausea 15 (28) 7 (13) 8 (47) 1 (6) 0.379 Vomiting 17 (31) 3 (5) 6 (35) 1 (6) 1.000 Diarrhea 5 (9) 0 0 0 N/A Stomatitis/mucositis 8 (15) 1 (2) 3 (18) 1 (6) 1.000 mFFX Nab-G p-value Febrile neutropenia 2 (4) 0 0.631 Dose reduction 31 (57) 3 (18) 0.004 Dose delay 32 (59) 12 (70) 0.401 Hospitalization 14 (26) 6 (35) 0.540 mFFX, modified FOLFIRINOX; Nab-G, nab-paclitaxel + Gemcitabine; N/A, not applicable. Fisher's Exact test; numbers in bold indicate statistical significance. Table 5.
Safety profile of first-line treatment options.
Figures
(3)
Tables
(5)