-
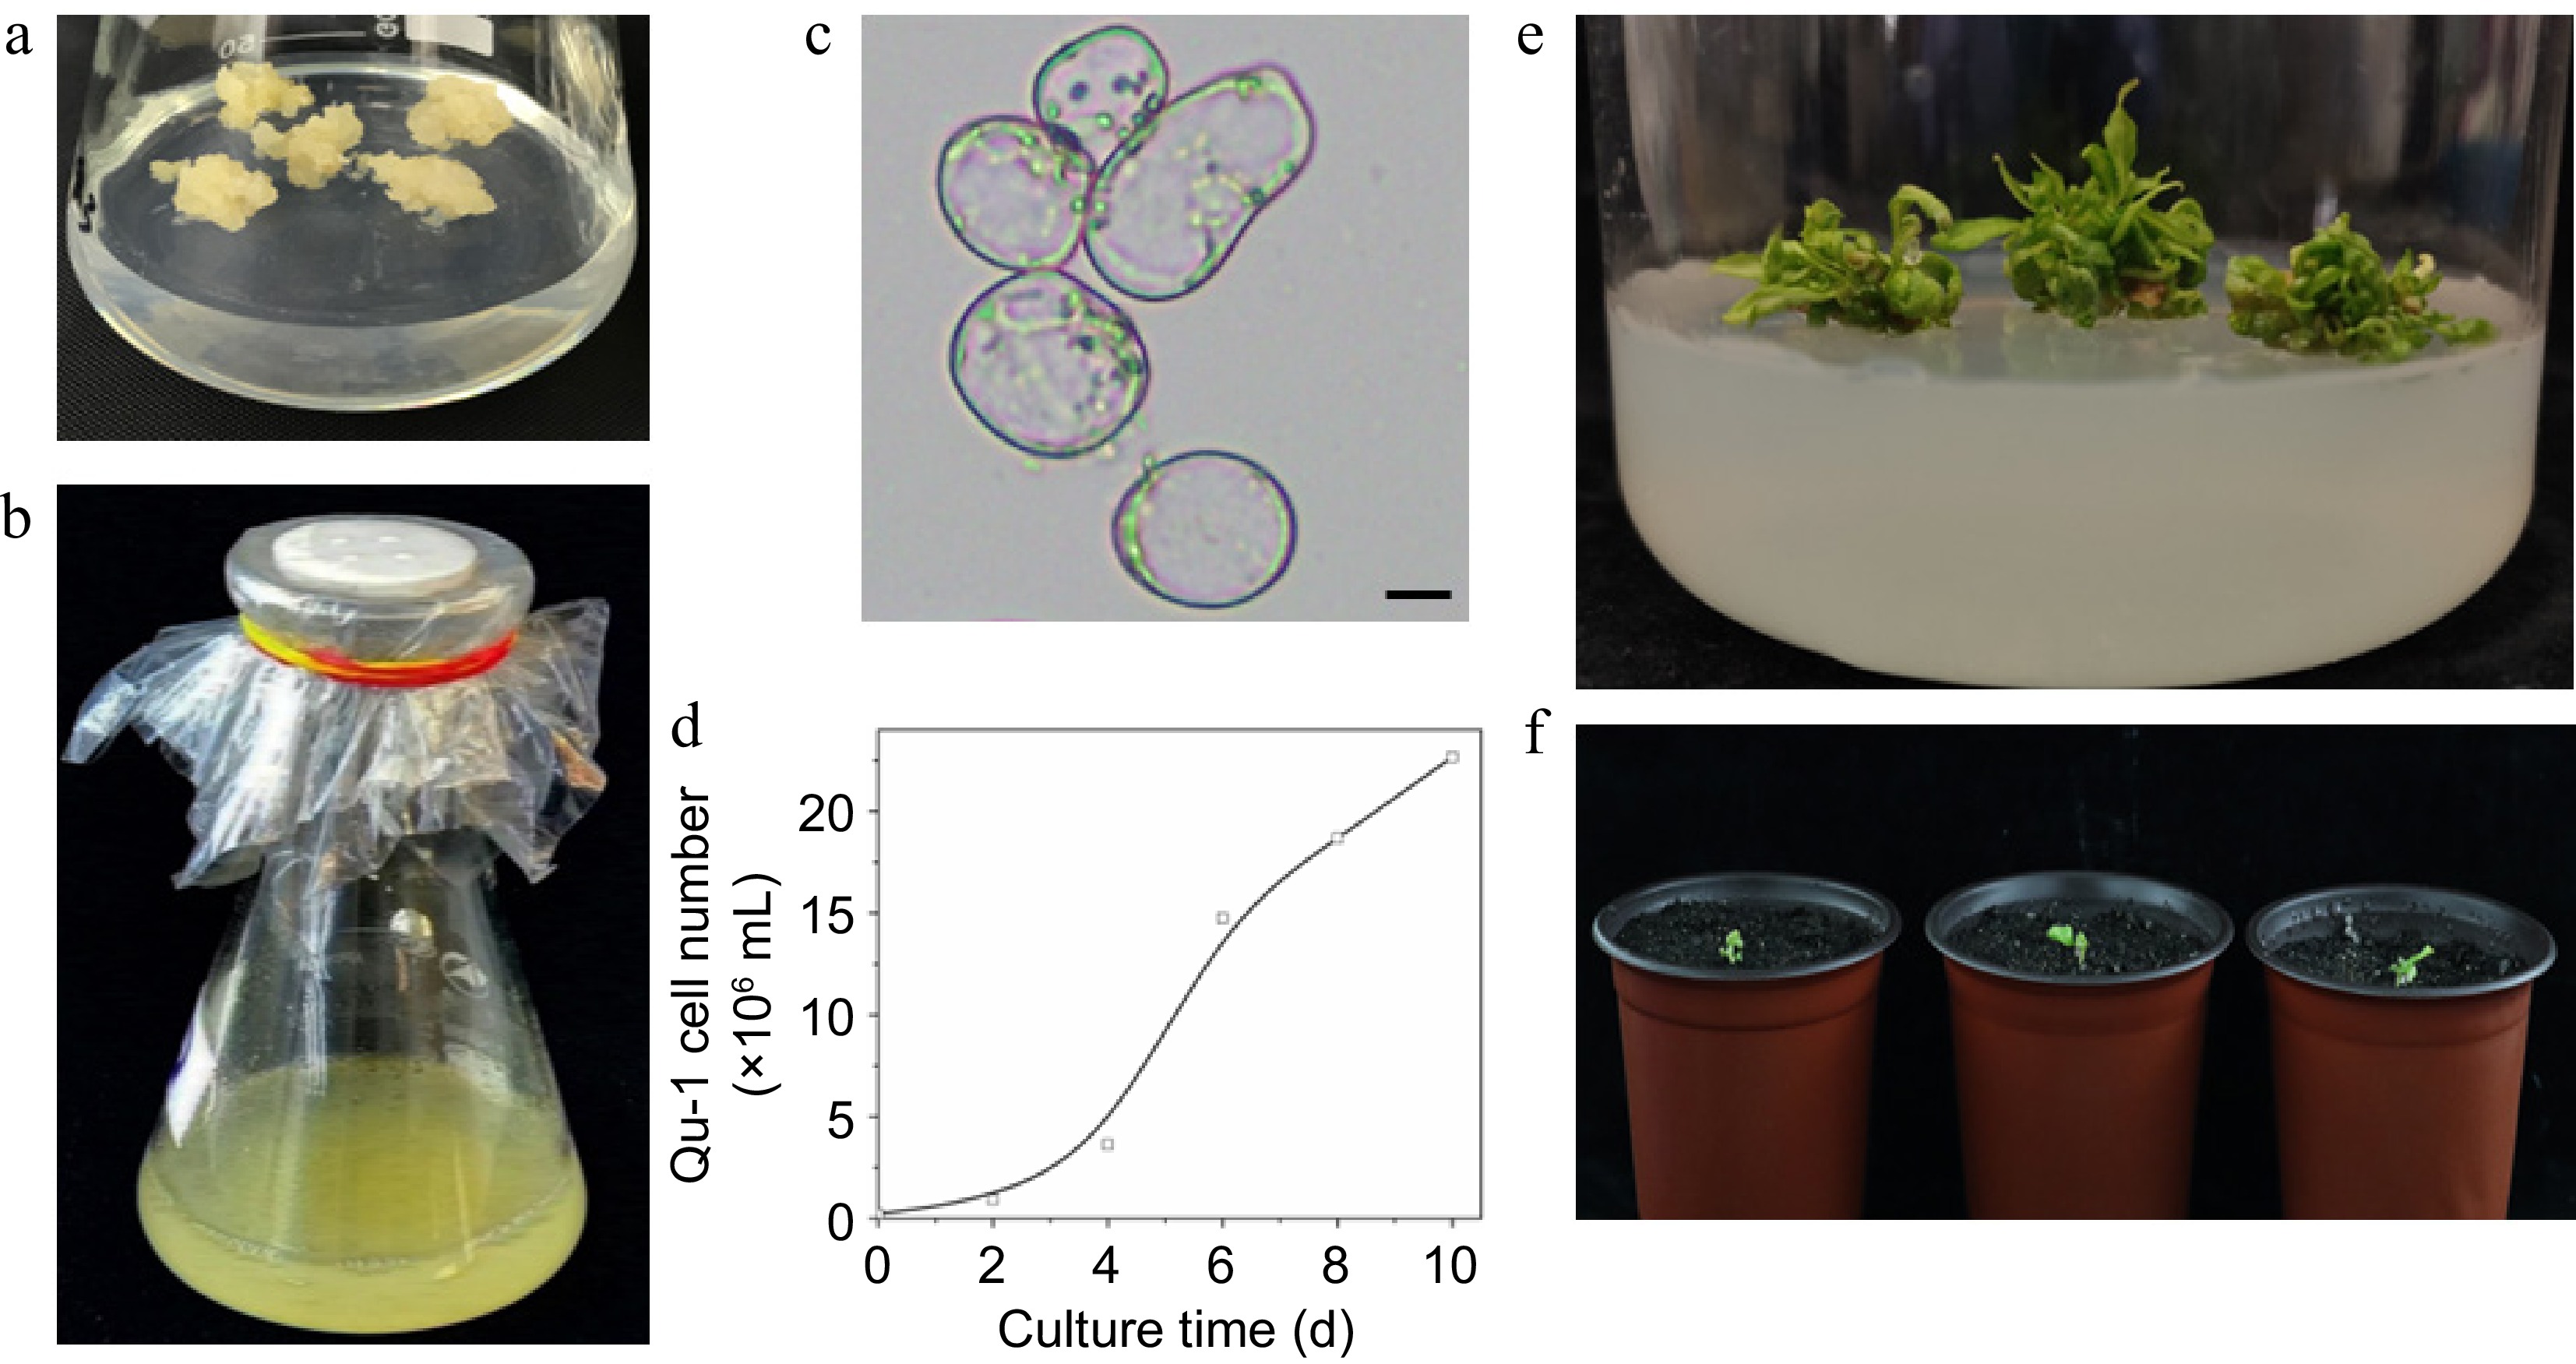
Figure 1.
Growth characteristics of the doubled haploid cell line Qu-1 derived from poplar. (a), (b) Growth status of Qu-1 under solid culture and suspension culture conditions. (c) Microscopic observation of Qu-1 cell morphology. Scale bar = 10 μm. (d) Statistics of the number of cells per unit volume of Qu-1 under suspension culture conditions. (e) Clustered adventitious shoots obtained by inducing Qu-1. (f) Whole plants of Qu-1 obtained by induction.
-
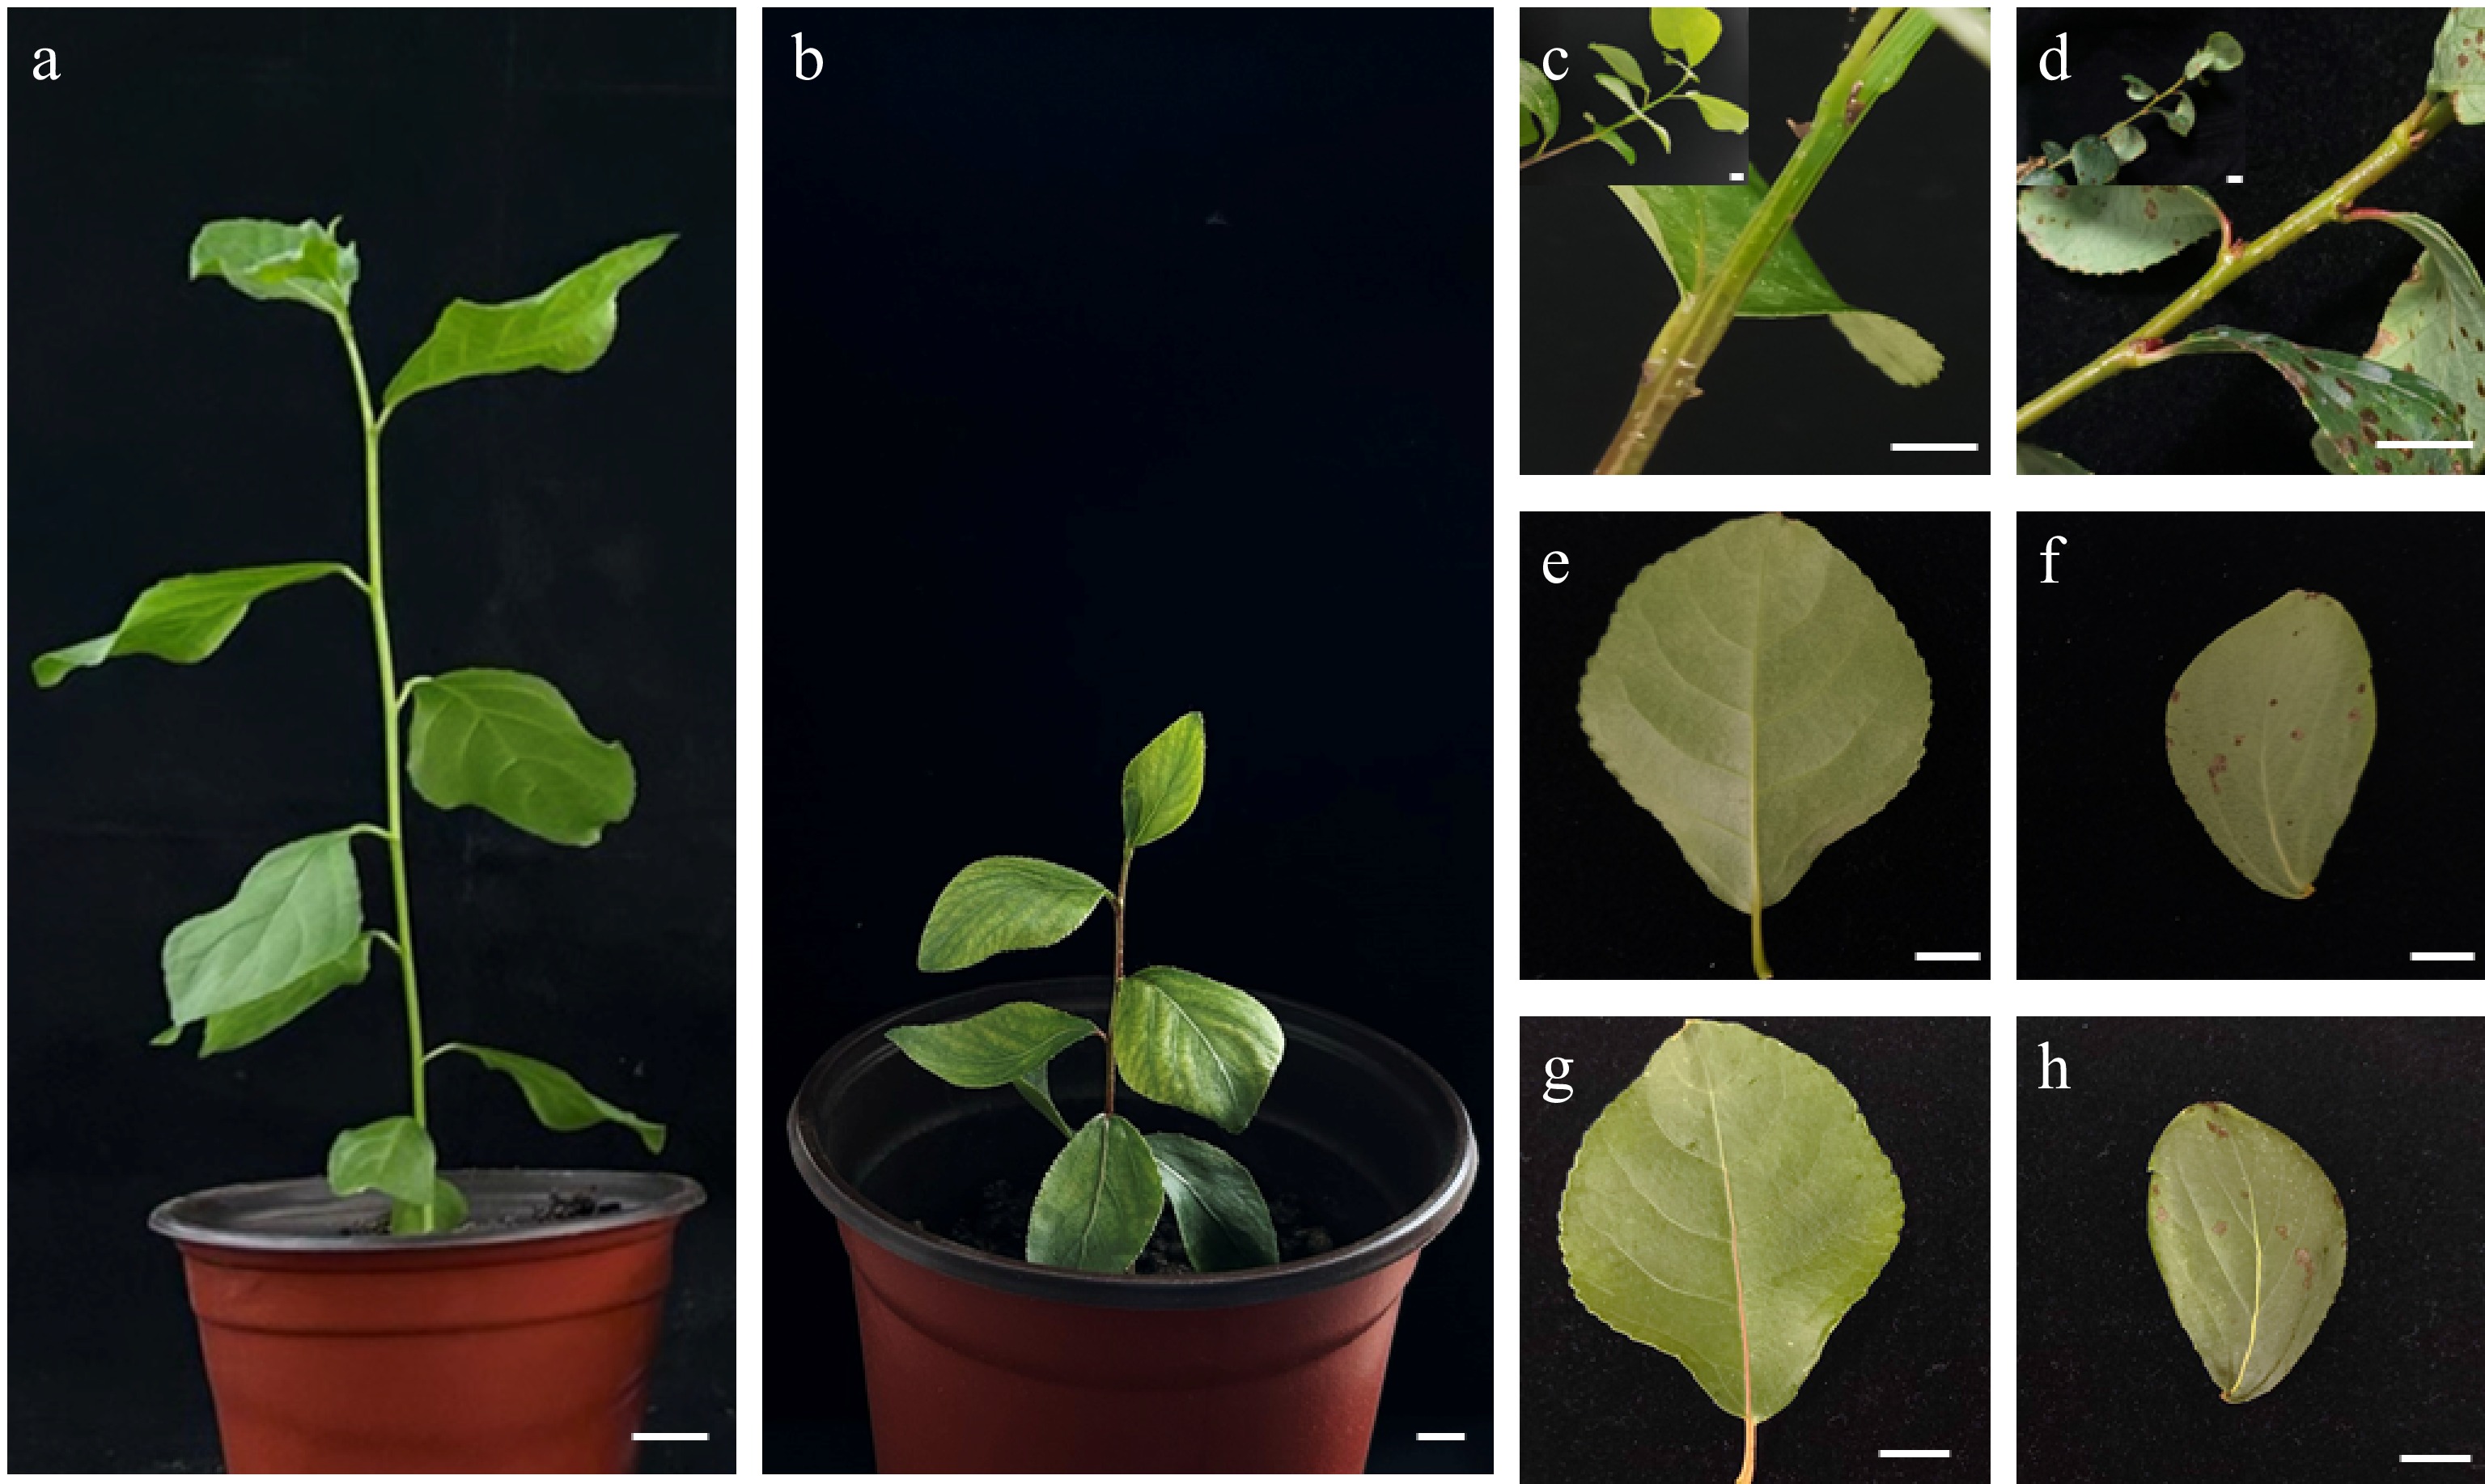
Figure 2.
Analysis of phenotypic differences between Qu-1 and donor tree (DT) plants. (a) One-month-old DT plants cultured under greenhouse conditions. (b) Two-month-old Qu-1 plants cultured under greenhouse conditions. Scale bar = 1 cm. (c), (d) Stem segments of DT and Qu-1 plants, respectively. Scale bar = 1 cm. (e), (g) The lower and upper surfaces of leaves of DT plants, respectively. Scale bar = 1 cm. (f), (h) The lower and upper surfaces of leaves of Qu-1 plants, respectively. Scale bar = 1 cm.
-
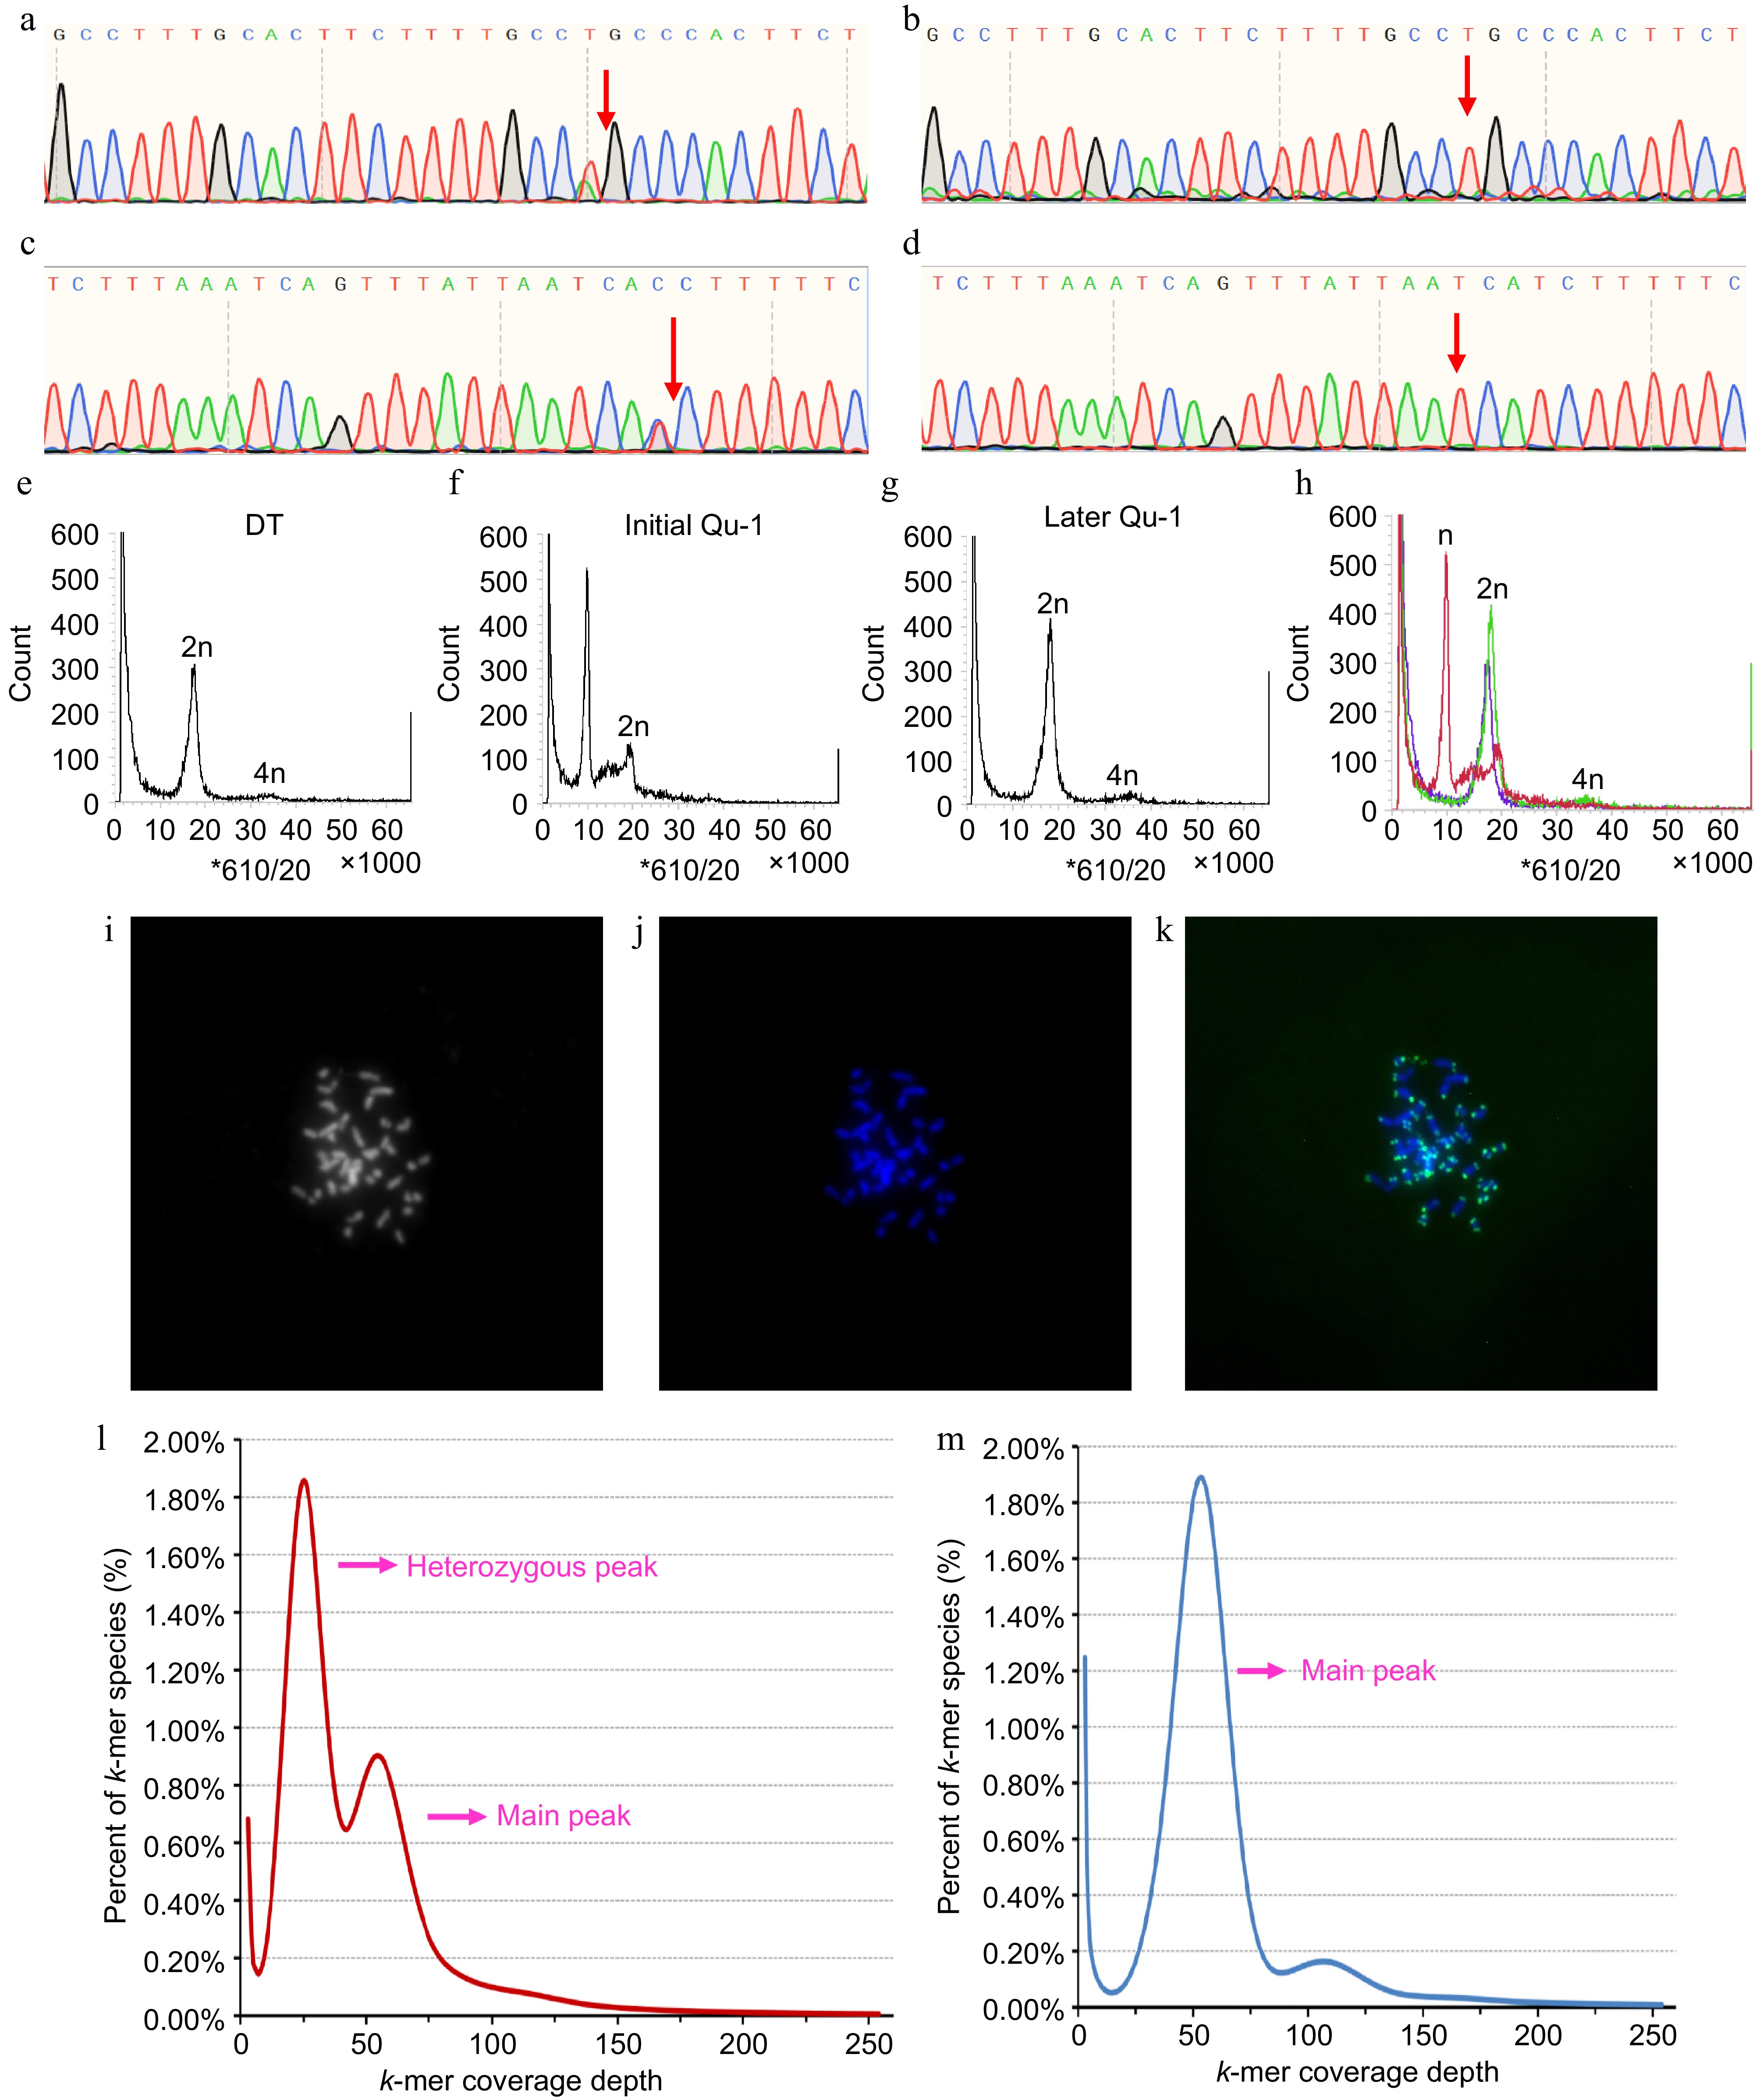
Figure 3.
Homozygosity and ploidy analysis of Qu-1. (a)−(d) Homozygosity of Qu-1 and DT was detected by SNP-PCR method. (a), (c) Sequencing peaks of PCR products of DT with different specific SNP sites based on Sanger sequencing. (b), (d) Sequencing peaks of PCR products of Qu-1 with different specific SNP sites based on Sanger sequencing. The red arrows represent the SNP sites. (e) Ploidy analysis of diploid DT. (f), (g) Ploidy analysis of Qu-1 at early (i.e., just obtained), and late (i.e., current state) stages. (h) Merge of (e), (f), and (g). Red: represents the ploidy of Qu-1 at the early (i.e., just obtained) stage; green: represents the ploidy of Qu-1 at the late (i.e., current state) stage; blue: represents the ploidy DT. (i)−(k) Detection of chromosome number and structure of Qu-1 by the FISH method. 2n = 38. (i) Chromosome status of Qu-1 under bright field. (j) Fluorescence detection of chromosome status of Qu-1 after DAPI staining. (k) Detection of telomere distribution in Qu-1 chromosome using a telomere-specific probe. Blue represents DAPI-stained chromosomes, and green signals indicate telomere localization. (l) k-mer analysis of DT. (m) k-mer analysis of Qu-1.
-
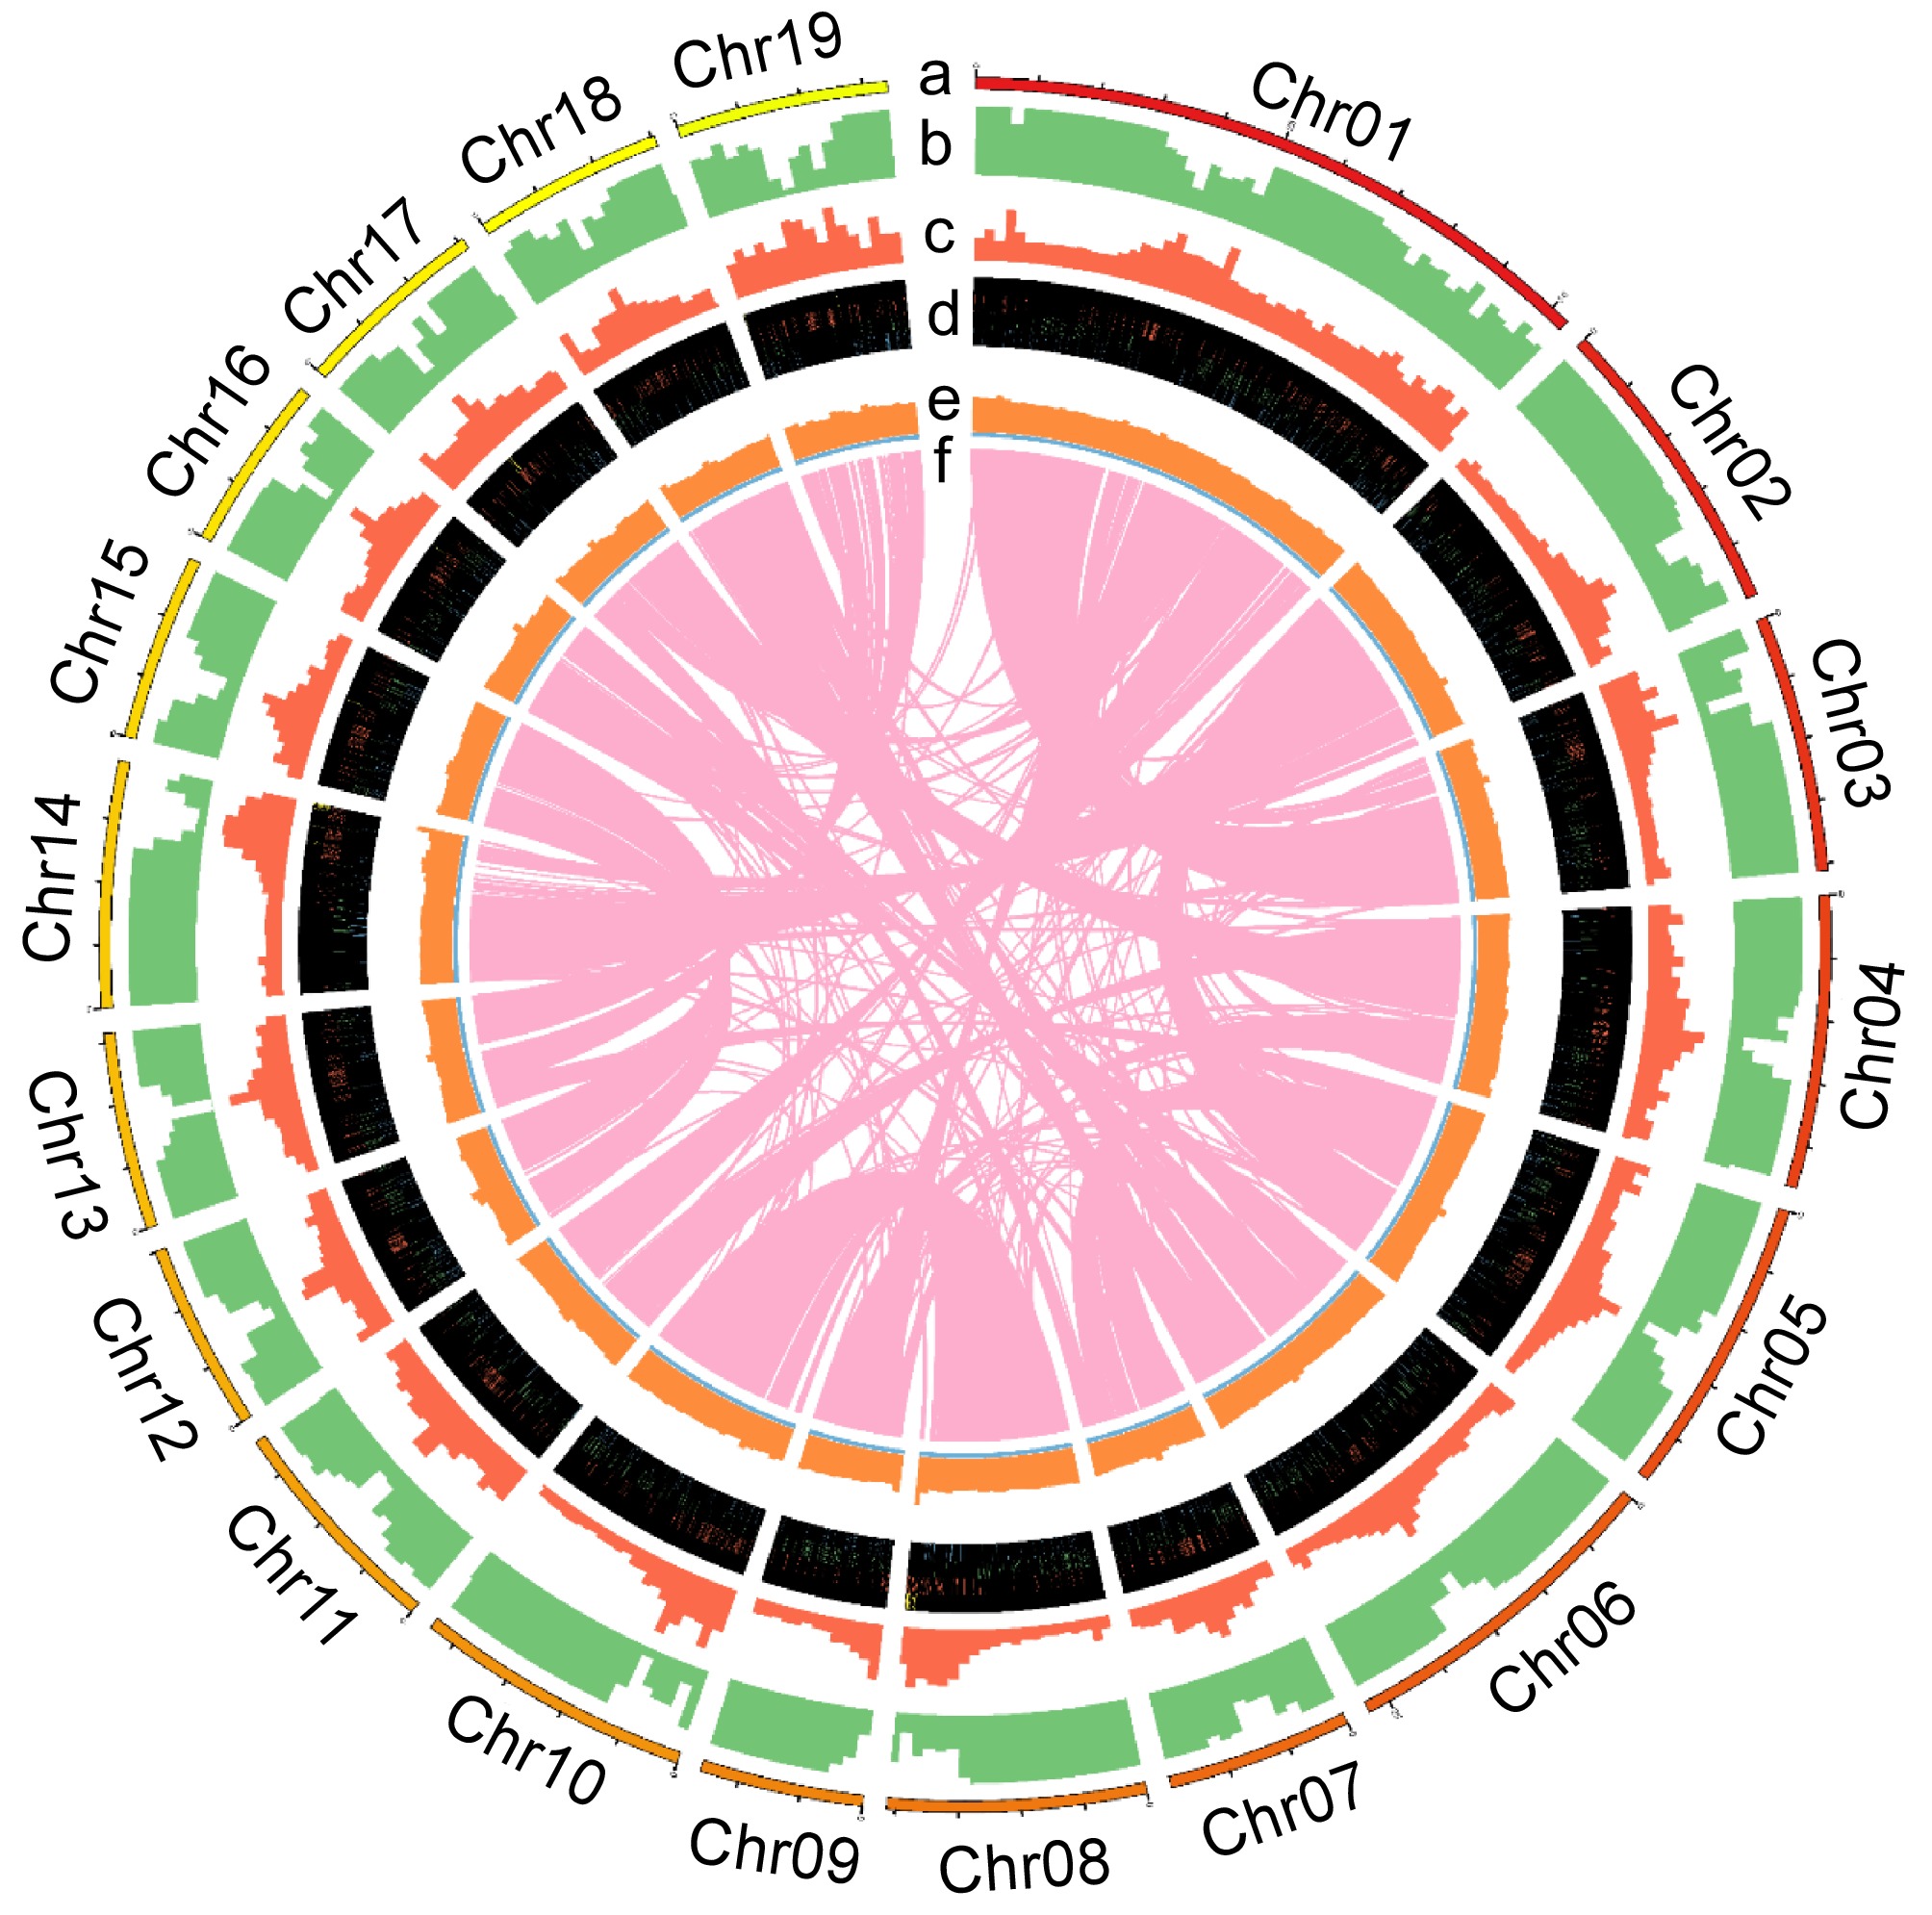
Figure 4.
The chromosome distribution and annotated functional elements of Qu-1 are shown by the circle diagram. (a) Distribution of the 19 chromosomes of Qu-1. (b) Localization of coding genes on each chromosome. (c) Gene duplication patterns. (d) Distribution of rRNA, snRNA, tRNA, and miRNA genes. (e) GC content. (f) Homologous regions longer than 10 kb on the chromosomes.
-
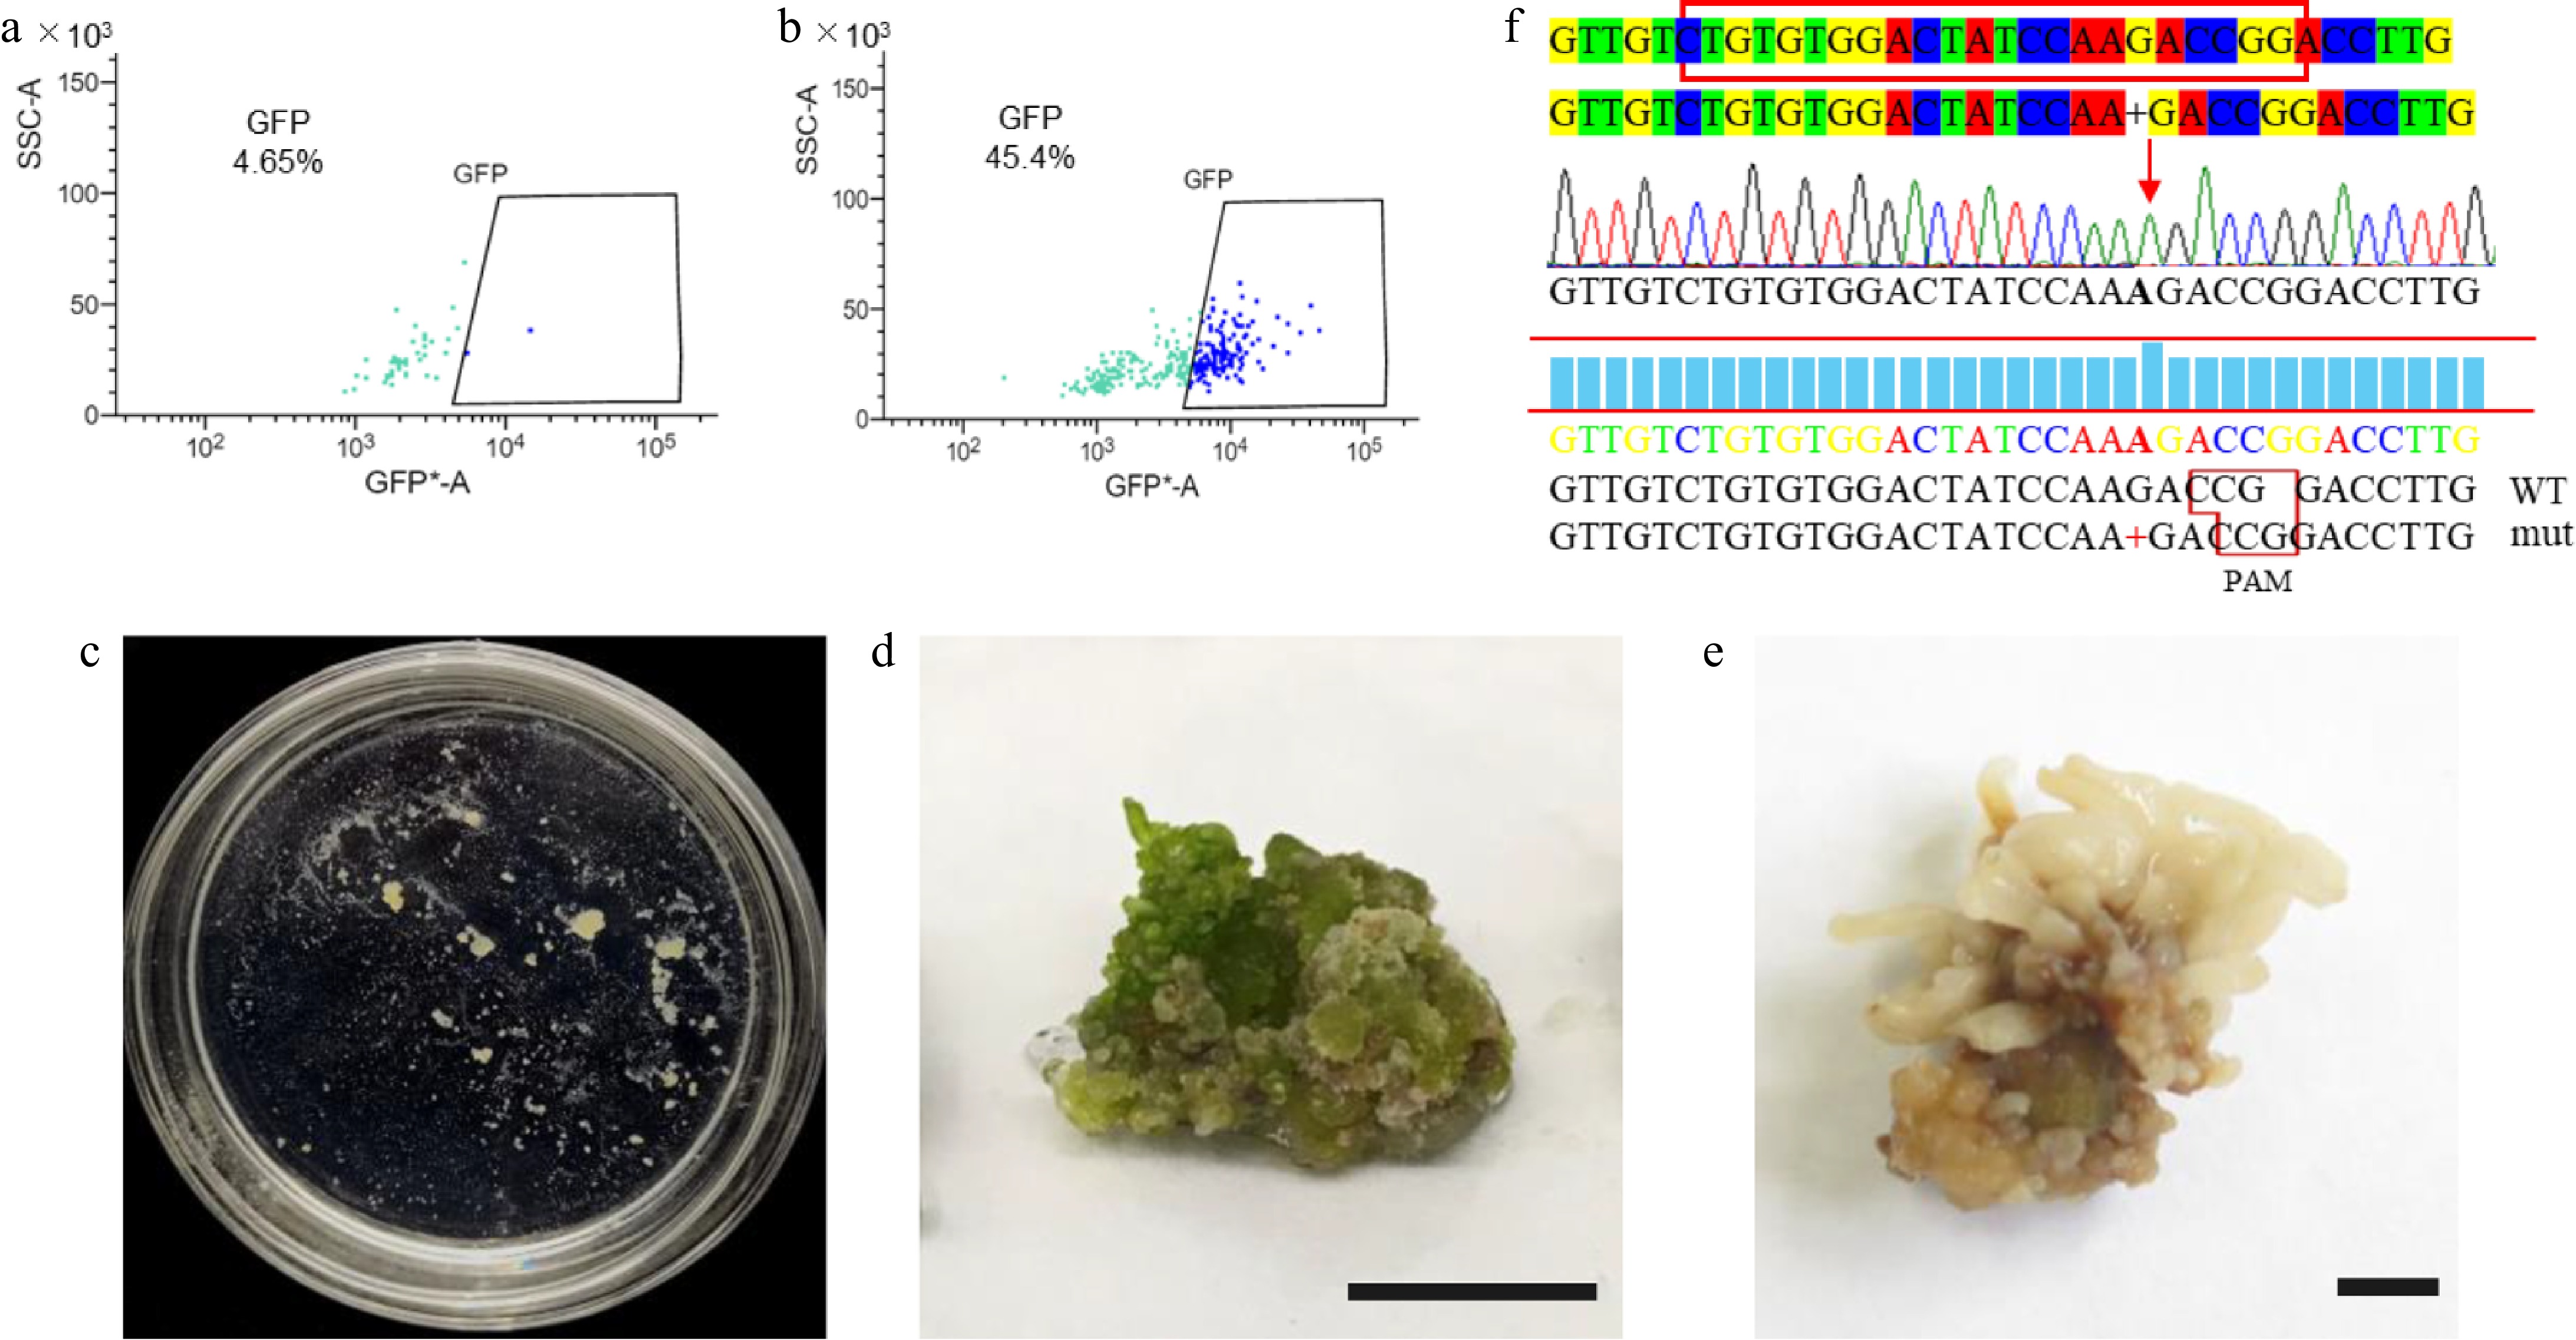
Figure 5.
Transient transformation and stable genetic transformation of Qu-1 protoplasts. (a), (b) Analysis of Qu-1 protoplast transformation efficiency by flow cytometry. (a) Qu-1 protoplasts were used as a control. (b) PEG-mediated transient transformation of Qu-1 protoplasts with pUC19-35Spro-sGFP plasmid was analyzed by flow cytometry. (c) The acquisition of stable genetic transformation resistant callus by genome editing. (d), (e) Wild-type and psnpds mutants under light culture. Scale bar = 1 cm. (f) Sanger sequencing analysis of psnpds mutants.
-
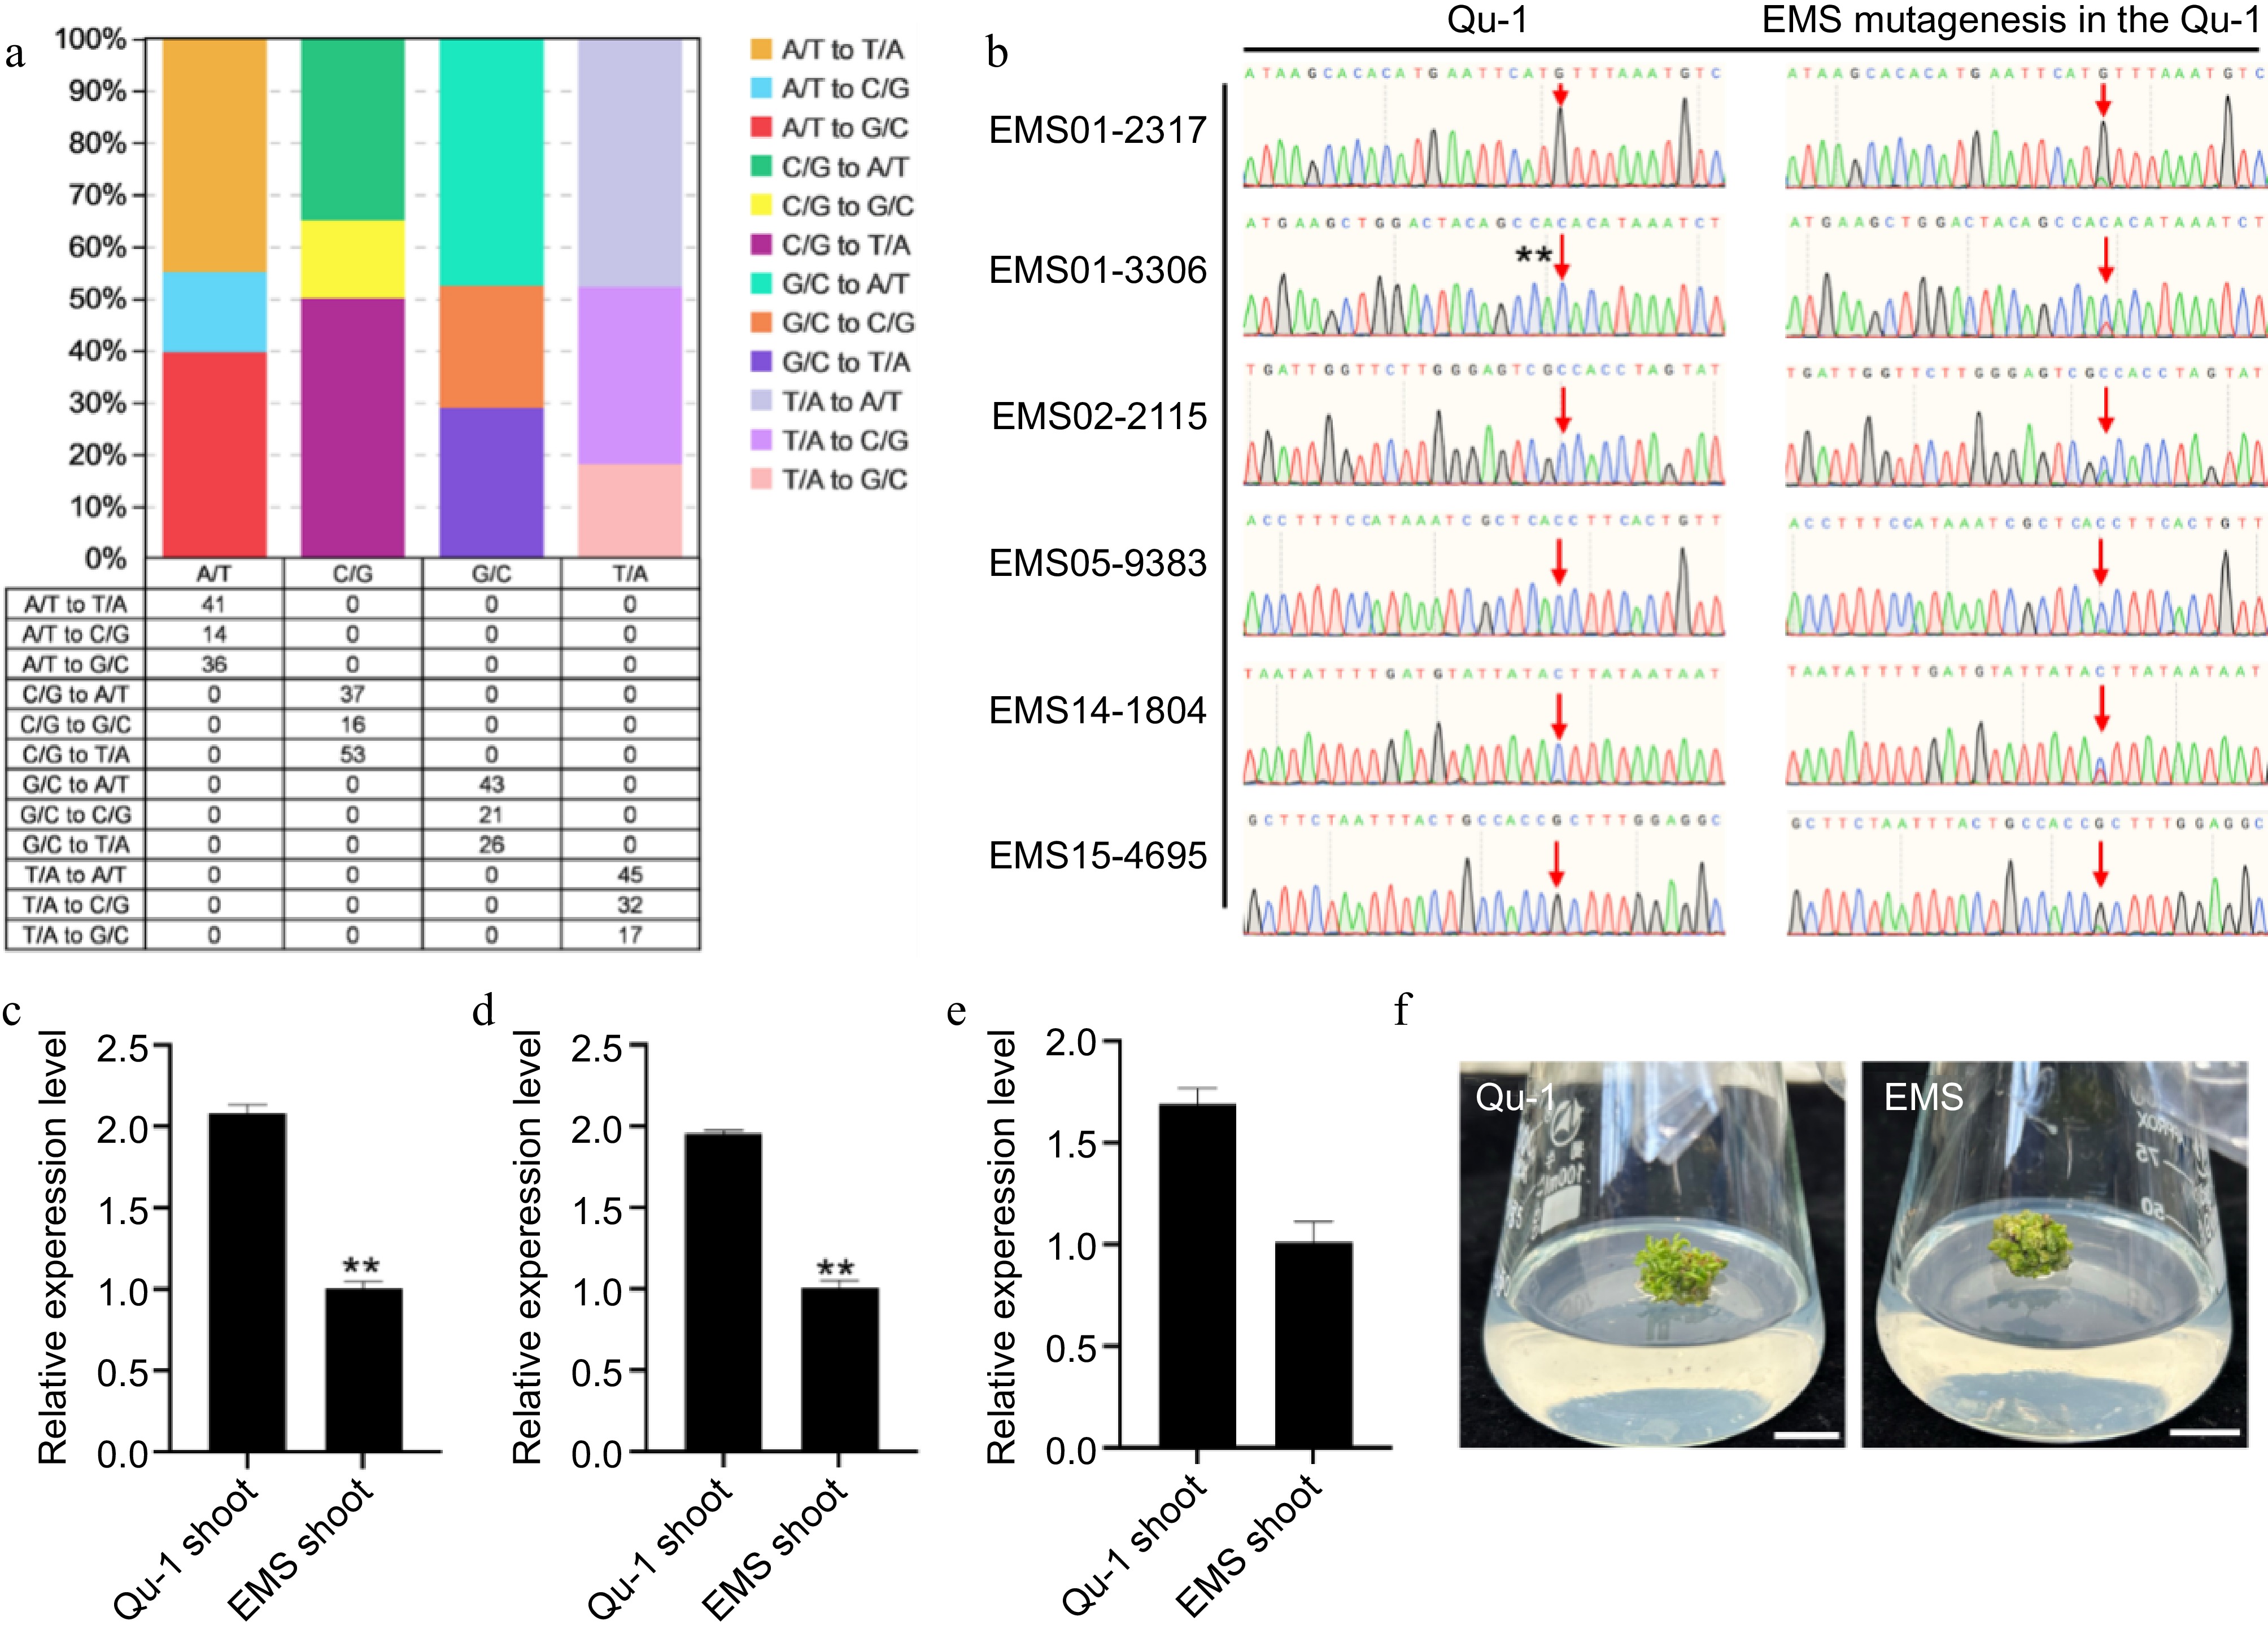
Figure 6.
Detection of SNV sites and phenotypic observation of EMS-induced Qu-1 mutants. (a) The number and proportion of SNV sites induced in the EMS mutant genome. (b) Sanger sequencing detection of SNV sites EMS01-2317, EMS01-3306, EMS02-2115, EMS05-9383, EMS14-1804, and EMS15-4695 of EMS mutants. (c)−(e) Transcription abundance of mutant genes QuPop00389, QuPop03514, and QuPop15257. Error bars represent SE values of three biological replicates. Asterisks indicate significant differences between Qu-1 and EMS mutant plants by Student's t-test (**, p < 0.01). (f) Phenotypic observation of EMS mutants.
Figures
(6)
Tables
(0)