-
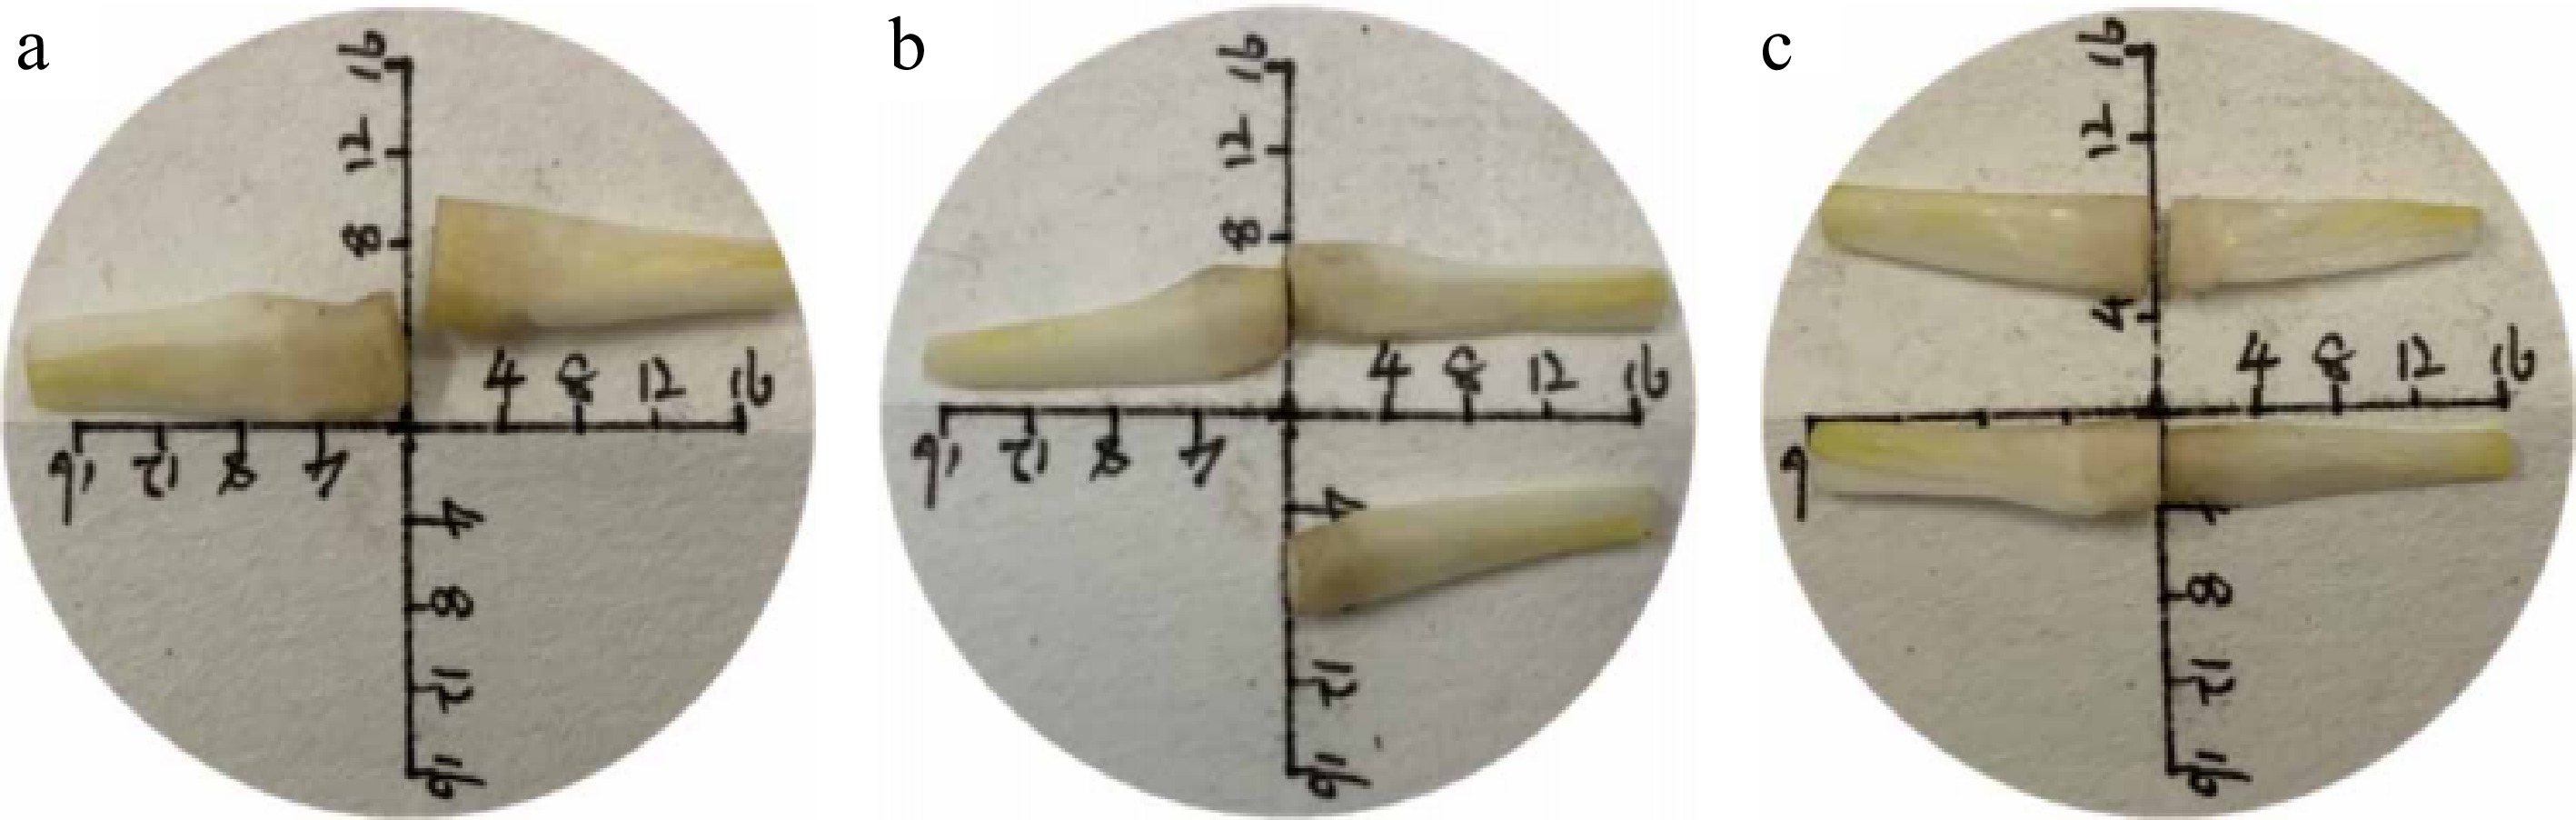
Figure 1.
Schematic diagram of different longitudinal cutting ratios for tillering onions. (a), (b), and (c) represent the scale of longitudinal slices of a tiller onion, which are 1:2, 1:3, and 1:4, respectively. The scale units in the figures are in millimeters (mm).
-
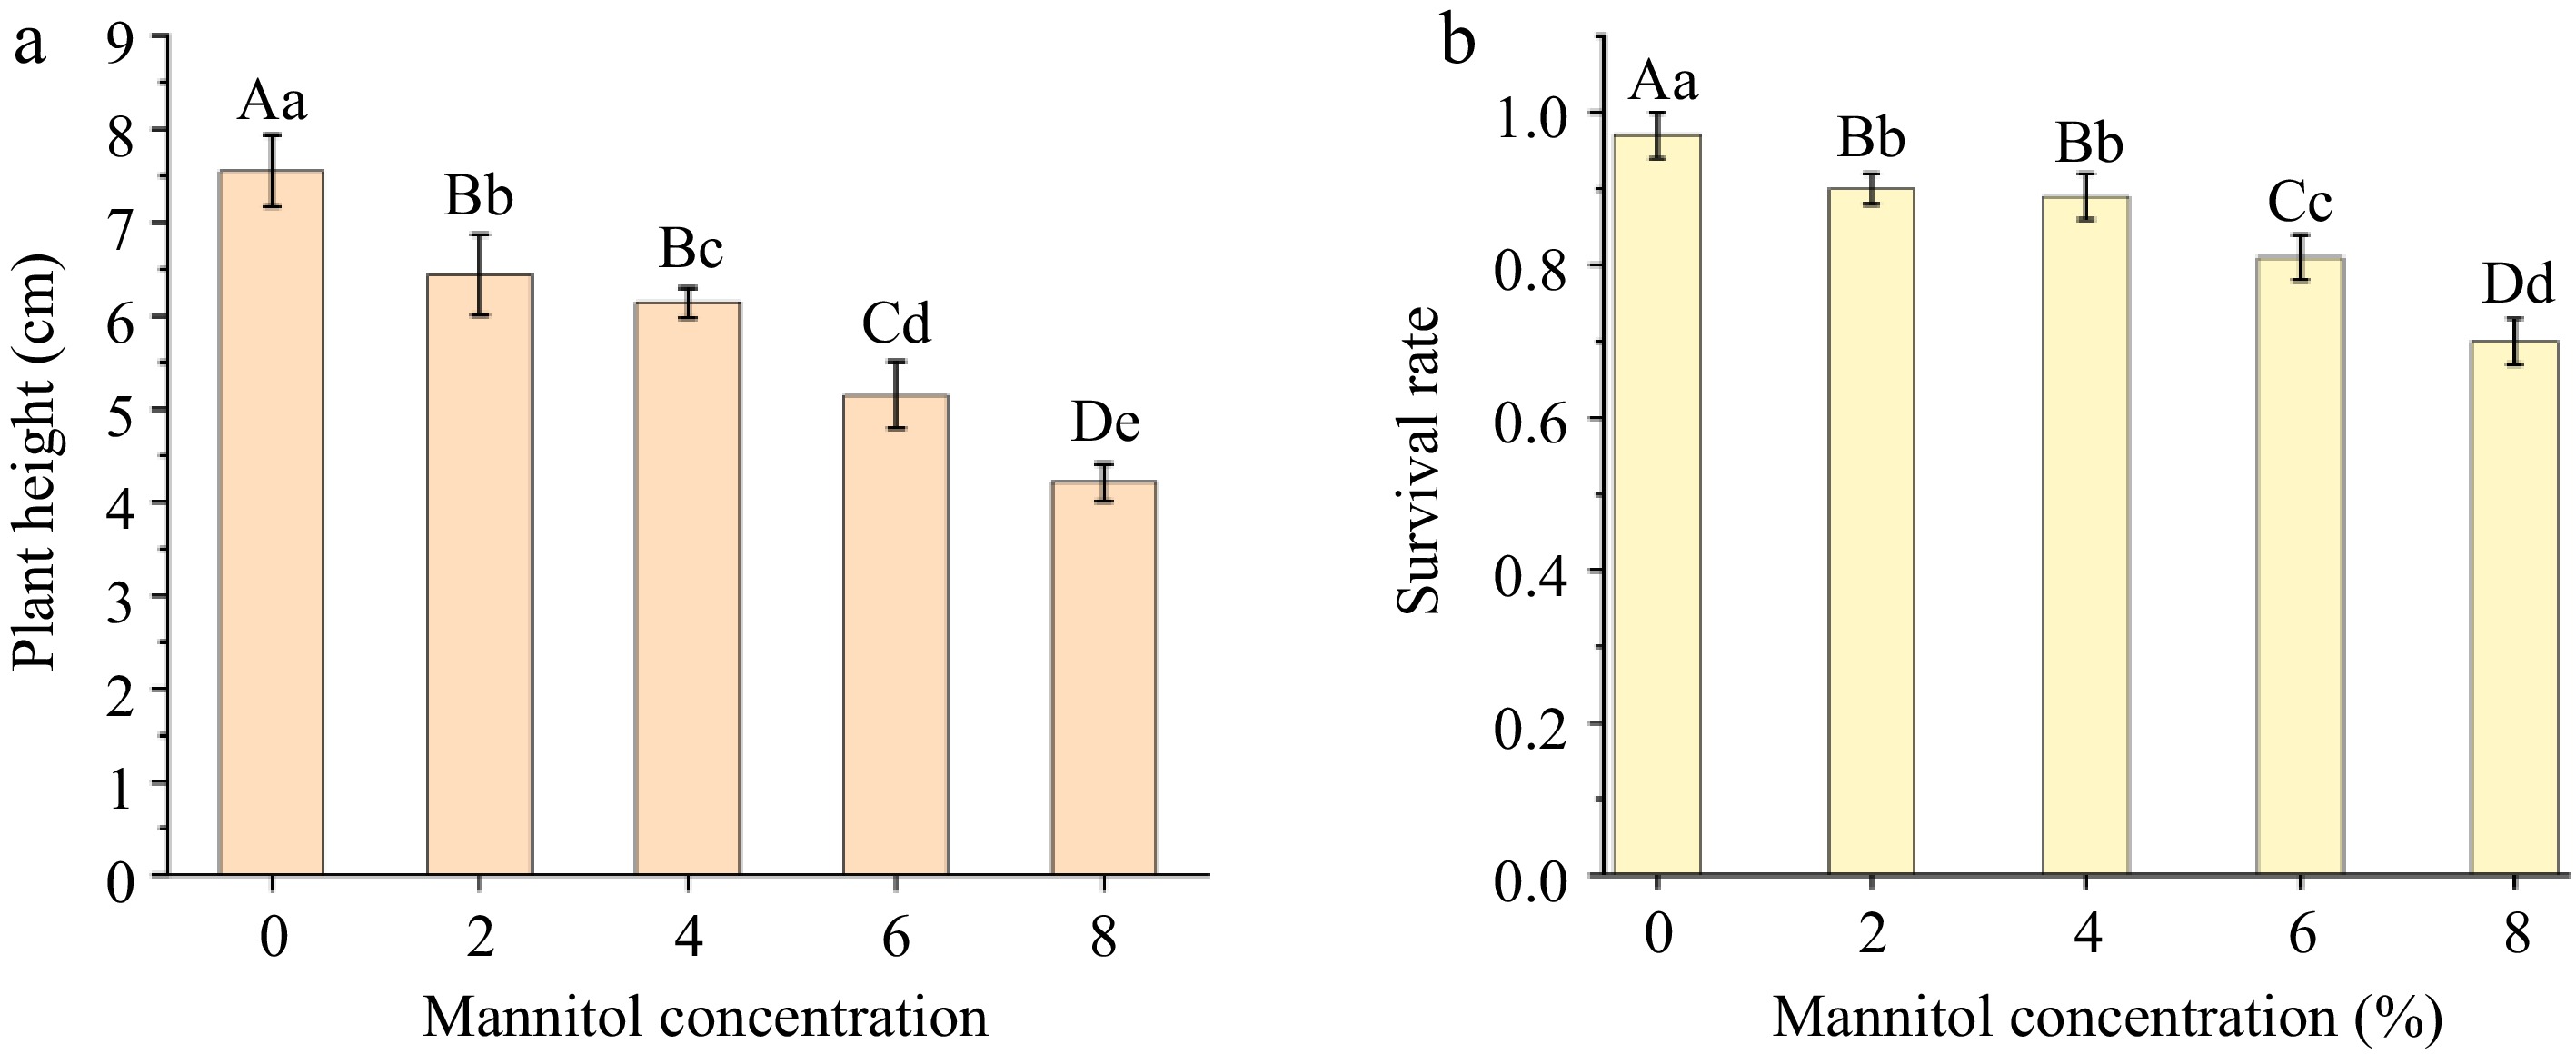
Figure 2.
Multiple comparisons of plant height or survival rate of tissue culture seedlings under different mannitol concentrations. Capital letters denote the 1% significance level, while lowercase letters indicate the 5% significance level. (a) Illustrates multiple comparisons of plant height among plant tissue culture seedlings at various mannitol concentrations. (b) Depicts multiple comparisons of survival rates among plant tissue culture seedlings at different mannitol concentrations.
-
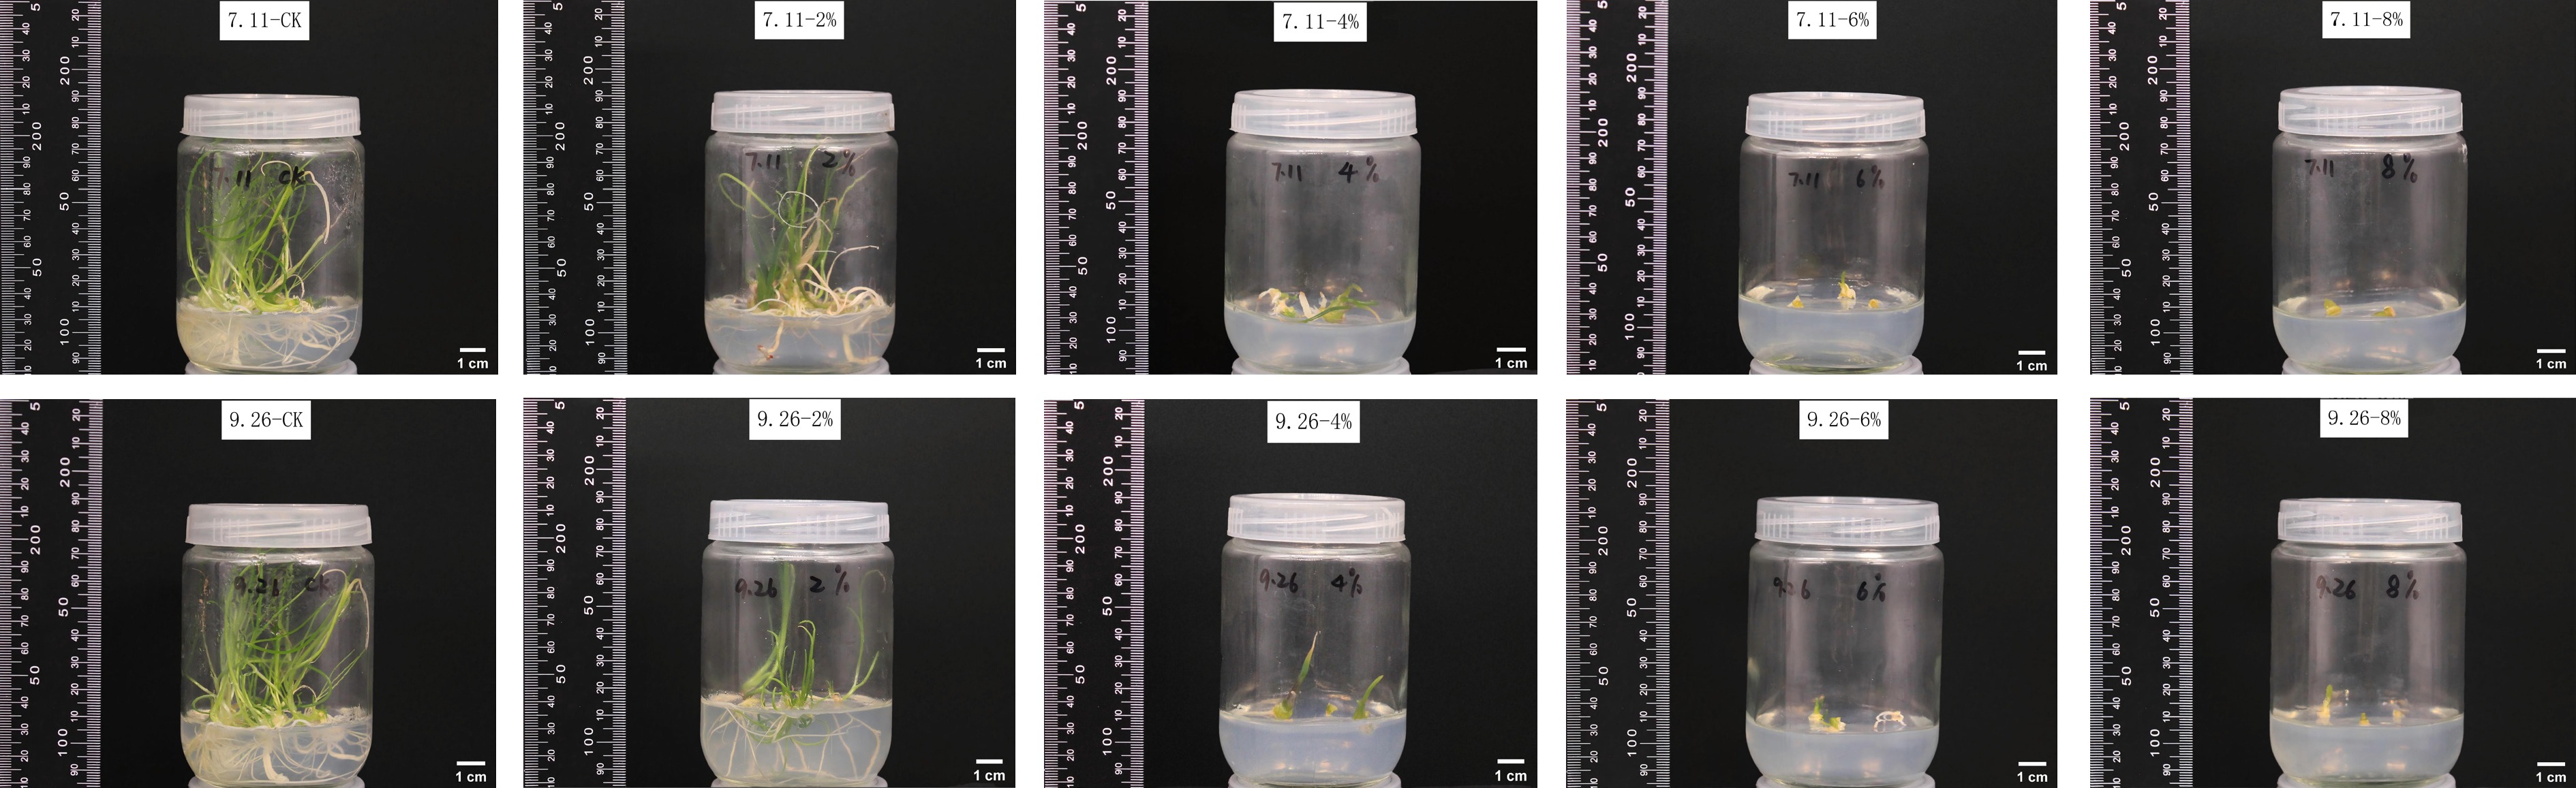
Figure 3.
Comparison of growth conditions at different mannitol concentrations. The figure shows the growth of explants inoculated on July 11th and September 26th, and observed 45 d later at five concentrations of 0% (CK), 2%, 4%, 6%, and 8% mannitol.
-
Handle Plant
height (cm)Pseudostem
thickness (mm)Average plant
weight (g)Number of
blades (pcs)Chlorophyll
content (mg/g)Main area Subdistrict 40 mm 1 cut 2 18.33Aa 2.21Aa 0.65Aa 2.65Aa 605.97Aa 1 cut 3 10.94Bb 1.68Bb 0.19Bb 1.98Bb 225.86Bb 1 cut 4 4.94Cc 1.10cc 0.12Cc 1.67Bb 84.95Cc 60 mm 1 cut 2 17.30Aa 1.88Aa 0.70Aa 4.00Aa 763.97Bb 1 cut 3 11.53Bb 1.39Bb 0.56Bb 3.00Ab 688.95Cc 1 cut 4 5.37Cc 1.12Cc 0.23Cc 2.00Bc 906.57Aa 80 mm 1 cut 2 0.41Aa 2.29Aa 0.64Aa 5.00Aa 790.42Bb 1 cut 3 16.77Aa 1.87Bb 0.57Aab 4.00ABb 1013.26Aa 1 cut 4 14.44Cc 1.45Cc 0.54Ab 3.00Bc 783.04Bb Capital letters represent the 1% significant level, and lowercase letters represent the 5% significant level.1 Cut 2 is named T1 in the same cultivation bottle, named T2, 1 cut 3, and 1 cut 4 named T3. Table 1.
Comparison of growth indicators among sub-treatments in the main treatment.
-
Handle Bulb weight
(g)Bulb diameter
(mm)Root length
(mm)Root coefficient
amount (pcs)Root vitality
(μgTTCg−1FW)Main area Subdistrict 40 mm 1 cut 2 0.07Aa 3.25Aa 25.42Aa 7.78Aa 113.19Bb 1 cut 3 − − 15.75Bb 3.79Bb 144.38Aa 1 cut 4 − − − − − 60 mm 1 cut 2 0.22Aa 4.68Aa 59.93Aa 24.79Aa 74.50Aa 1 cut 3 0.10Bb 3.52Bb 44.19Bb 16.12Bb 33.74Cc 1 cut 4 0.05Cc 3.34Bc 38.86Cc 11.12Cc 56.63Bb 80 mm 1 cut 2 0.43Aa 5.61Aa 65.86Aa 26.78Aa 139.40Cc 1 cut 3 0.31Ab 5.06Bb 60.00Bb 23.78Bb 212.18Aa 1 cut 4 0.29Ab 5.29Cc 50.18Cc 20.12Cc 187.64Cc Capital letters represent the 1% significant level, and lowercase letters represent the 5% significant level. 1 Cut 2 is named T1 in the same cultivation bottle, named T2, 1 cut 3, and 1 cut 4 named T3. Table 2.
Comparison of developmental indicators among sub-treatments in the main treatment.
-
Project Characters Principal component 1 Principal component 2 Principal component 3 Eigen value 6.576 1.24 1.087 Variance contribution rate (%) 65.761 12.4 10.873 Cumulative contribution rate (%) 65.761 78.16 89.033 Eigen vectors Plant height 0.466 0.835 0.013 Stem thickness 0.625 −0.221 0.665 Average weight per plant 0.813 −0.311 0.013 Number of blades 0.815 −0.116 0.324 Chlorophyll content 0.835 0.223 −0.449 Weight of bulb 0.918 −0.114 0.101 Diameter of bulb 0.954 −0.055 −0.256 Length of roots 0.951 −0.082 −0.245 Number of roots 0.938 −0.208 −0.205 Table 3.
Principal component eigen vectors and cumulative contribution rates of ten determination indicators of tillering onion tissue culture seedlings.
-
Handle Factor Plant height
(cm)Pseudostem
thickness (mm)Average plant
weight (g)Number of
blades (pcs)Chlorophyll content
(mg/g)Main area Factor A 26.45** 28.76** 9.01** 19.91** 177** Subdistrict Factor B 26.31** 156.41** 10.97** 8.58** 29787.88** AB interaction A × B 1.21 2.87 4.76** 3.29* 105874.2** ** Indicates 1% extremely significant level, * indicates 5% significant level. Table 4.
Variance analysis table of morphological growth indicators between main treatment and secondary treatment.
-
Handle Plant height
(cm)Root length
(cm)Root coefficient
amount (piece)Pseudostem
thickness (cm)Vitrification
(%)Time Mannitol concentration 15 d 0% 3.88Aa 1.63Aa 1.26Aa 1.19Aa 0Aa 2% 2.78Bb 1.05Bb 0.67Bb 1.07Aa 0Aa 4% 2.40BCb 0.96Bb 0.65Bb 0.98Aa 0Aa 6% 1.96Cc 0.93Bb 0.60BCb 0.94Aa 0Aa 8% 1.04Dd 0.91Bb 0.41Cc 0.92Aa 0Aa 30 d 0% 6.44Aa 2.76ABa 1.68Aa 1.39Aa 0Dd 2% 4.63Bb 2.36BCb 0.87Bb 1.02ABb 0Dd 4% 3.33Cc 2.92Aa 0.28Cd 0.74Bb 2.65Aa 6% 2.64Dd 2.37BCb 0.65BCbc 1.04ABb 1.74Bb 8% 1.13Ee 2.24Cb 0.37Ccd 0.78Bb 0.51Cc 45 d 0% 9.03Aa 3.41Aba 2.97Aa 1.64Aa 0.34Cd 2% 6.28Bb 2.88Bb 2.05Bb 1.81Aa 0.11Cd 4% 5.58Cc 3.68Aa 1.00Cc 1.45Aa 3.10Aa 6% 3.86Dd 3.27ABab 0.97Cc 1.69Aa 1.73Bb 8% 1.63Ee 2.88Bb 1.26Cc 1.79Aa 0.65Cc Capital letters represent the 1% significant level, and lowercase letters represent the 5% significant level. Table 5.
Comparison of various indicators of tissue culture seedlings under different concentrations of mannitol treatment over time.
Figures
(3)
Tables
(5)