-
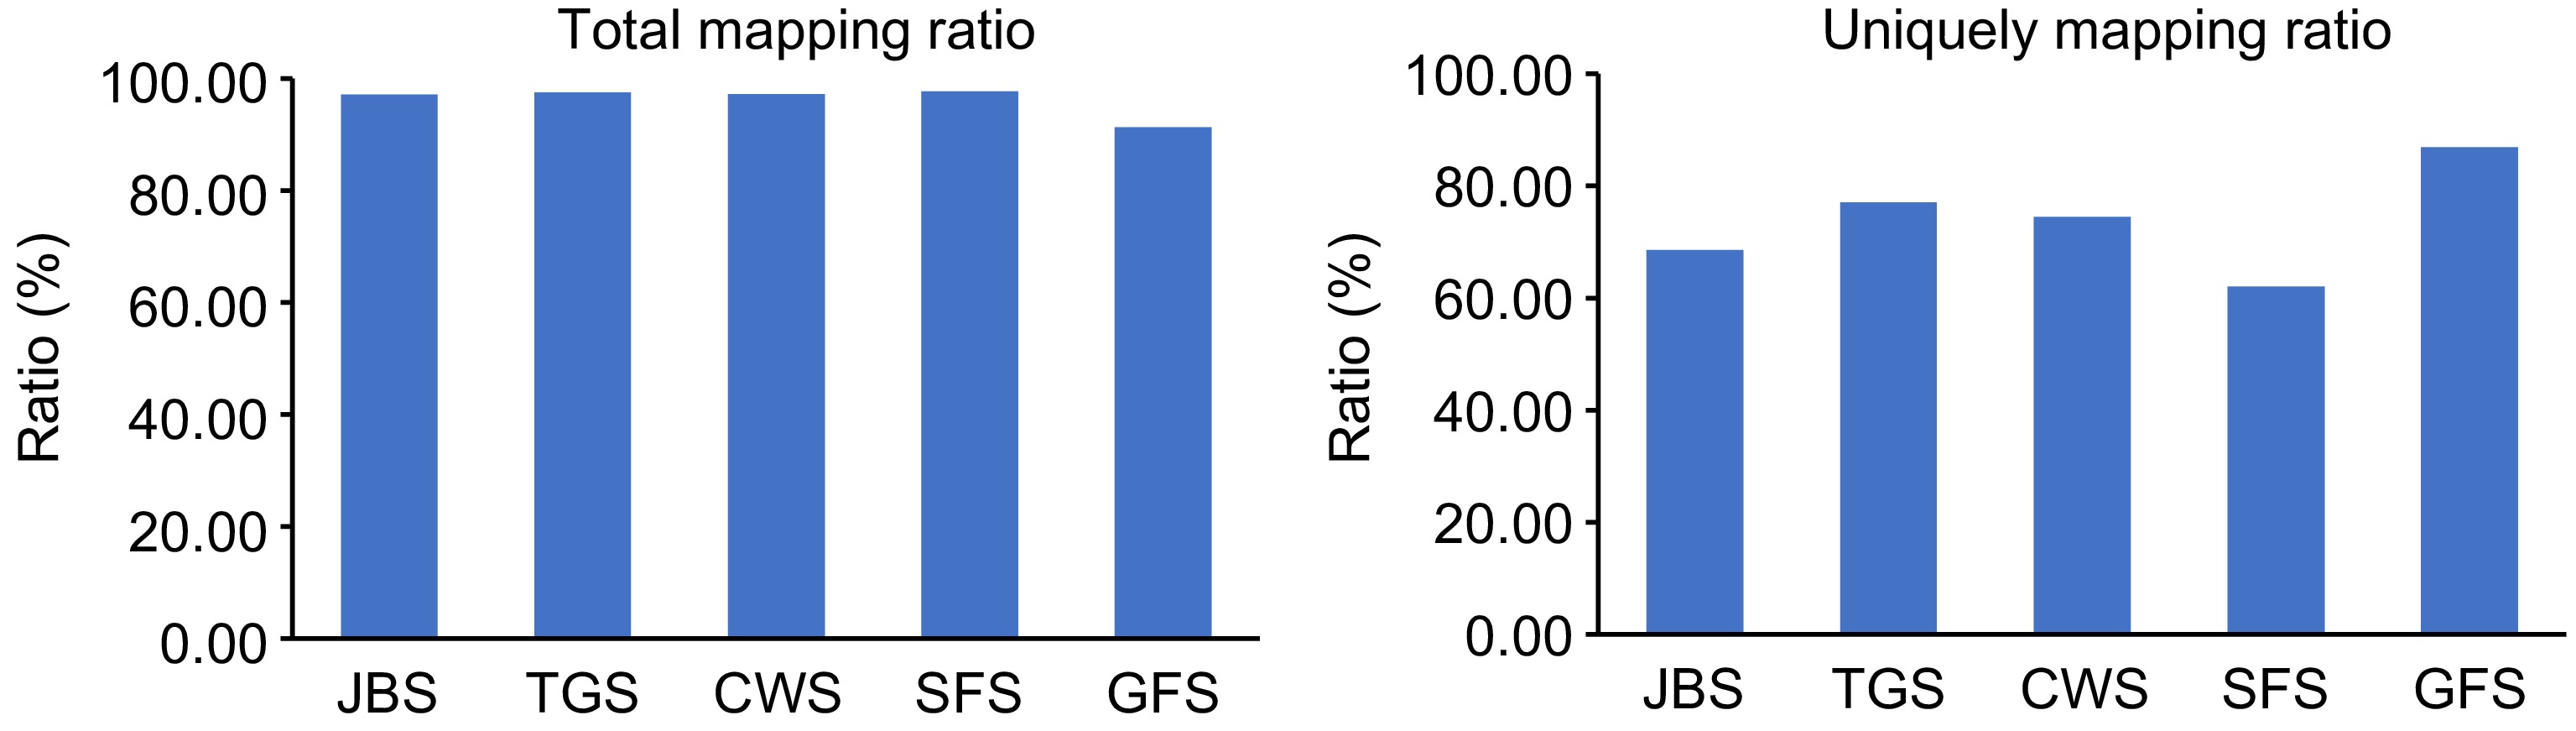
Figure 1.
Mapping of L. japonica transcriptome to the reference genome. 'Total mapping ratio' refers to the proportion of clean reads that align with the reference genome, while 'Uniquely mapping ratio' represents the proportion of clean reads that align uniquely to a specific location on the reference genome.
-
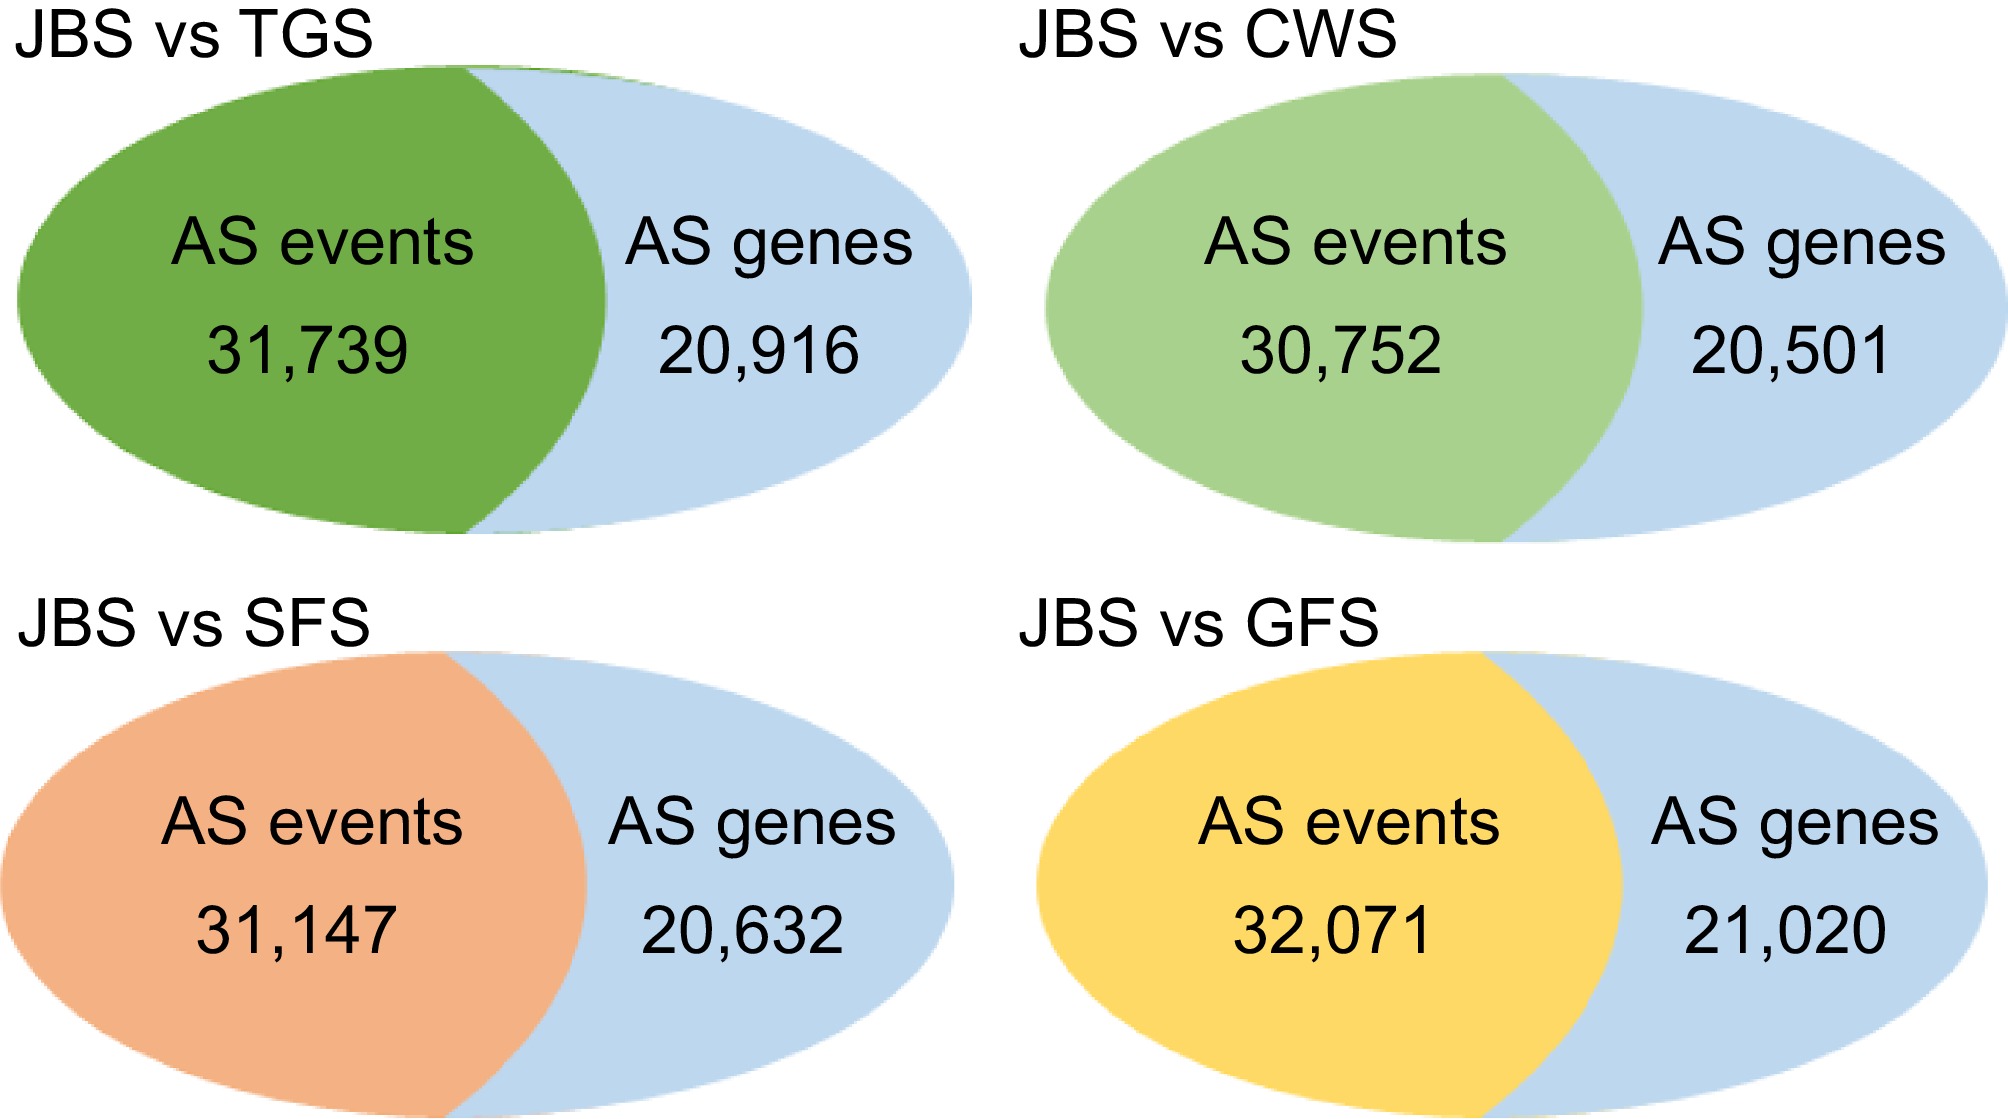
Figure 2.
Overview of the number of alternative splicing events and related genes between different stages. All of the AS events and related genes were identified through the comparison of four stages including TGS, CWS, SFS, and GFS with the first stage of JBS. rMATS software was used for identifying the differential alternative splicing events.
-
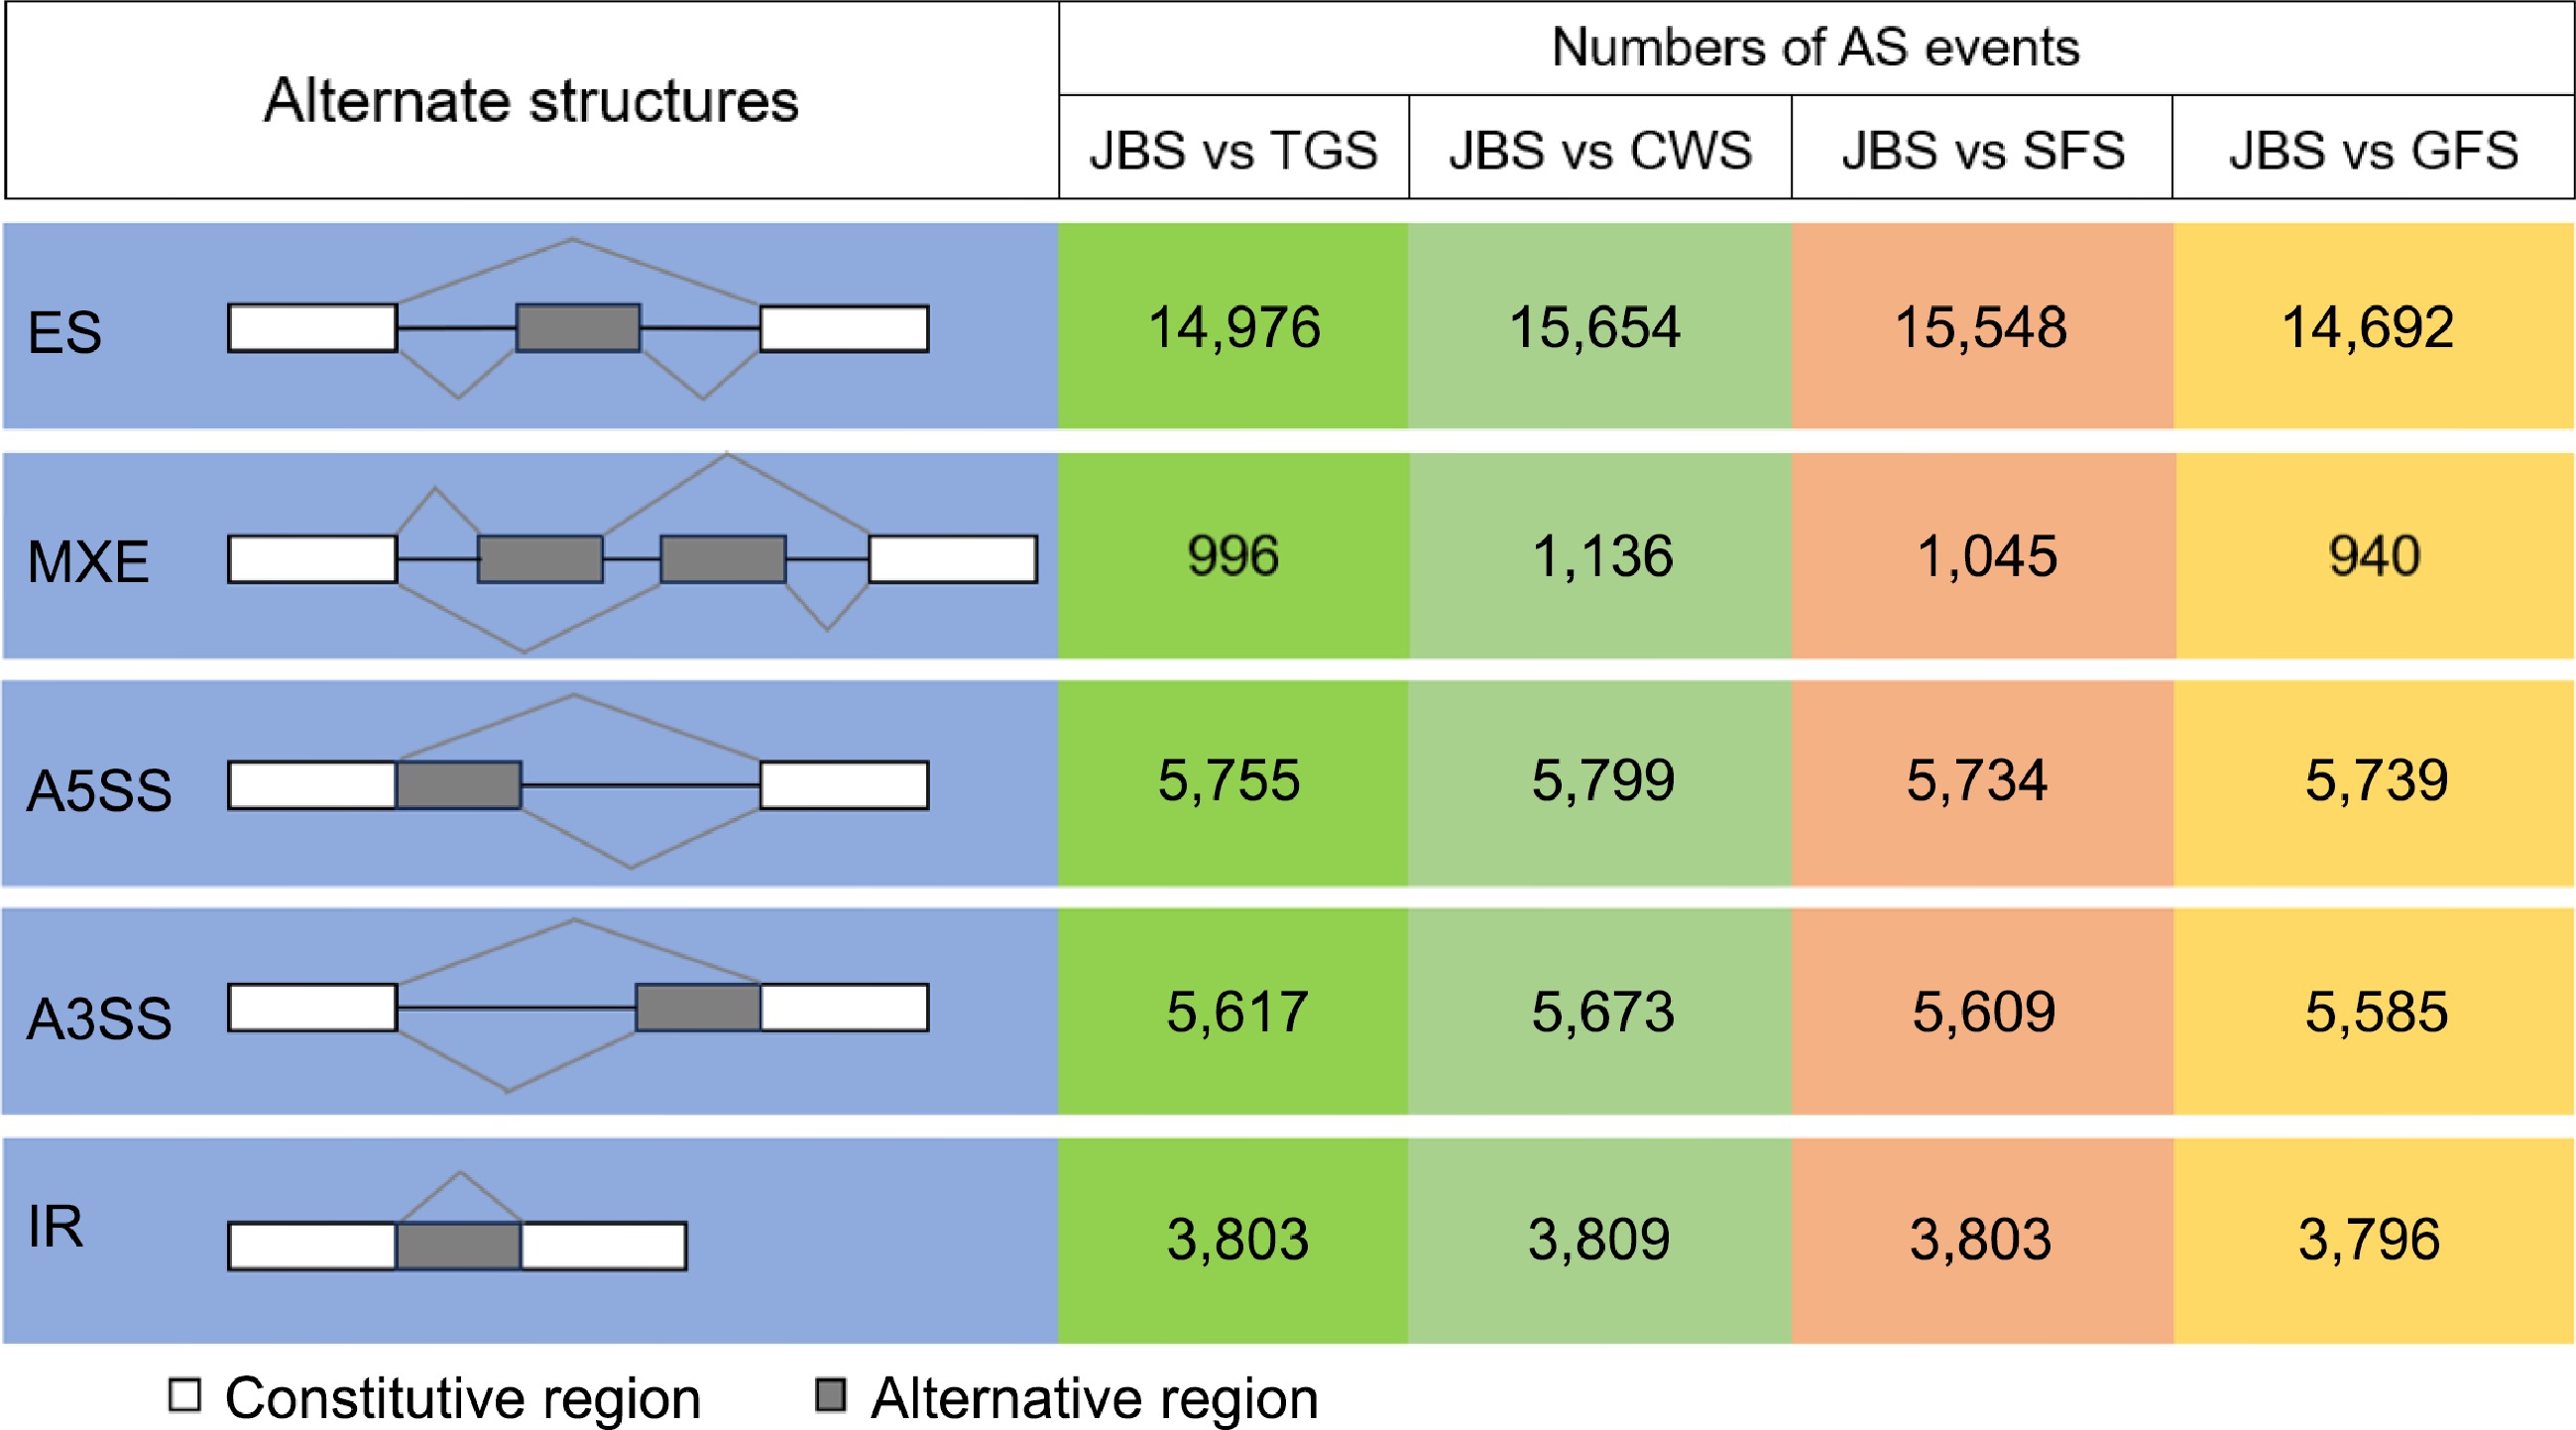
Figure 3.
Number of identified alternative splicing events at different periods. The left side represents a schematic of the five AS types identified, with the white boxes representing the constitutive regions, and the grey representing the alternative regions. The four coloured blocks on the right represent the number of events in which several types of AS occurred
-
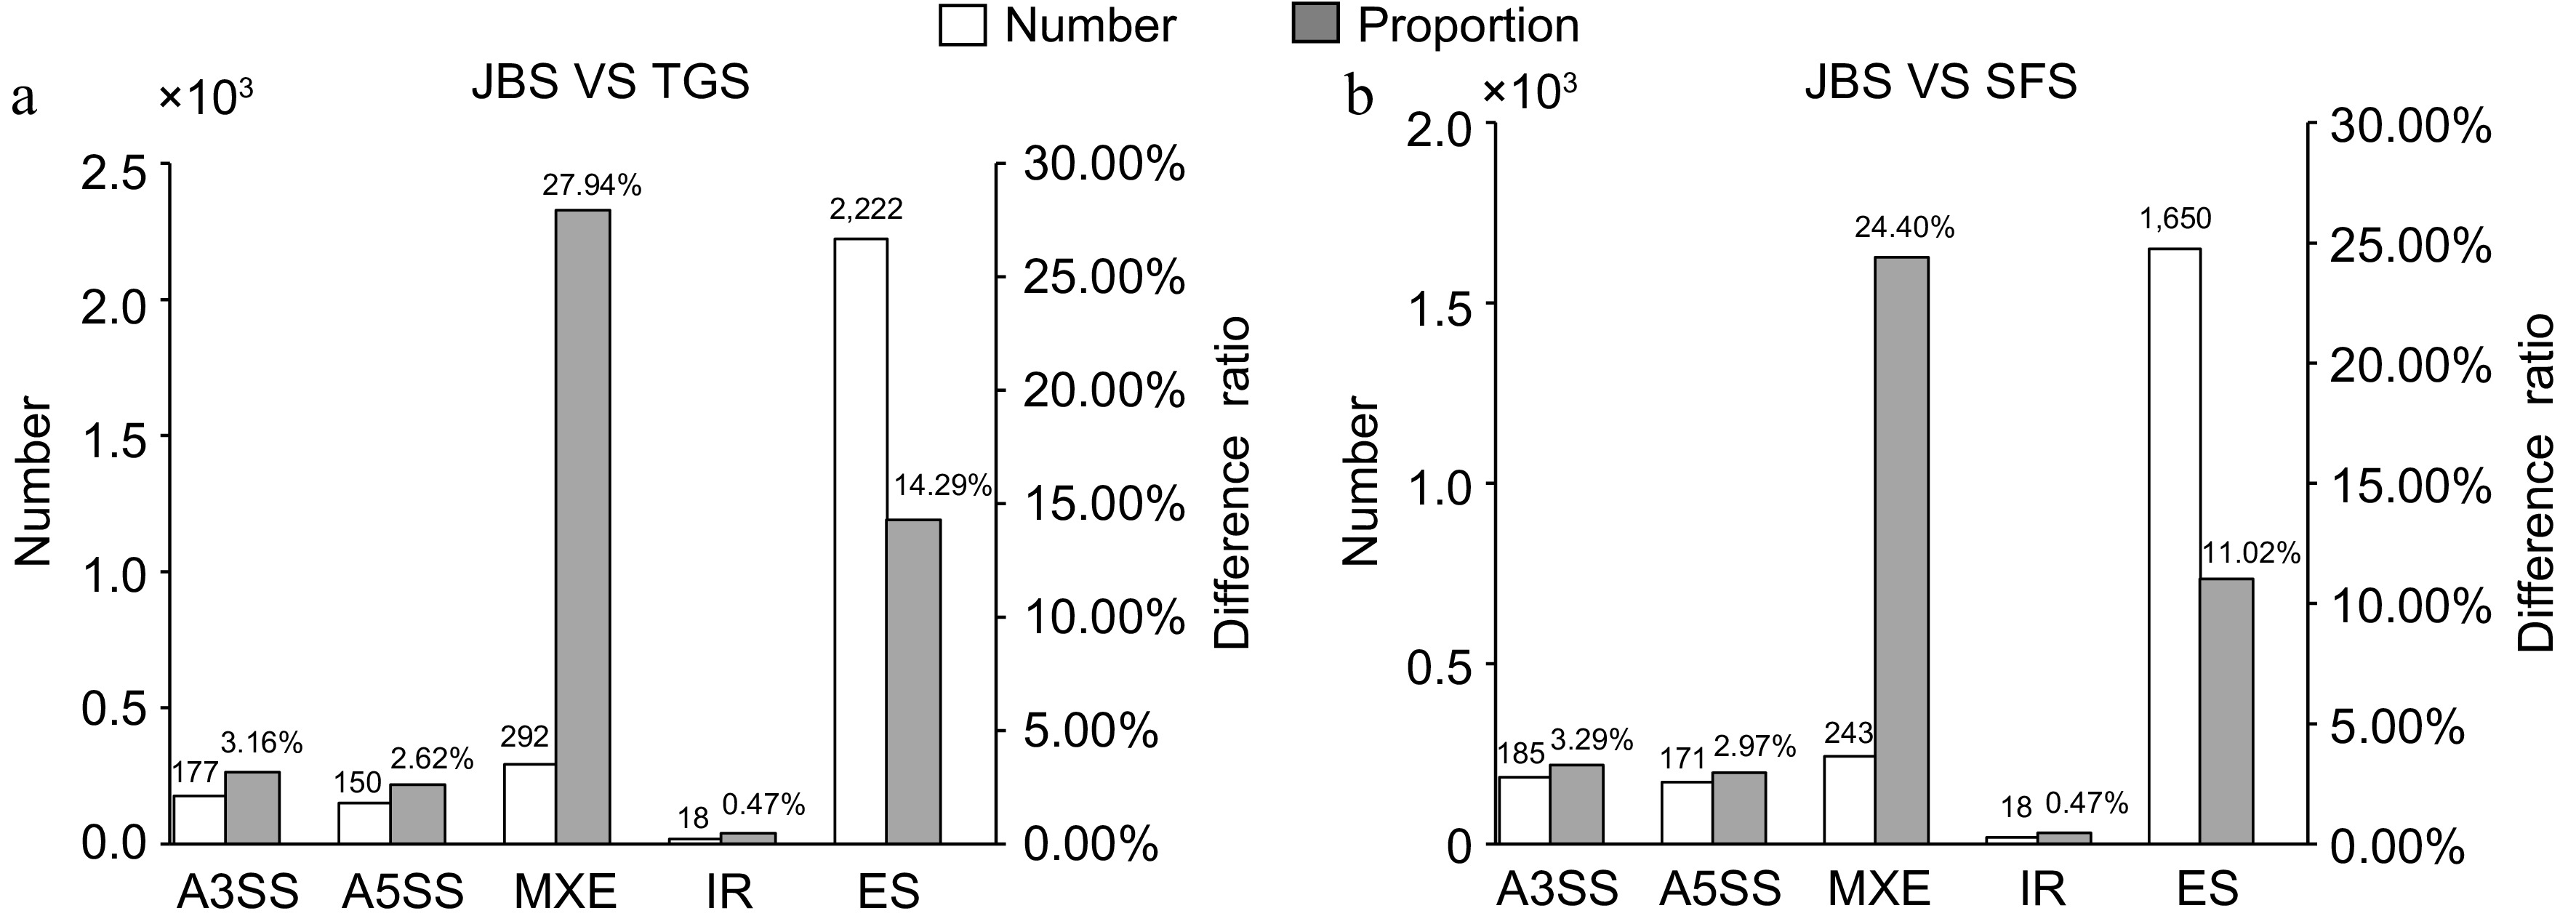
Figure 4.
Distribution of differential alternative splicing events at different flowering stages. The number and proportion of differential alternative splicing events from JBS vs TGS, and JBS vs SFS were calculated. The left vertical axis represents the number of differential alternative splicing events, while the right vertical axis represents the proportion of differential alternative splicing events.
-
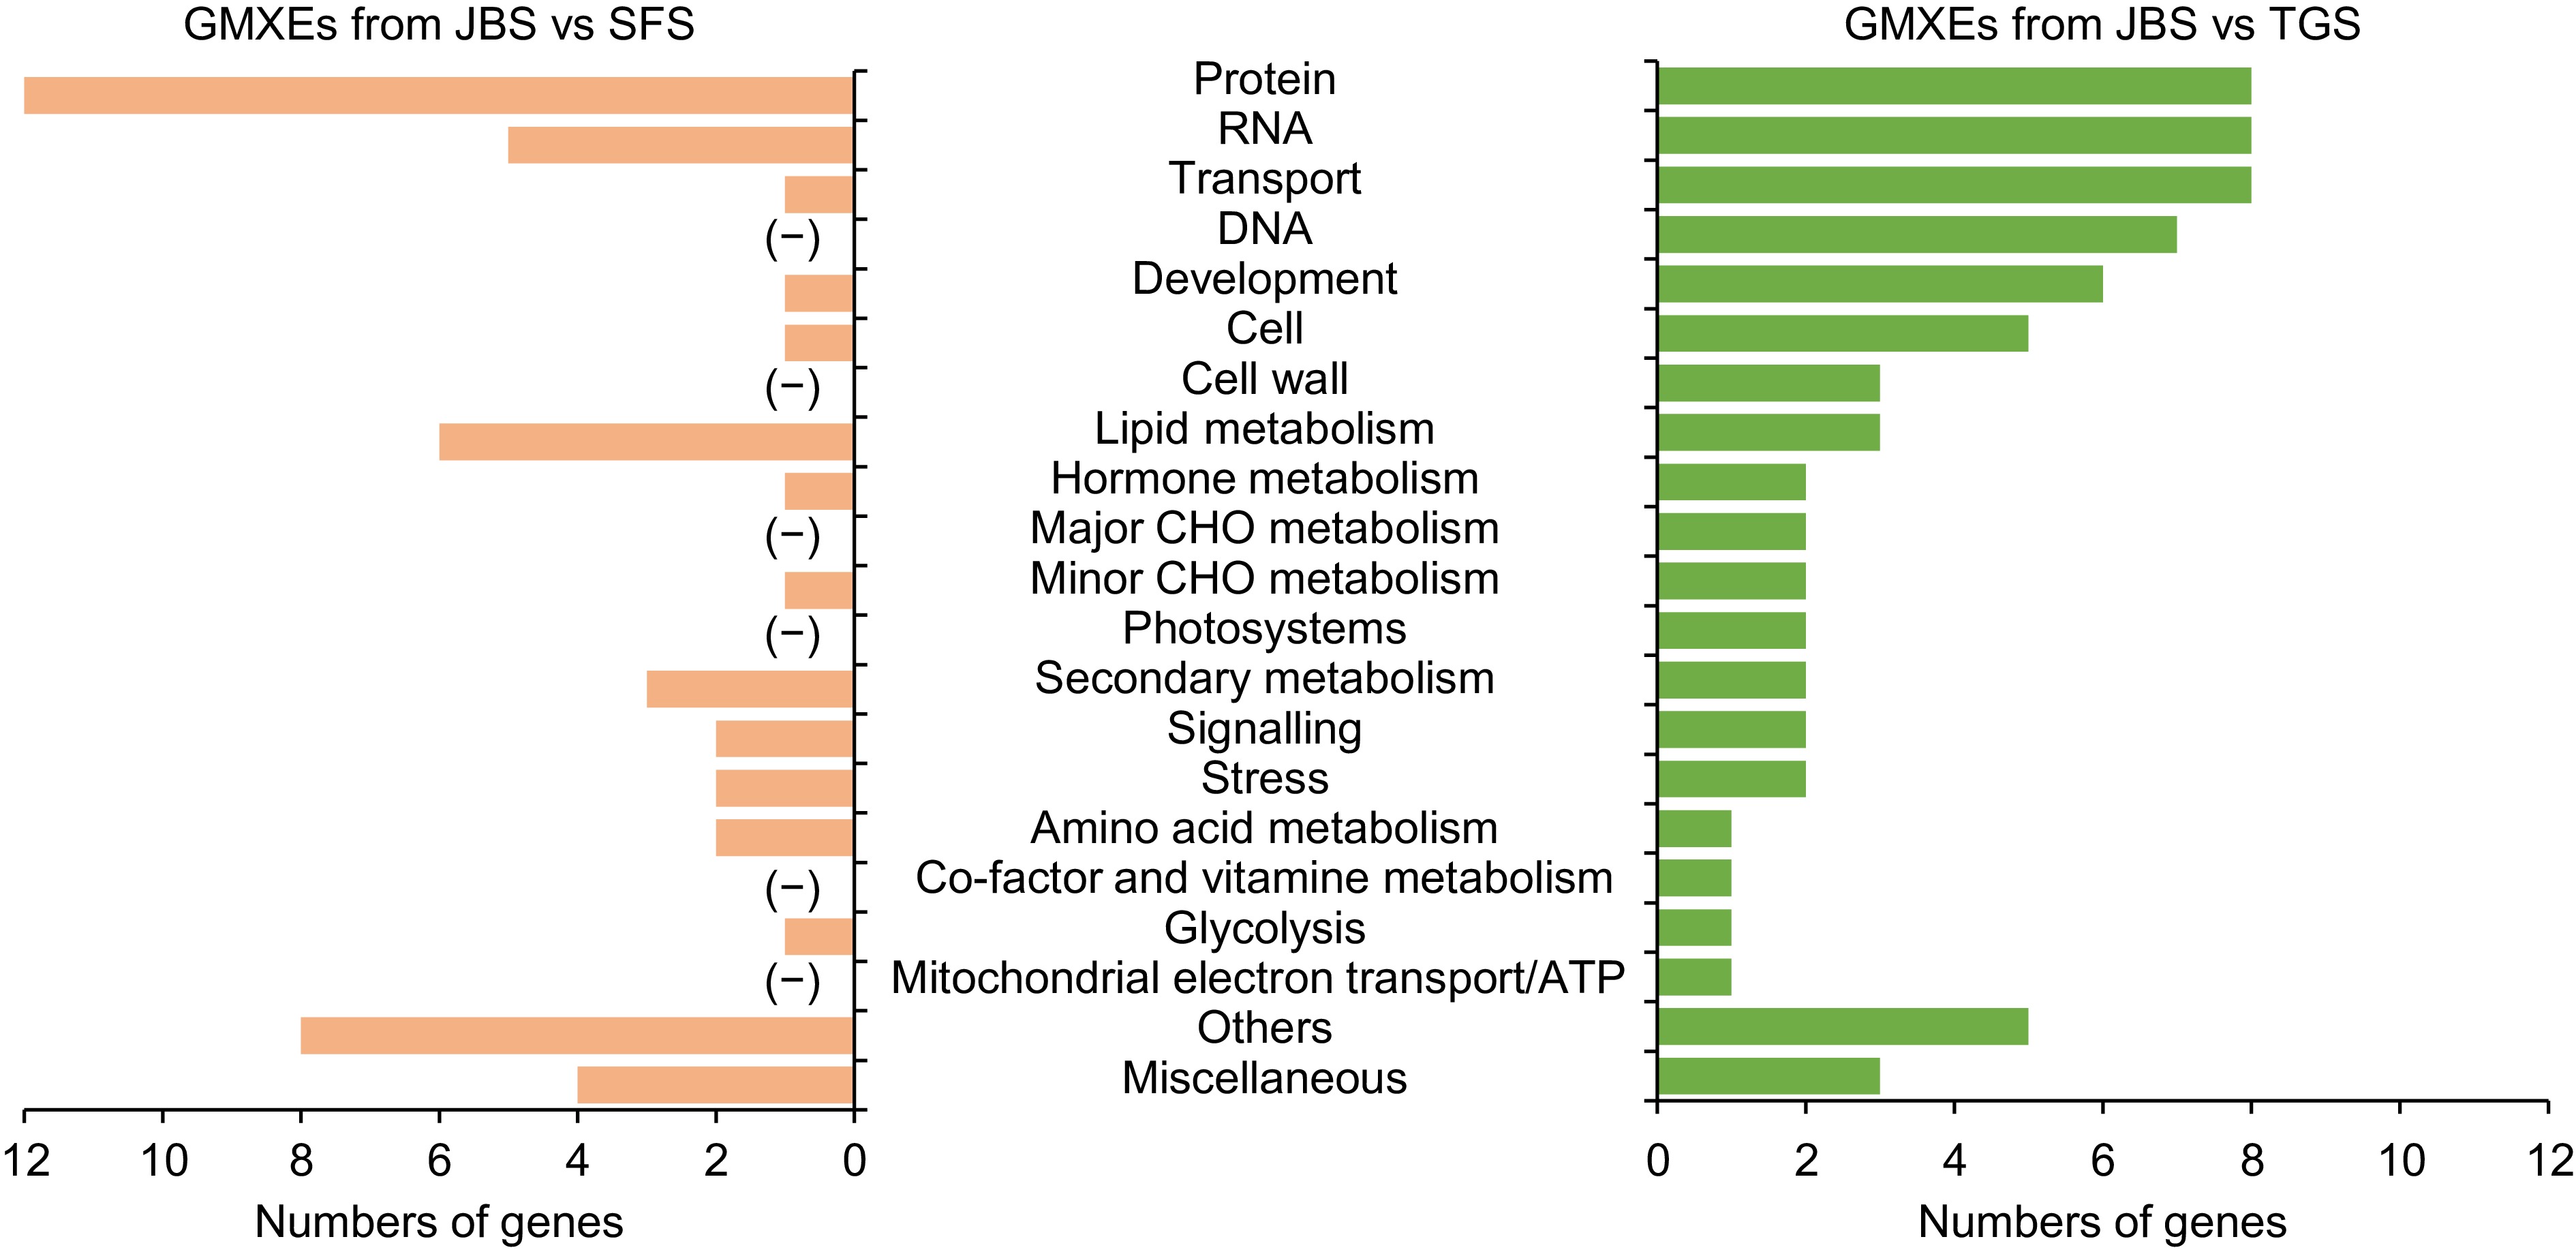
Figure 5.
The function of genes involved in mutually exclusive exon events. Gene functions were predicted and categorized using MapMan bin codes. '(−)' indicates that no gene was categorized. Abbreviations: CHO, carbohydrate.
-
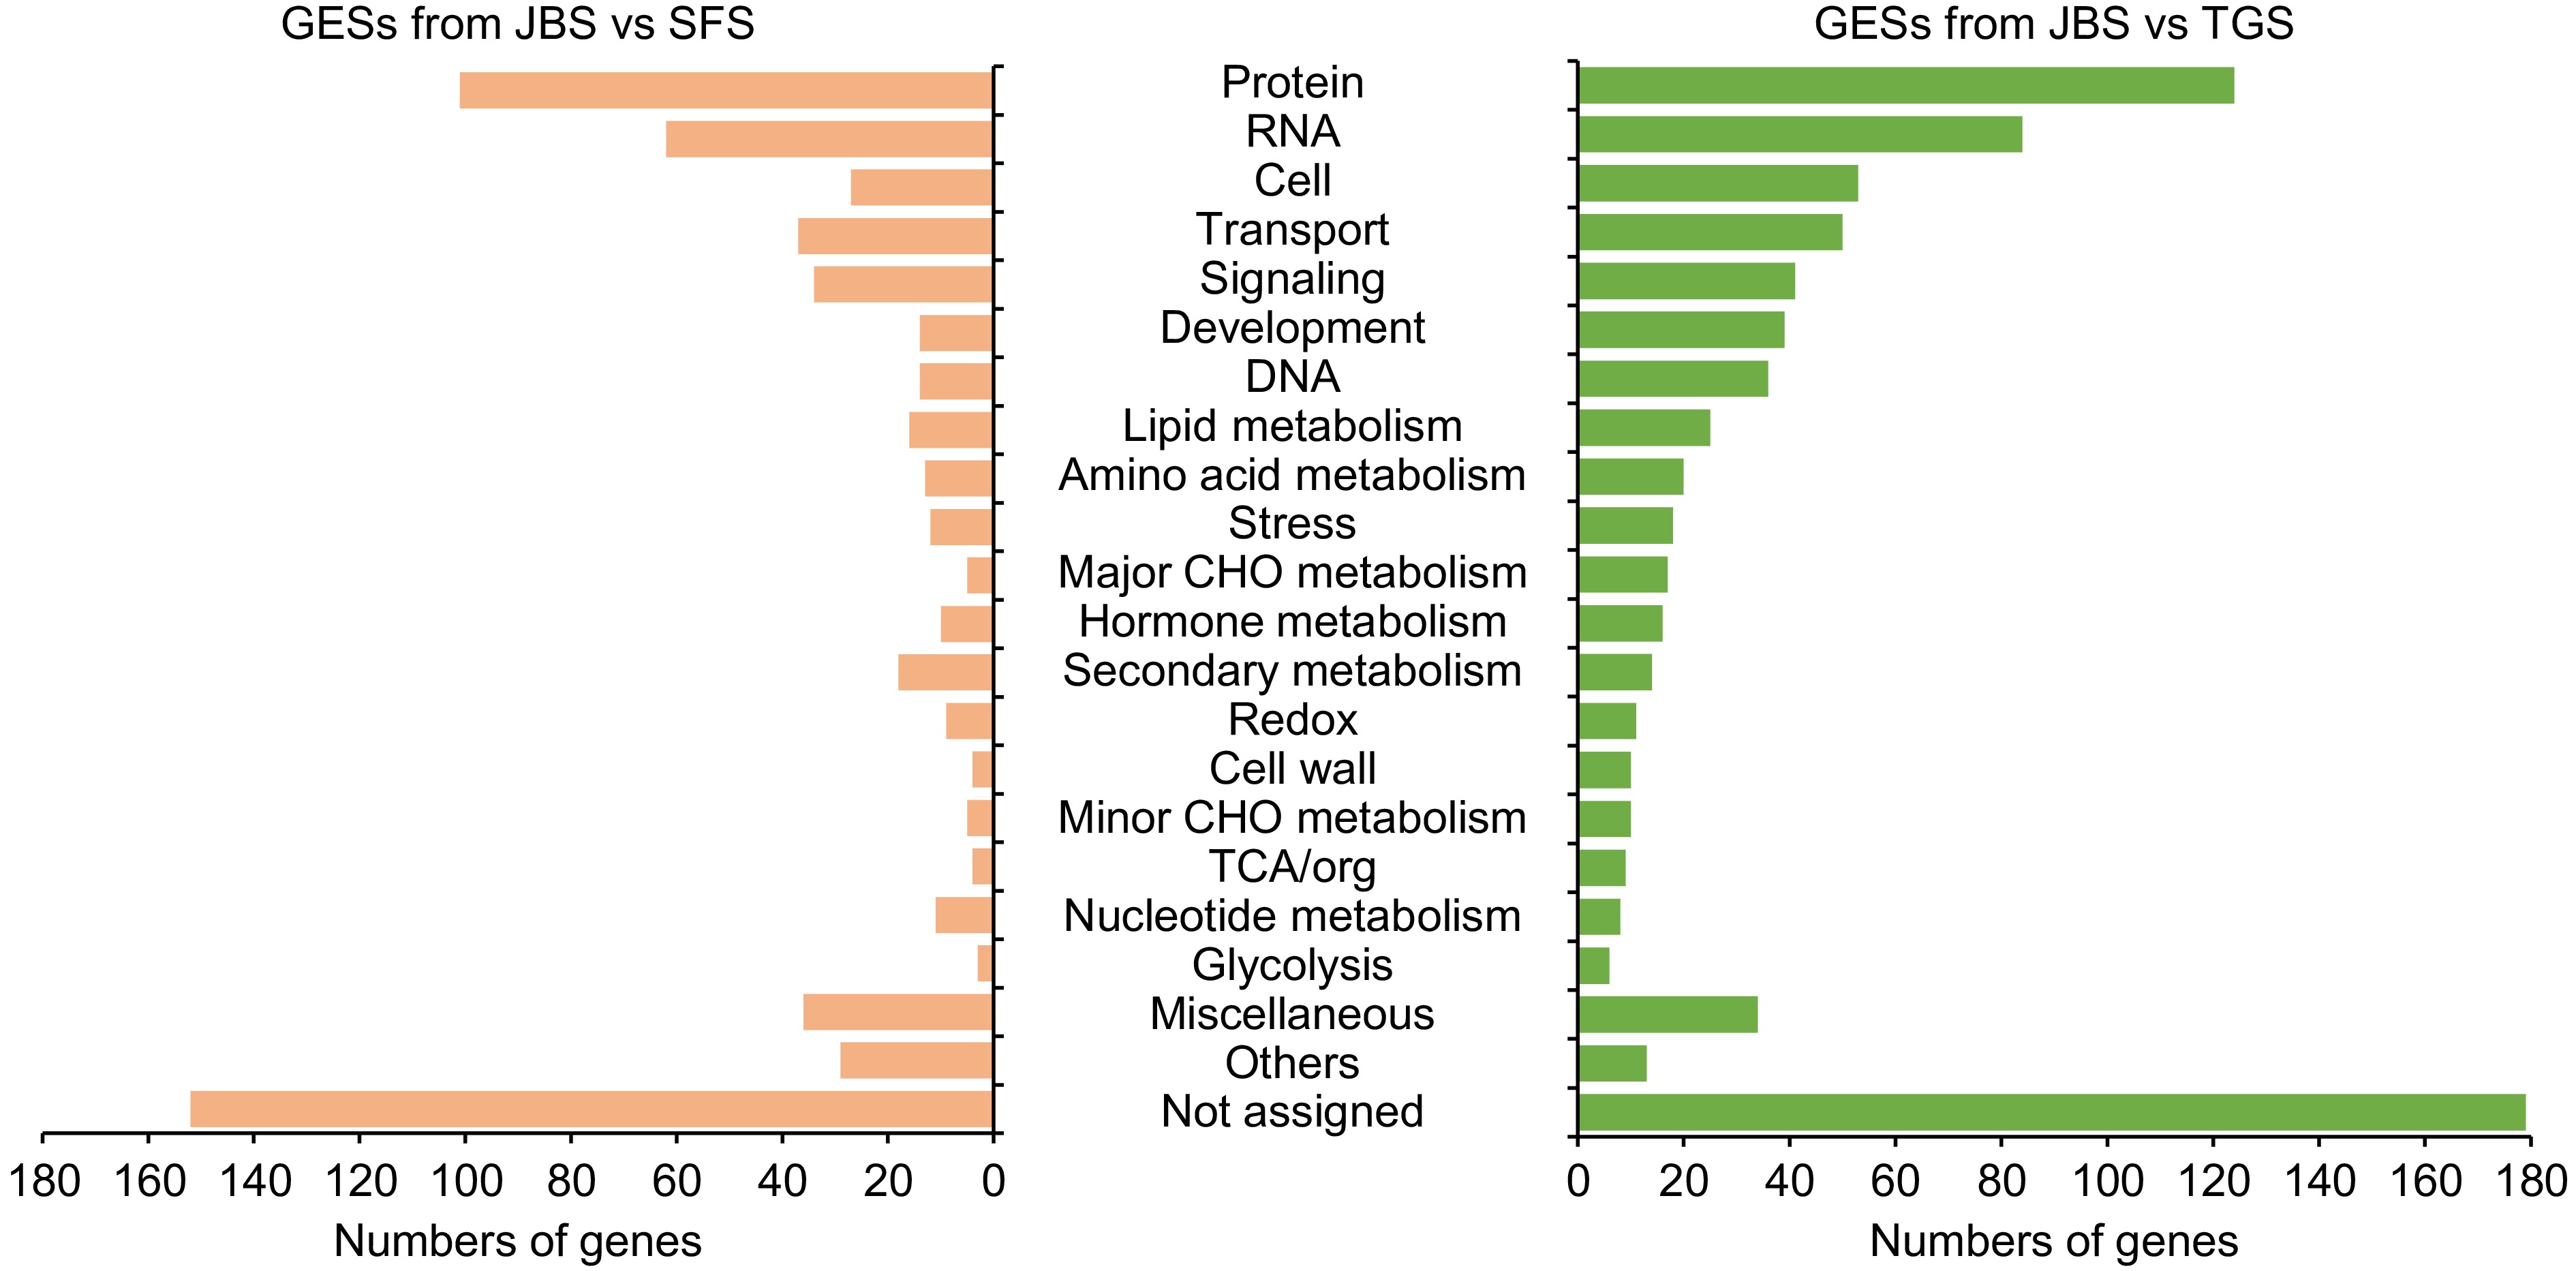
Figure 6.
The function of genes involved in exon skipping events. Gene functions were predicted and categorized using MapMan bin codes. Abbreviations: TCA, tricarboxylic acid.
-
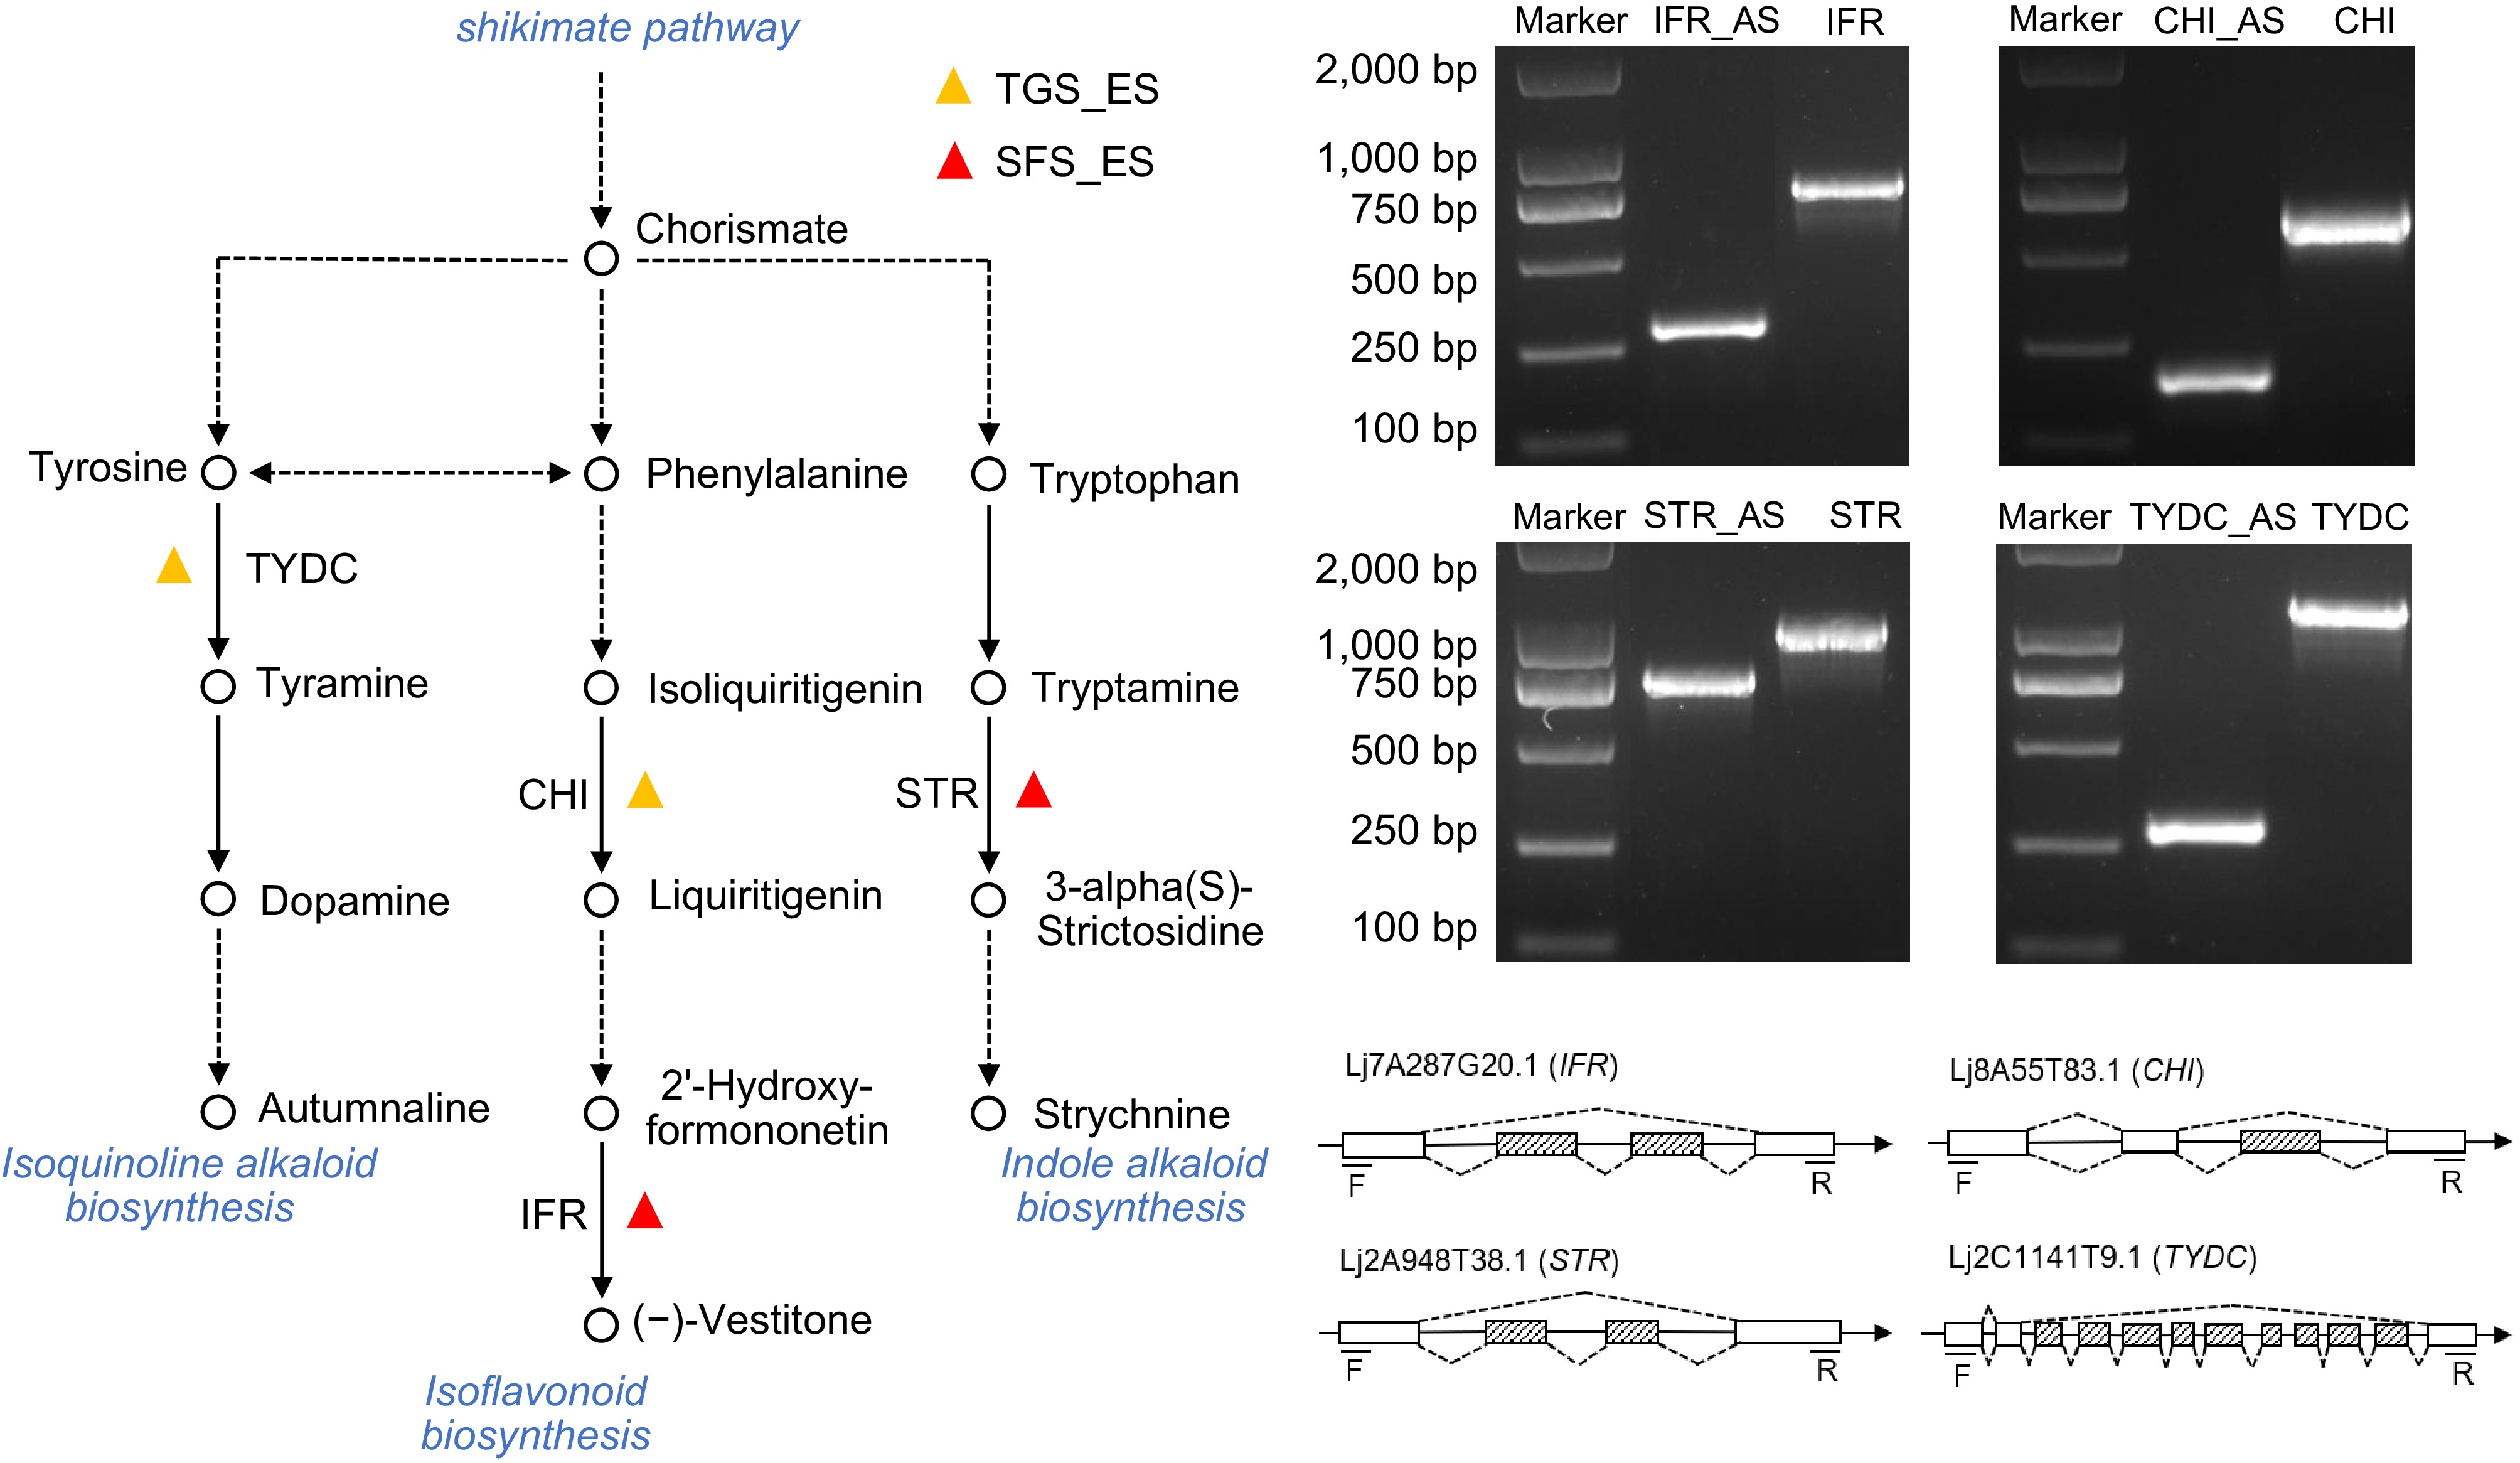
Figure 7.
The metabolic pathway mapping and structure validation of exon skipping event genes. The ES genes were mapped to the metabolic pathways using the KEGG database. Hollow circles represent compounds in the pathway, while solid black lines represent a single reaction step and dotted lines represent multiple steps. Gene structure was analyzed by PCR and sequencing to identify splicing variants. Boxes represent the exons, boxes filled with dashed lines represent the splicing exons, solid lines represent the introns, and dotted lines indicate the splicing sites of introns.
-
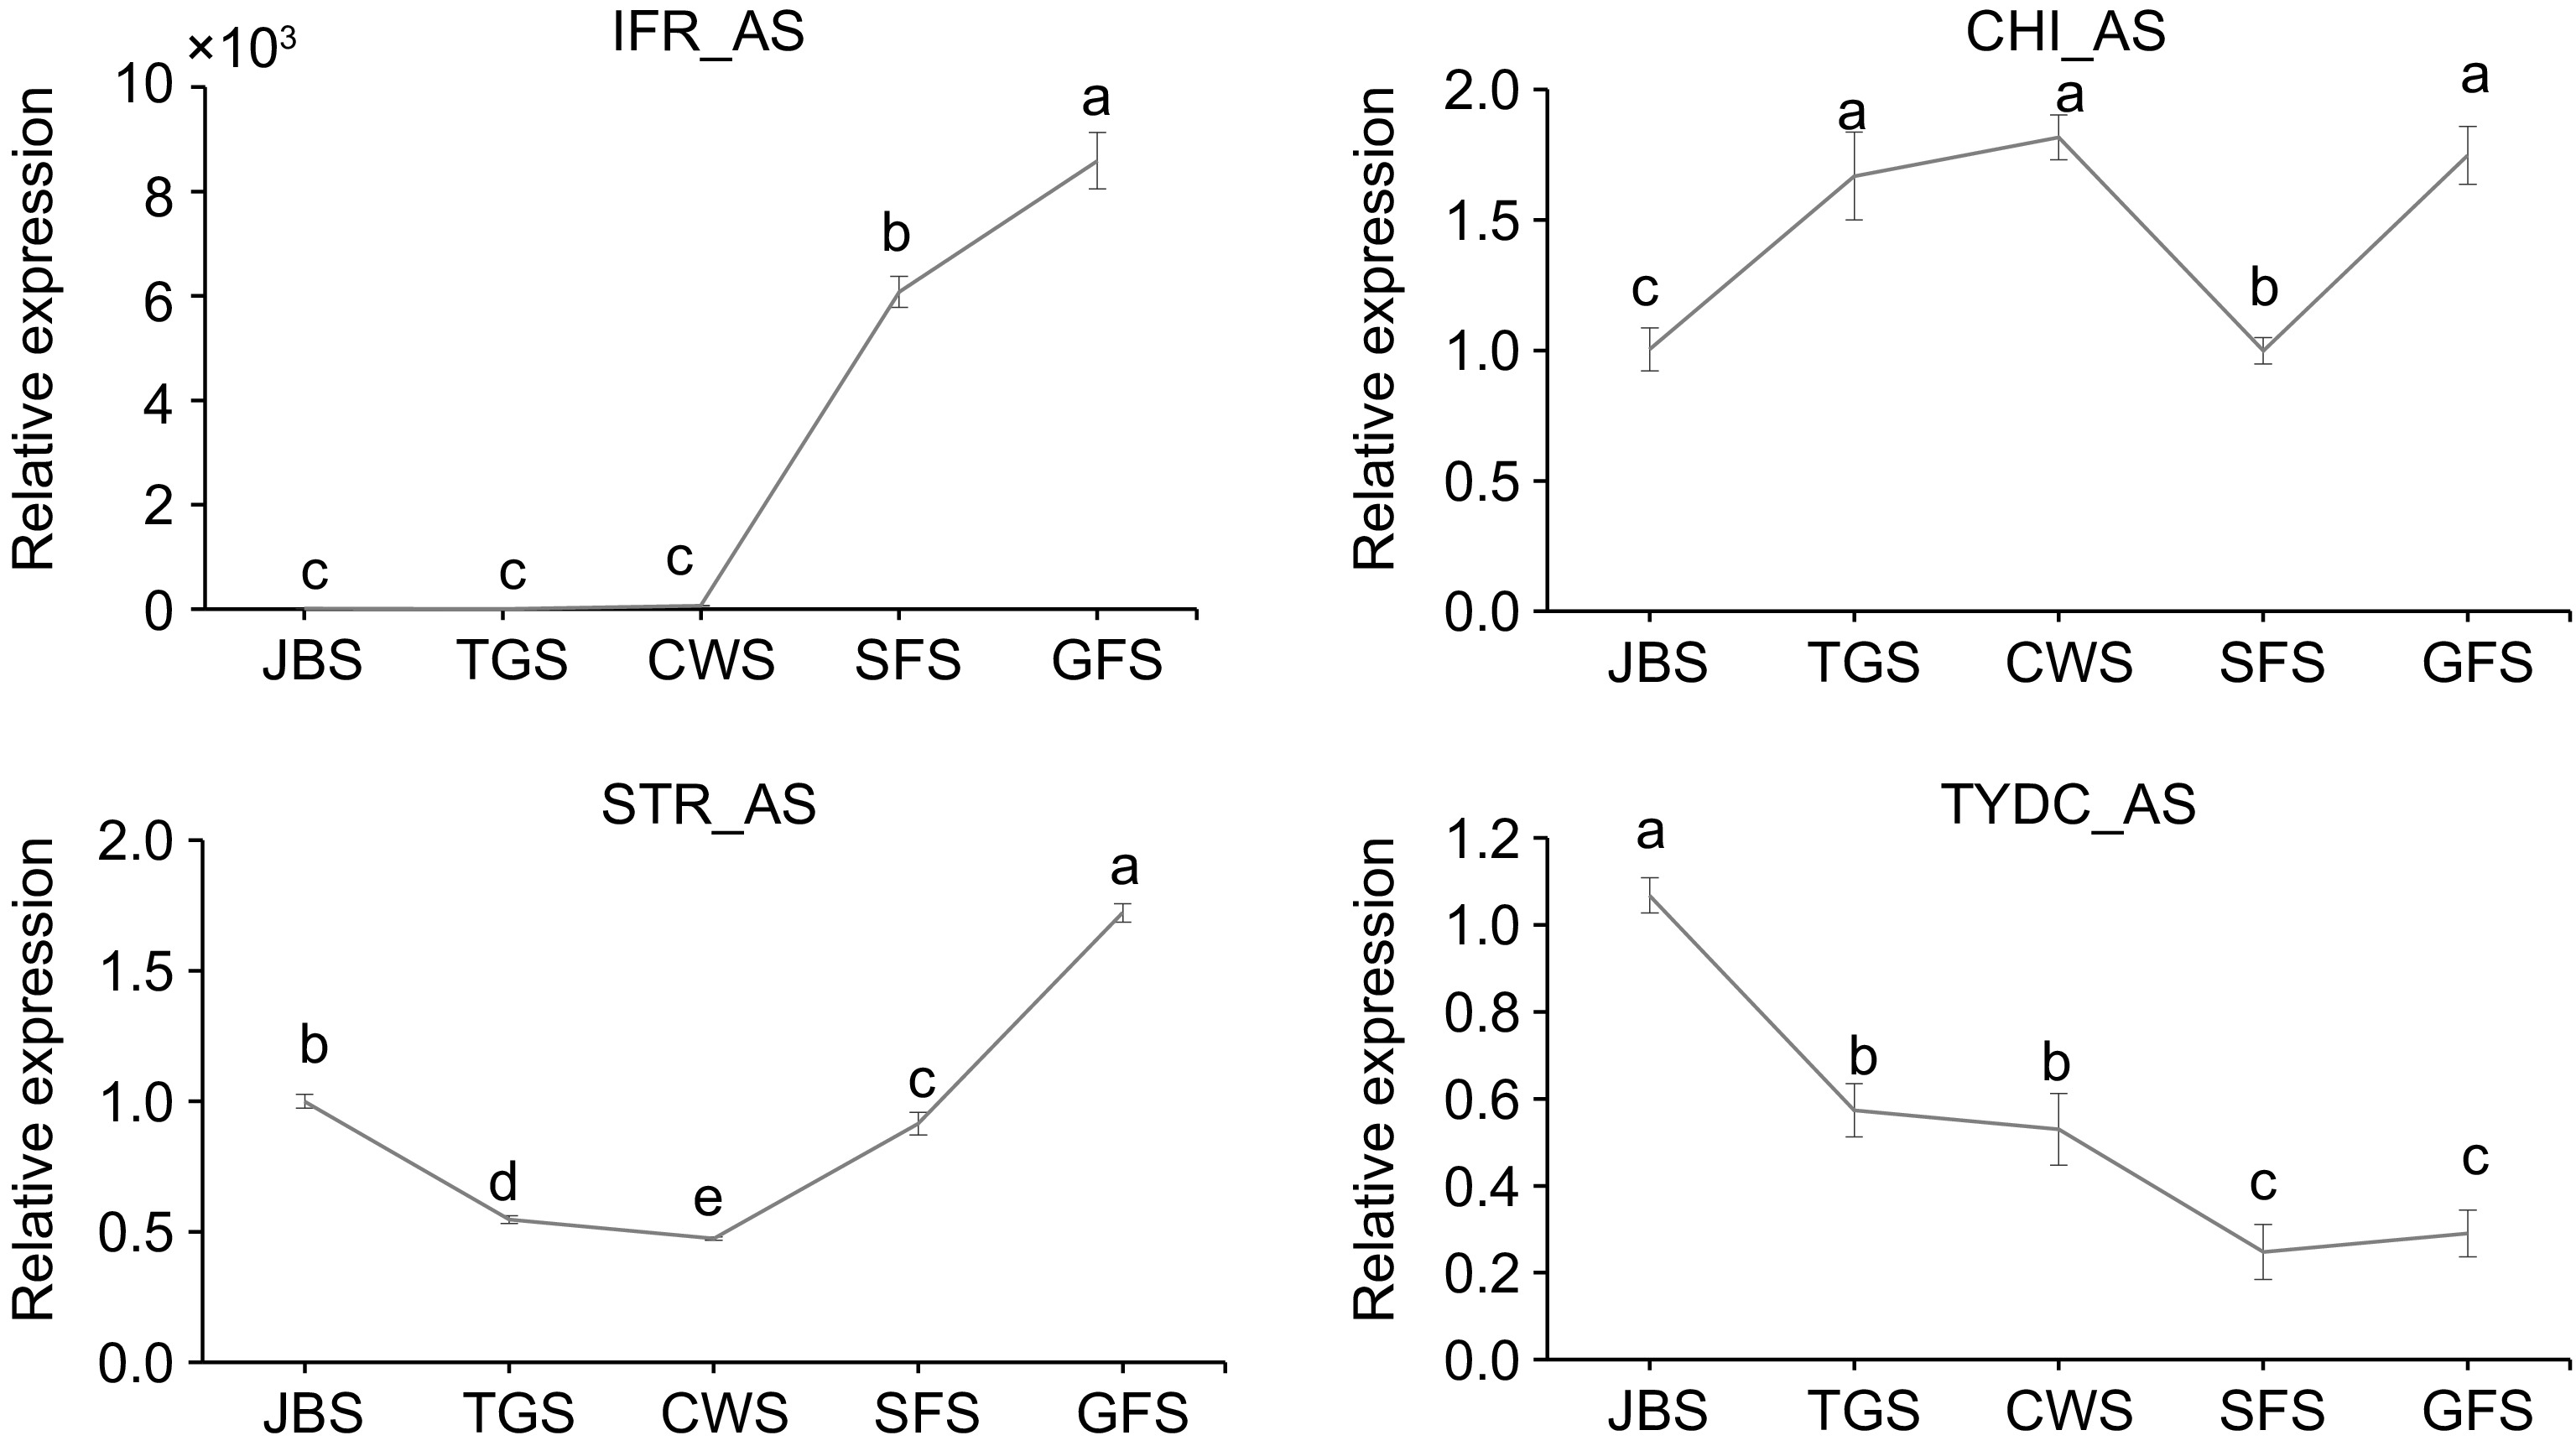
Figure 8.
Expression levels of genes involved in AS events at different flowering stages. RNAs were extracted and the expression of genes was measured by qRT-PCR. The data are presented as the mean ± SD from three independent biological replicates. Means with the same letter were not significantly different among floral stages, while different letters indicate that the change is significant according to Tukey's multiple comparison (p < 0.05).
-
Sample Raw reads (M) Raw bases (G) Raw Q20 (G) Raw Q30 (G) Clean reads (M) Clean bases (G) Clean Q20 (G) Clean Q30 (G) Average
length (bp)JBS_1 32.623 4.226 3.981 (94.2%) 3.725 (88.1%) 29.040 (89.0%) 3.654 (86.5%) 3.560 (97.4%) 3.419 (93.6%) 125.8 JBS_2 49.964 6.245 5.884 (94.2%) 5.528 (88.5%) 44.648 (89.4%) 5.431 (87.0%) 5.285 (97.3%) 5.087 (93.7%) 121.6 JBS_3 40.982 5.123 4.830 (94.3%) 4.533 (88.5%) 36.754 (89.7%) 4.464 (87.2%) 4.344 (97.3%) 4.175 (93.5%) 121.5 TGS_1 48.764 6.095 5.741 (94.2%) 5.379 (88.2%) 43.324 (88.8%) 5.281 (86.6%) 5.141 (97.4%) 4.941 (93.6%) 121.9 TGS_2 48.817 6.102 5.768 (94.5%) 5.434 (89.1%) 44.174 (90.5%) 5.377 (88.1%) 5.233 (97.3%) 5.037 (93.7%) 121.7 TGS_3 36.493 4.728 4.483 (94.8%) 4.231 (89.5%) 32.980 (90.4%) 4.176 (88.3%) 4.075 (97.6%) 3.929 (94.1%) 126.6 CWS_1 34.153 4.316 4.050 (93.8%) 3.794 (87.9%) 30.309 (88.7%) 3.702 (85.8%) 3.599 (97.2%) 3.459 (93.4%) 122.1 CWS_2 40.121 5.110 4.829 (94.5%) 4.536 (88.8%) 35.785 (89.2%) 4.425 (86.6%) 4.317 (97.6%) 4.156 (93.9%) 123.7 CWS_3 30.453 3.917 3.693 (94.3%) 3.462 (88.4%) 27.201 (89.3%) 3.407 (87.0%) 3.317 (97.4%) 3.187 (93.6%) 125.2 SFS_1 48.938 6.117 5.757 (94.1%) 5.393 (88.2%) 43.576 (89.0%) 5.295 (86.6%) 5.152 (97.3%) 4.950 (93.5%) 121.5 SFS_2 46.323 5.790 5.469 (94.5%) 5.137 (88.7%) 41.419 (89.4%) 5.054 (87.3%) 4.925 (97.4%) 4.738 (93.7%) 122 SFS_3 50.913 6.364 5.930 (93.2%) 5.519 (86.7%) 44.178 (86.8%) 5.344 (84.0%) 5.189 (97.1%) 4.978 (93.1%) 121 GFS_1 27.133 4.070 3.977 (97.7%) 3.853 (94.7%) 25.913 (95.5%) 3.834 (94.2%) 3.798 (99.0%) 3.721 (97.0%) 148 GFS_2 49.948 7.492 7.324 (97.8%) 7.099 (94.8%) 47.727 (95.6%) 7.066 (94.3%) 7.001 (99.1%) 6.861(97.1%) 148 GFS_3 38.352 5.753 5.620 (97.7%) 5.444 (94.6%) 36.600 (95.4%) 5.425 (94.3%) 5.374 (99.1%) 5.265 (97.0%) 148.2 Table 1.
Quality data of samples from each of the five stages of the L. japonica transcriptome.
-
Sample Total mapping ratio Uniquely mapping ratio JBS_1 96.85% 56.37% JBS_2 97.19% 81.70% JBS_3 97.32% 67.75% TGS_1 98.50% 53.61% TGS_2 96.94% 88.34% TGS_3 96.97% 89.20% CWS_1 96.66% 92.97% CWS_2 97.32% 58.13% CWS_3 97.53% 72.41% SFS_1 97.54% 62.00% SFS_2 98.39% 55.27% SFS_3 96.94% 68.99% GFS_1 91.43% 87.21% GFS_2 91.17% 86.69% GFS_3 91.25% 86.94% Table 2.
Mapping of the L. japonica transcriptome to the reference genome.
Figures
(8)
Tables
(2)