-
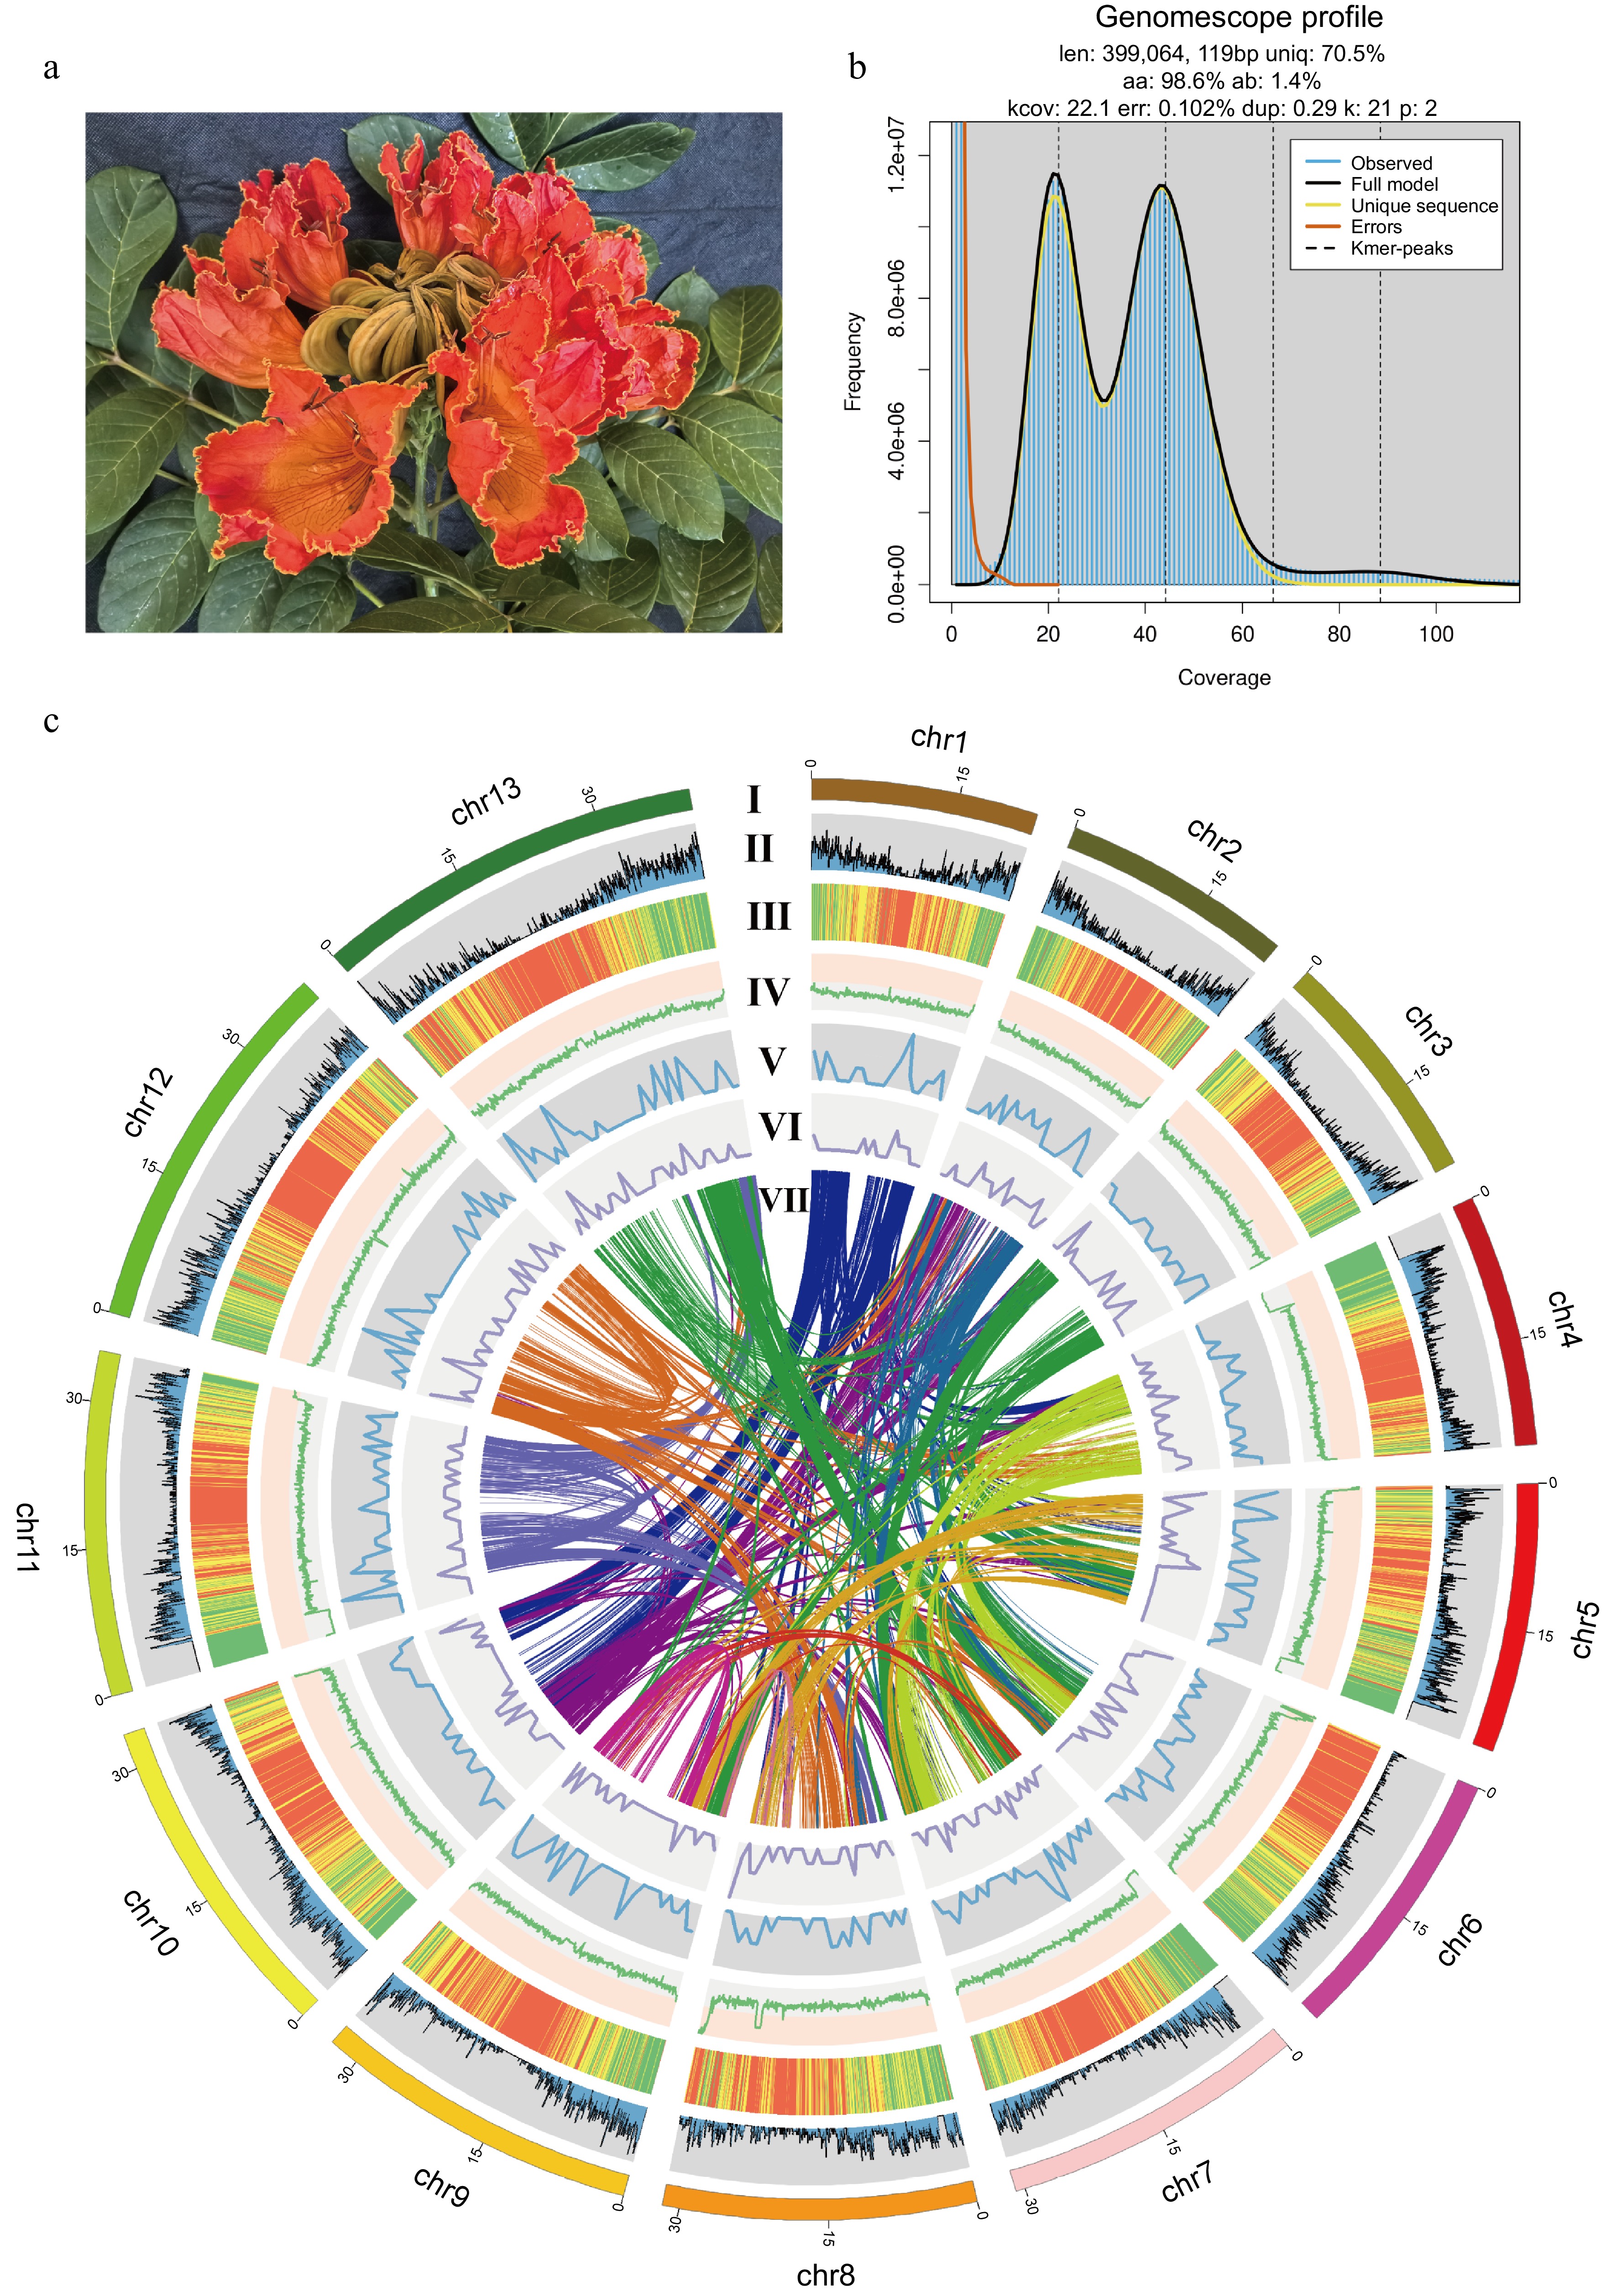
Figure 1.
The genome of the African tulip tree. (a) Flower of the African tulip tree. (b) Distribution profiles of 21-mer analysis of short reads. (c) Circos plot showing the genome details. Labels I-VII indicate: (I) 13 pseudo-chromosomes of S. campanulata; (II) gene density; (III) repeat sequence content; (IV) GC content density; (V) density of Copia LTR-RTs; (VI) density of Gypsy LTR-RTs; (VII) syntenic blocks (all window sizes = 50 kb).
-
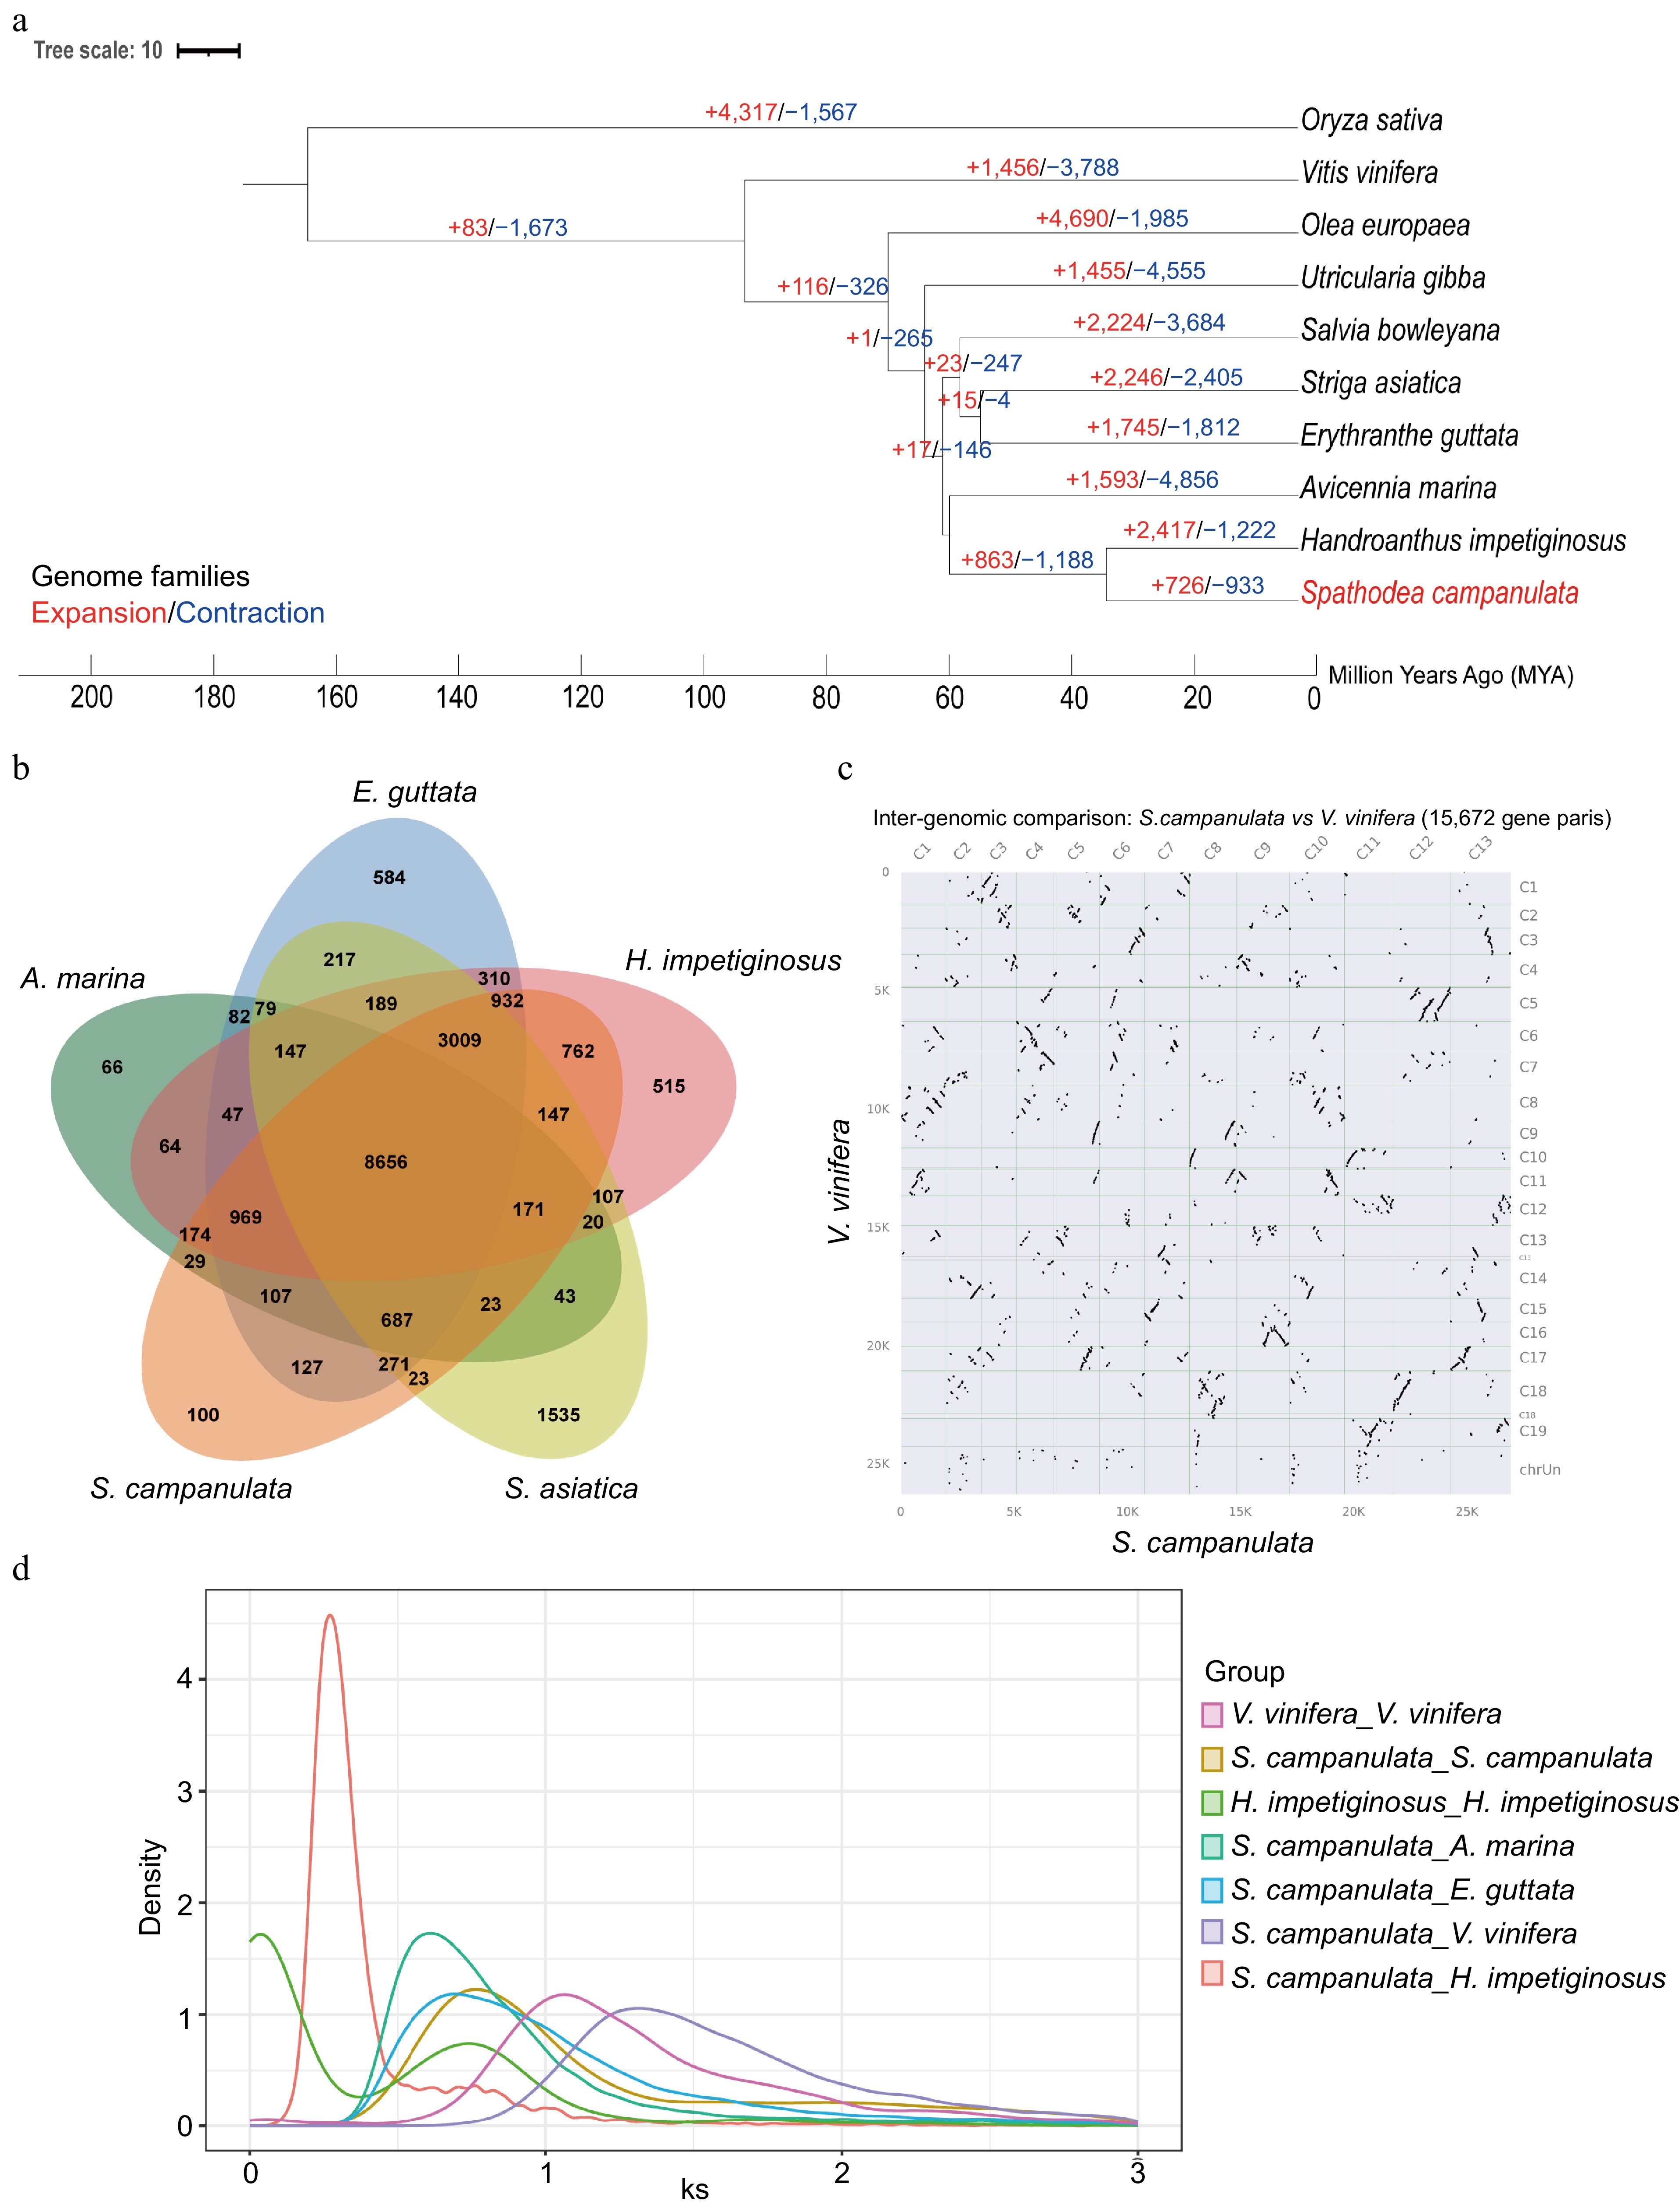
Figure 2.
Comparative genomic analysis of the African tulip tree. (a) Expansion and loss of gene orthogroups leading to the current African tulip tree genome. (b) Venn diagram showing orthogroups shared by the African tulip tree and related genomes. (c) Syntenic dot plot between S. campanulata and V. vinifera. (d) The Ks distribution map within and between species.
-
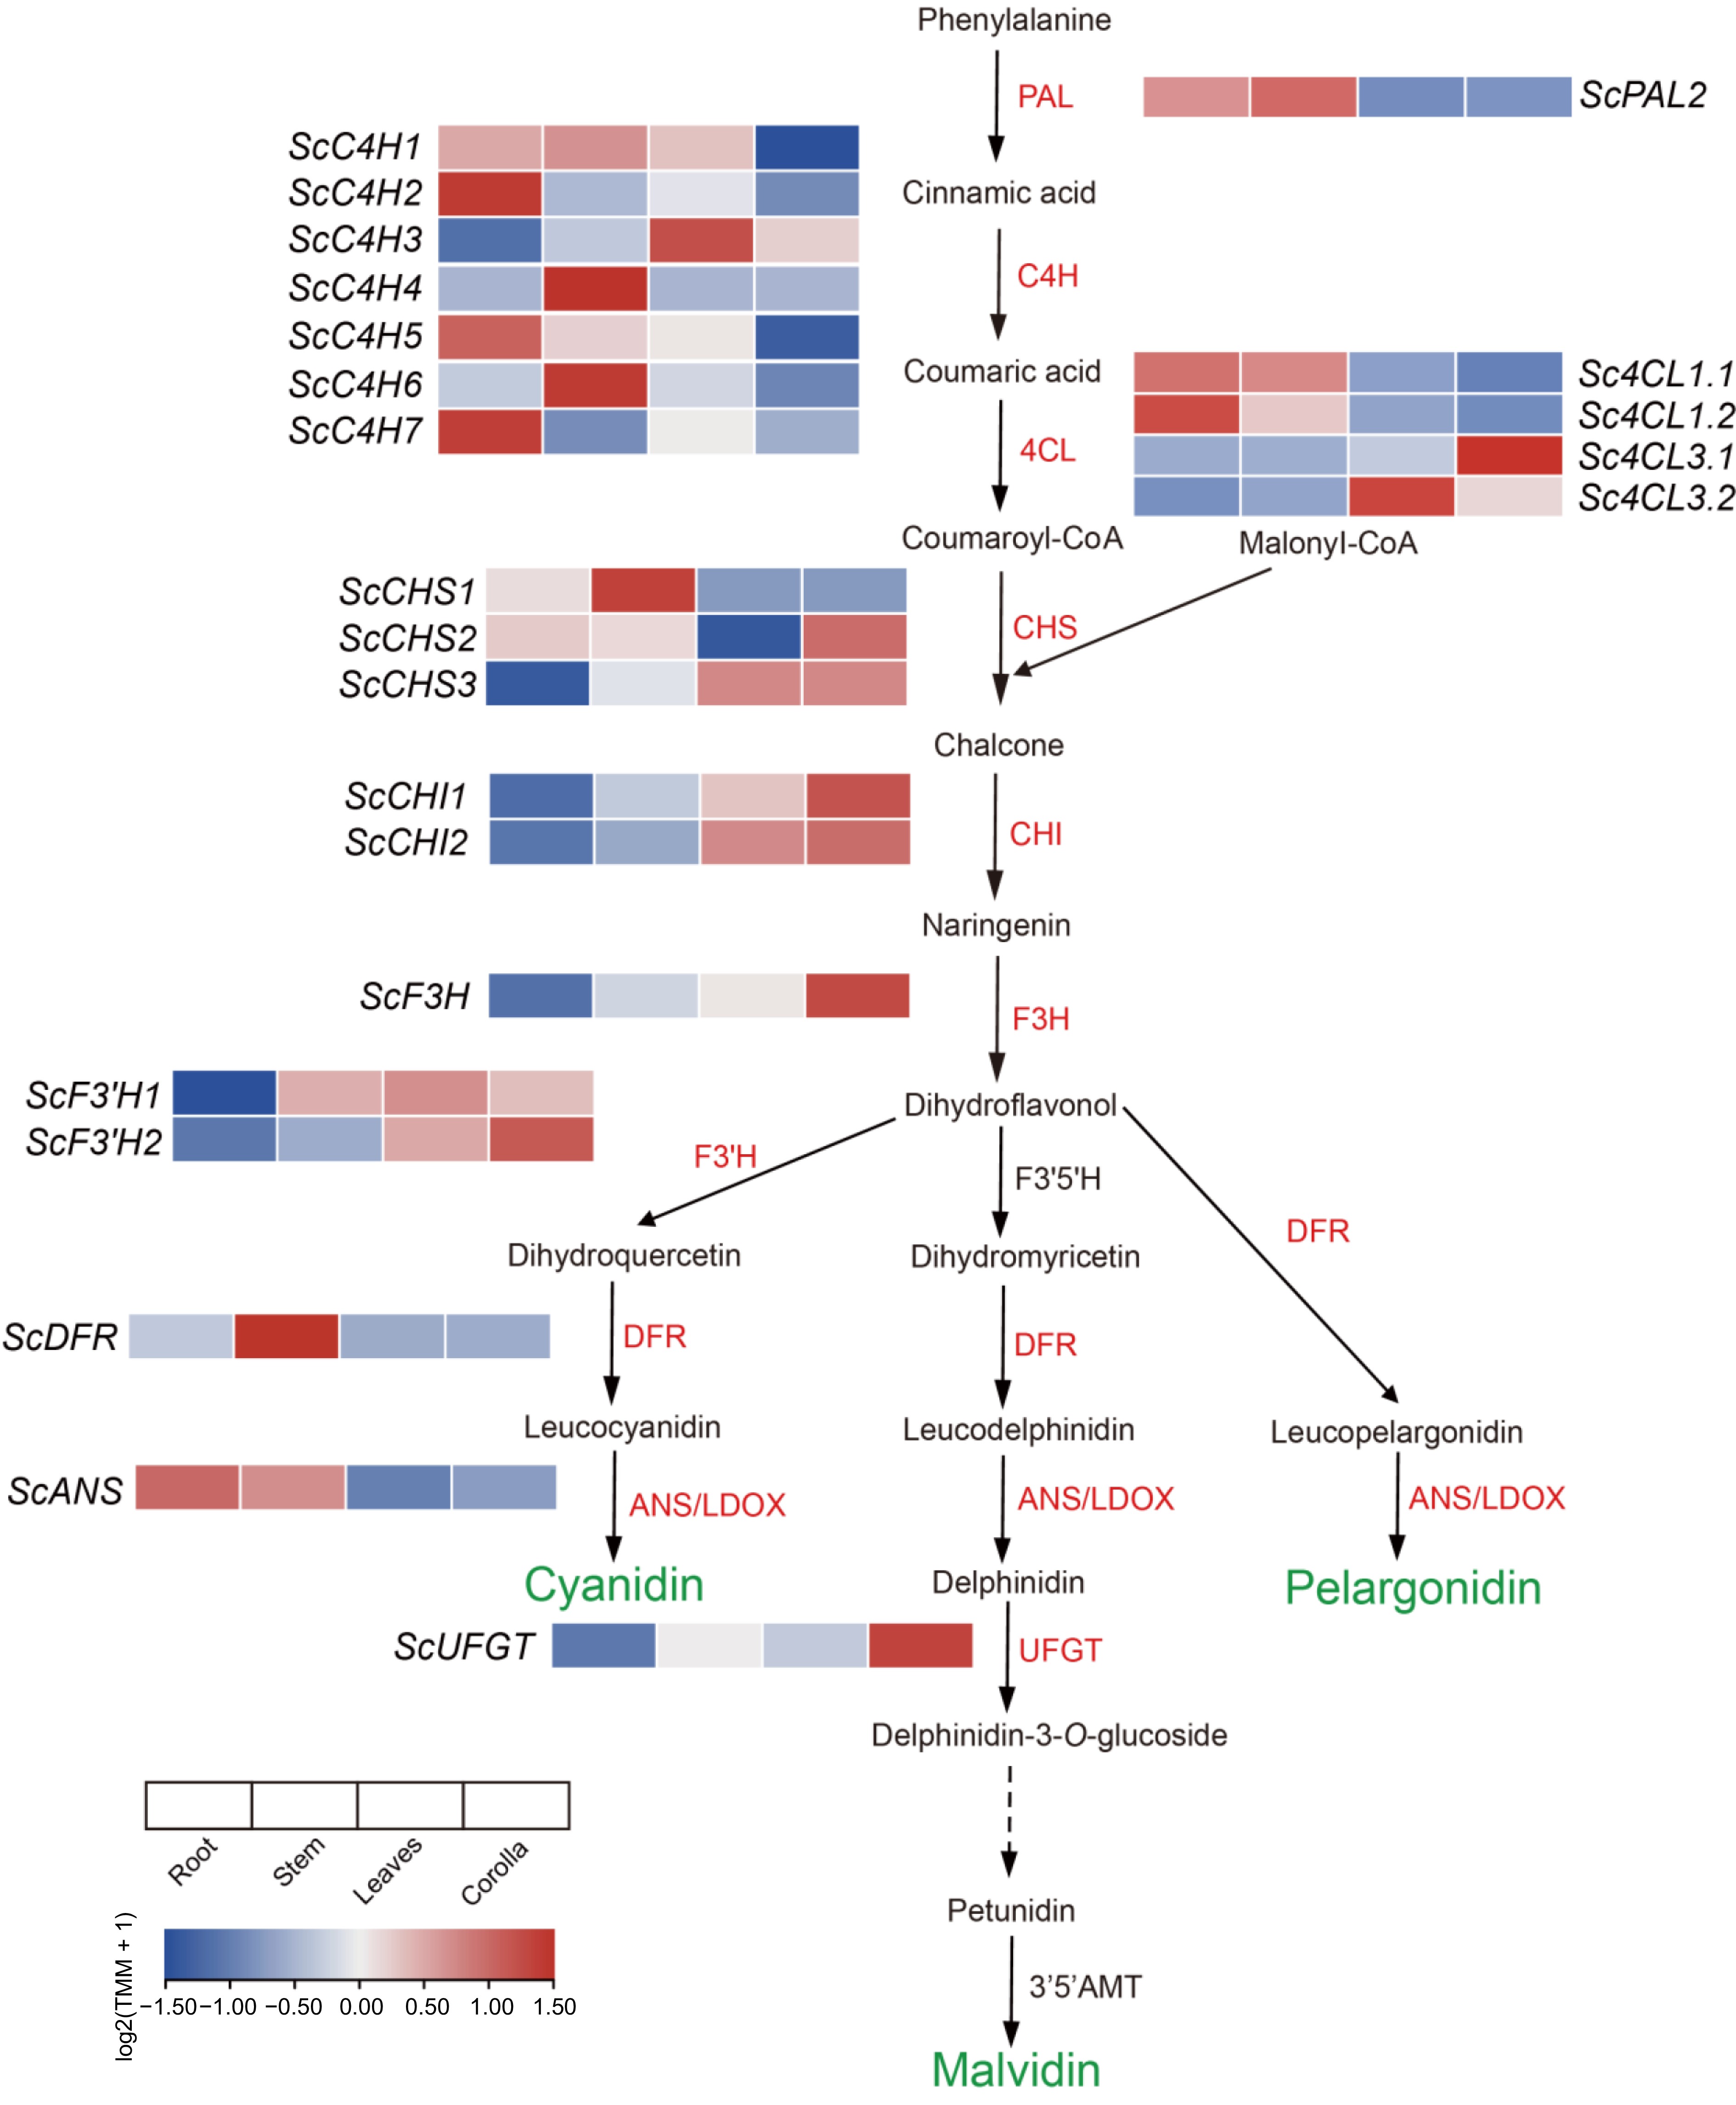
Figure 3.
Preferentially expressed genes in the phenylalanine metabolism pathway in the corolla of the African tulip tree (modified from Berardi et al.[56]) .
-
Genome Spathodea campanulata Ploidy 2n = 26 Estimated genome size (Mb) by k-mer 399.1 Assembled genome size (Mb) 407.9 Genomic heterozygosity (%) 1.4 Contig N50 (Mb) 31.7 Number of contigs 164 Number of pseudochromosomes 13 Repeat sequence content (%) 58.7 GC content (%) 33.9 Number of gene models 23,695 Genome BUSCOs (%) 98.1 Gene BUSCO (%) 97.5 Table 1.
Genomic statistics of Spathodea campanulata.
Figures
(3)
Tables
(1)