-
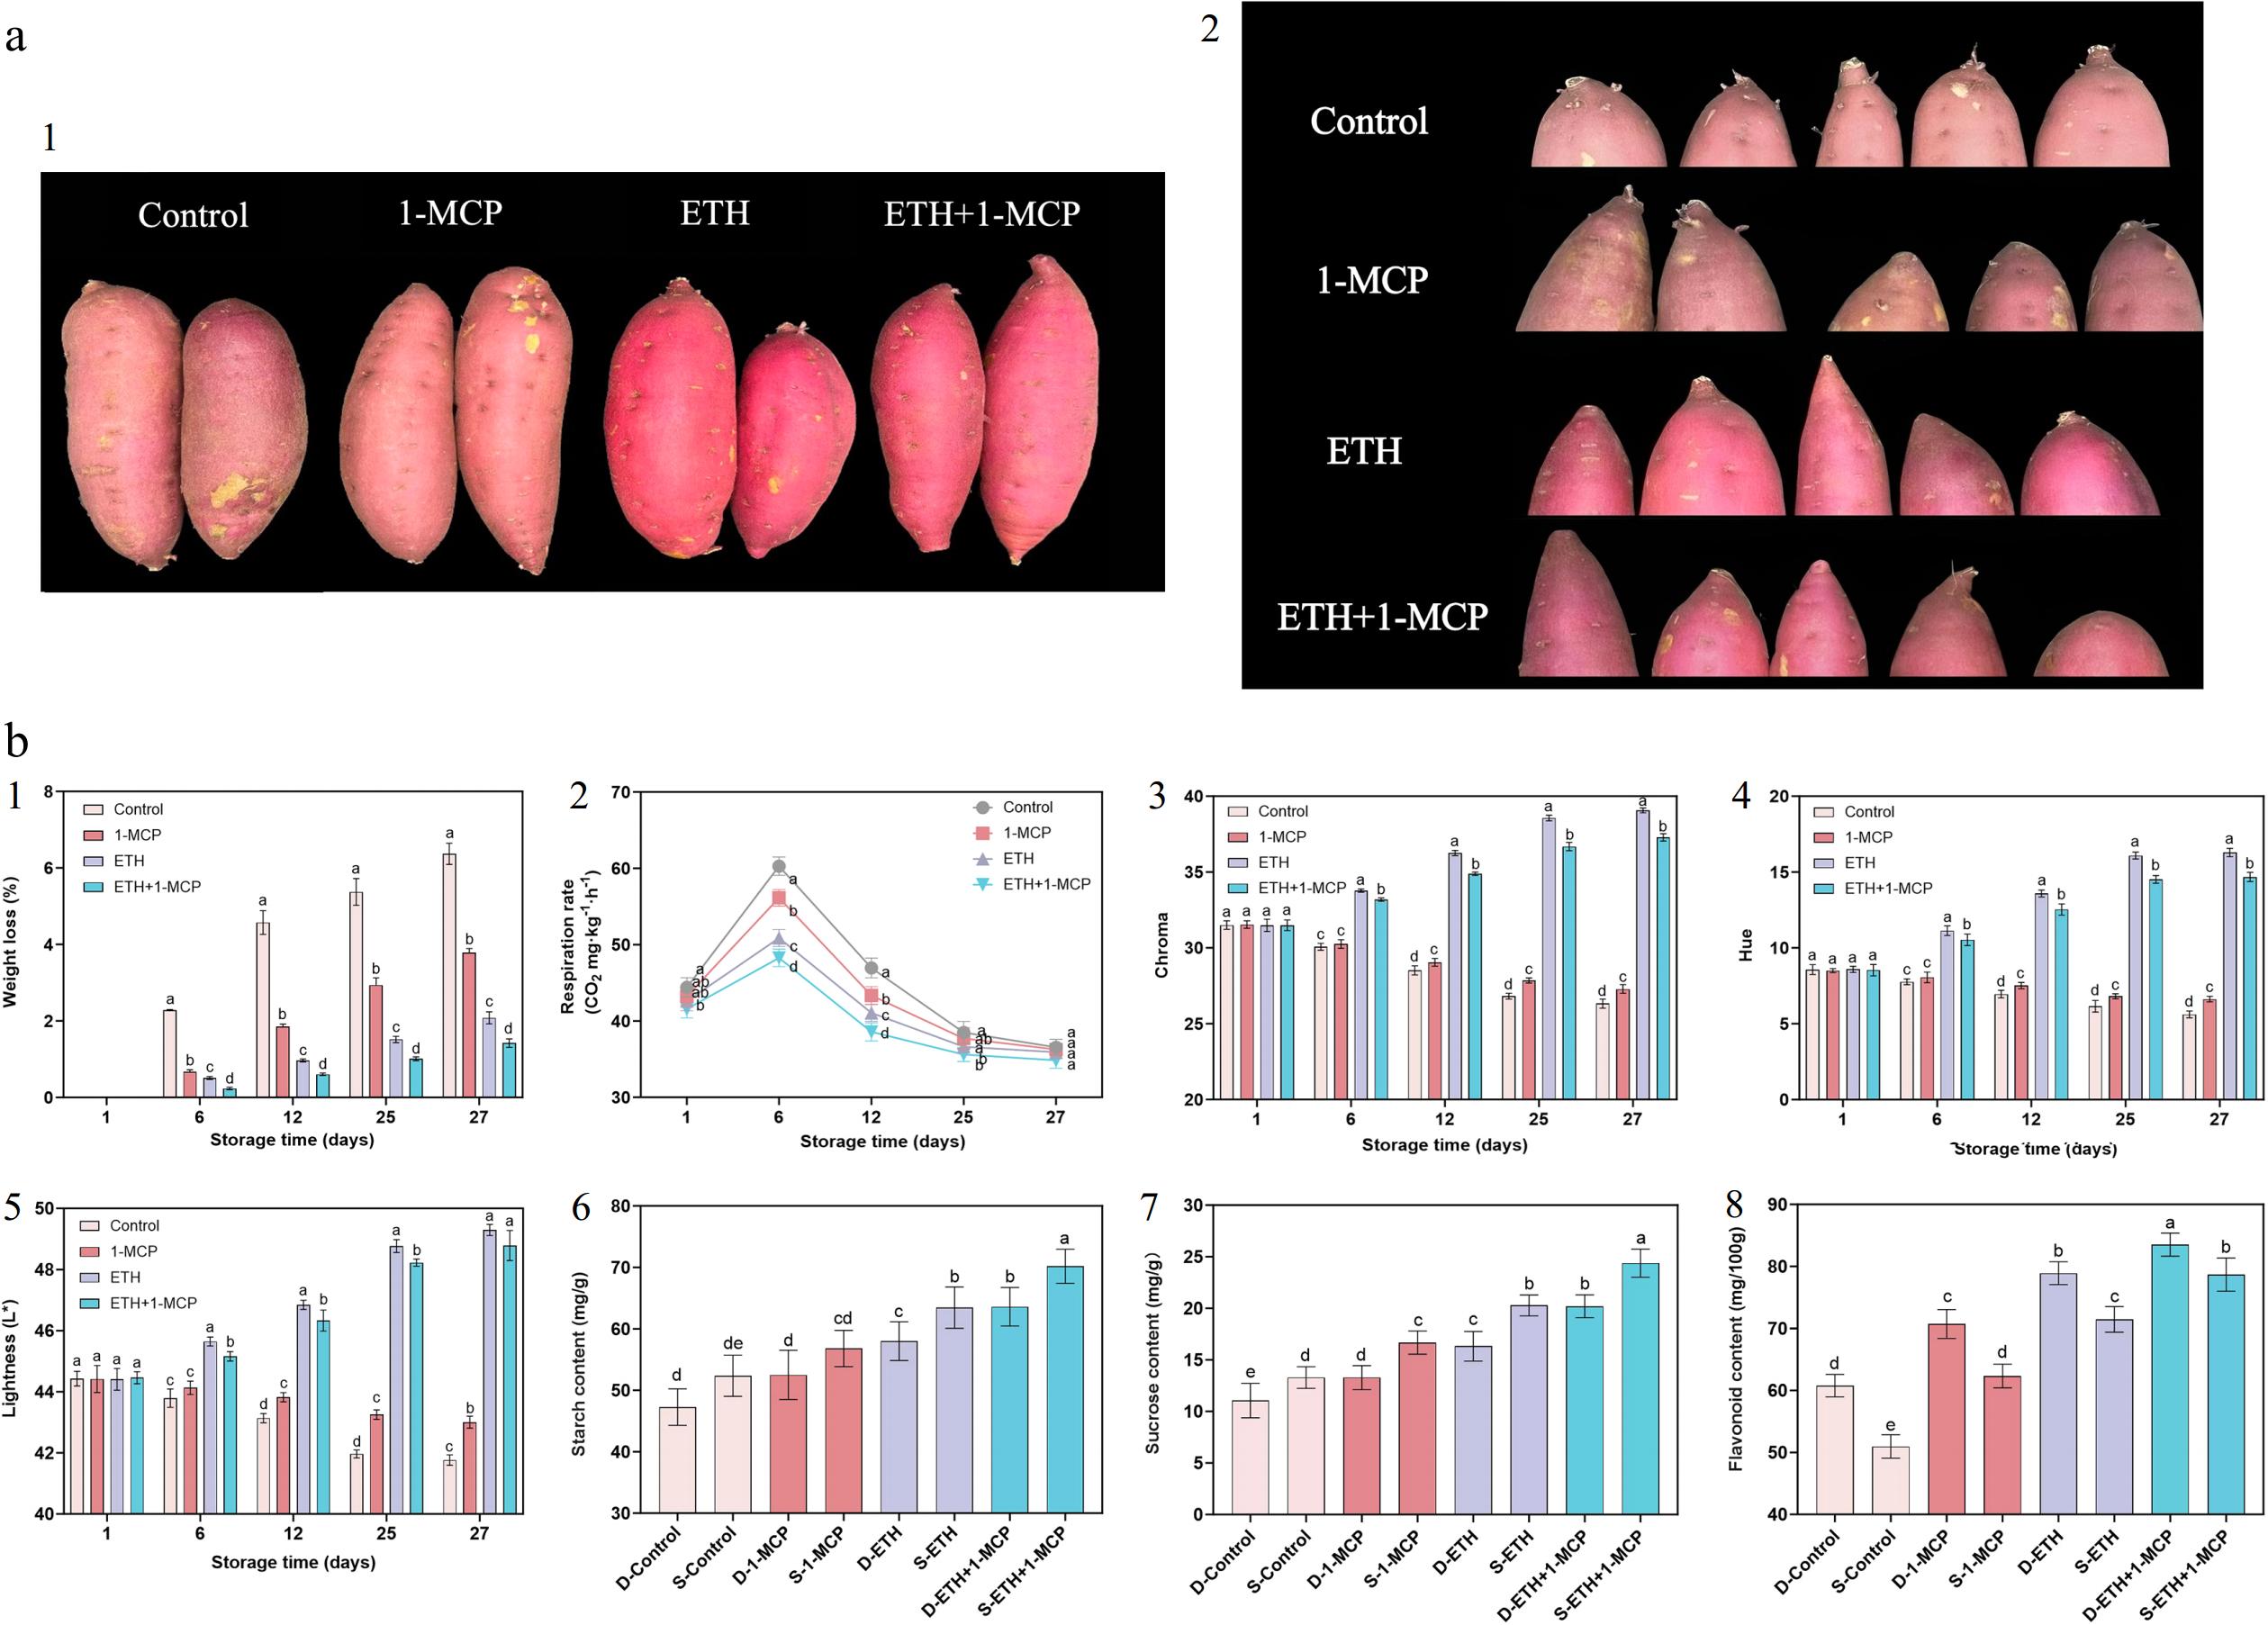
Figure 1.
(a) -1 Color and -2 sprout changes of Kokei No.14 sweet potato roots after exposure to 1-MCP (30 μl·L−1), ETH (200 μL·L−1), ETH + 1-MCP (200 μL·L−1 + 30 μL·L−1) after one week. (b) -1 Average percentage weight loss, -2 respiration rates, -3 chroma, -4 hue, -5 and lightness of Kokei No.14 sweet potato roots subjected to different treatments: Air (Control), 1-MCP, ETH, and ETH + 1-MCP. -6 Changes in starch, -7 sucrose, and -8 flavonoid content in D (dormancy) and S (Sprouting) period. Each data point is a mean of three replicates with six roots. Means followed by different letters at the same sampling point indicate statistical differences according to Tukey's test (p < 0.05).
-
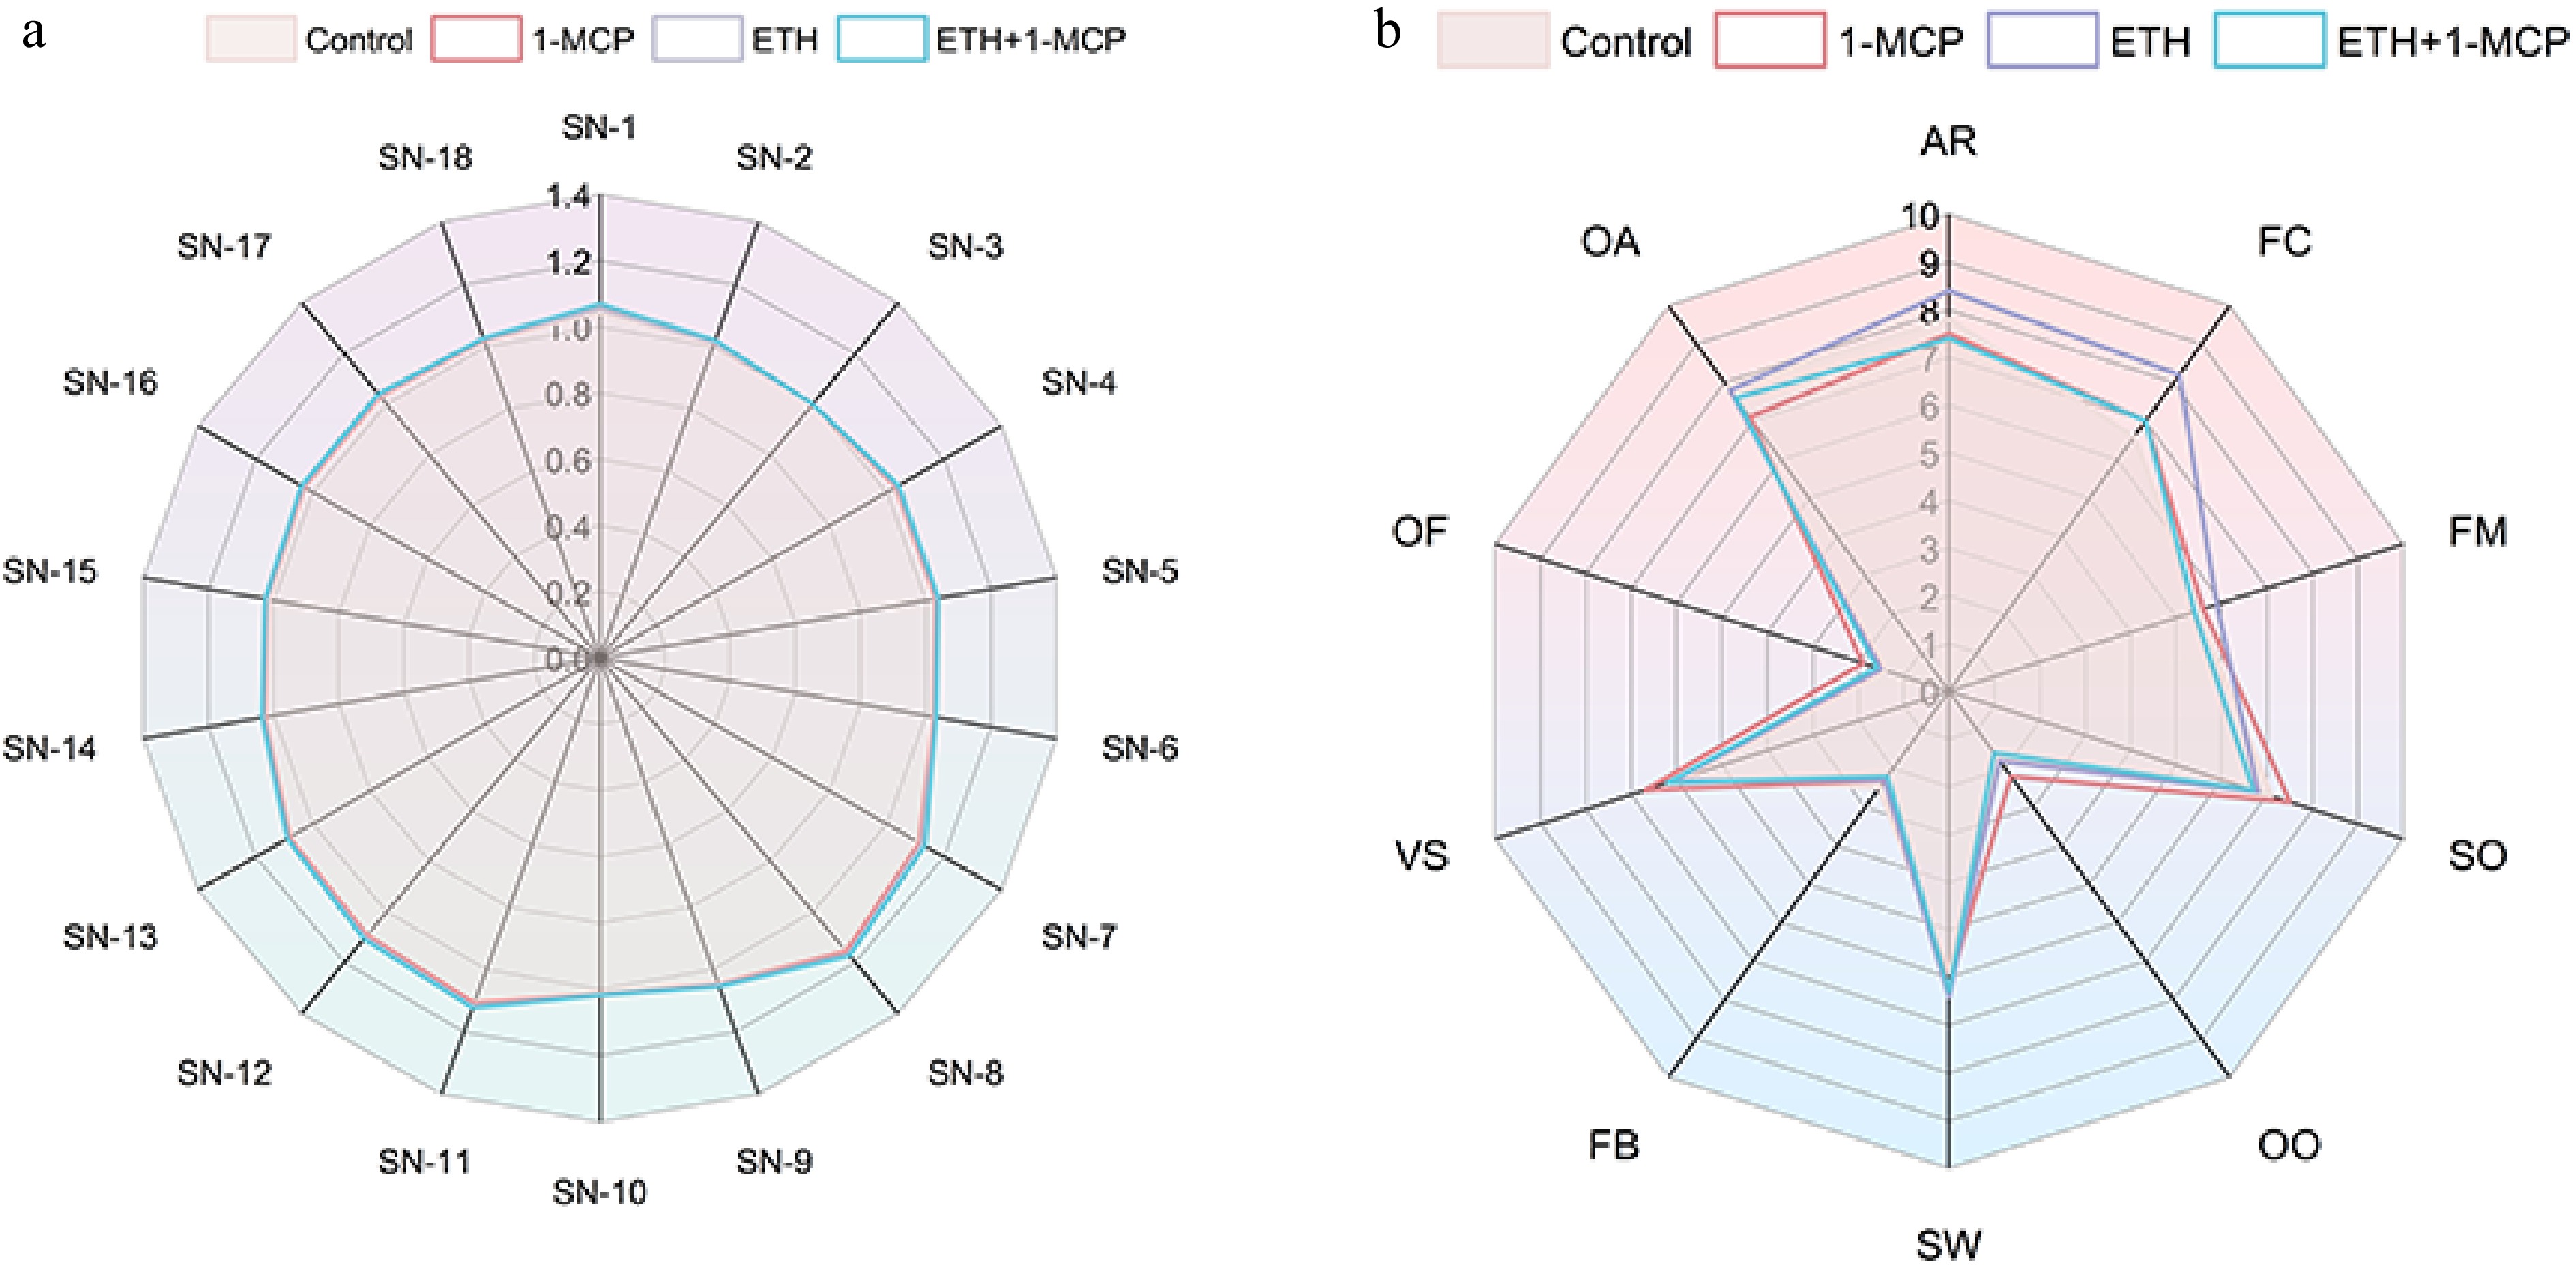
Figure 2.
(a) Radar chart of electronic nose results of Kokei No.14 sweet potato under treatments (Control, 1-MCP, ETH, ETH + 1-MCP). Values were the means of three replicates. (b) Sensory quality evaluation of sweet potato roots fumigated for 14 d under different treatments (Control, 1-MCP, ETH, ETH + 1-MCP).
-
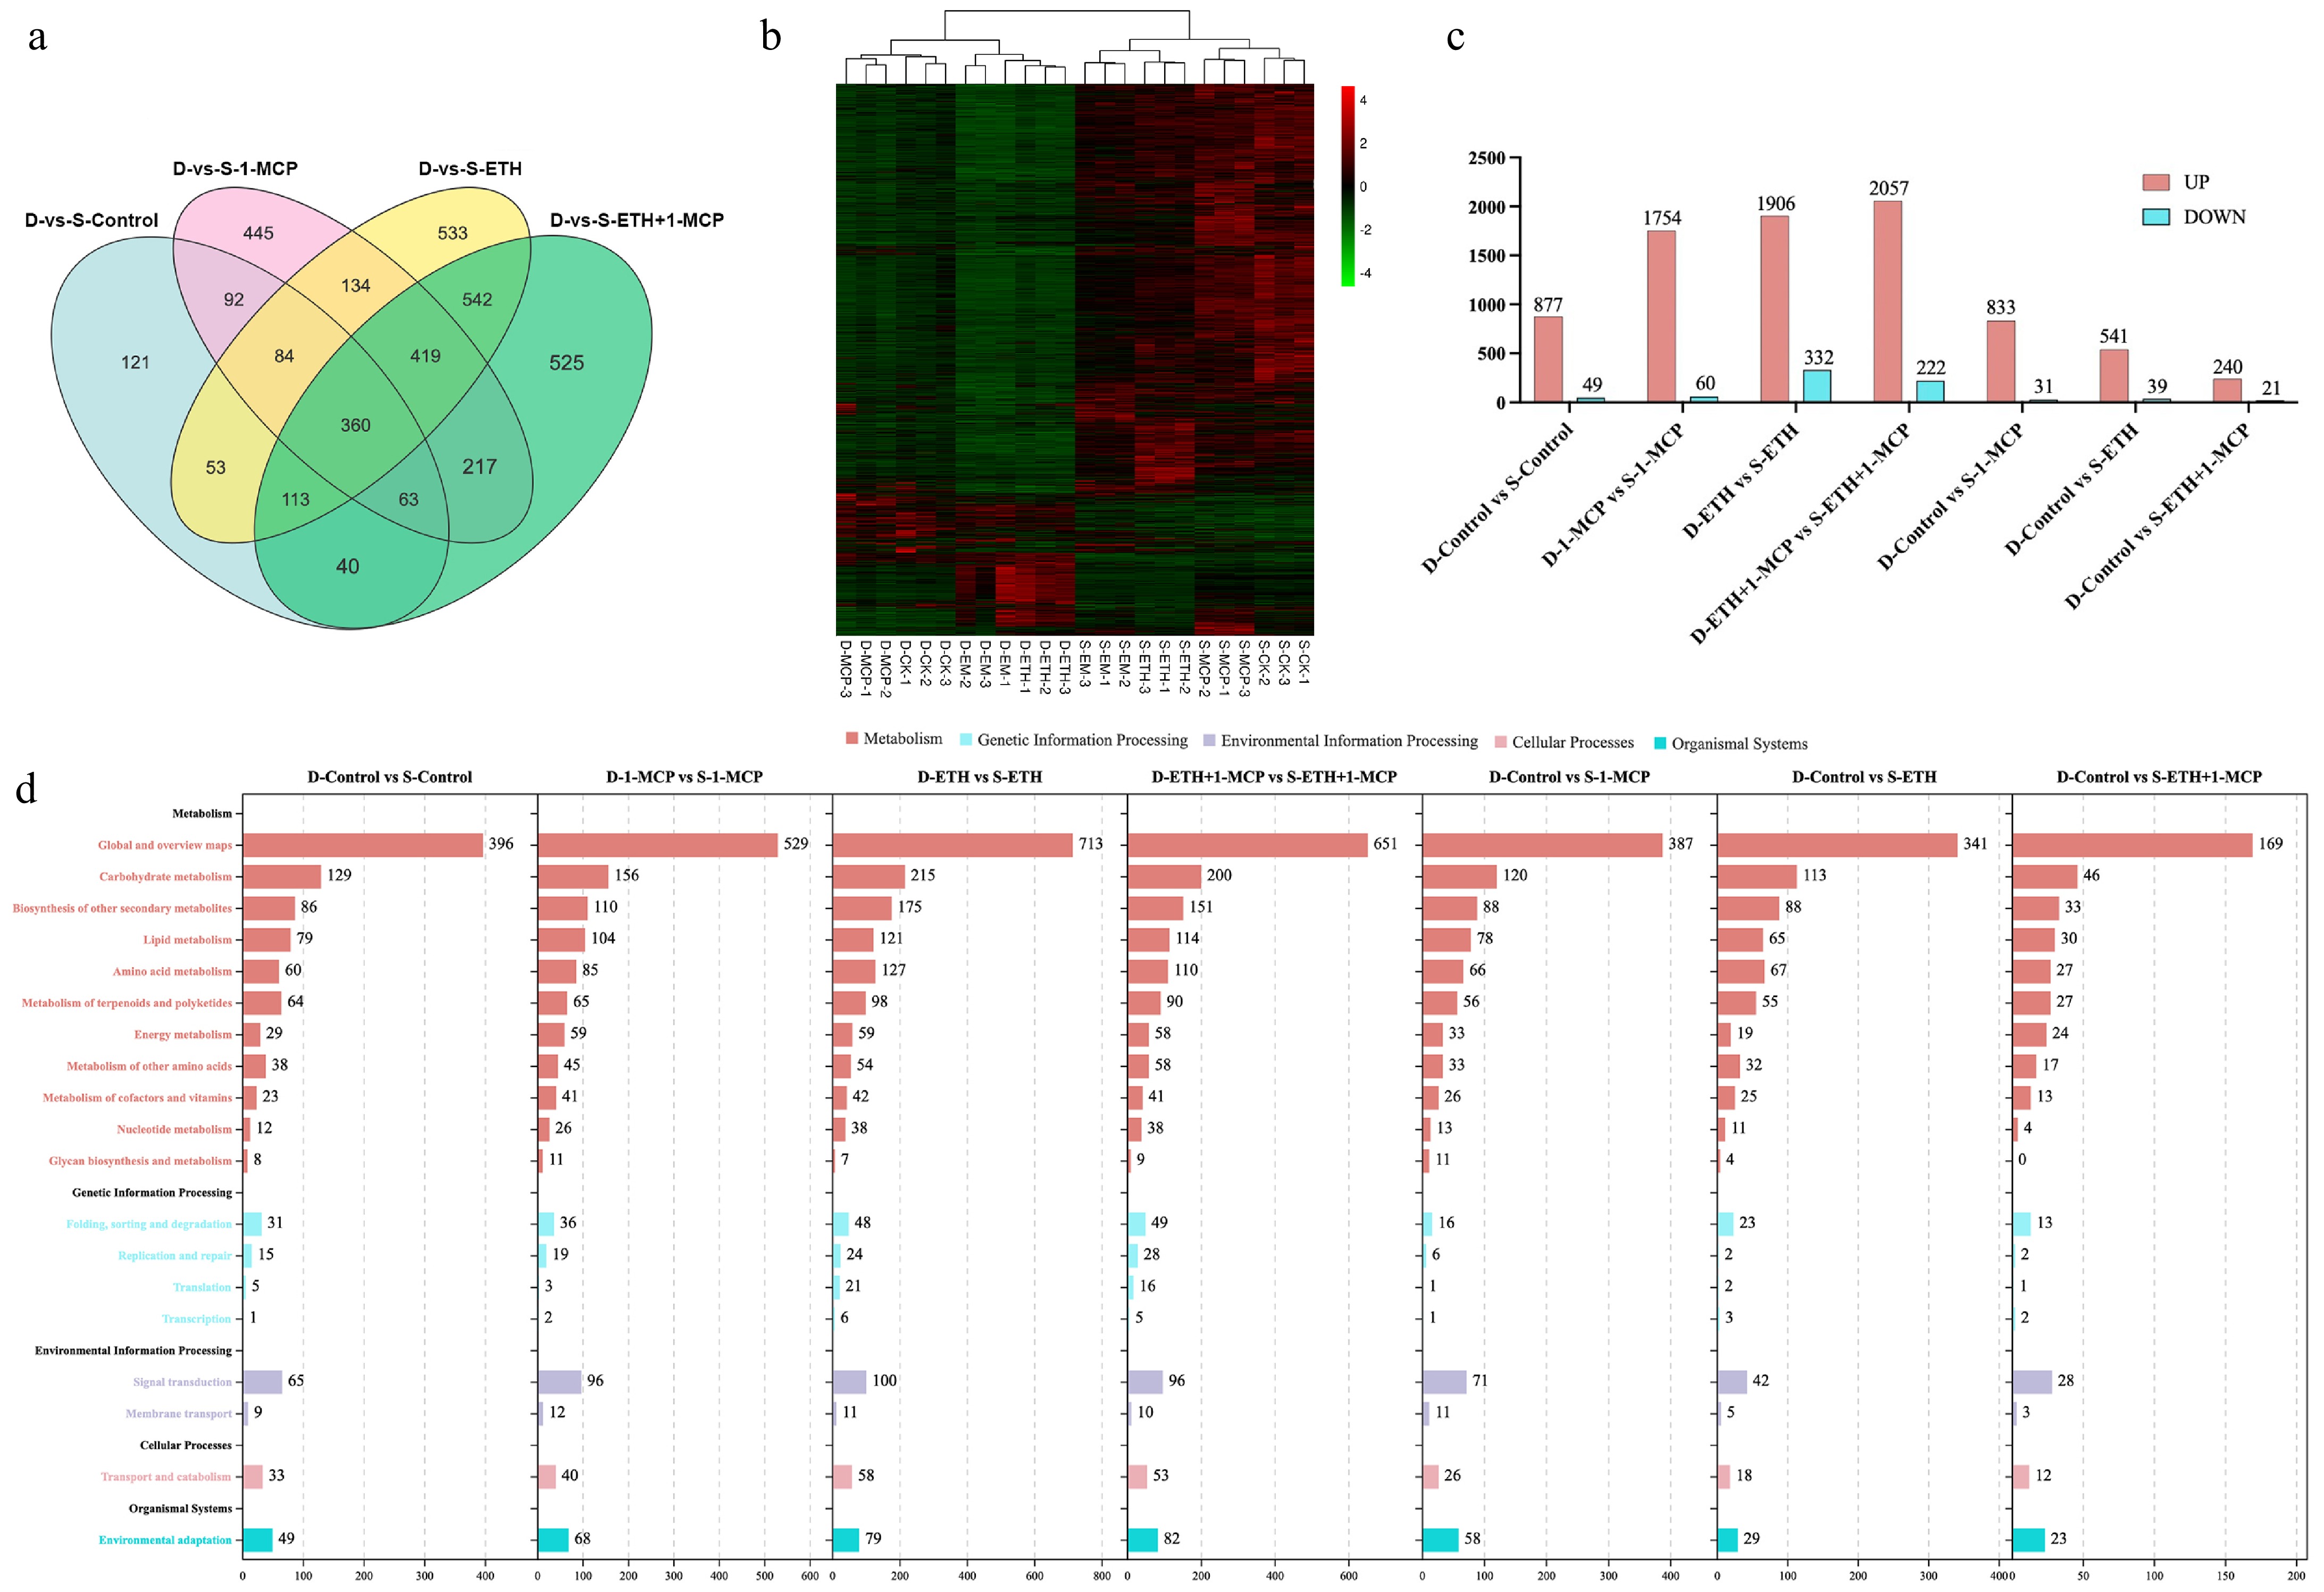
Figure 3.
Transcriptome analysis of Kokei No.14 sweet potato roots at different postharvest stages. (a) Venn diagram for gene expression analysis under different treatments of roots, (b) heat map of the DEGs during root storage, (c) numbers of DEGs in the pair-wise comparisons, (d) KEGG pathway analysis of clustered DEGs in 19 categories. The X-axis indicates the number of DEGs, and the Y-axis indicates KEGG classification.
-
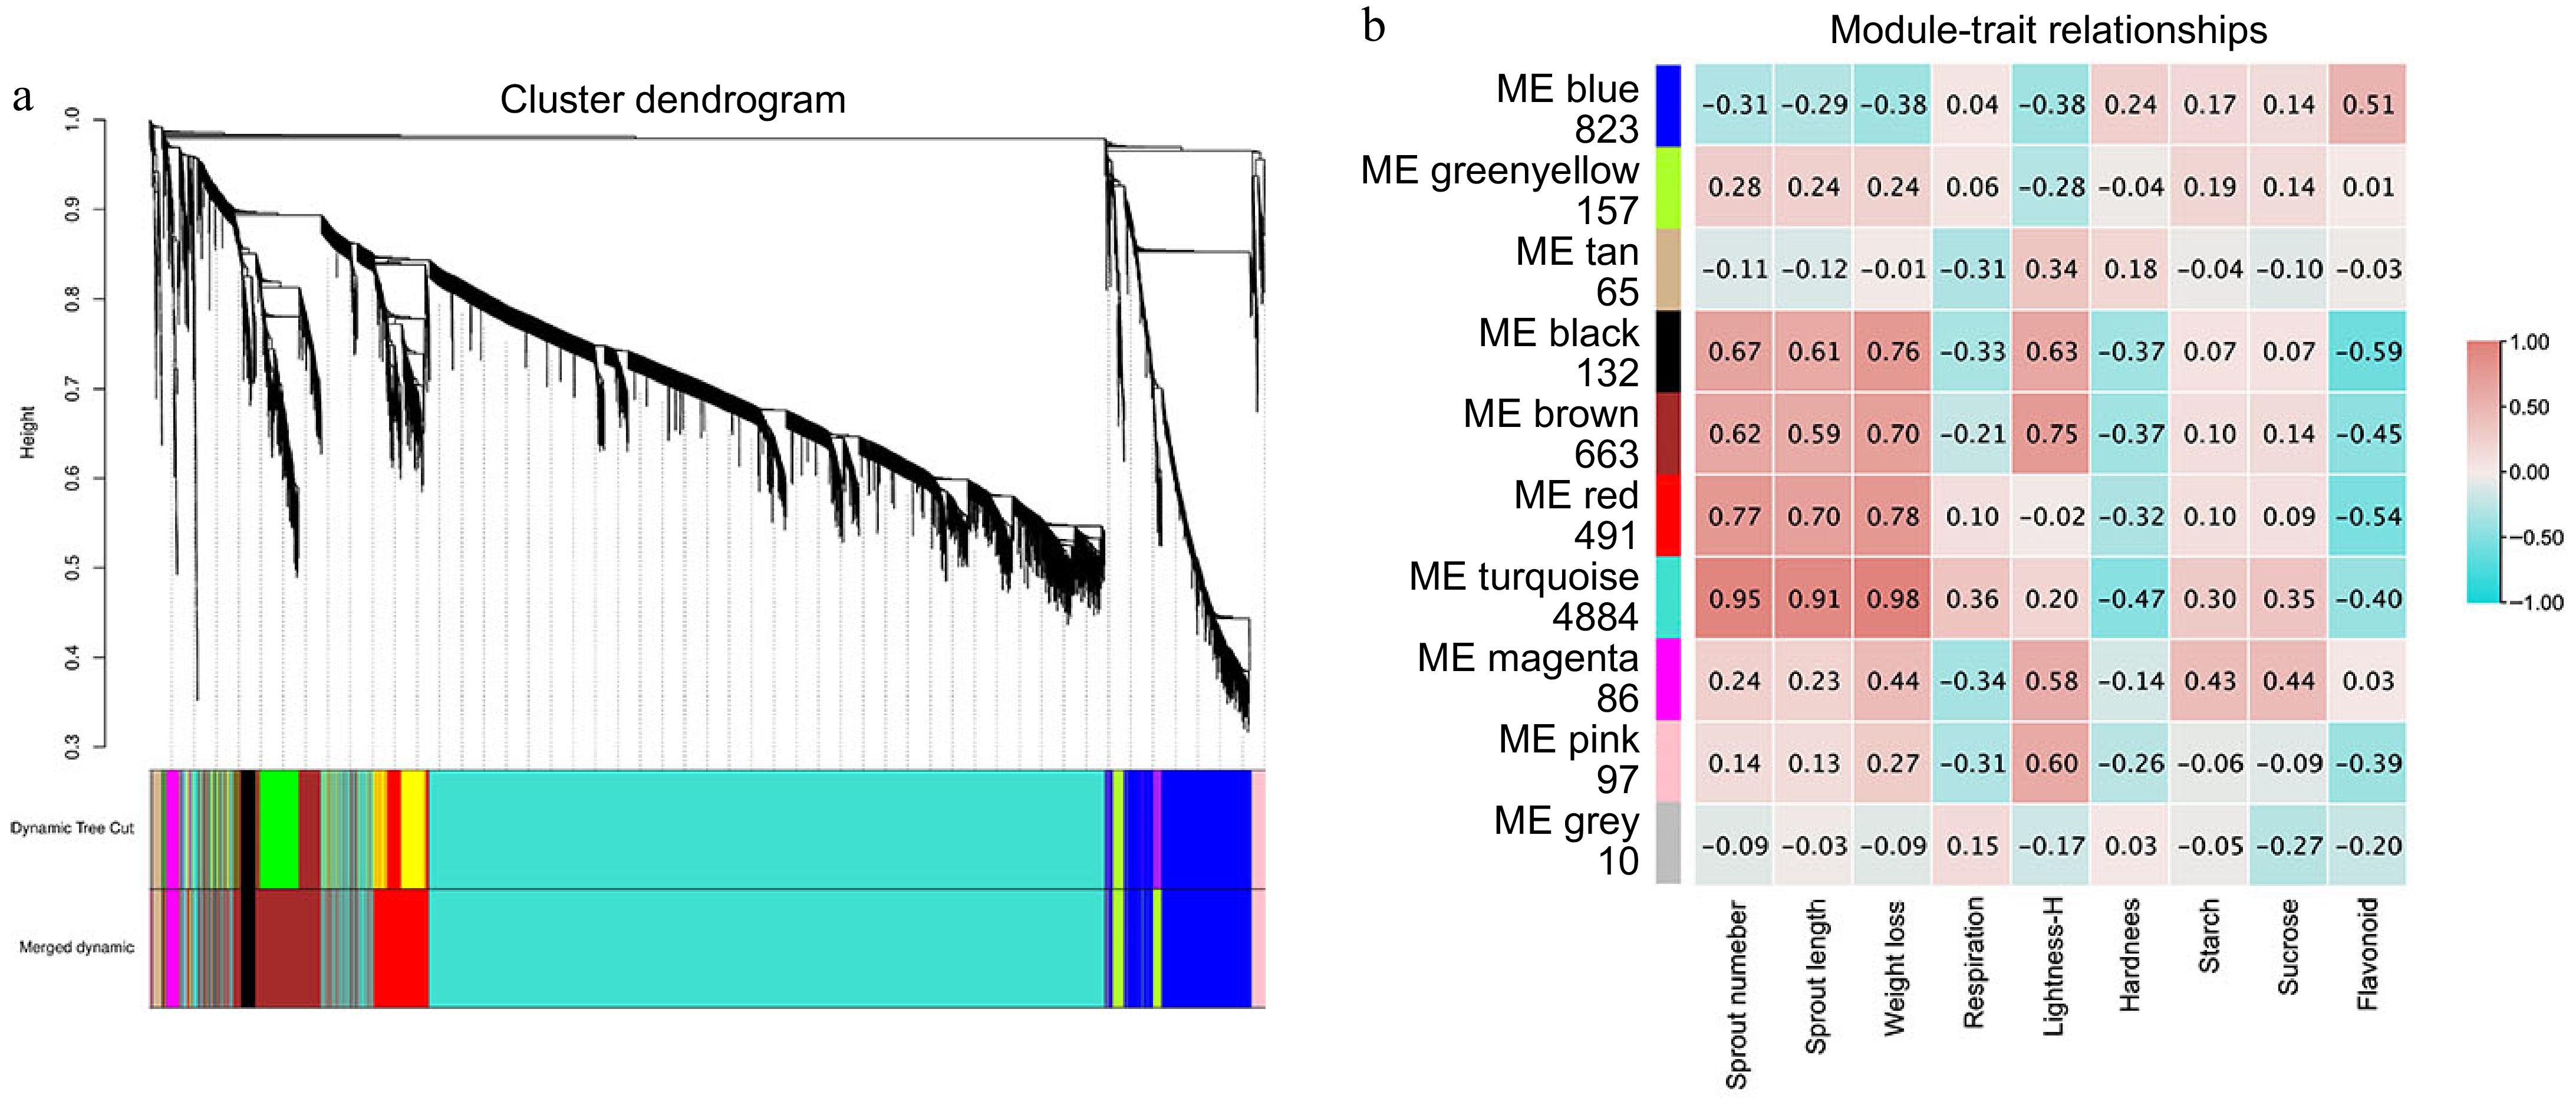
Figure 4.
Analysis of WGCNA during storage in Kokei No.14 sweet potato roots. (a) Clustering dendrogram of 7408 DEGs, the color rows provide a simple visual comparison of module assignments based on the dynamic hybrid branch cutting method, (b) number of genes contained in each module, and the correlation coefficient between phenotypic traits and module eigengenes presented with a color scale with red and blue representing positive and negative correlations, respectively.
-
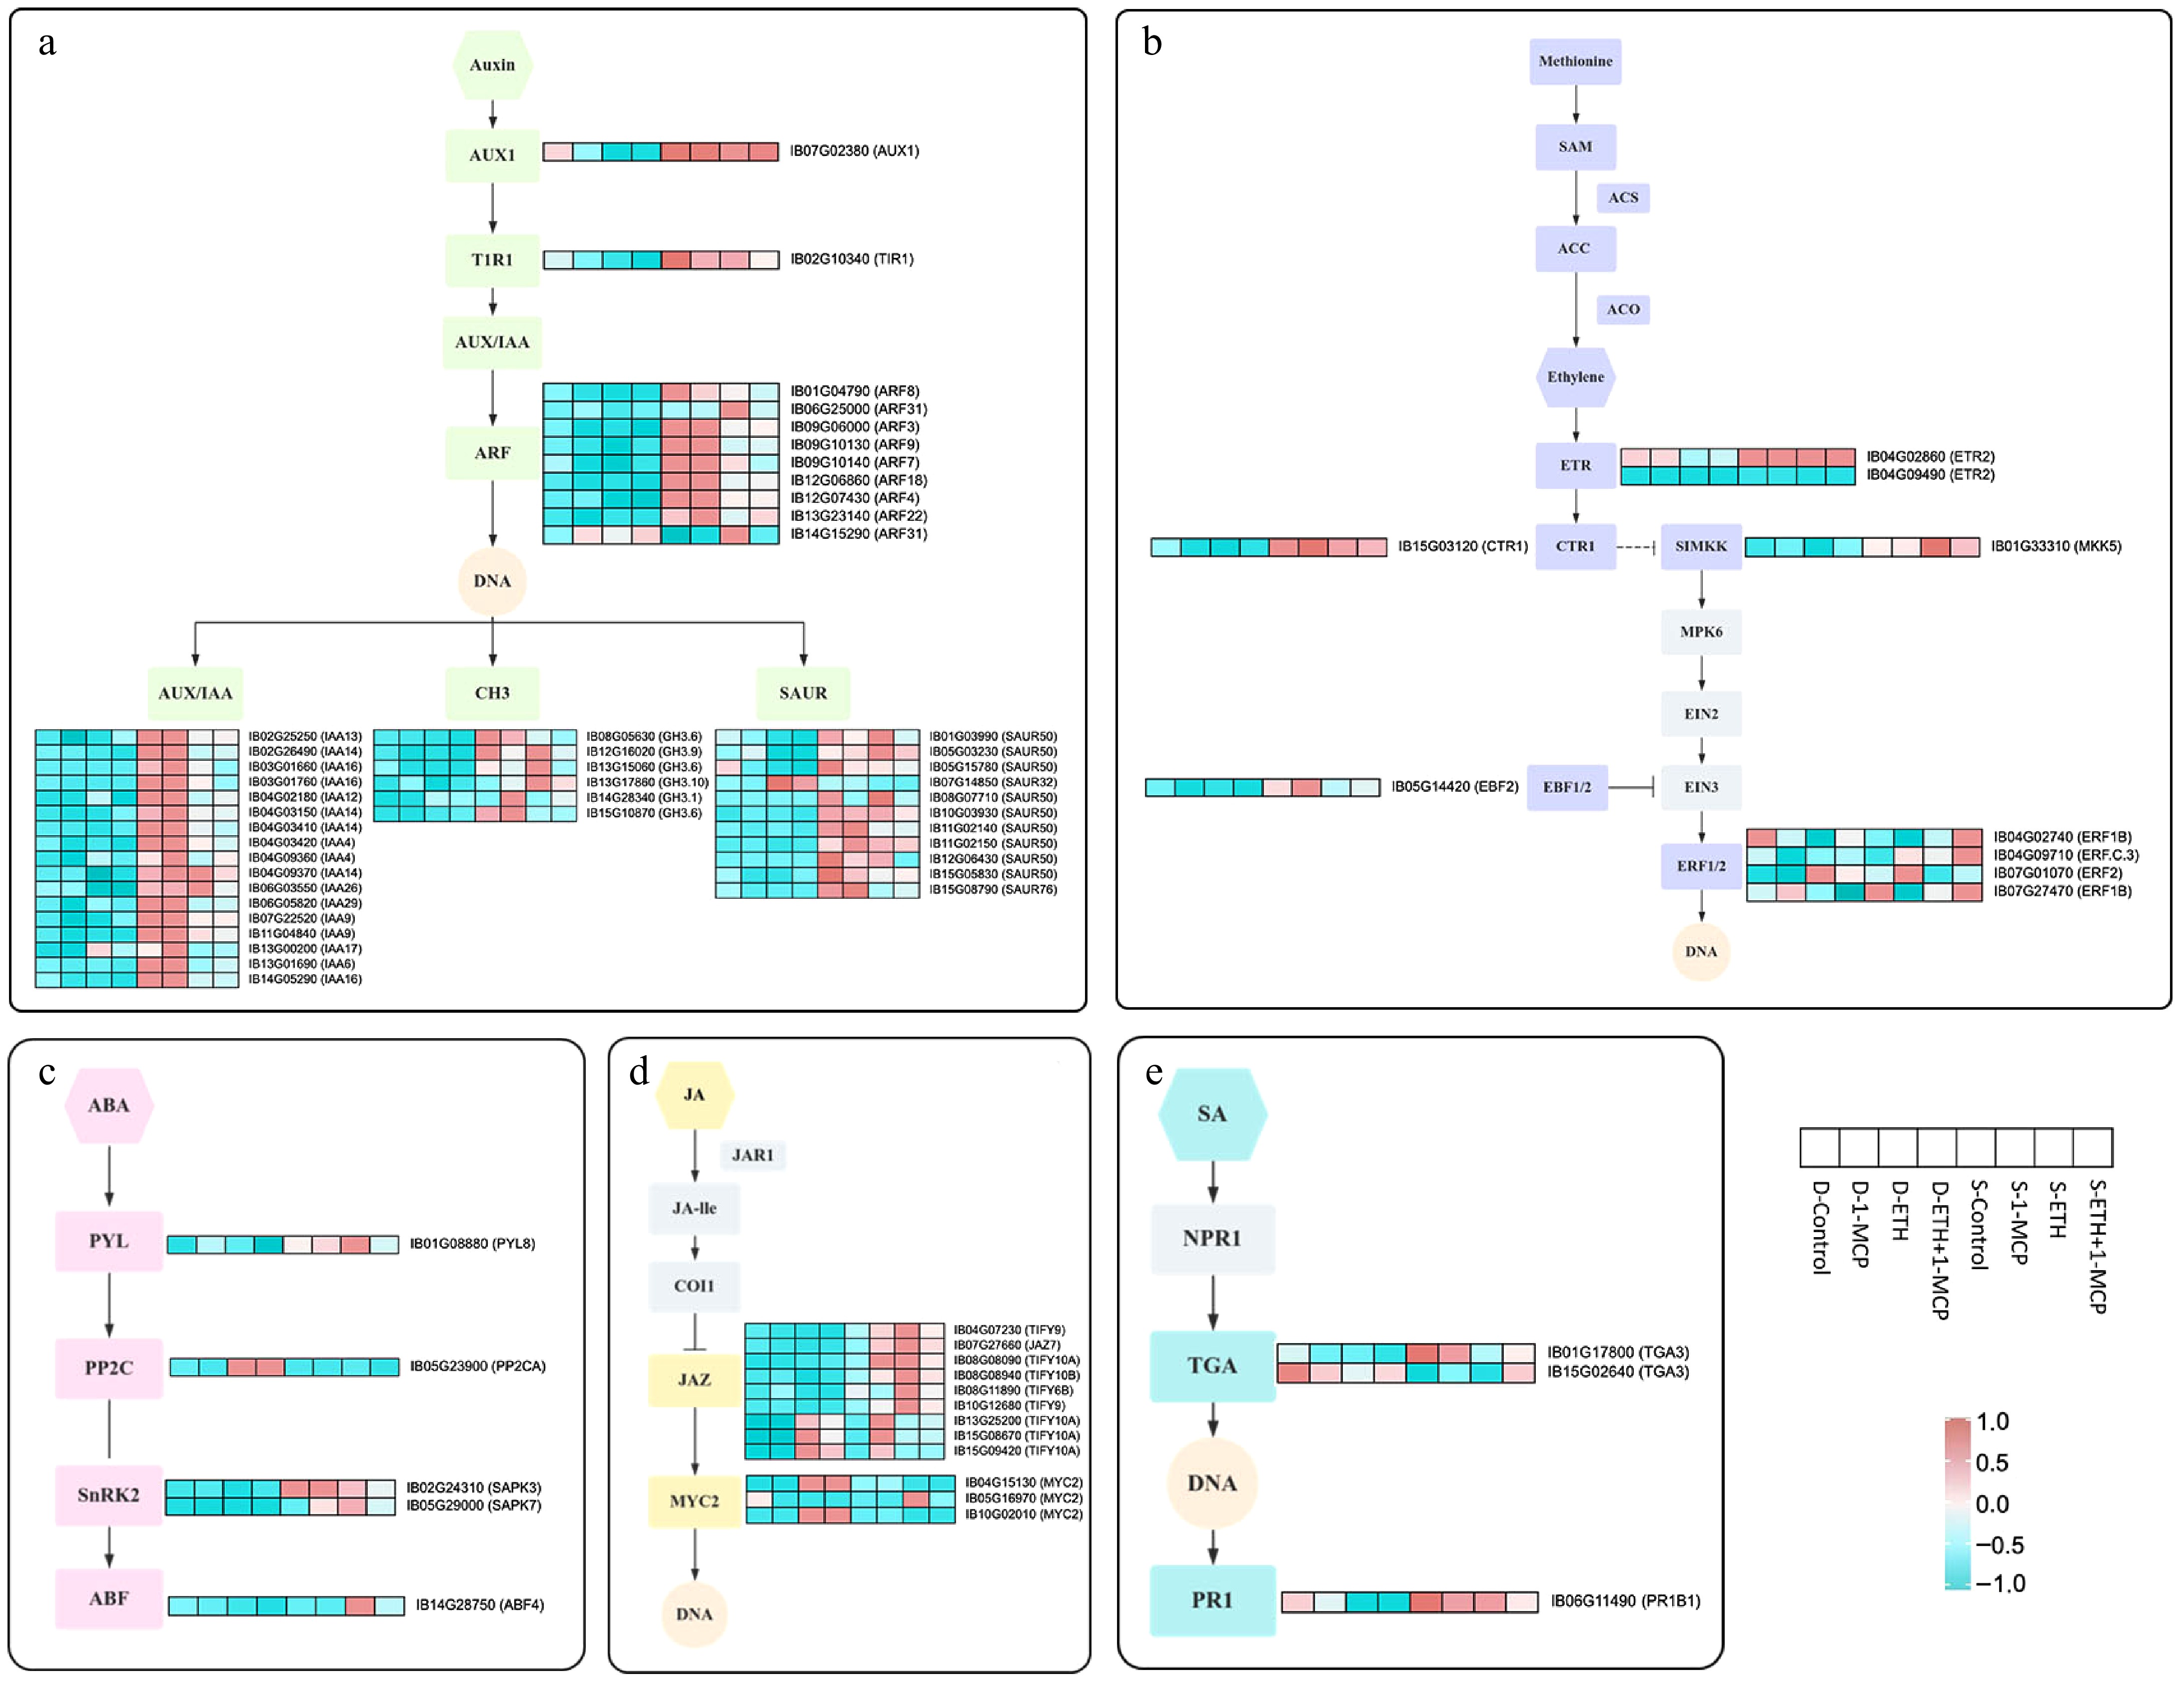
Figure 5.
Expression profiles of DEGs associated with different plant hormones signal transduction, including (a) Auxin, (b) Ethylene, (c) Abscisic acid (ABA), (d) Jasmonic acid (JA), and (e) Salicylic Acid (SA). Rows in the heat map represent screened DEGs, and the columns indicate different samples (D-Control, D-1-MCP, D-ETH, D-ETH + 1-MCP, S-Control, S-1-MCP, S-ETH, and S-ETH + 1-MCP). The color gradient, ranging from blue through white to red, represents low, middle, and high values of the FPKM value. The denser the red color, the more expression is up-regulated, while the denser the blue color, the more expression is down-regulated.
-
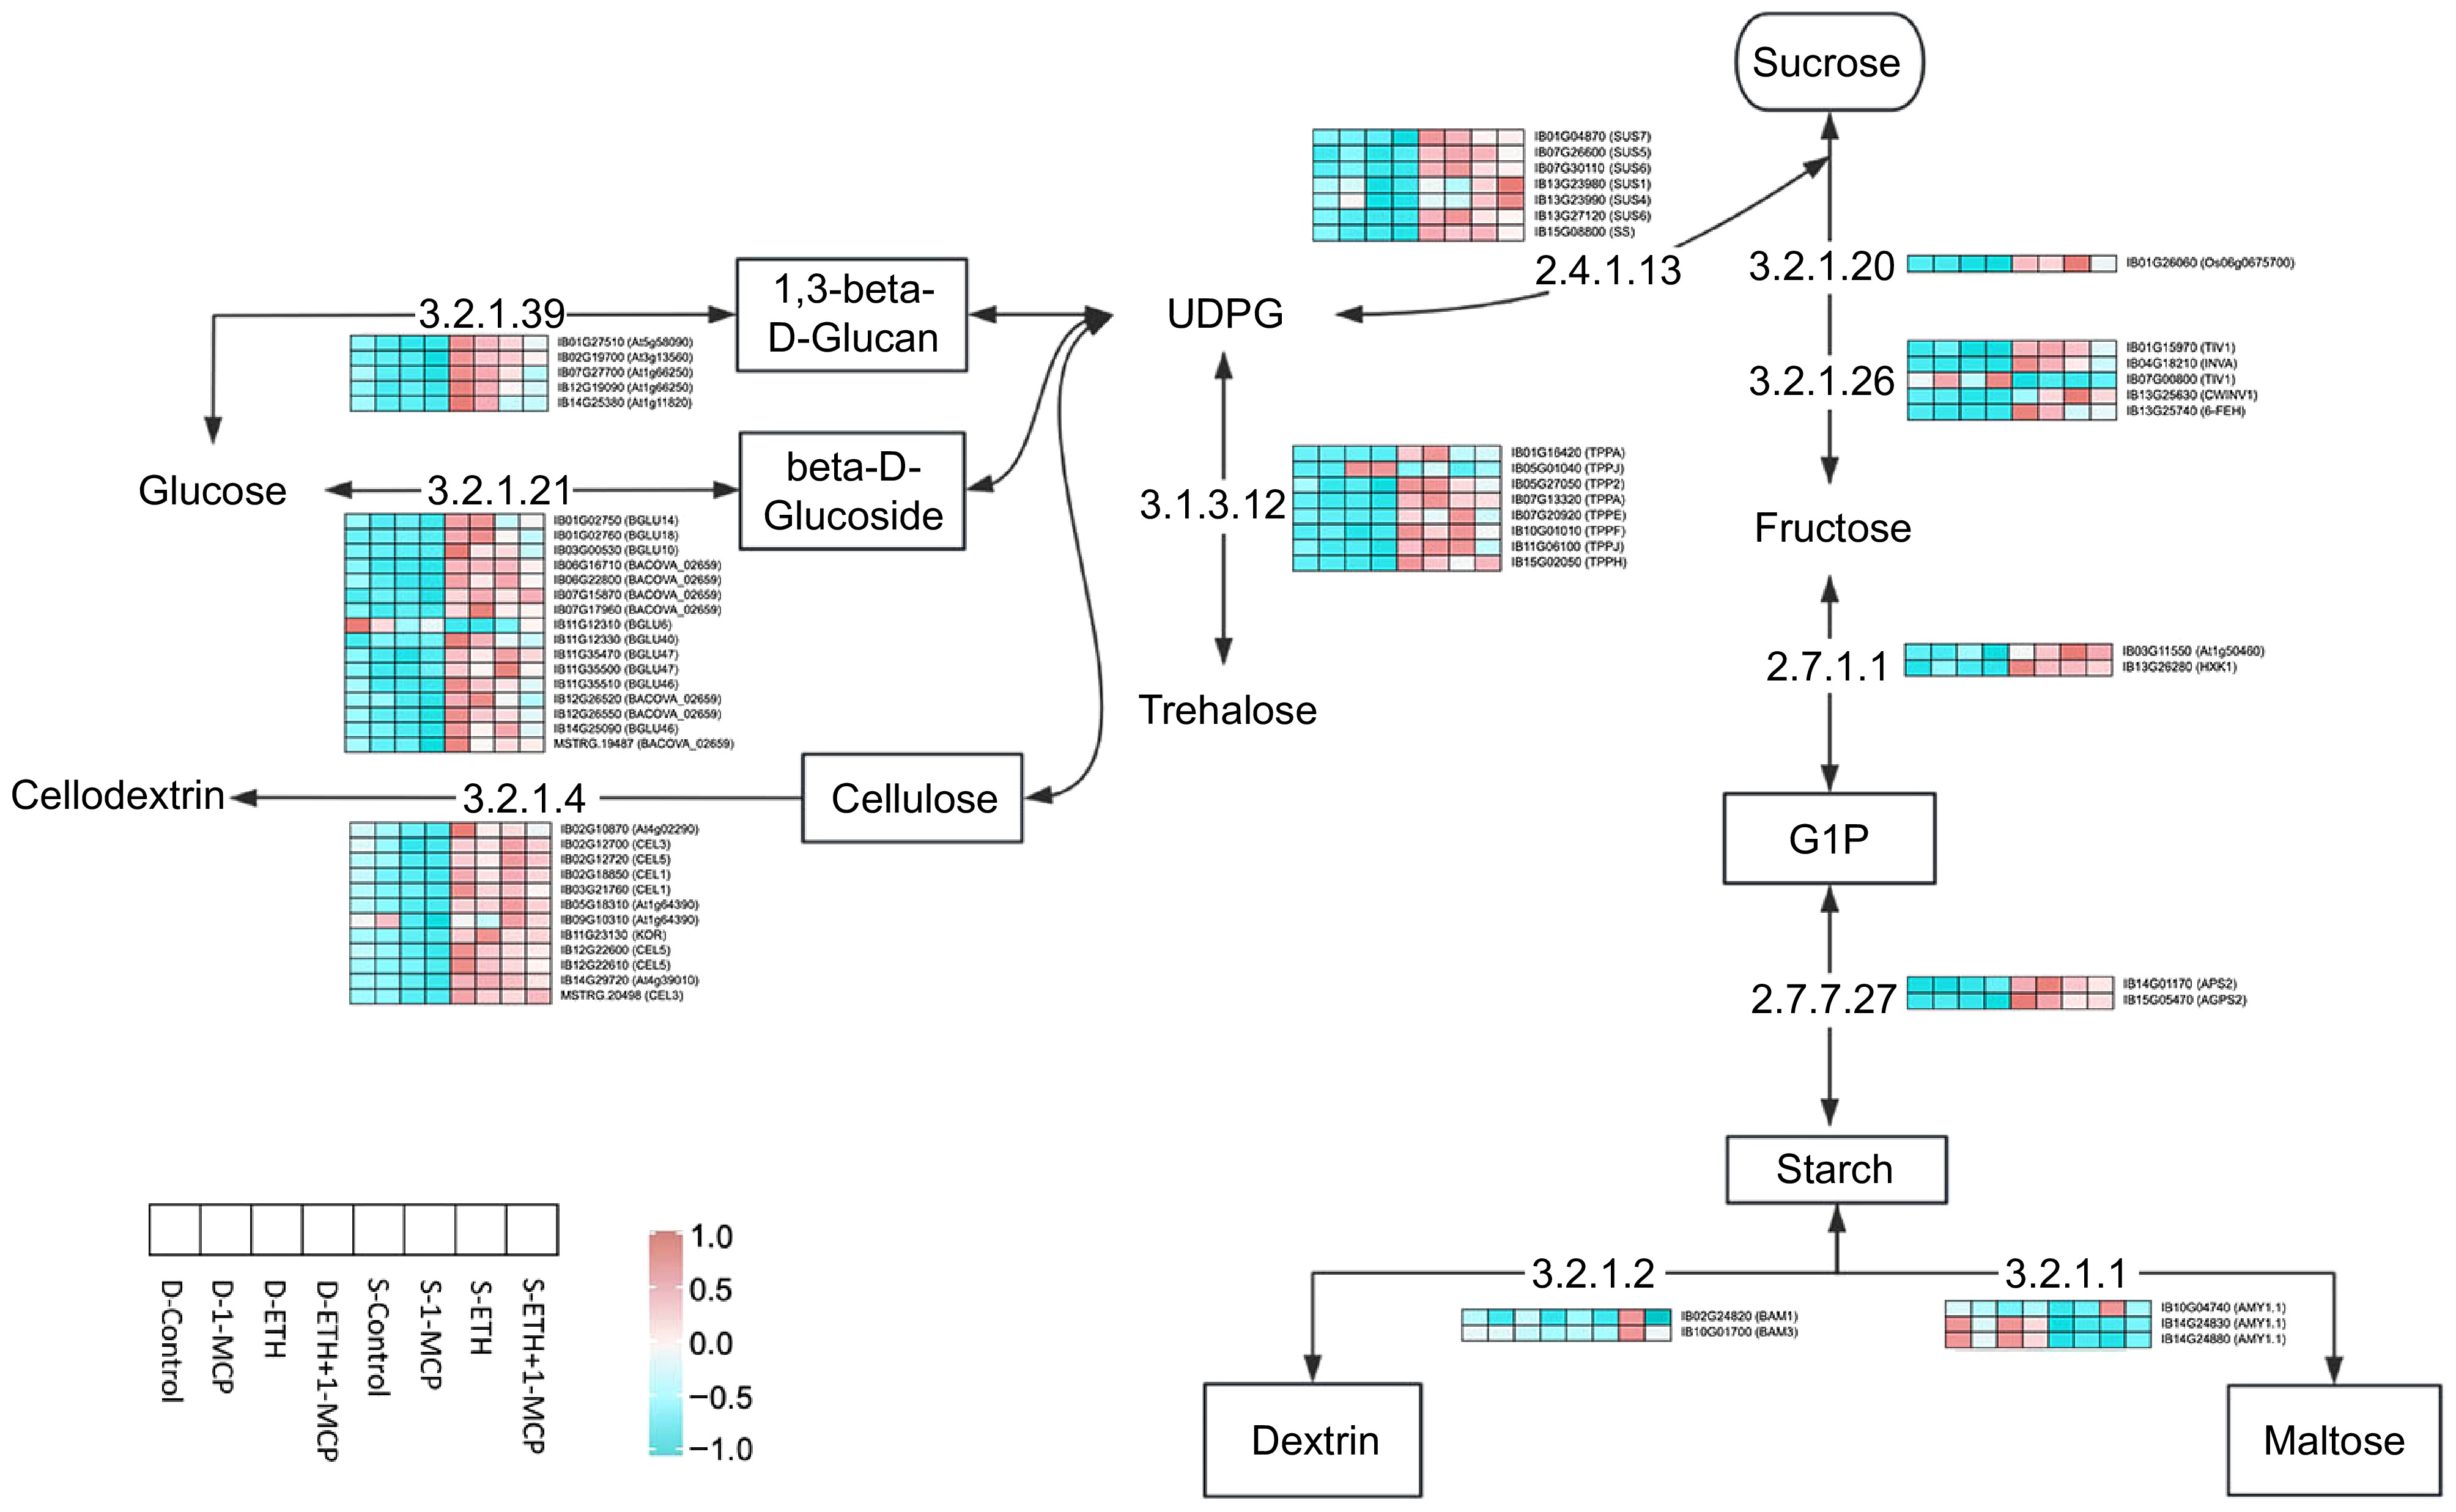
Figure 6.
Heat map of the expression levels of DEGs involved in starch and sucrose metabolism.
-
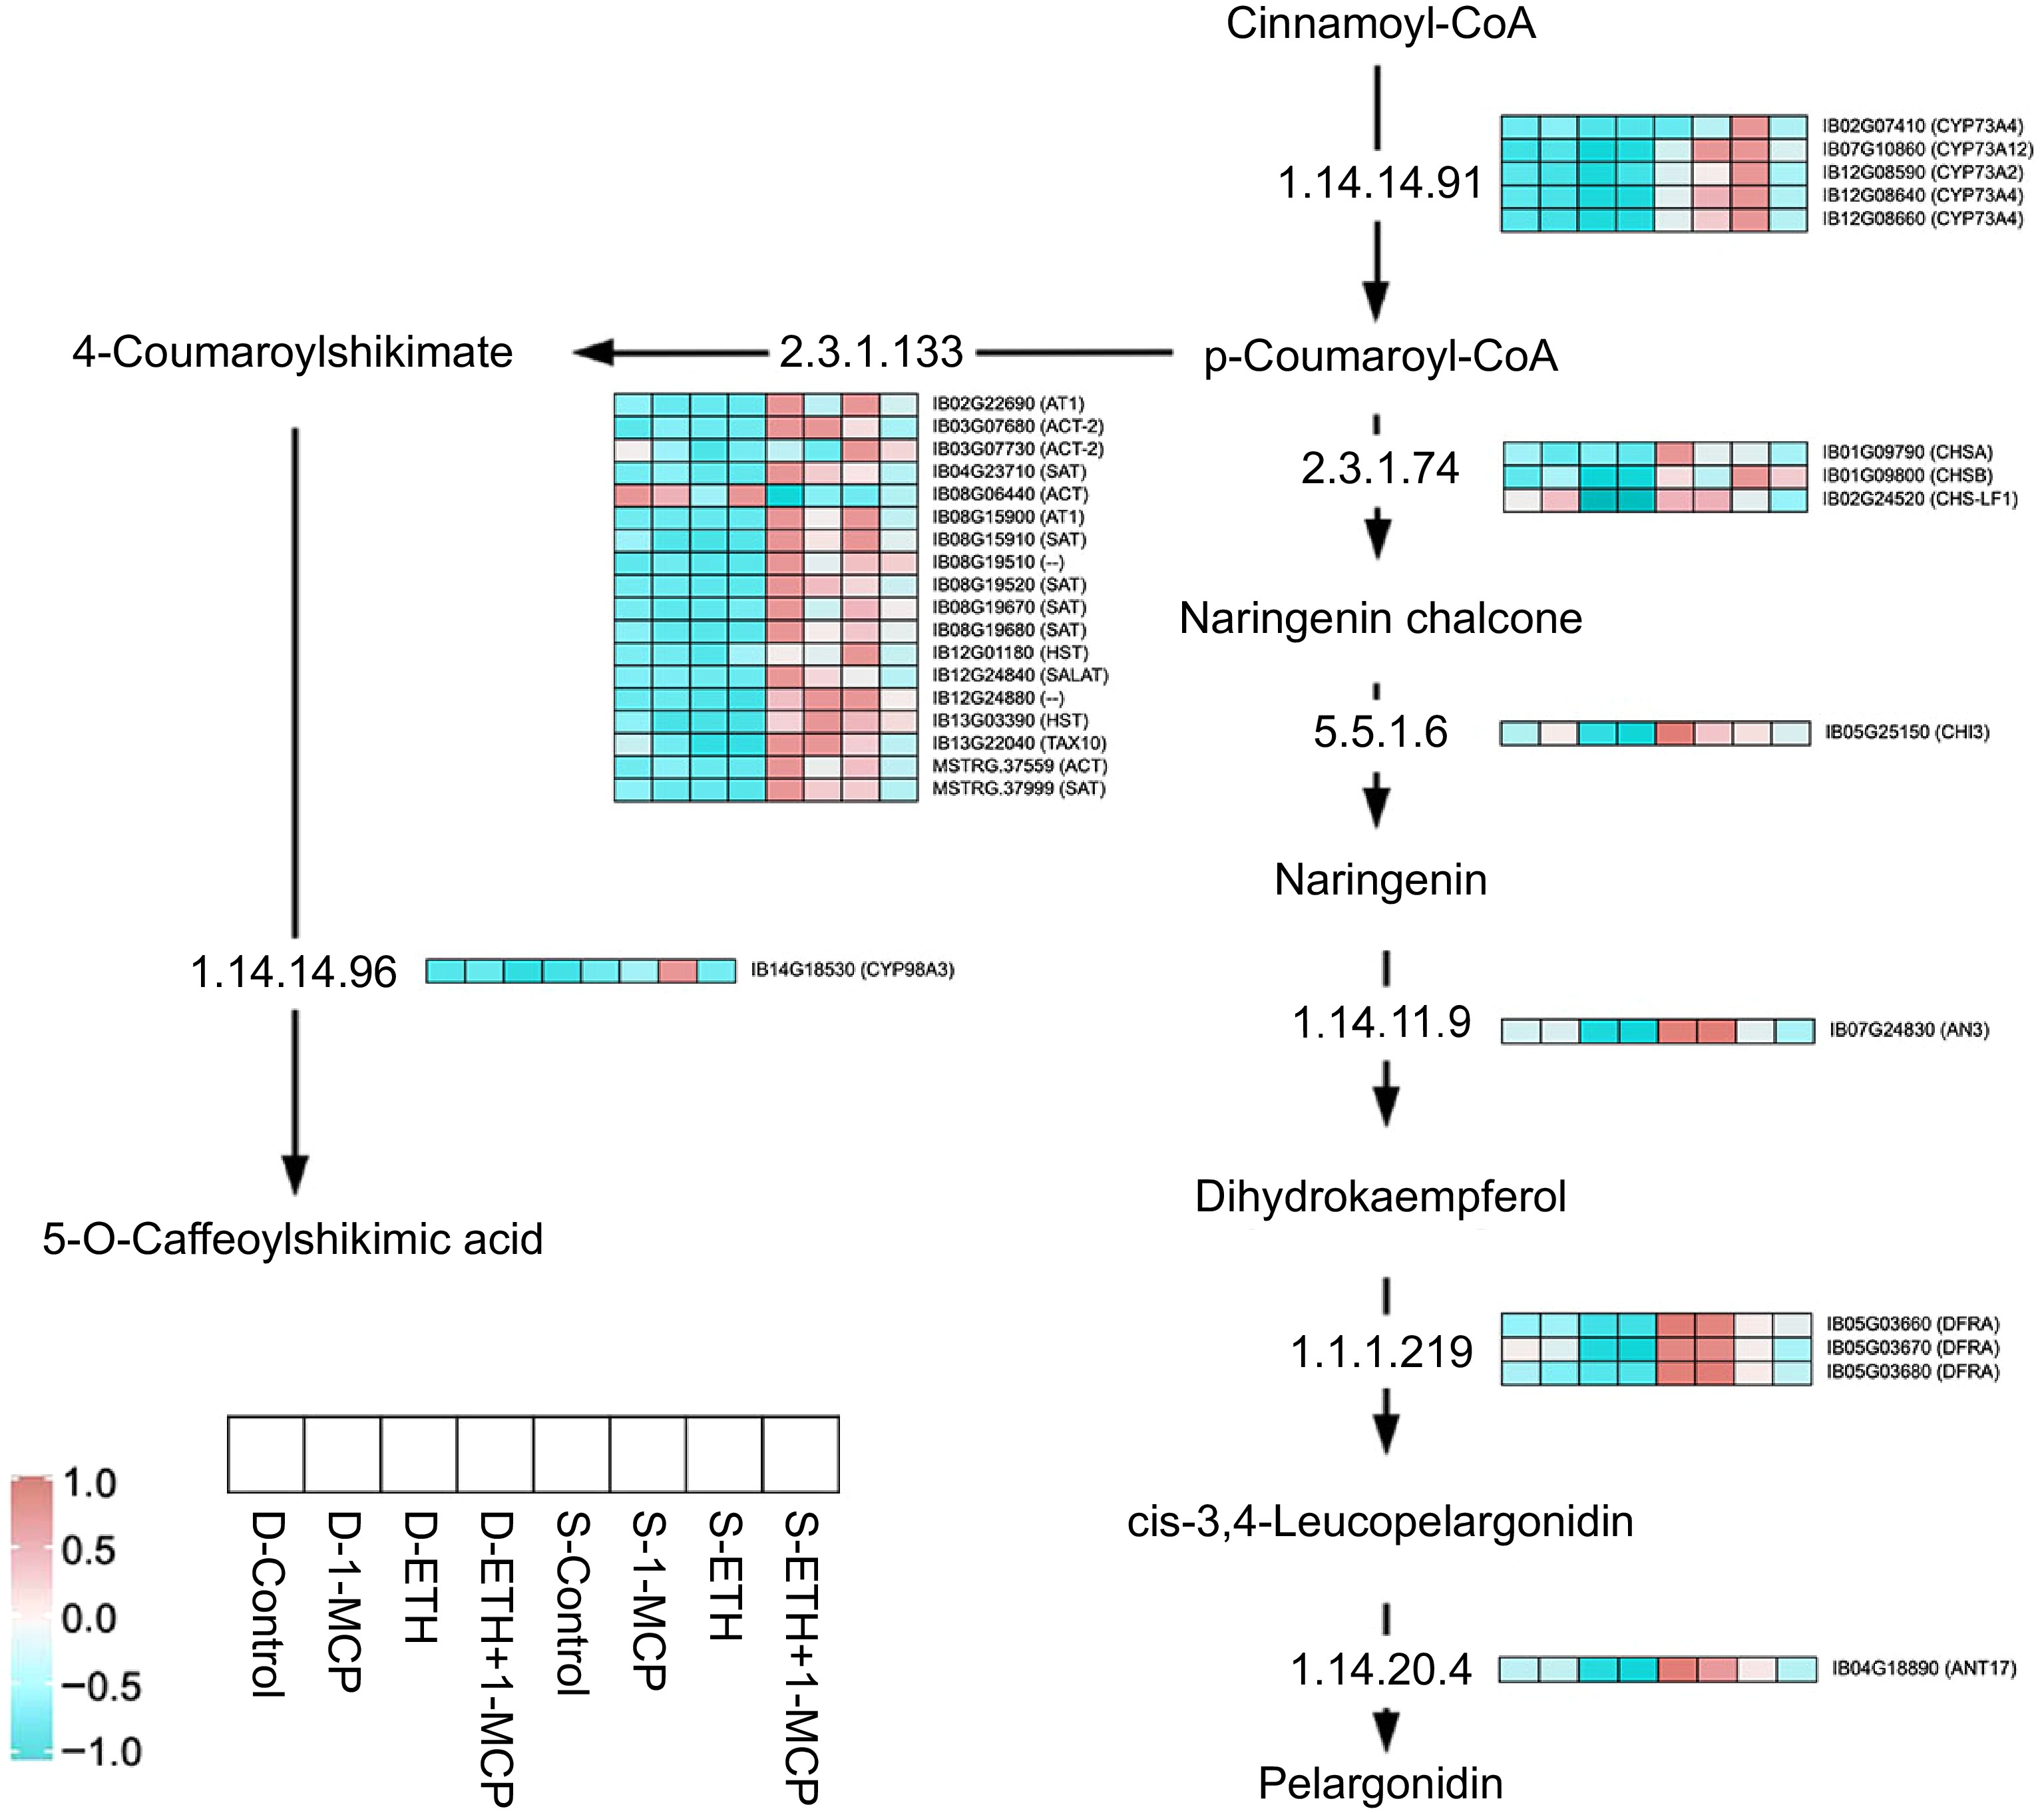
Figure 7.
Heat map of the expression levels of DEGs involved in flavonoid metabolism.
-
Storage
time (d)Treatment Hardness (N) Adhesive force (N) Adhesiveness (mJ) Cohesiveness (ratio) Springiness (mm) Gumminess (N) Chewiness (mj) 1 Control 27.22 ± 1.82a −0.07 ± 0.00a 0.0069 ± 0.0014a 0.83 ± 0.03a 1.03 ± 0.08b 53.32 ± 4.16a 54.94 ± 5.45b 1-MCP 27.93 ± 1.62a −0.07 ± 0.00a 0.0077 ± 0.0010a 0.79 ± 0.03b 1.23 ± 0.09a 67.97 ± 23.09a 84.22 ± 31.72ab ETH 28.27 ± 2.99a −0.06 ± 0.02a 0.0080 ± 0.0024a 0.79 ± 0.01b 1.28 ± 0.04a 82.04 ± 17.13a 105.25 ± 24.26a ETH + 1-MCP 28.91 ± 2.11a −0.06 ± 0.04a 0.0107 ± 0.0035a 0.81 ± 0.01ab 1.18 ± 0.11ab 62.52 ± 12.21a 73.39 ± 12.34ab 6 Control 26.54 ± 2.02b −0.09 ± 0.09a 0.0088 ± 0.0077a 0.81 ± 0.02a 1.34 ± 0.12a 53.32 ± 4.16a 148.32 ± 50.76a 1-MCP 27.17 ± 1.8ab −0.04 ± 0.00a 0.0046 ± 0.0006a 0.78 ± 0.01a 1.24 ± 0.09a 67.97 ± 23.09a 77.16 ± 41.13a ETH 27.65 ± 0.62ab −0.04 ± 0.00a 0.0035 ± 0.0007a 0.79 ± 0.03a 1.30 ± 0.15a 82.04 ± 17.13a 108.27 ± 68.39a ETH + 1-MCP 28.62 ± 1.31a −0.06 ± 0.04a 0.0059 ± 0.0003a 0.82 ± 0.05a 1.47 ± 0.11a 62.52 ± 12.21a 165.92 ± 38.11a 12 Control 25.98 ± 0.81b 0.00 ± 0.00a 0.0123 ± 0.0045a 0.81 ± 0.05a 1.35 ± 0.14a 140.36 ± 11.22a 189.82 ± 35.18a 1-MCP 26.76 ± 2.71ab −0.01 ± 0.02a 0.0117 ± 0.0018a 0.79 ± 0.02a 1.23 ± 0.01a 106.15 ± 25.54a 129.95 ± 31.61a ETH 27.27 ± 1.18ab −0.01 ± 0.02a 0.0102 ± 0.0004a 0.79 ± 0.03a 1.20 ± 0.12a 110.72 ± 19.78a 133.82 ± 31.3a ETH + 1-MCP 28.28 ± 1.30a −0.01 ± 0.02a 0.0100 ± 0.0008a 0.80 ± 0.06a 1.24 ± 0.01a 123.06 ± 32.03a 152.73 ± 40.26a 25 Control 25.19 ± 1.80b −0.06 ± 0.04a 0.0297 ± 0.0418a 0.78 ± 0.08a 1.32 ± 0.08a 76.17 ± 14.36a 101.02 ± 24.77a 1-MCP 26.13 ± 1.54ab −0.03 ± 0.02a 0.0046 ± 0.0024a 0.81 ± 0.04a 1.35 ± 0.16a 109.22 ± 24.33a 150.09 ± 46.56a ETH 26.89 ± 1.97ab −0.05 ± 0.02a 0.0115 ± 0.0134a 0.78 ± 0.01a 1.08 ± 0.07a 75.02 ± 4.09a 81.18 ± 3.73a ETH + 1-MCP 27.66 ± 1.43a −0.05 ± 0.02a 0.0054 ± 0.0014a 0.78 ± 0.06a 0.90 ± 0.56a 95.51 ± 42.86a 122.65 ± 64.82a 27 Control 24.47 ± 1.79b −0.03 ± 0.02a 0.0070 ± 0.0026a 0.80 ± 0.02a 1.27 ± 0.20a 123.59 ± 33.62a 146.21 ± 41.82a 1-MCP 25.37 ± 3.95ab −0.01 ± 0.02a 0.0103 ± 0.0034a 0.77 ± 0.04a 1.23 ± 0.04ab 99.00 ± 15.43ab 121.72 ± 22.04ab ETH 25.59 ± 1.62ab −0.06 ± 0.04a 0.0048 ± 0.0022a 0.77 ± 0.03a 1.04 ± 0.08b 78.25 ± 20.68ab 82.20 ± 28.66b ETH + 1-MCP 27.13 ± 1.51a −0.04 ± 0.04a 0.0079 ± 0.0043a 0.74 ± 0.03a 1.02 ± 0.05b 74.23 ± 14.84b 76.19 ± 18.12b Means with the same letters in a column are not significantly different (p < 0.05) by Duncan's multiple range test. ± denotes standard deviation. Table 1.
Texture parameters of KoKei No.14 organic sweet potato roots affected by different treatments.
-
Storage
time(d)Treatment Average number
of sproutsAverage sprout
length (mm)1 Control 0.00 ± 0.00 0.00 ± 0.00 1-MCP 0.00 ± 0.00 0.00 ± 0.00 ETH 0.00 ± 0.00 0.00 ± 0.00 ETH + 1-MCP 0.00 ± 0.00 0.00 ± 0.00 6 Control 2.67 ± 0.58a 3.33 ± 1.47a 1-MCP 1.00 ± 0.00b 0.79 ± 0.69b ETH 0.00 ± 0.00c 0.00 ± 0.00b ETH + 1-MCP 0.00 ± 0.00c 0.00 ± 0.00b 12 Control 5.33 ± 0.58a 4.36 ± 1.87a 1-MCP 2.33 ± 0.58b 2.46 ± 0.53b ETH 0.33 ± 0.58c 0.65 ± 0.03c ETH + 1-MCP 0.00 ± 0.00c 0.00 ± 0.00c 25 Control 6.00 ± 0.00a 5.28 ± 1.83b 1-MCP 4.33 ± 1.15b 4.03 ± 0.80b ETH 1.67 ± 0.58c 1.86 ± 0.04c ETH + 1-MCP 0.67 ± 0.58c 0.40 ± 0.16c 27 Control 6.00 ± 0.00a 6.07 ± 1.58a 1-MCP 4.67 ± 1.15b 5.34 ± 0.95a ETH 2.00 ± 0.00c 2.73 ± 0.05b ETH + 1-MCP 1.00 ± 0.00c 1.08 ± 0.14b Means bearing the same superscript within the same column are not significantly different at the 5% level (p < 0.05). Table 2.
Average sprout number and average sprout length of Kokei No.14 organic sweet potato roots after 27 d (25 °C and 90% RH).
Figures
(7)
Tables
(2)