-
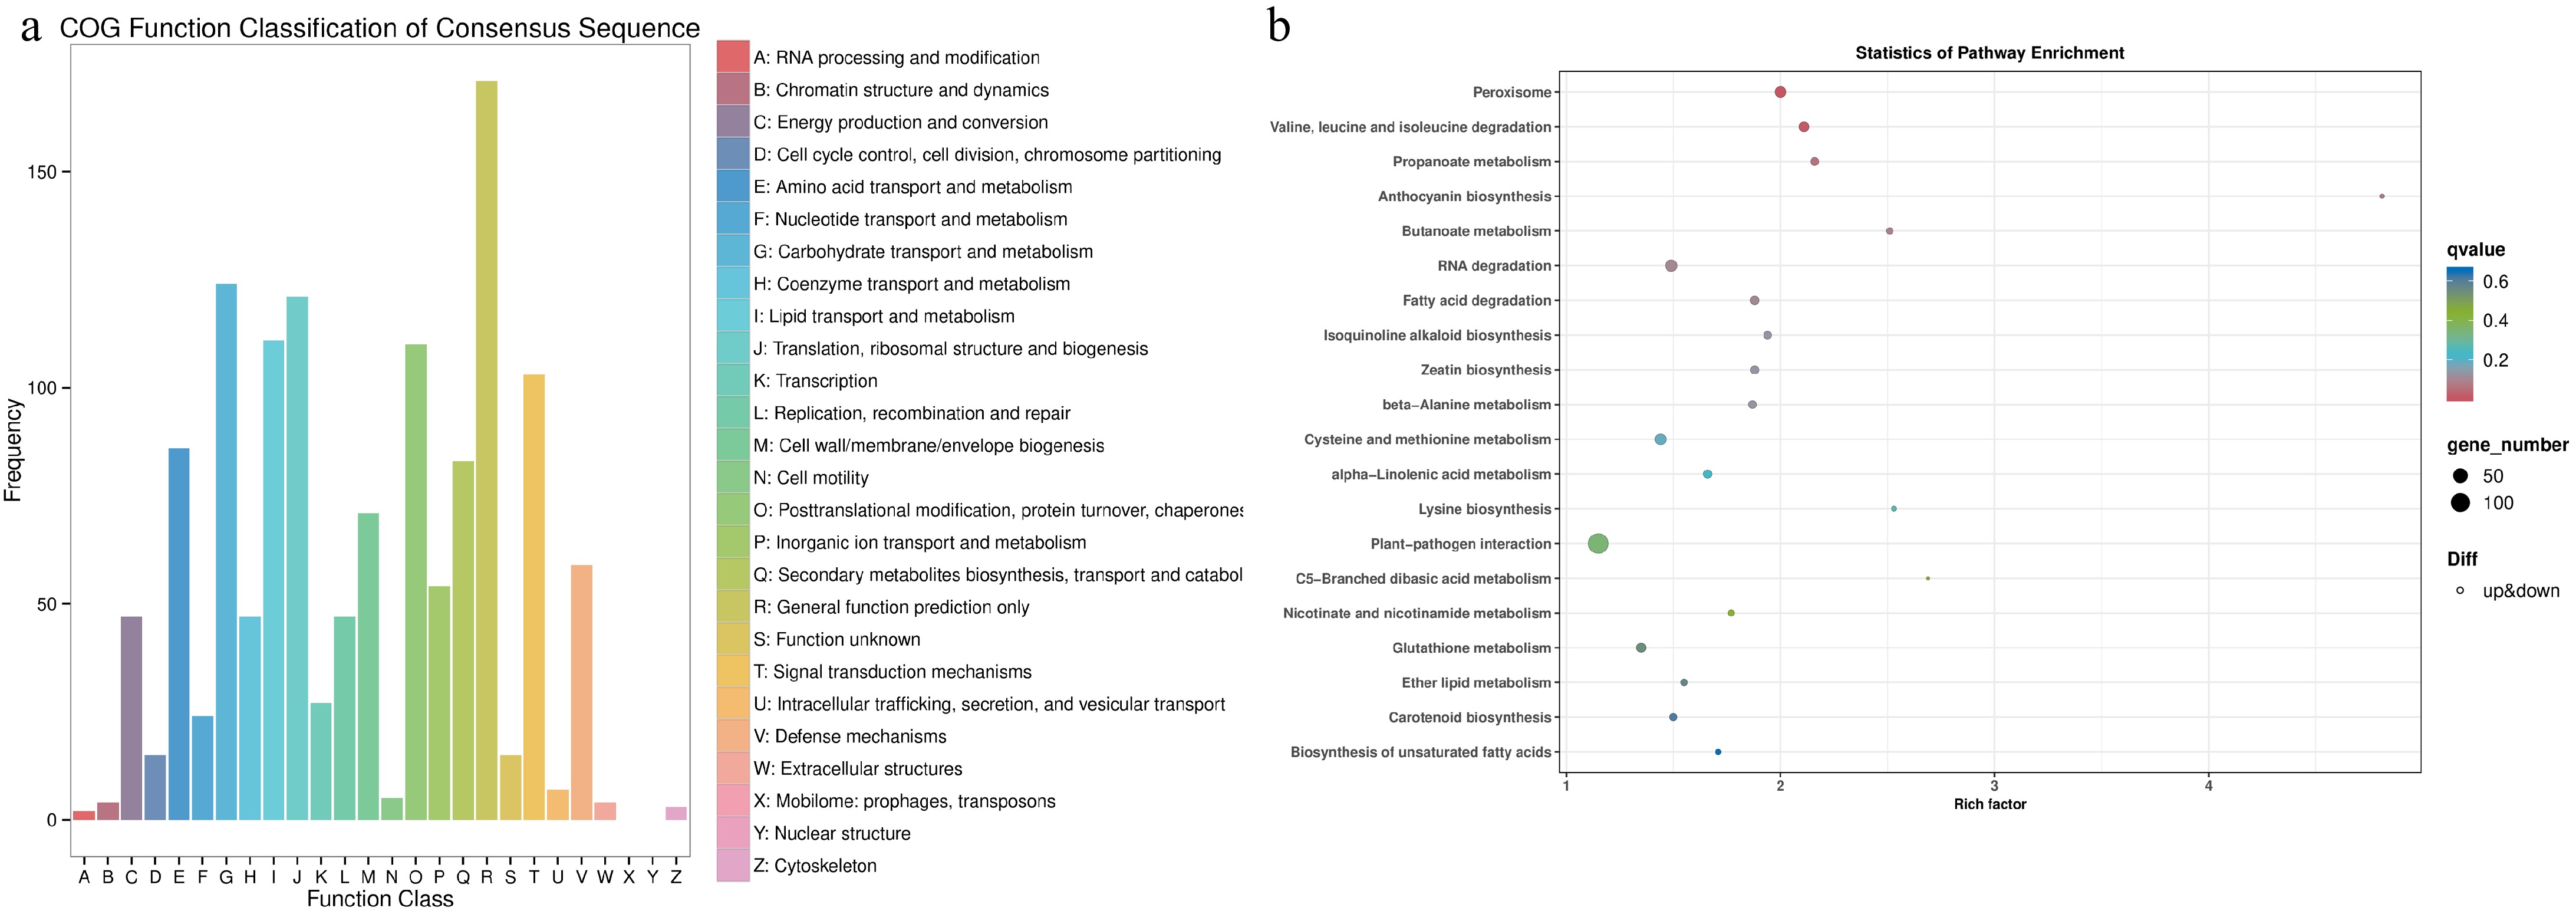
Figure 1.
Functional annotation of differentially expressed genes (DEGs) in tea plants grown in monoculture and intercropped with peas. (a) COG functional classification of DEGs. (b) Enrichment analysis of KEGG pathways for DEGs. A lower q-value signifies a higher degree of enrichment.
-
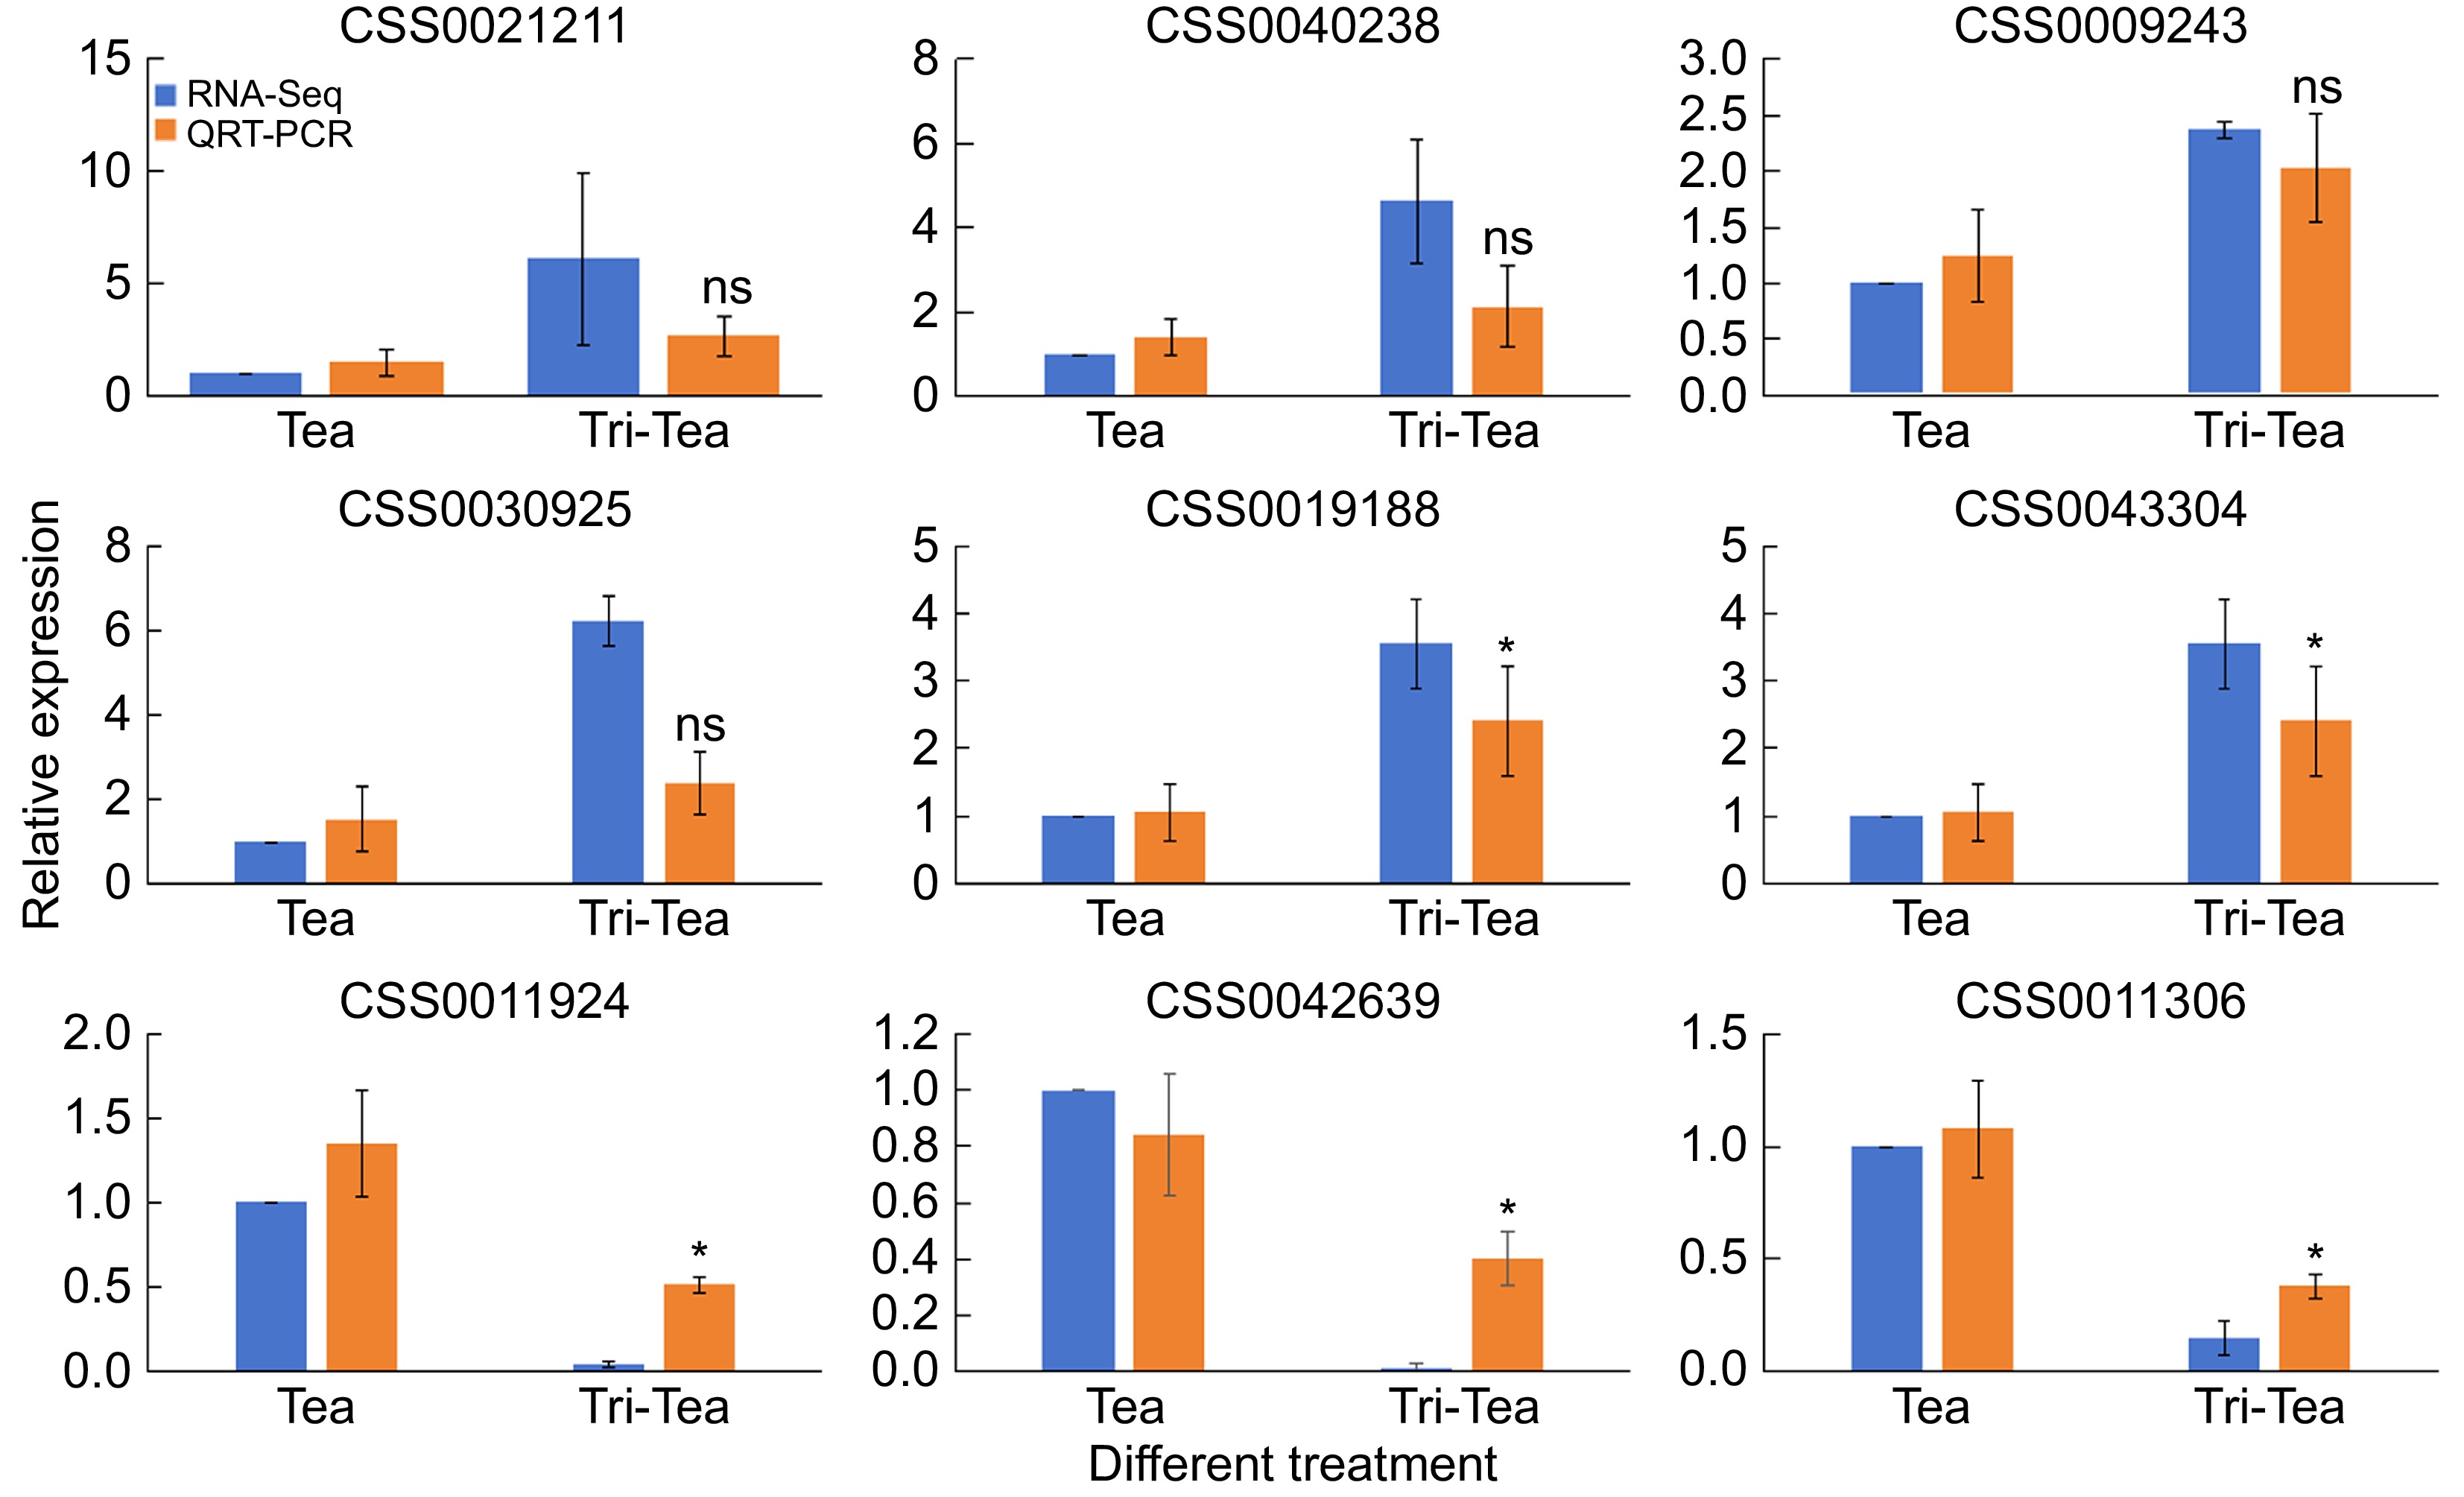
Figure 2.
Validation of differentially expressed genes through quantitative real-time PCR (qRT-PCR). RNA-Seq indicates changes in gene expression through fold changes in FPKM, while qRT-PCR validates these changes by calculating the relative expression levels of specific gene cDNAs using the 2−ΔΔCᴛ method. * Indicates significant difference, ns indicates non-significant difference.
-
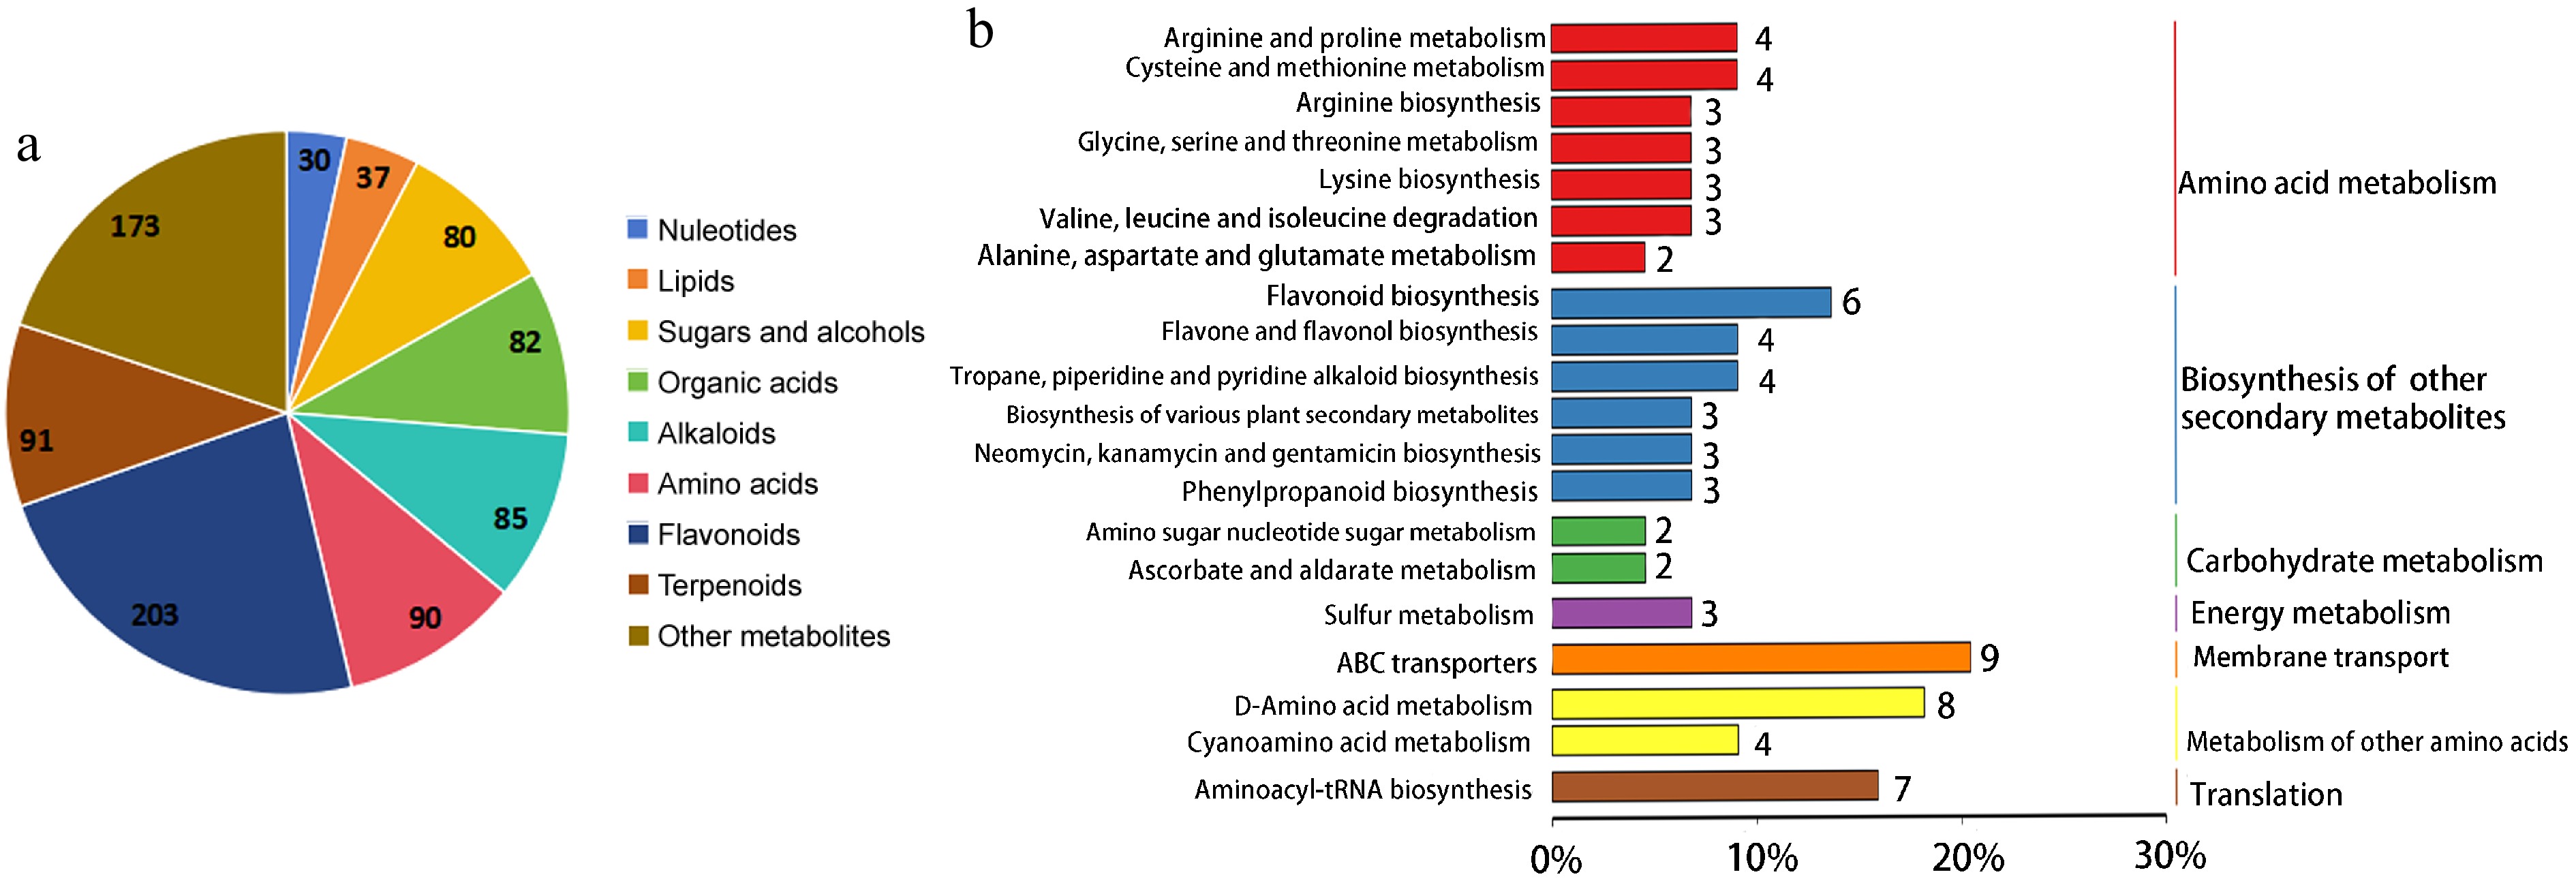
Figure 3.
Metabolites functional annotation and classification analysis. (a) All the identified metabolites classification of tea plants. (b) KEGG pathway annotation of differential metabolites between mono- and trifolium-intercropped tea plants.
-
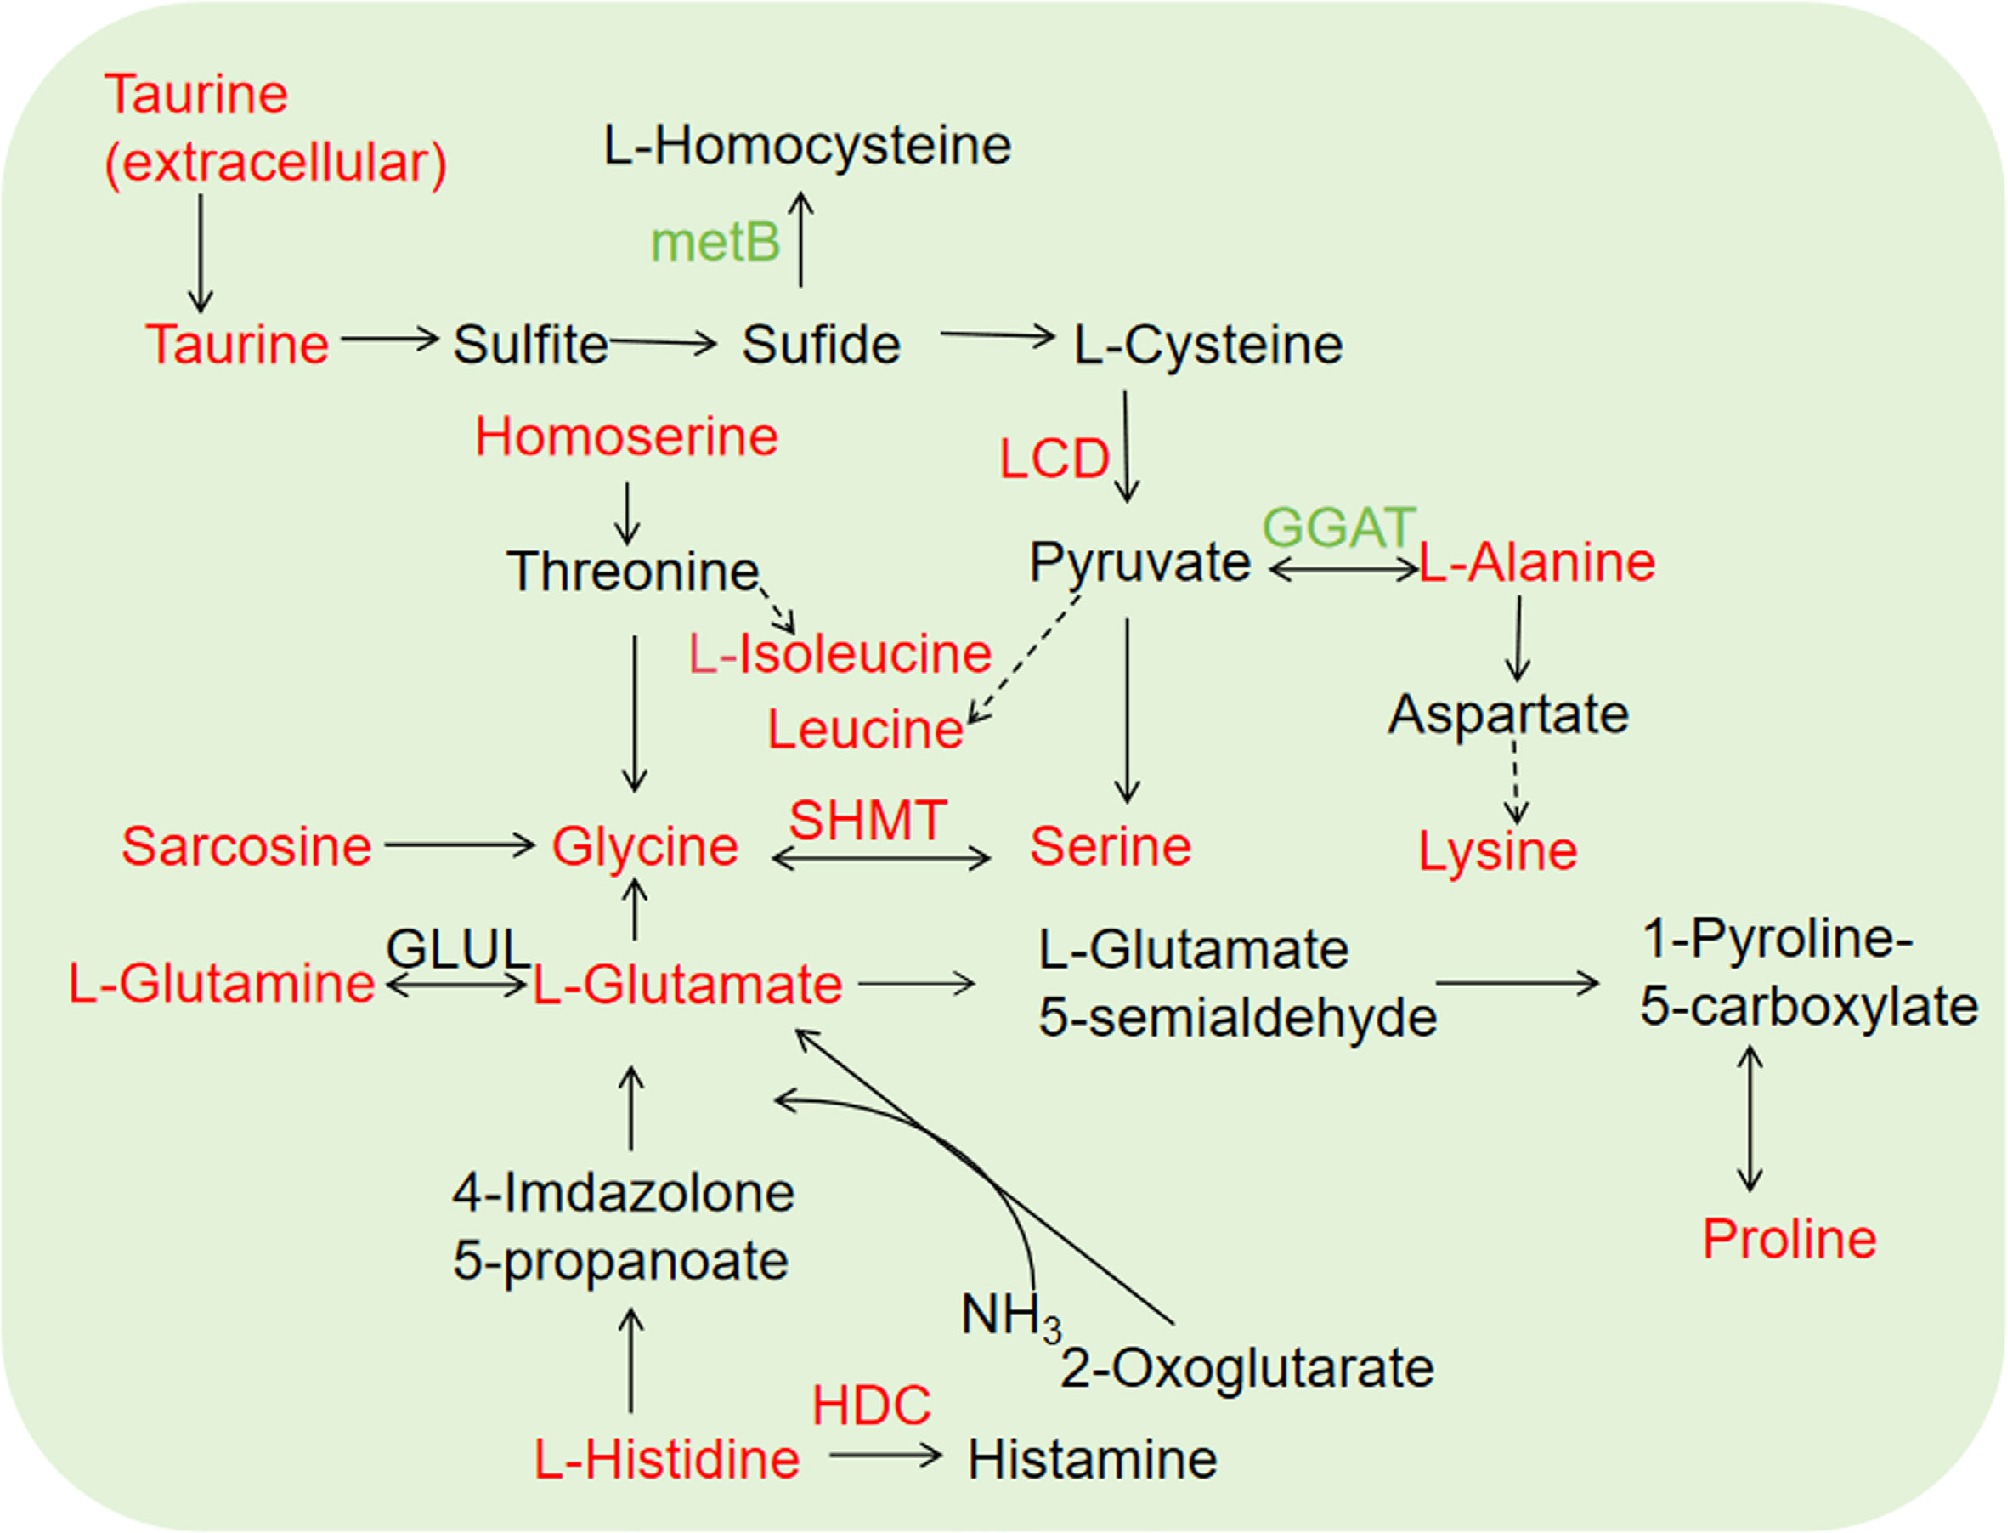
Figure 4.
Amino acid metabolism in tea plants intercropped with trifolium. Red and green indicate upregulated and downregulated genes/metabolites, respectively. Solid line and dotted line represent direct and indirect reactions, respectively.
-
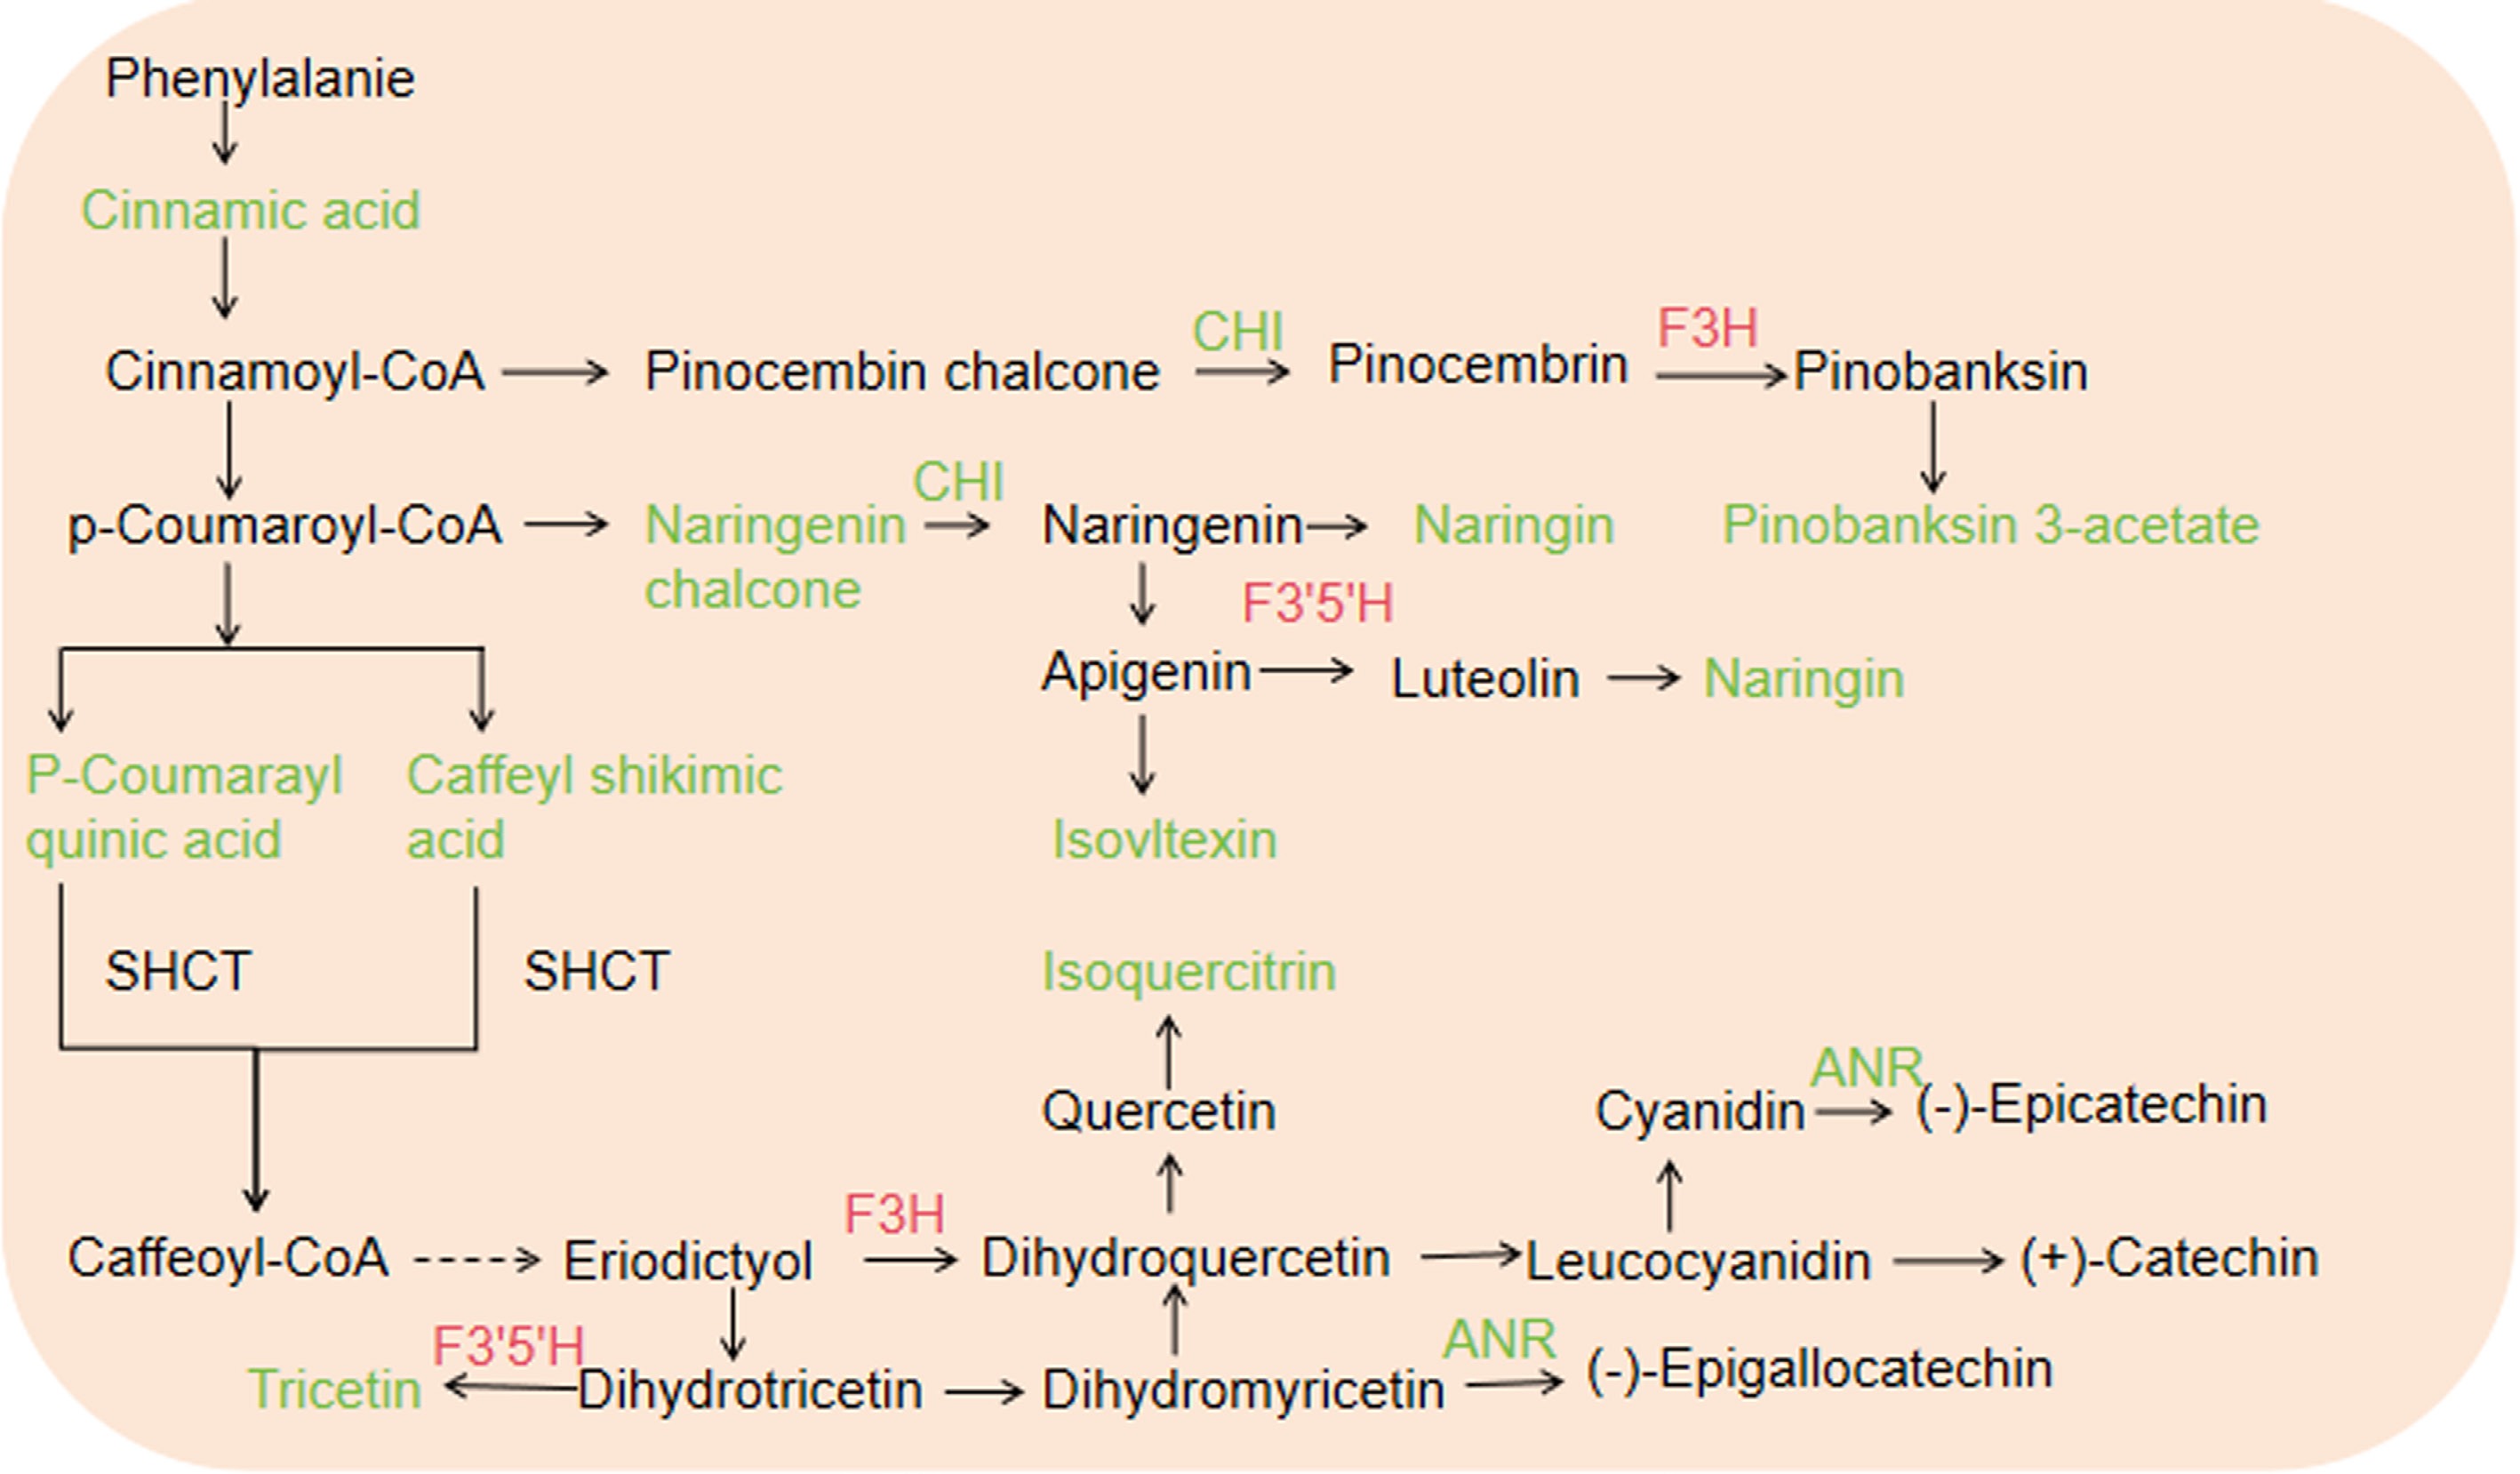
Figure 5.
Flavonoid metabolism in tea plants intercropped with trifolium. Red and green indicate upregulated and downregulated genes or metabolites, respectively. The solid line and dotted line represent direct and indirect reactions, repectively.
-
Samples Clean reads Clean bases Mapped reads GC content % ≥ Q30 Tea1 23,570,422 7,054,602,050 41,774,983 (88.62%) 44.52% 93.33% Tea2 20,615,161 6,169,899,398 36,528,370 (88.60%) 44.65% 93.25% Tea3 24,660,697 7,380,548,288 43,486,810 (88.17%) 44.60% 92.68% Tri-Tea1 21,547,499 6,447,675,024 38,340,714 (88.97%) 44.60% 92.91% Tri-Tea2 22,998,322 6,882,715,378 40,668,190 (88.42%) 44.50% 93.26% Tri-Tea3 23,851,520 7,138,434,388 42,510,817 (89.12%) 44.63% 93.46% Table 1.
Sequencing quantity statistics.
Figures
(5)
Tables
(1)