-
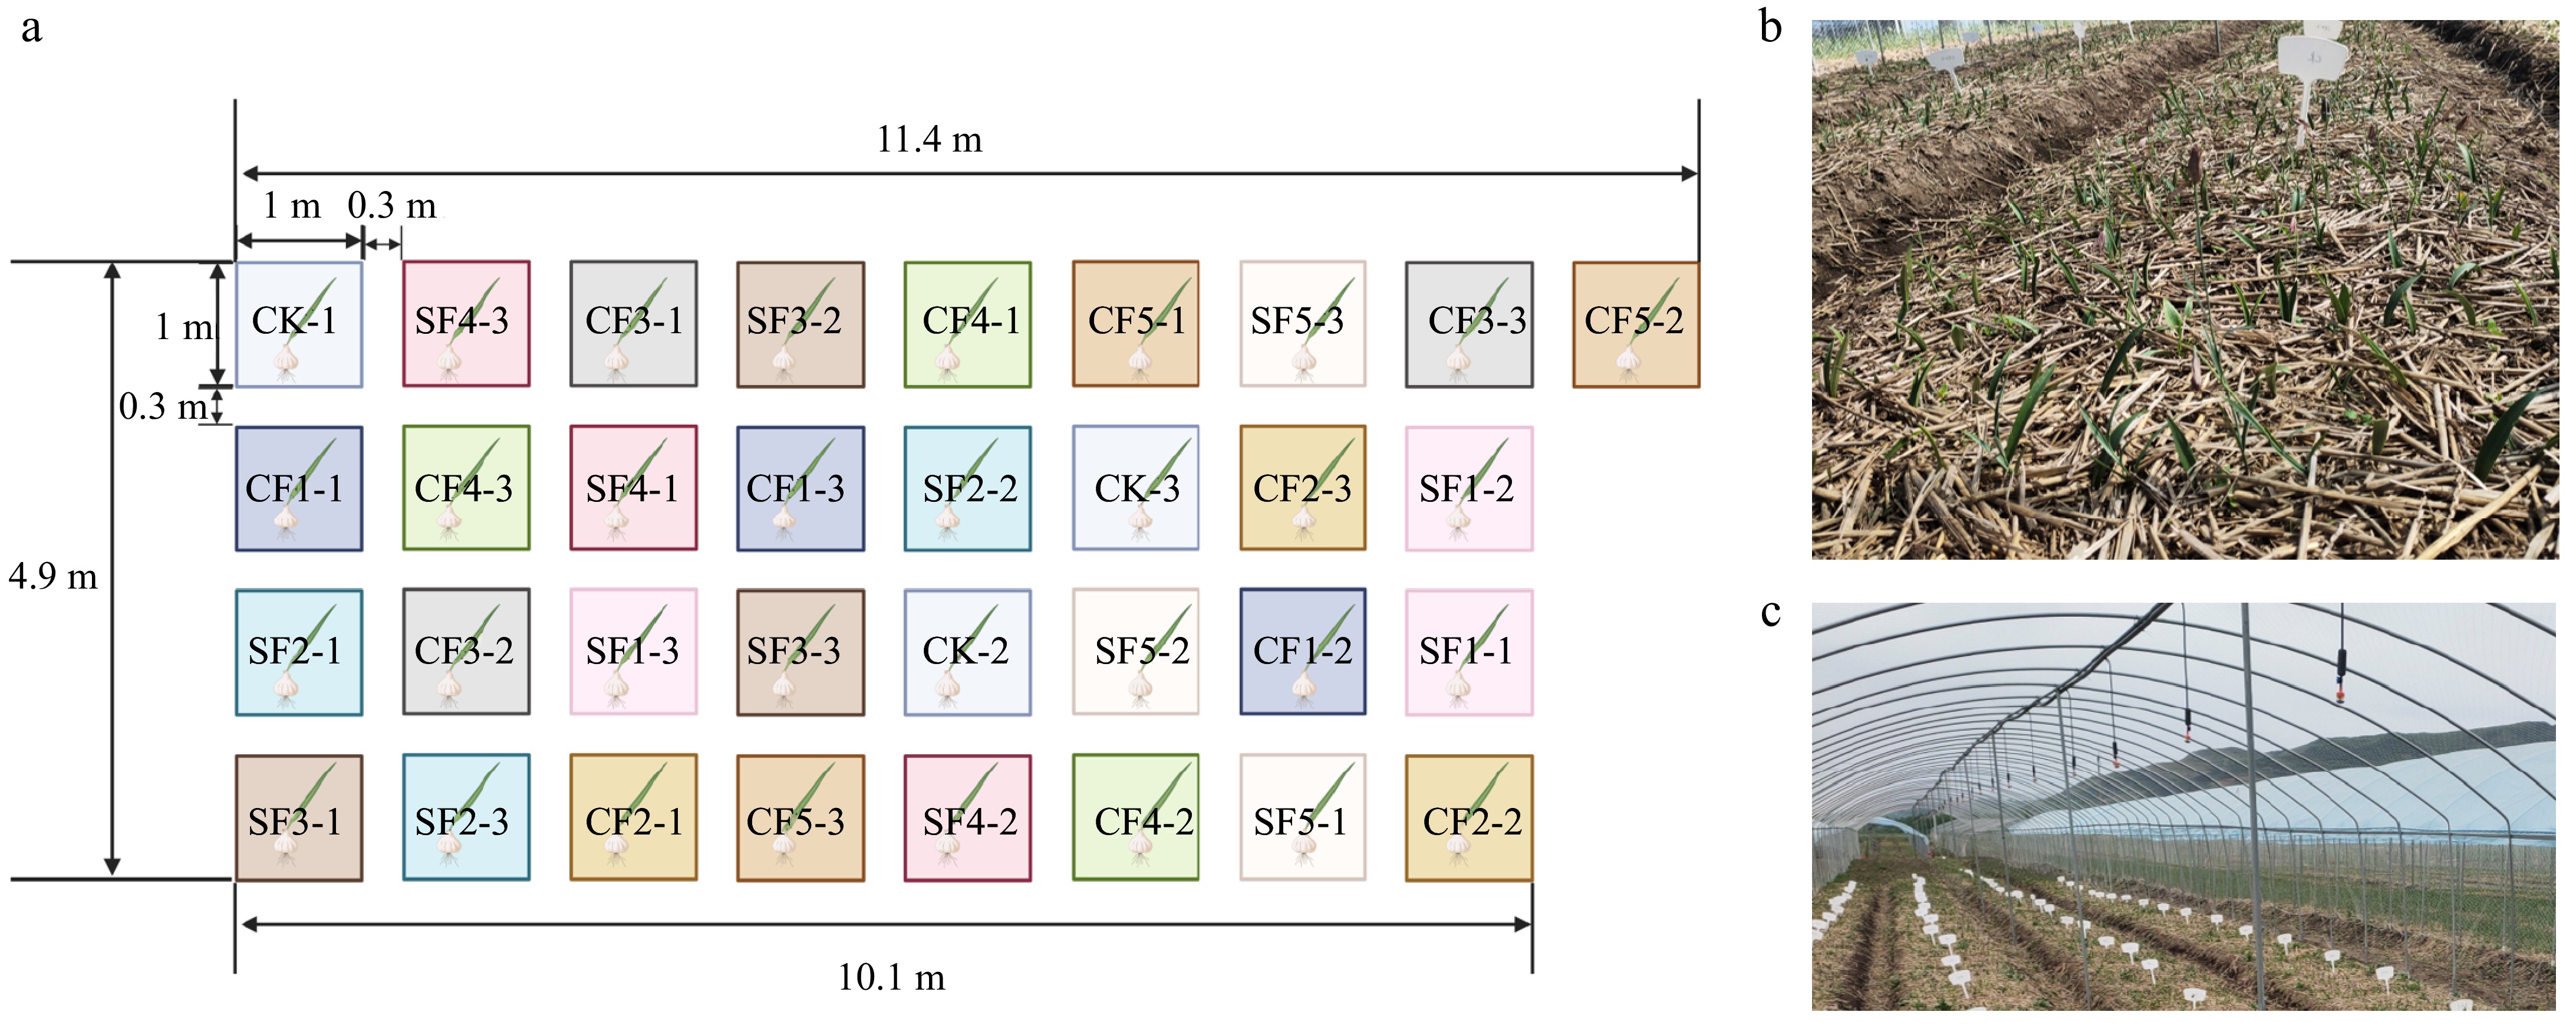
Figure 1.
Overview of the experimental design and layout. In the (a) experimental distribution map, each square's position corresponds to the plot position in the field, with every three squares of the same color representing three replicate treatment plots. The experiment was designed using a randomized distribution. (b) Actual photograph of the experimental plot. (c) Photograph of the overall environment of the experimental facility.
-
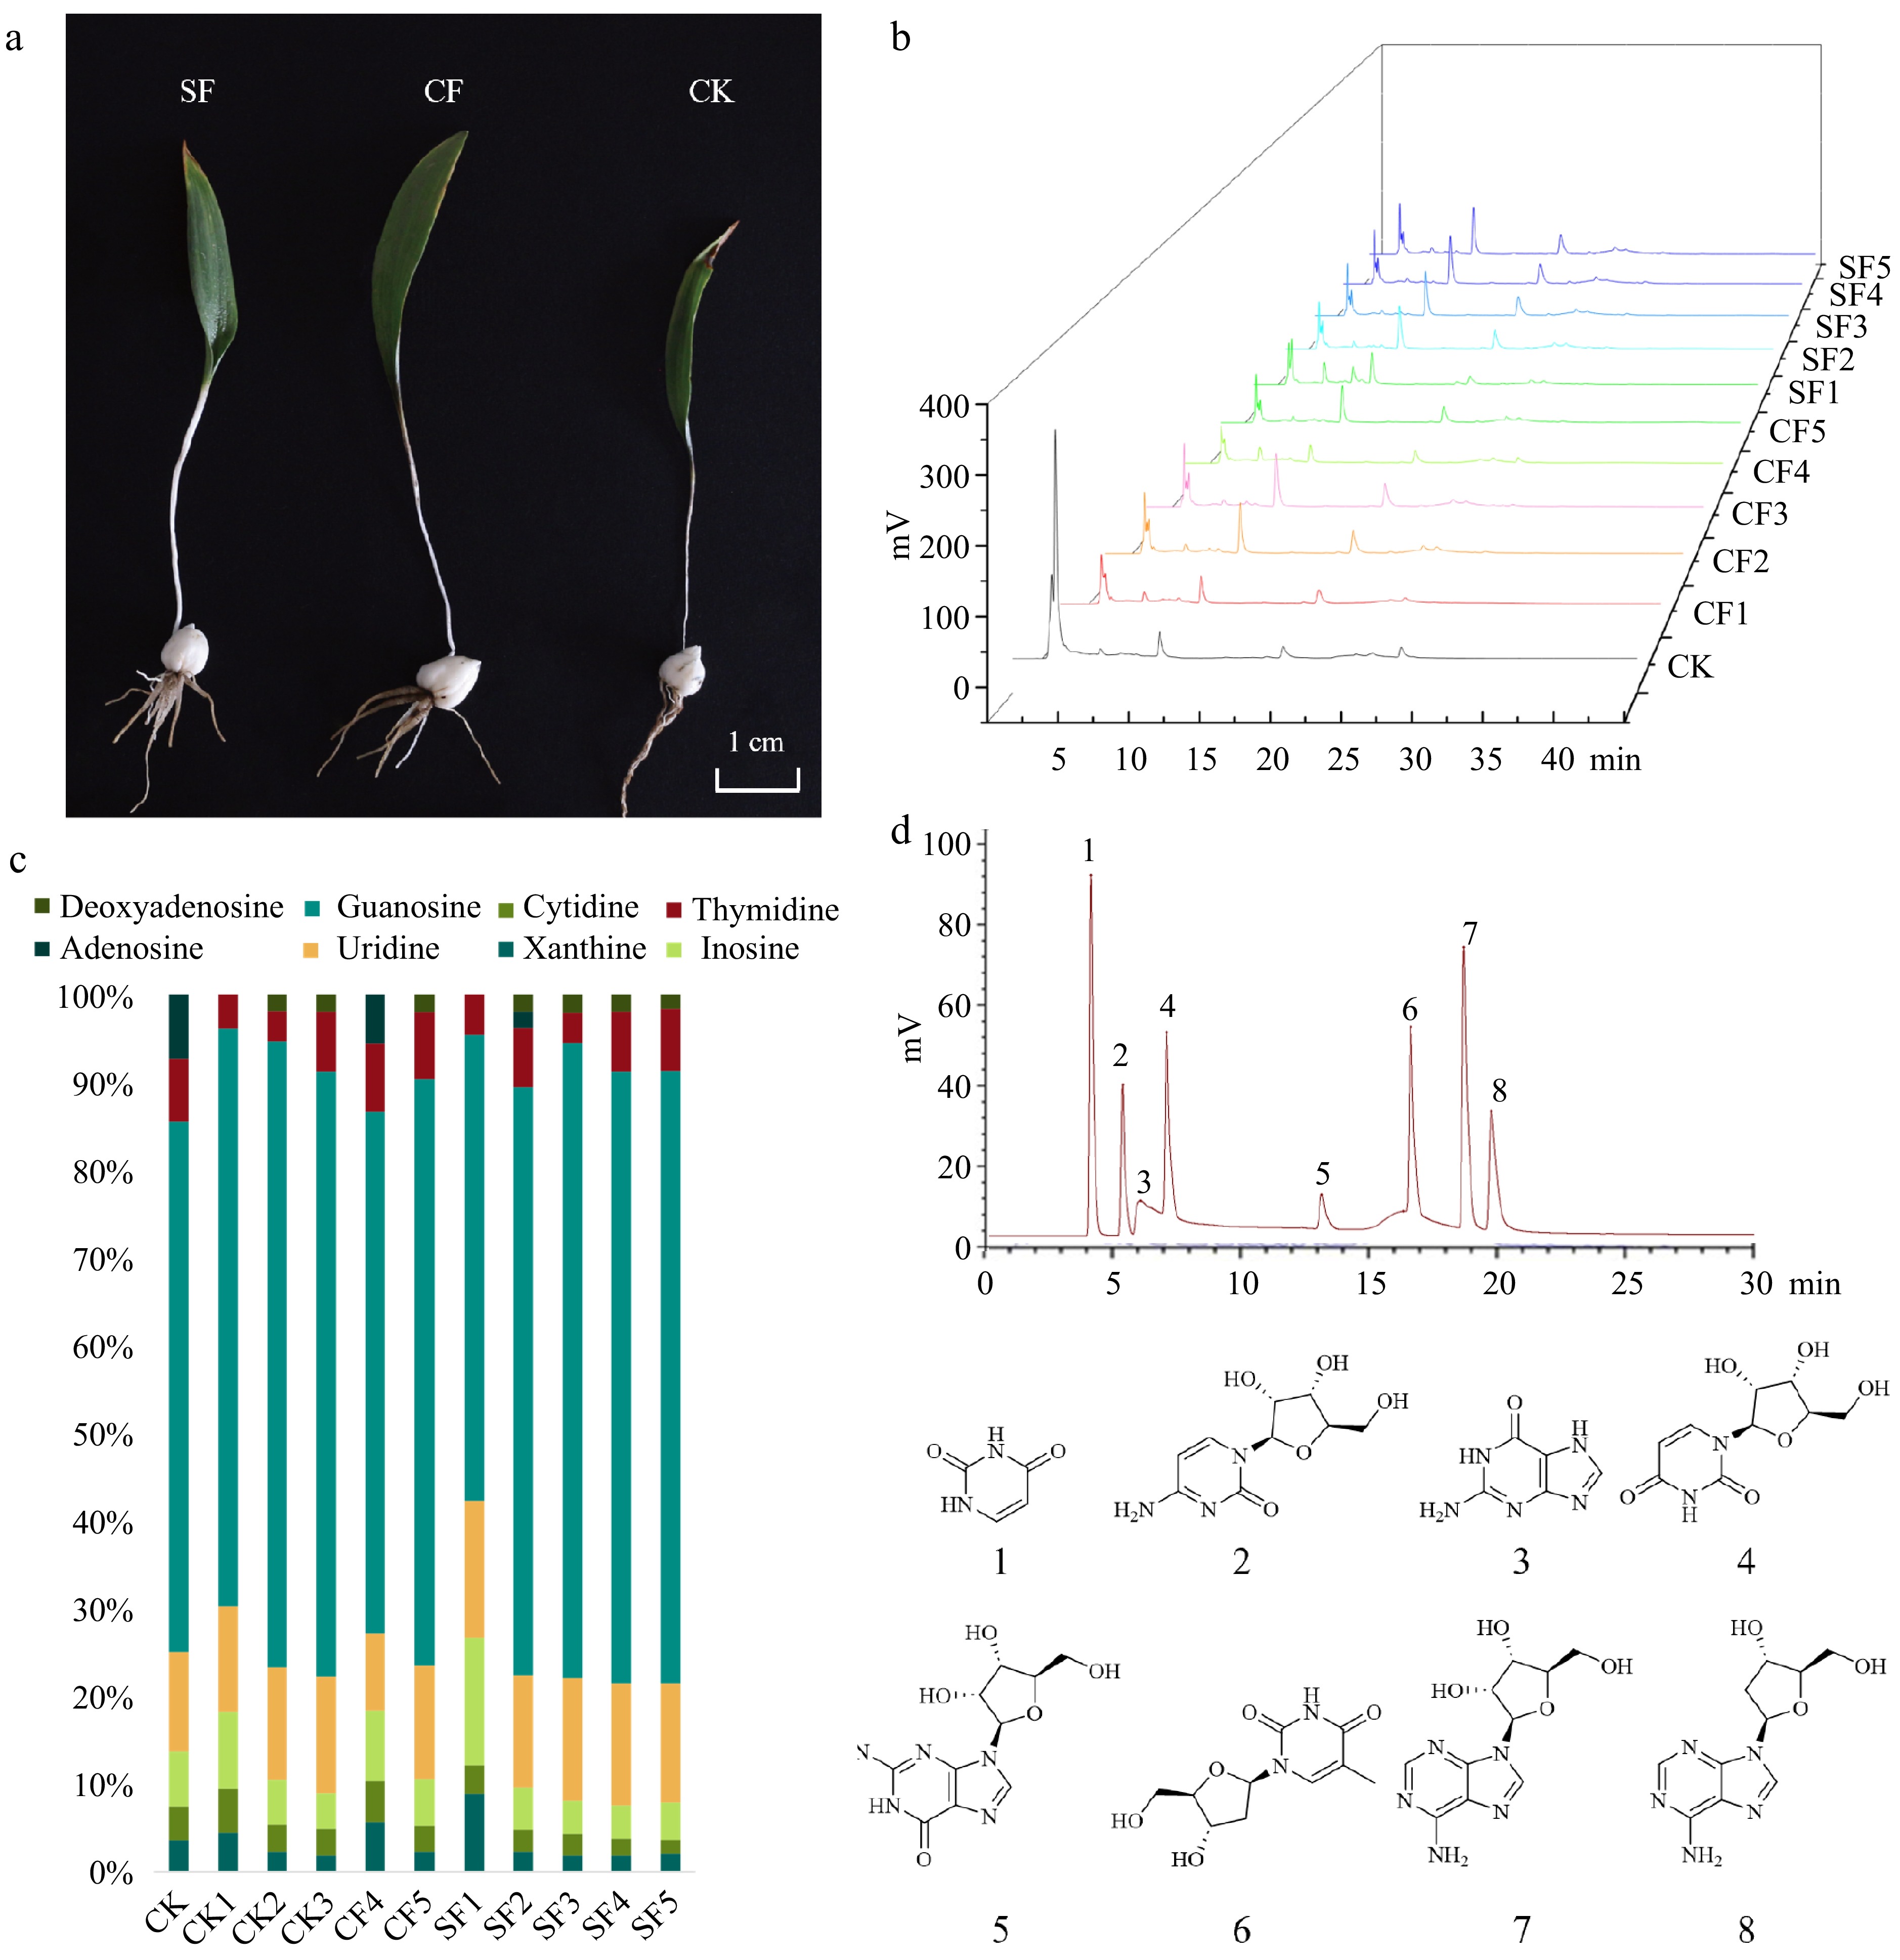
Figure 2.
(a) Plot of F. unibracteata growth under each treatment. (b) HPLC fingerprints of F. unibracteata bulbs from different fertilization treatments. (c) Accumulation plot of nucleoside content of F. unibracteata under different fertilization treatments. (d) Fingerprints of nucleoside active ingredient standards. Peak identification: 1. xanthine; 2. cytidine; 3. inosine; 4. uridine; 5. guanosine; 6. thymidine; 7. adenosine; 8. deoxyadenosine.
-
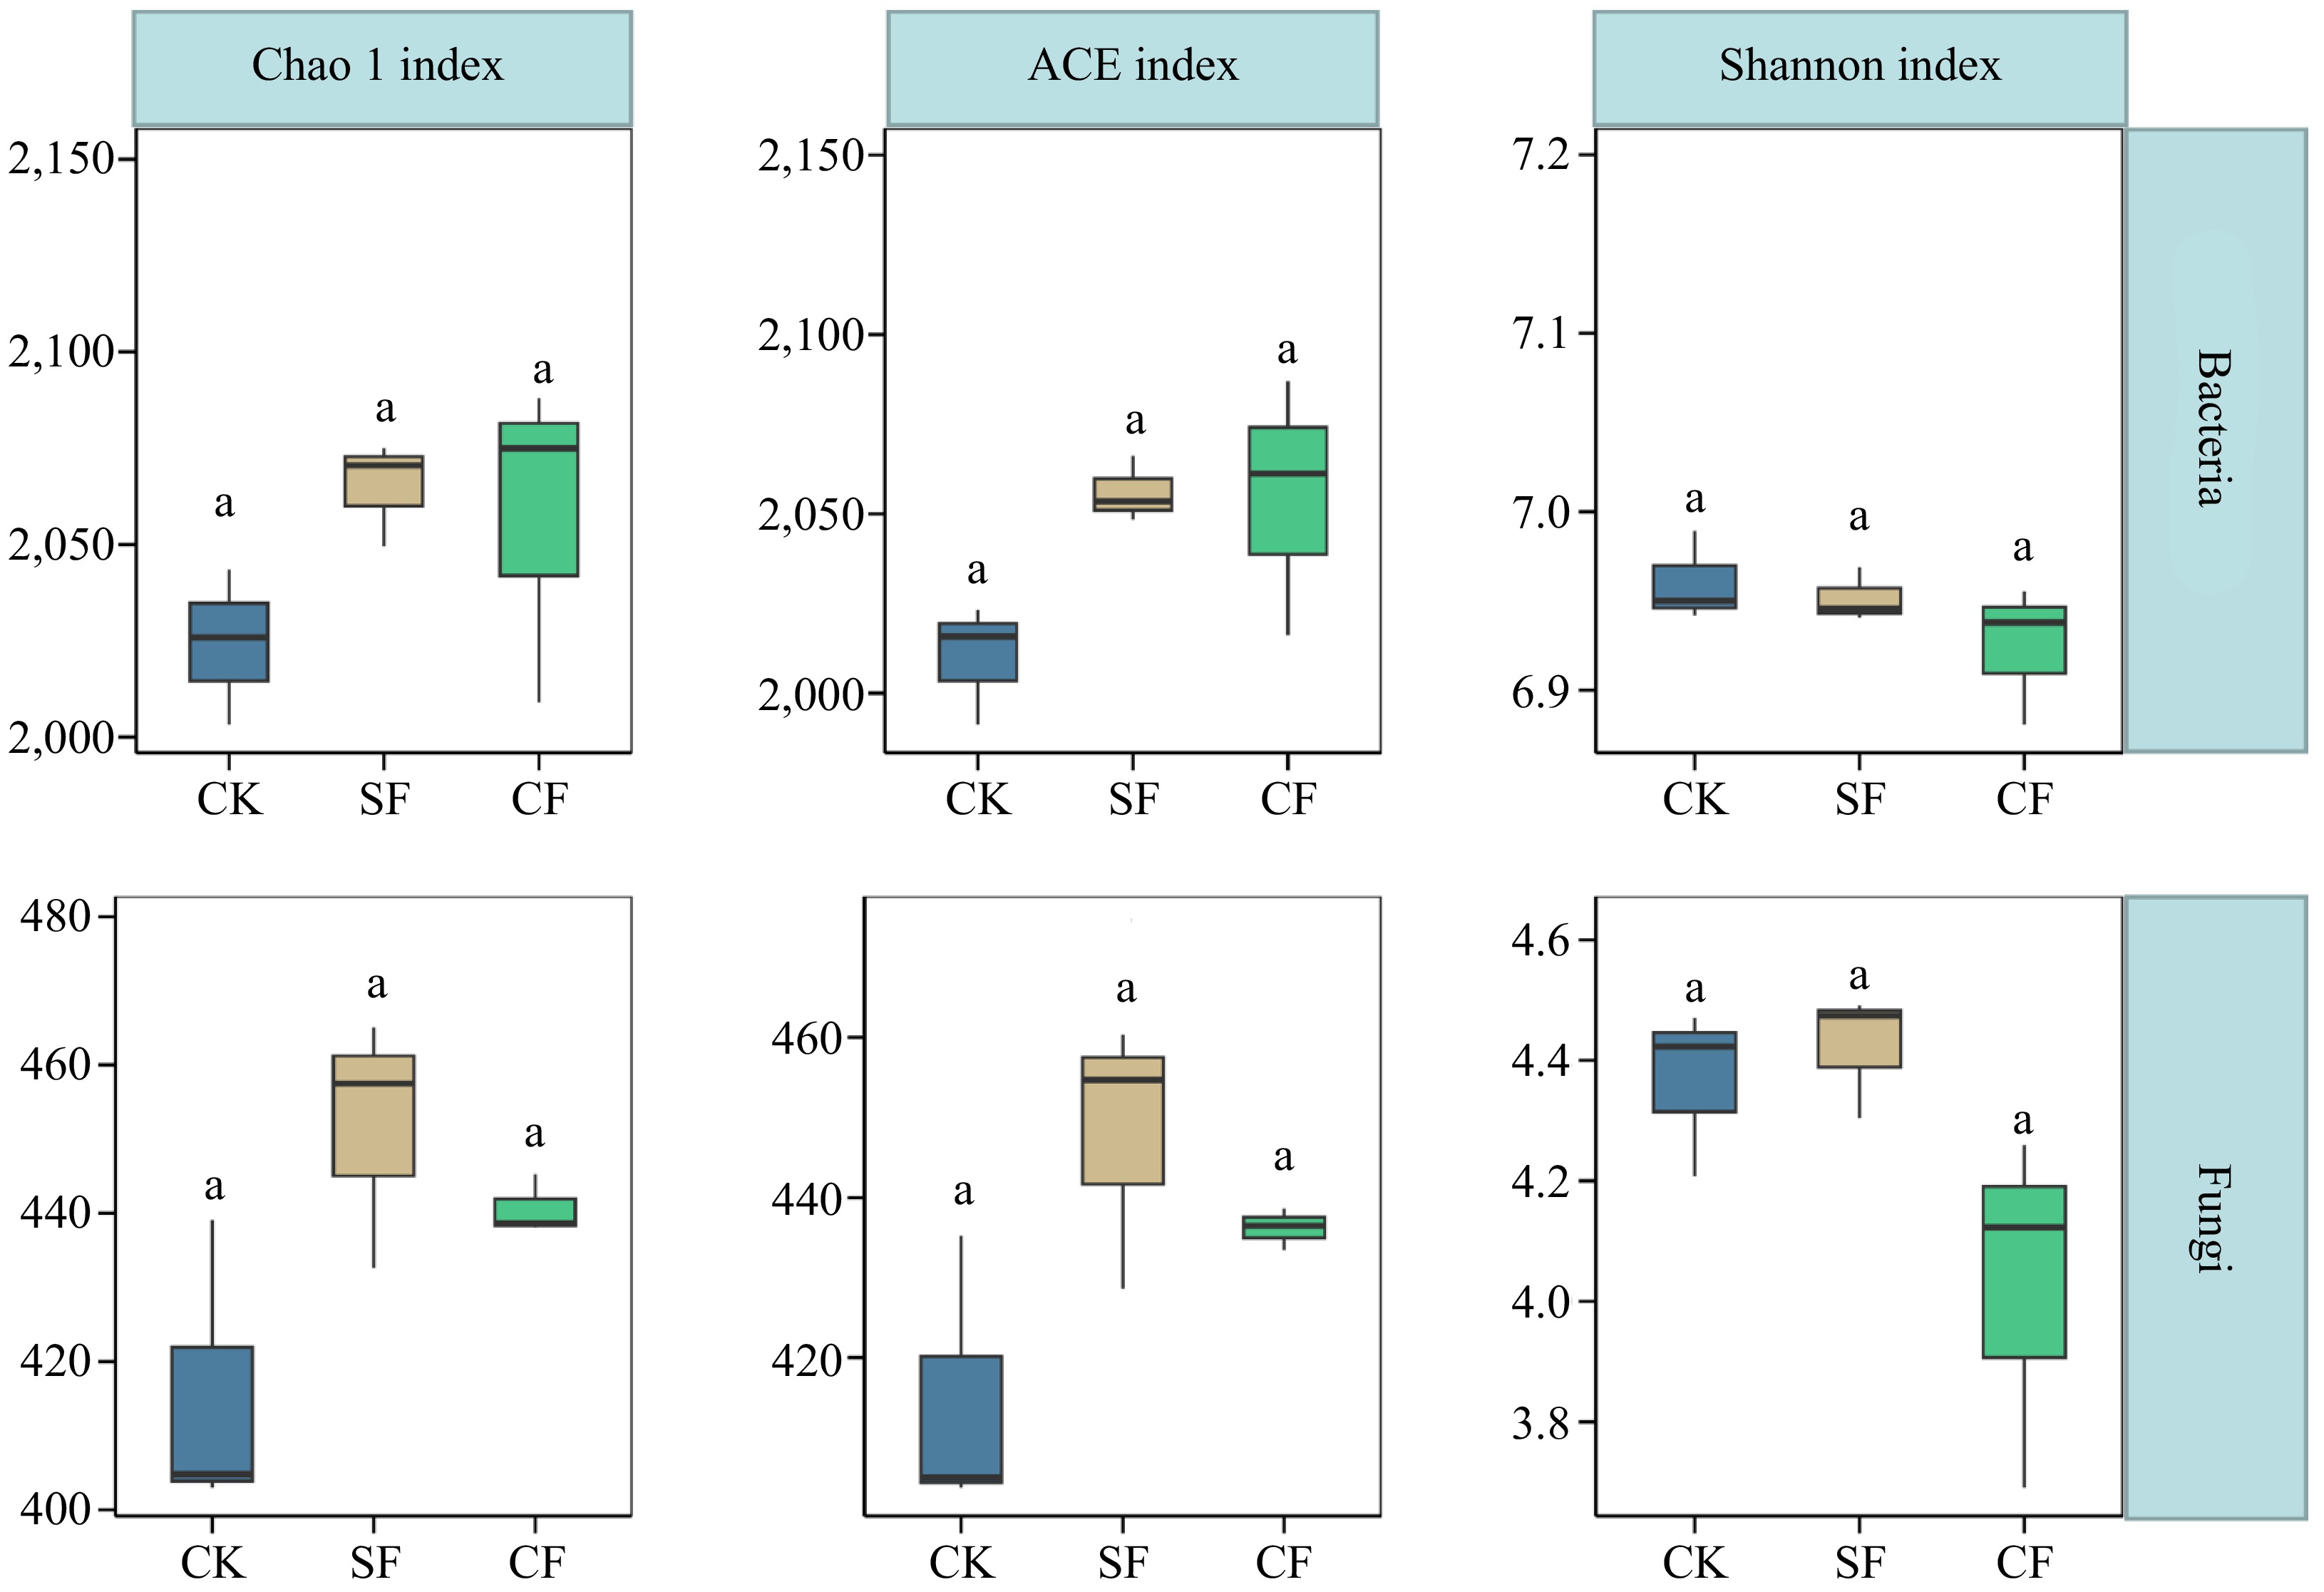
Figure 3.
Effect of different treatments on Alpha diversity indices (ACE, Chao1, and Shannon) of soil bacterial and fungal communities. The letter 'a' indicates that there is no significant difference between the treatment groups (p < 0.05; multiple comparison with ANOVA tests). CK: no fertilizer treatment, CF: cow manure organic fertilizer treatment, SF: sheep manure organic fertilizer treatment.
-
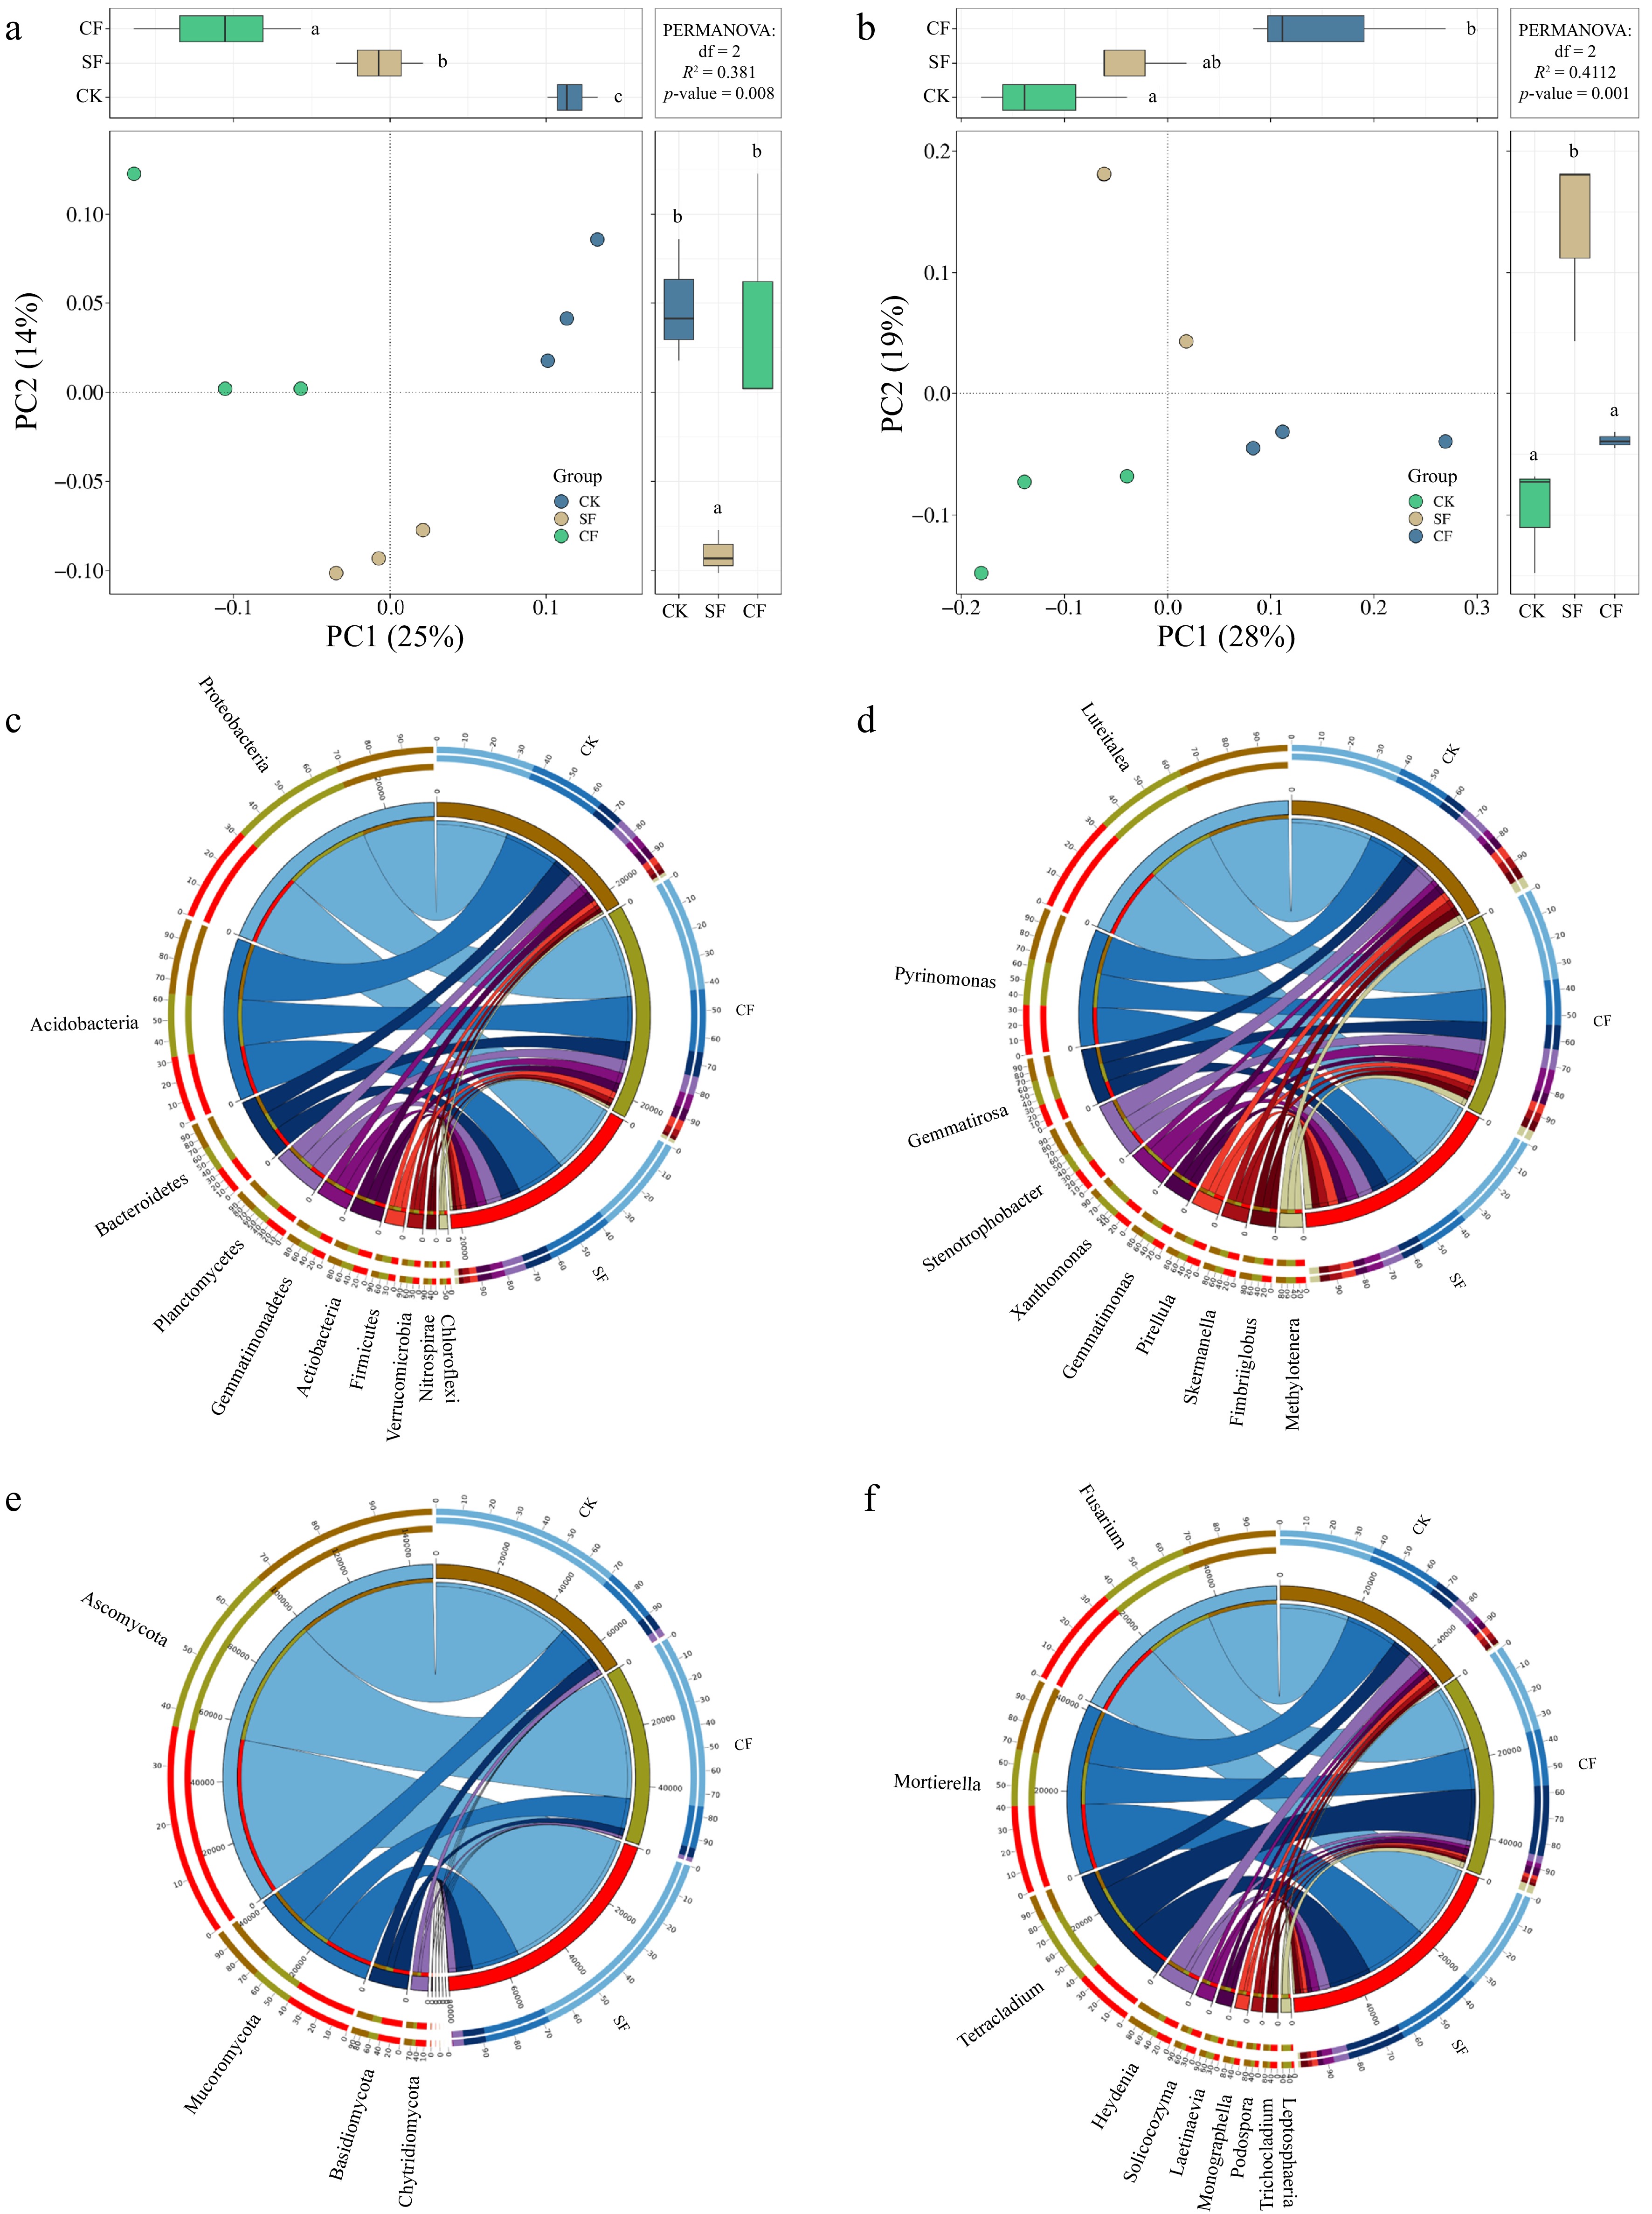
Figure 4.
PCoA results of (a) bacterial, and (b) fungal communities found with different fertilization types. PCoA plot of first two principal components based on operational taxonomic units in F. unibracteata with different fertilization types. Letters a, b, c indicate significant differences between treatments (p < 0.05; multiple comparison with ANOVA tests). CK: no fertilizer treatment, CF: cow manure organic fertilizer treatment, SF: sheep manure organic fertilizer treatment. Composition of the soil microbial community under different fertilization regimes. (c) Composition of the bacterial community at the phylum level. (d) Composition of the fungal community at the phylum level. (e) Composition of the bacterial community at the genus level. (f) Composition of the fungal community at the genus level.
-
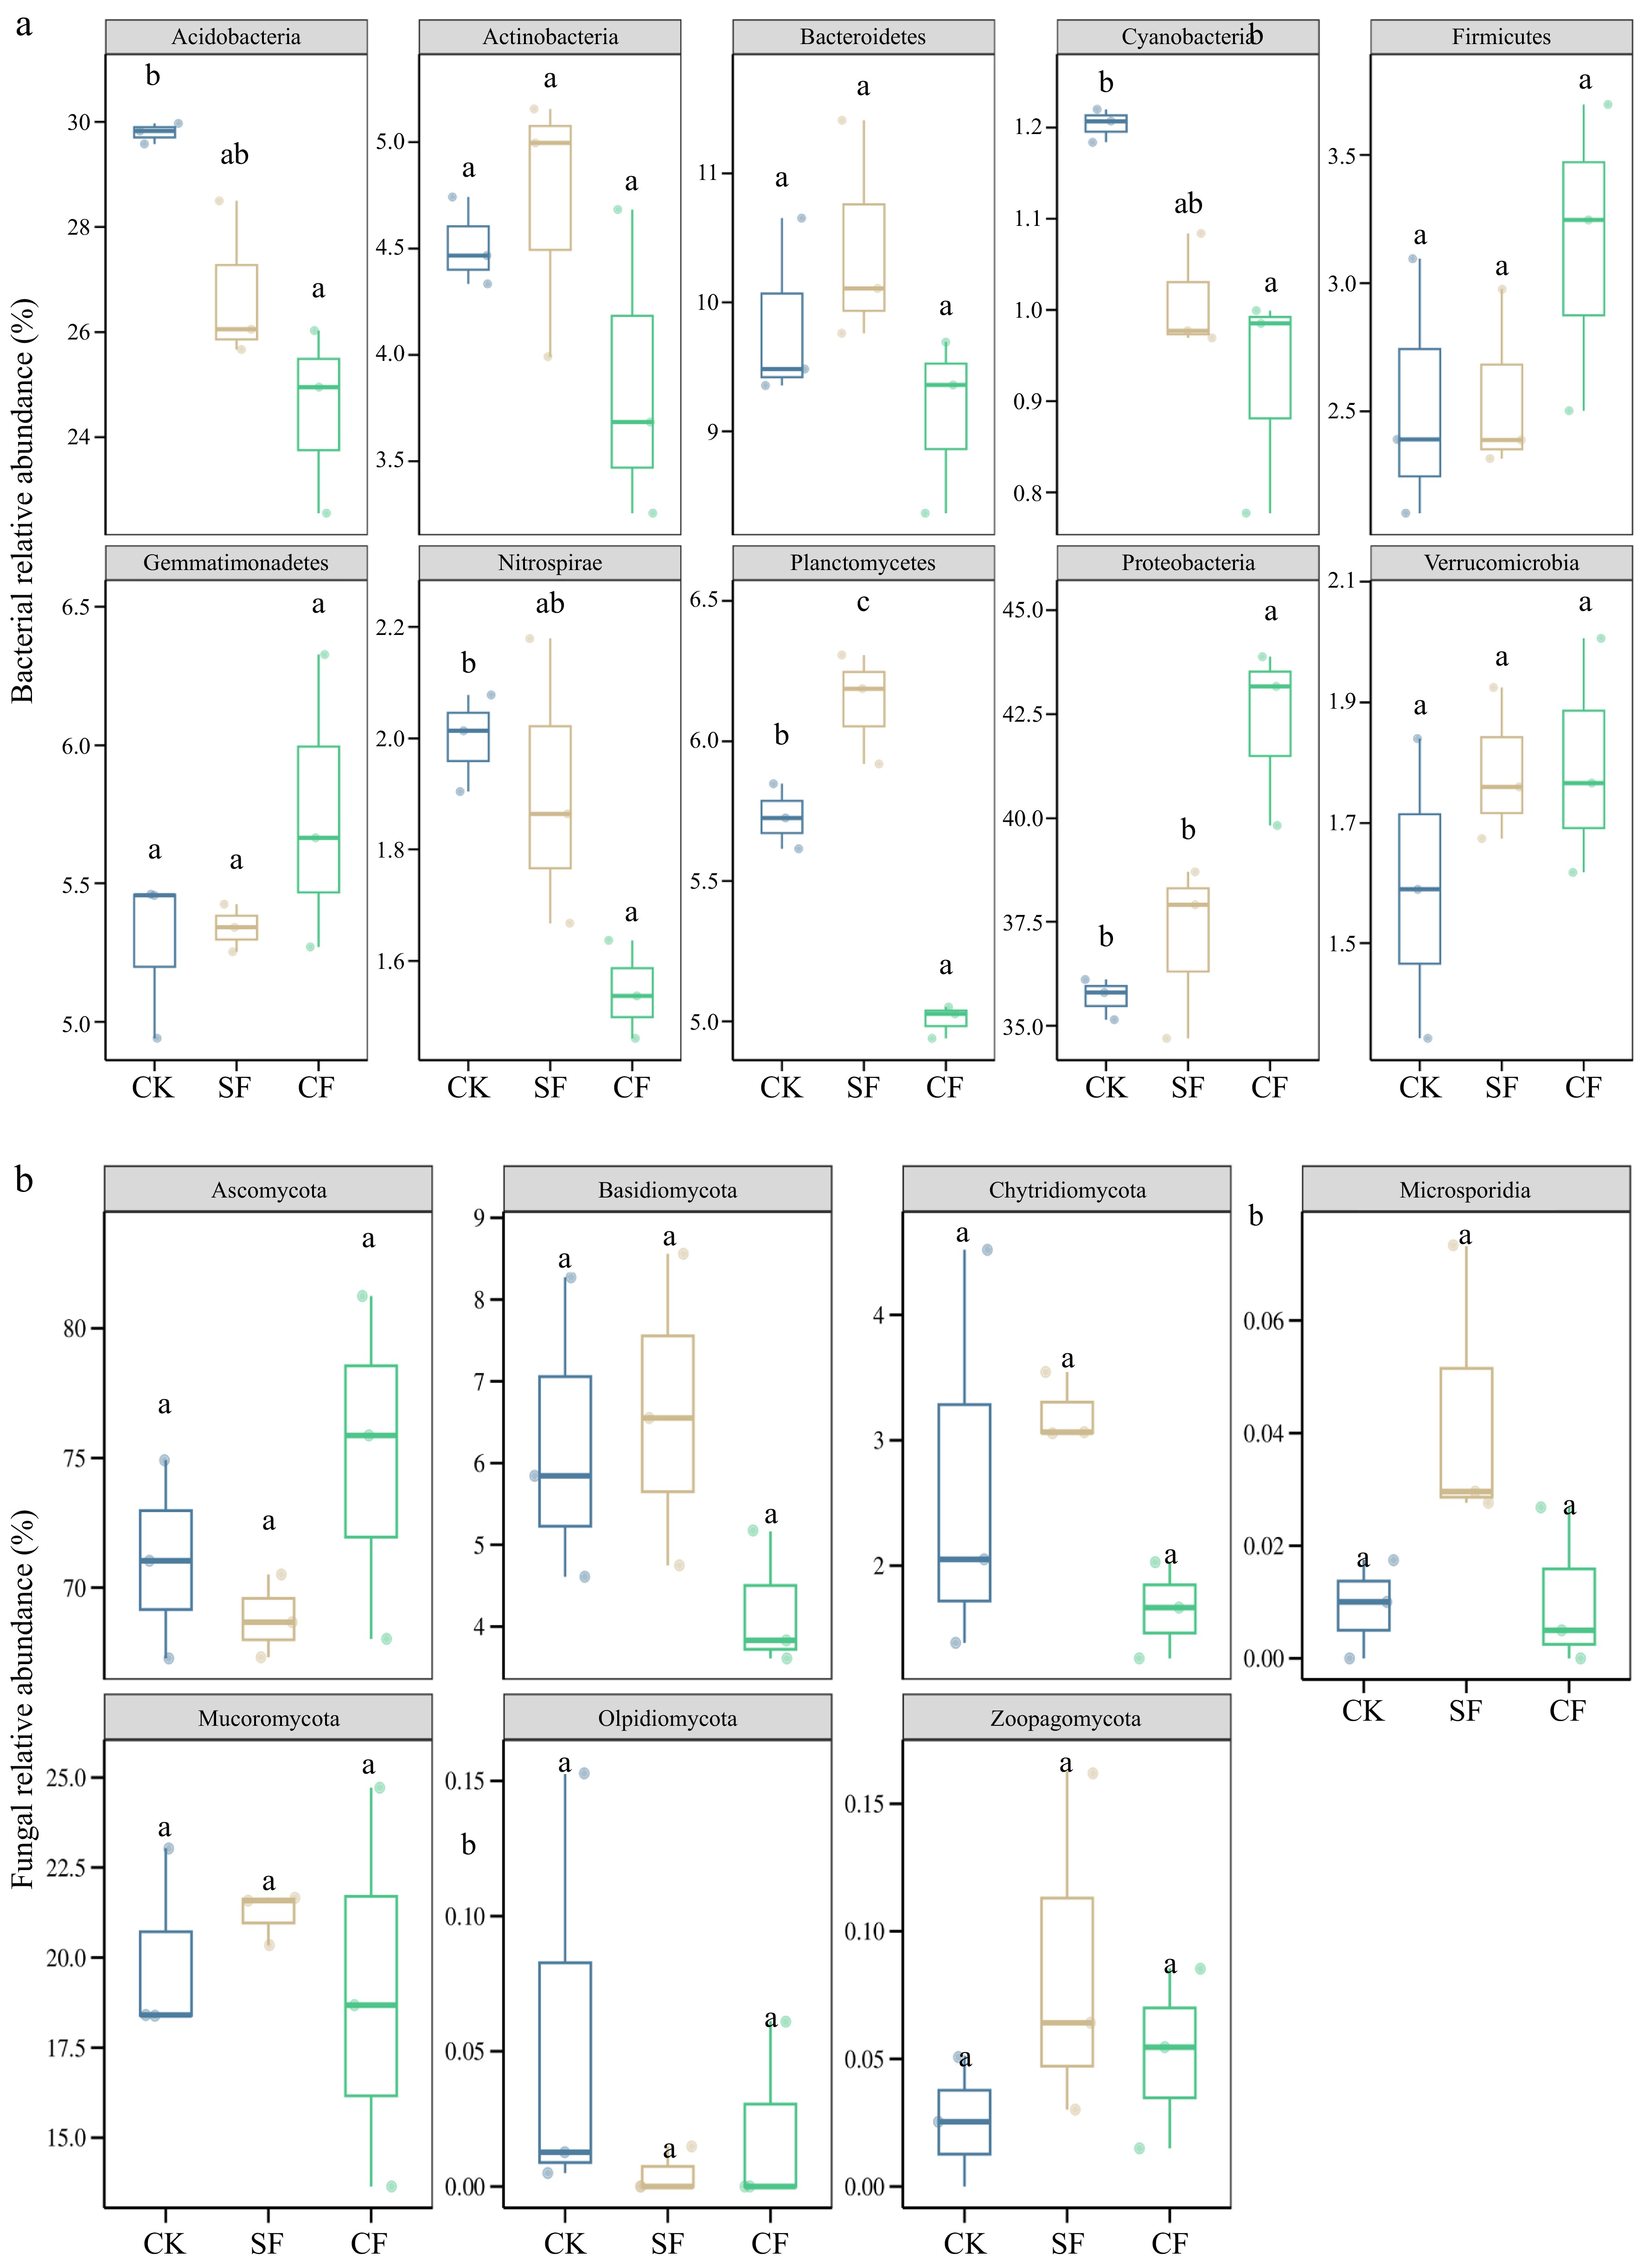
Figure 5.
Sectional boxplots of group differences in the relative abundance of the top 10 species in soil samples from the comparative study of soil (a) bacterial and (b) fungal phyla levels under different fertilization treatments. Treatment groups with different lowercase letters indicate significant differences. Different letters (a, b, c) indicate significant differences among treatments (p < 0.05; multiple comparison with ANOVA tests). CK: no fertilizer treatment, CF: cow manure organic fertilizer treatment, SF: sheep manure organic fertilizer treatment.
-
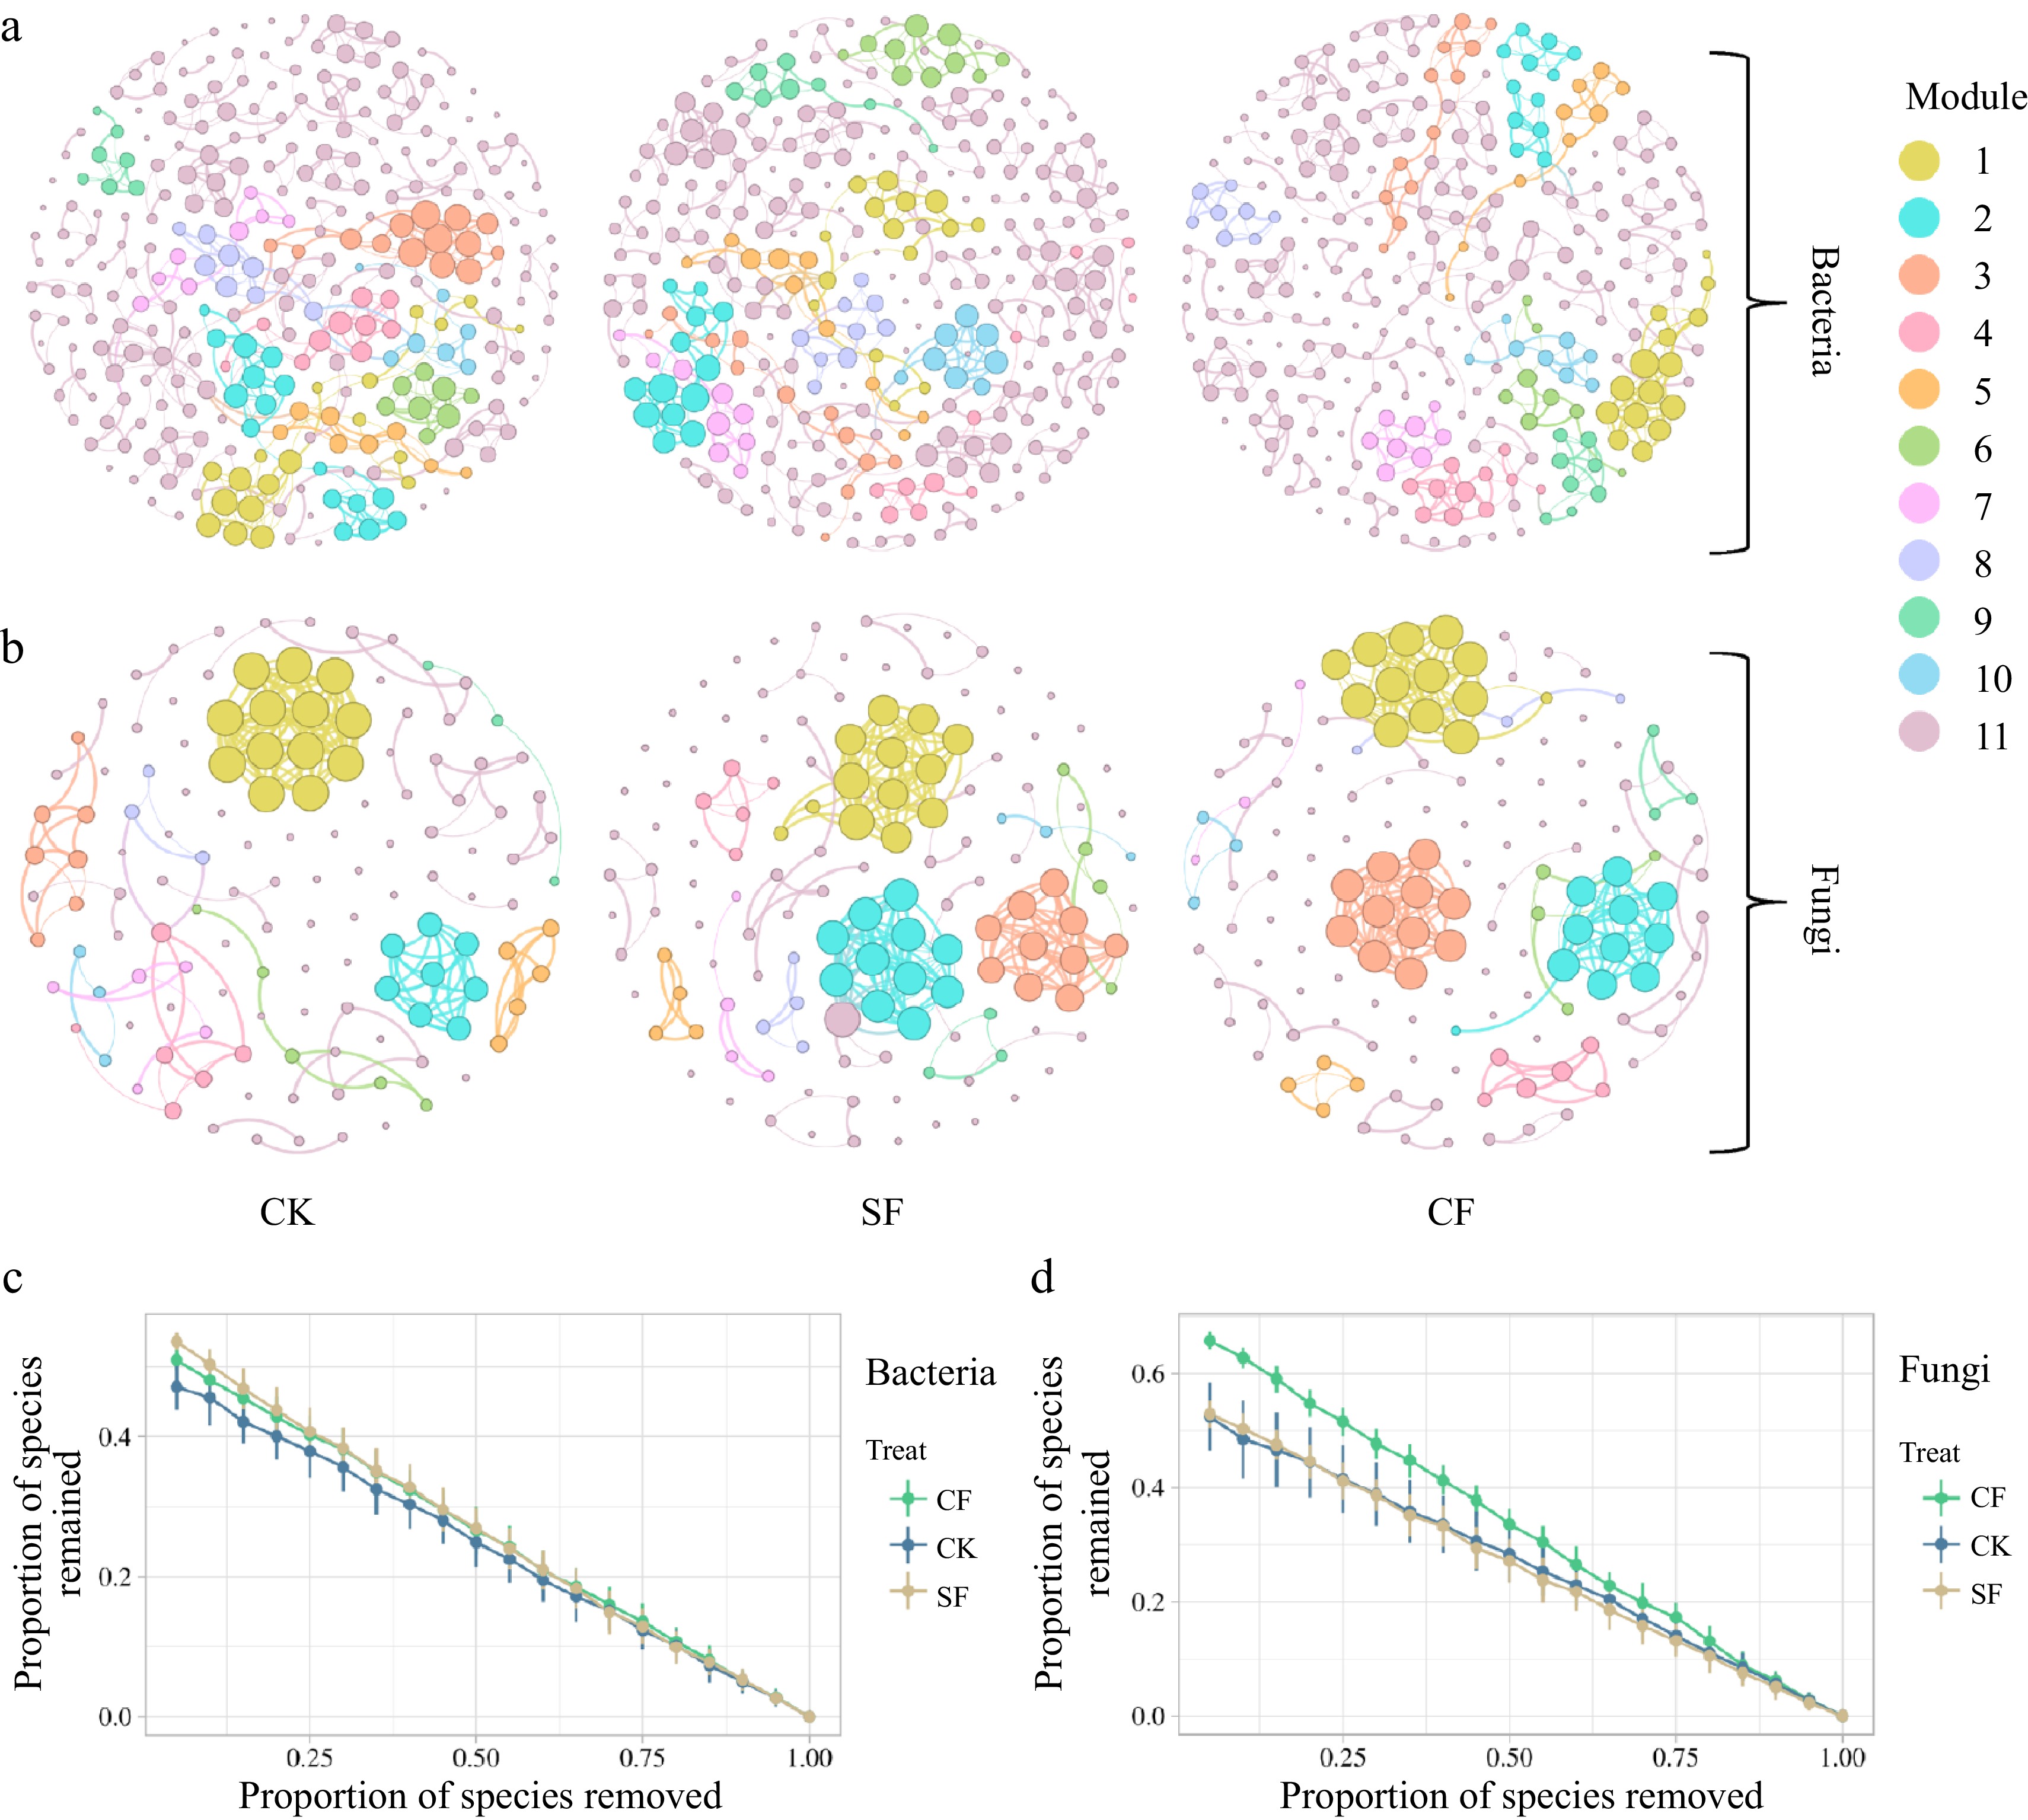
Figure 6.
Co-occurrence networks of the soil microbial communities at the genus level in (a), (b) different fertilization treatment groups; and (c) the robustness of bacterial network, and (d) fungal network. The node size is proportional to the taxon abundance, and the nodes represent bacterial or fungi taxa at the genus level (genera with relative abundances greater than 0.10%). The node colors represent different bacterial and fungal phyla. CK: no fertilizer treatment, CF: cow manure organic fertilizer treatment, SF: sheep manure organic fertilizer treatment.
-
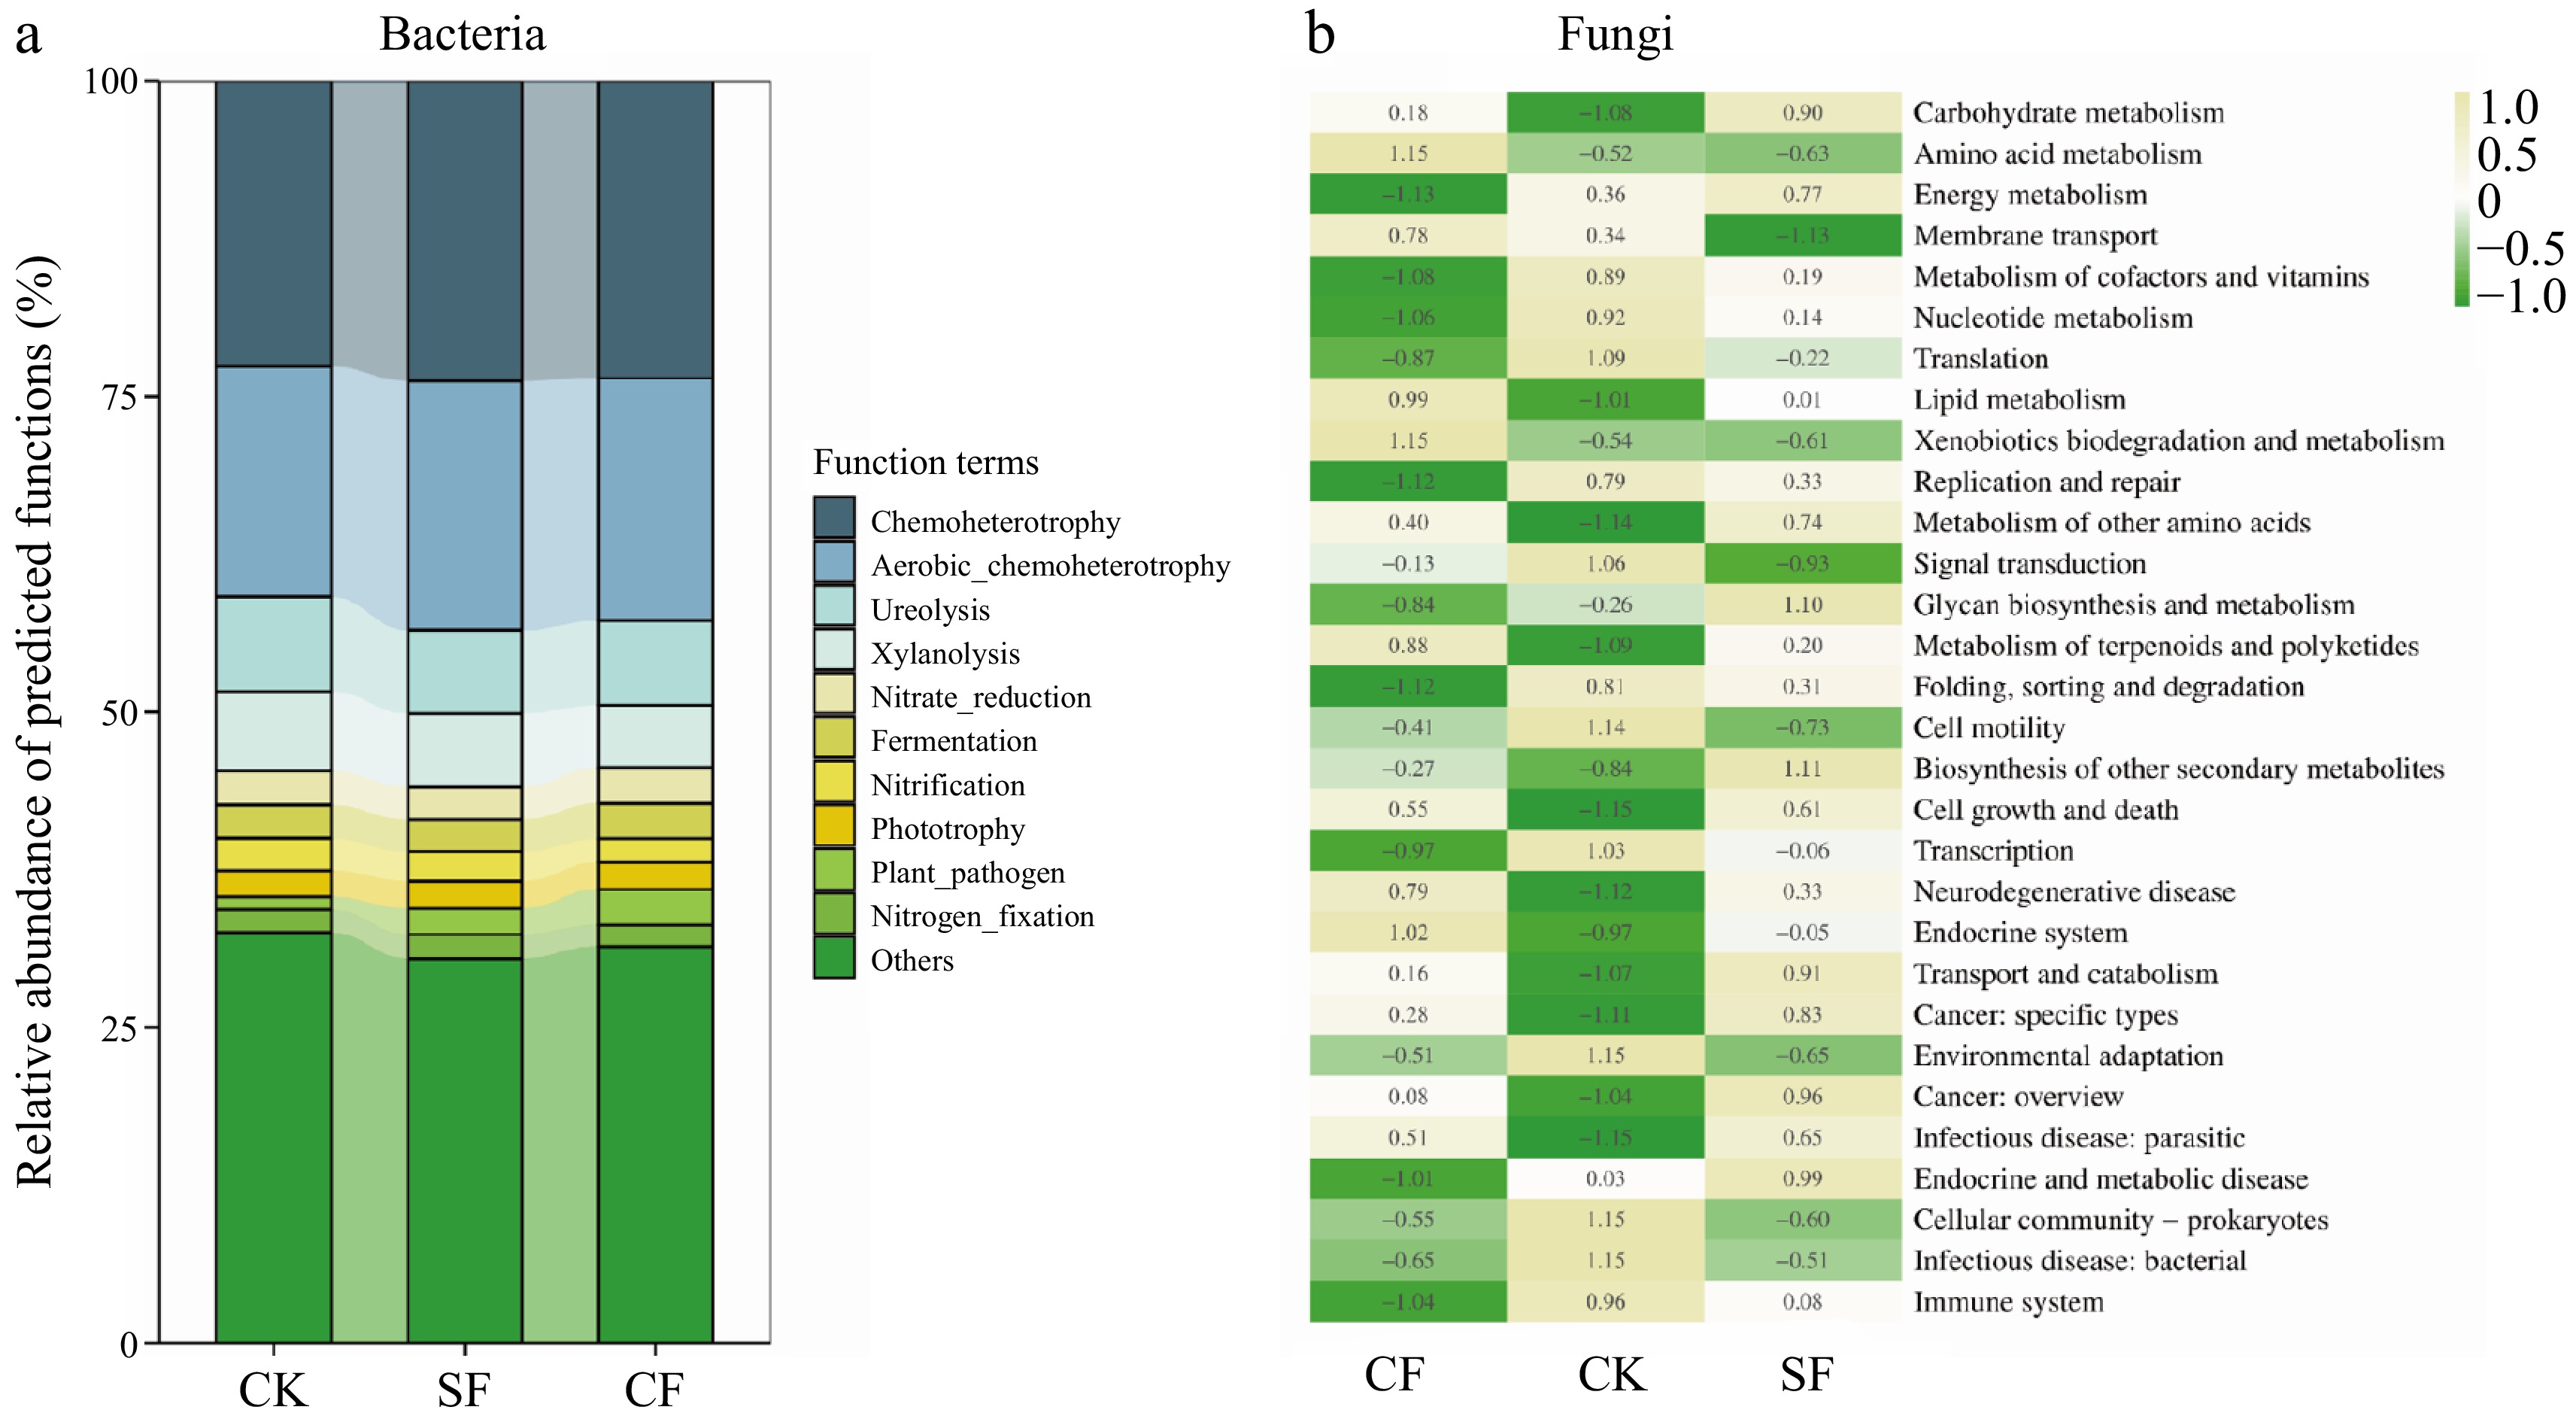
Figure 7.
Analysis of soil microbial community function in different treatment groups. (a) Abundance barplot of FAPROTAX functional analysis of bacterial community and (b) the heat map of PICRUSt2 functional analysis of fungal community were performed. CK: no fertilizer treatment, CF: cow manure organic fertilizer treatment, SF: sheep manure organic fertilizer treatment.
-
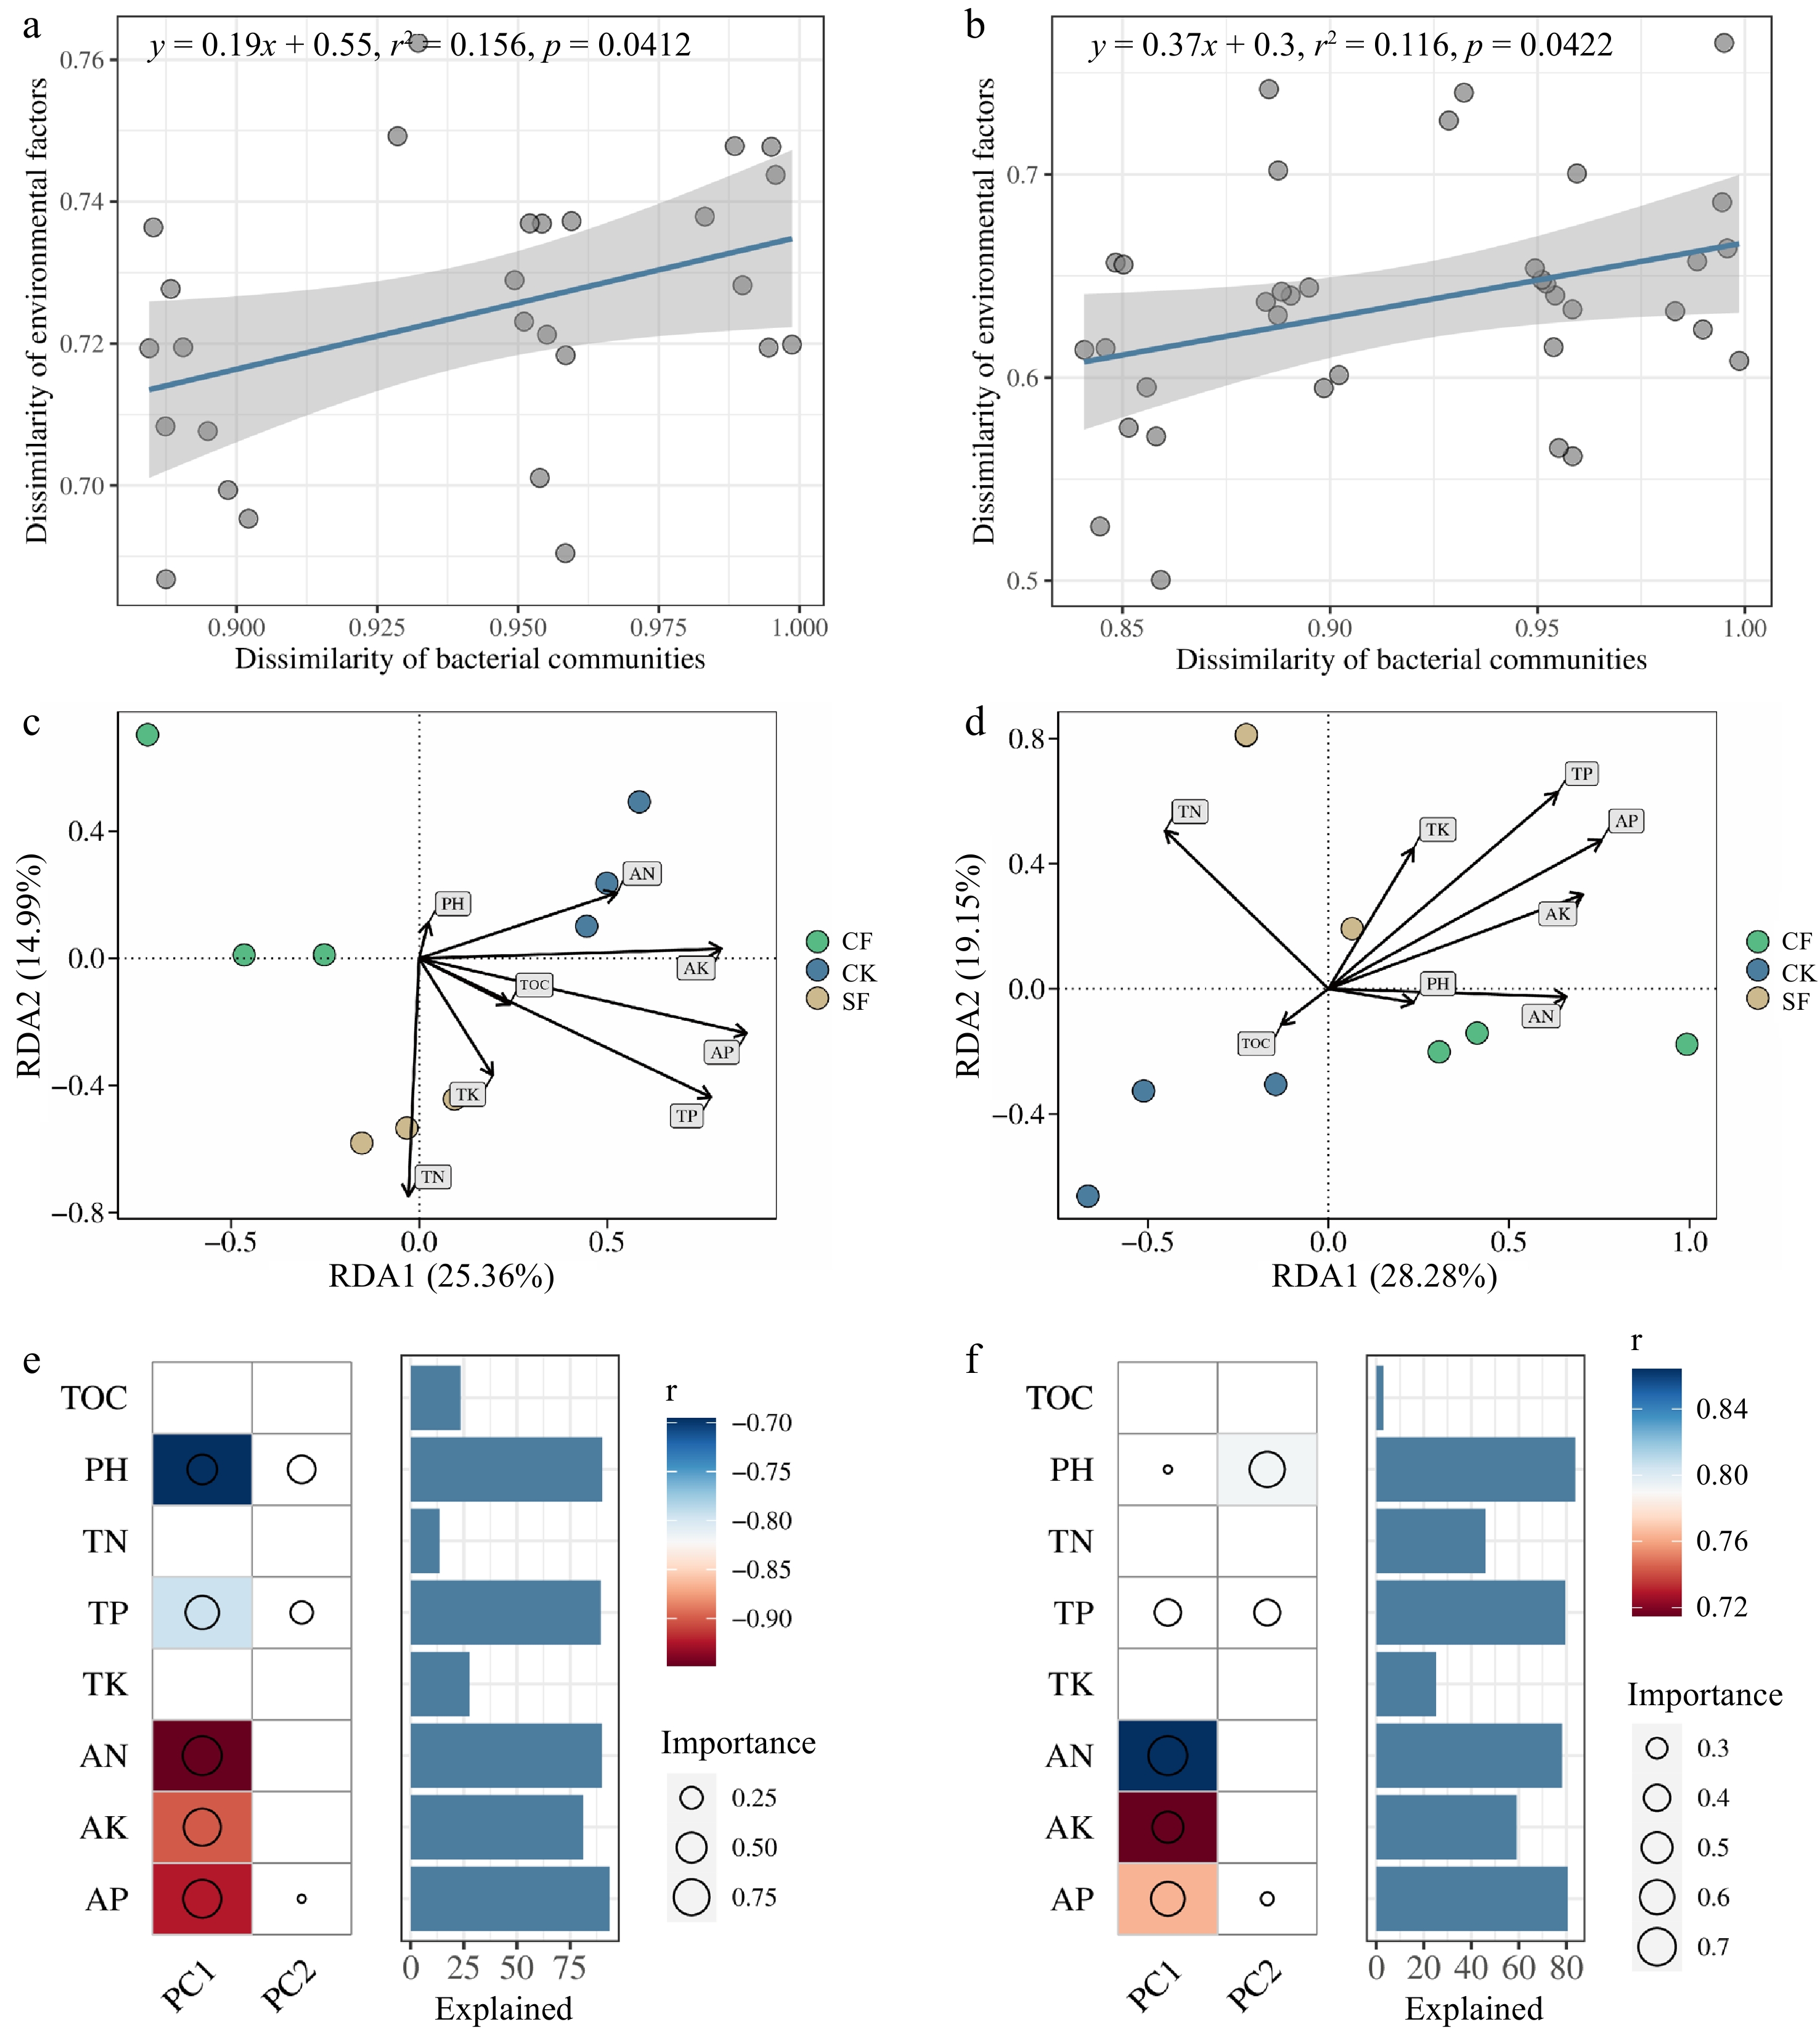
Figure 8.
Plot of the results of the ordinal regression analysis of environmental factors. Linear regression to assess the correlation of Euclidean distances of environmental factors with Bray-Curtis distances of (a) bacterial and (b) fungal microbial communities. Distance-based redundancy analysis (RDA) among (c) bacterial, or (d) fungal communities and environmental factors. Heat map of correlations between environmental factors and changes in (e) bacterial and (f) fungal microbial communities and their contribution. CK: no fertilizer treatment, CF: cow manure organic fertilizer treatment, SF: sheep manure organic fertilizer treatment.
-
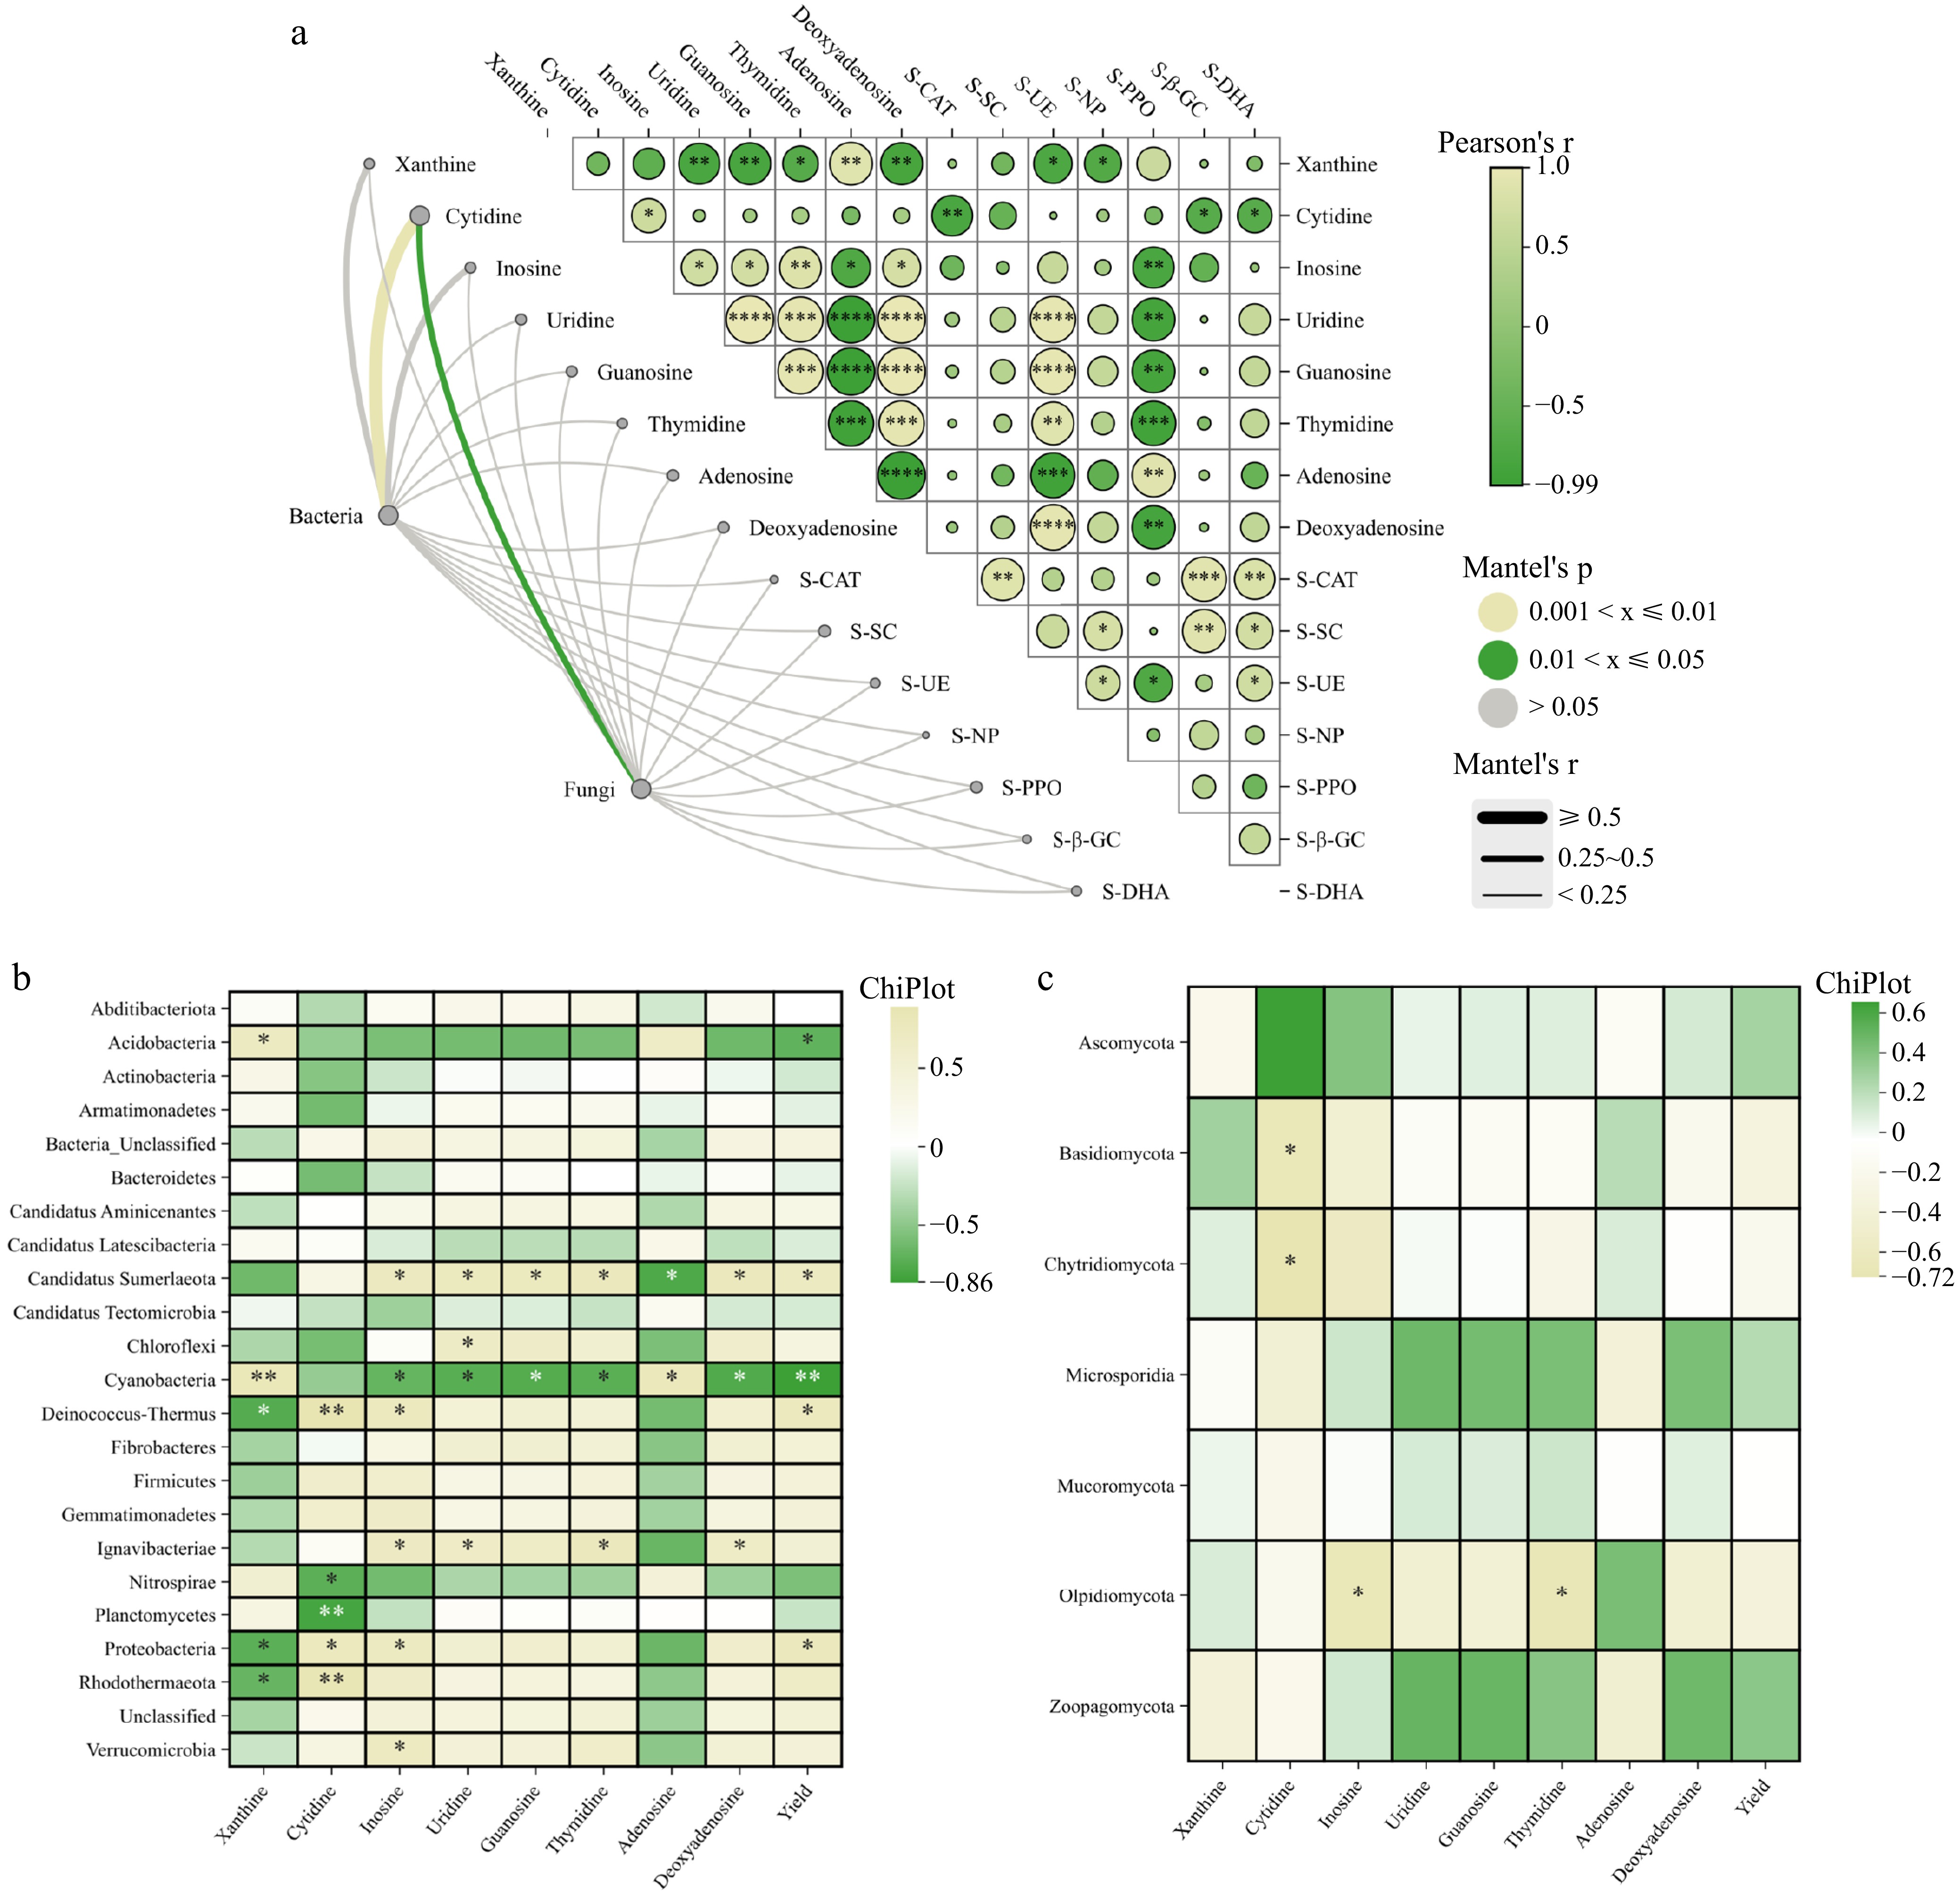
Figure 9.
(a) Mantel test analysis among soil enzymes, nucleosides, and microbial communities. Correlation analysis between (b) bacterial and (c) fungal phylum and the yield and quality of bulbs (*, p < 0.05, **, p < 0.01).
-
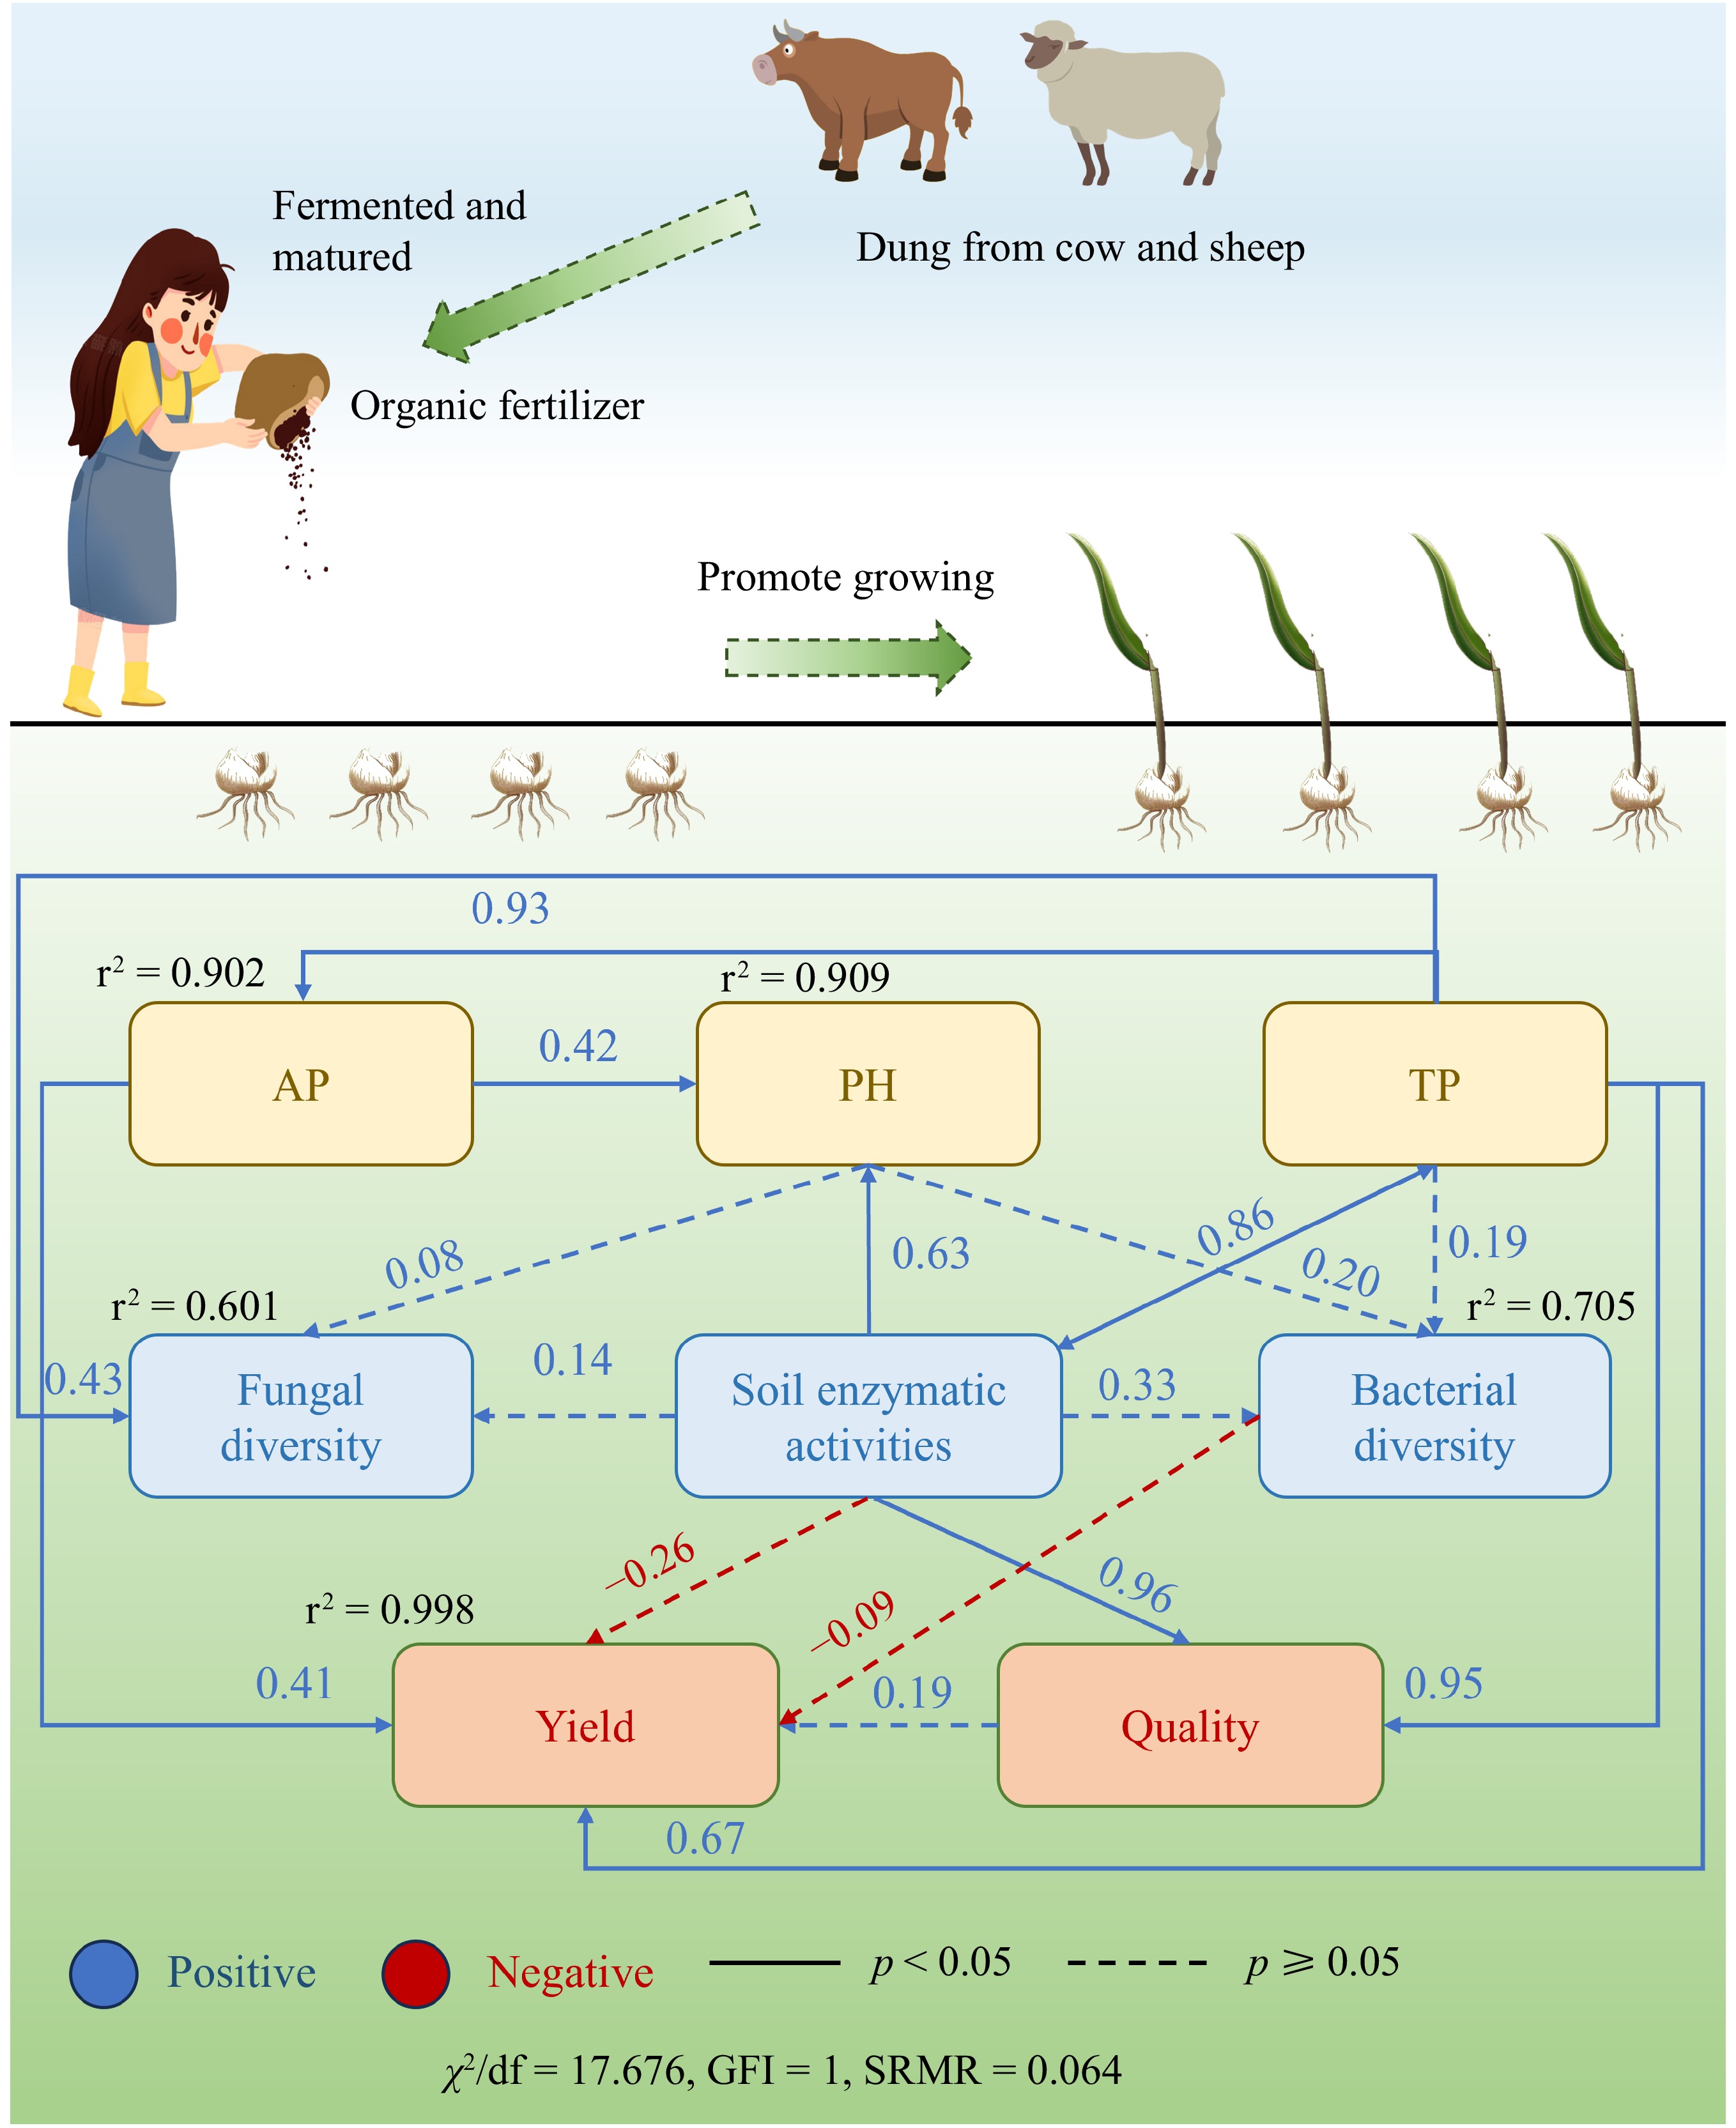
Figure 10.
Structural equation modeling results describing the relationship among soil nutrients, microbial diversity, and F. unibracteata yield and quality. The relationship among soil pH value, total soil phosphorus content (TP), available phosphorus (AP), F. unibracteata production, and F. unibracteata quality with bacterial diversity, fungal diversity, and soil enzymatic activities. Blue lines: positive correlation; full line: p < 0.05; dotted line: p ≥ 0.05. The numbers above the arrows indicate correlation strength. r2 denotes explained variance score. χ2, Chi-square; df, degrees of freedom; SRMR, standardized root mean square residual.
-
Soil physicochemical
propertiesCK CF (24.3 t·ha−1) SF (43.7 t·ha−1) pH 7.94a ± 0.40 8.04b ± 0.40 8.08c ± 0.40 TOC (g·kg−1) 24.55b ± 1.31 24.70a ± 0.80 24.19b ± 0.69 TN (g·kg−1) 2.34a ± 0.07 2.33a ± 0.02 2.38a ± 0.03 TP (g·kg−1) 0.93b ± 0.01 1.10a ± 0.01 1.11a ± 0.03 TK (g·kg−1) 21.34ab ± 0.37 21.57ab ± 0.30 22.11b ± 0.66 AN (mg·kg−1) 141.06c ± 7.05 152.76a ± 7.64 146.57b ± 7.33 AK (mg·kg−1) 134.01c ± 6.70 215.03a ± 1.73 170.33b ± 8.52 AP (mg·kg−1) 19.21c ± 0.96 48.12a ± 2.40 41.41b ± 2.07 CK: no fertilizer treatment, CF: cow manure organic fertilizer treatment, SF: sheep manure organic fertilizer treatment. pH stands for soil pH; TOC represents soil total organic carbon content, g·kg−1; TN stands for soil total nitrogen content, g·kg−1; TP represents soil total phosphorus content, g·kg−1; TK represents soil total potassium content, g·kg−1; AN stands for soil available nitrogen content, mg·kg−1; AK stands for soil available potassium content, mg·kg−1; AP stands for soil available phosphorus content, mg·kg−1. Different letters (a, b, c) on the same row indicate values that are significantly different (p < 0.05) based on one-way ANOVA and LSD post-hoc test, the numbers after '±' represent the standard error values. Table 1.
Soil chemical properties under different fertilization treatments.
-
Soil enzyme
activitiesCK CF (24.3 t·ha−1) SF (43.7 t·ha−1) S-CAT (mL·g−1) 3.57b ± 0.18 3.33ab ± 0.17 3.88a ± 0.19 S-SC (mg·d−1·g−1) 88.81a ± 4.44 89.39a ± 4.47 95.62a ± 4.78 S-UE (mg·d−1·g−1) 0.59c ± 0.03 0.85b ± 0.04 0.95a ± 0.05 S-NP (mg·d−1·g−1) 2.89a ± 0.14 3.09a ± 0.15 3.05a ± 0.15 S-PPO (mg·g−1·2h−1) 0.87a ± 0.04 0.74c ± 0.04 0.73b ± 0.04 S-β-GC (μg·g−1·h−1) 139.56a ± 6.98 133.15a ± 6.66 143.31a ± 7.17 S-DHA (μg·g−1·d−1) 90.58a ± 4.53 88.67a ± 4.43 165.03b ± 8.25 S-CAT represents soil catalase content, mL·g−1; S-SC represents soil sucrase content, mg·d−1·g−1; S-UE represents soil urease content, mg·d−1·g−1; S-NP represents soil neutral phosphatase content, mg·d−1·g−1; S-PPO represents soil polyphenol oxidase content, mg·g−1·2h−1; S-β-GC represents soil β-glucosidase content, μg·g−1·h−1; S-DHA represents soil dehydrogenase content, μg·g−1·d−1. Different letters (a, b, c,) on the same row indicate values that are significantly different (p < 0.05) based on one-way ANOVA and LSD post-hoc test, the numbers after '±' represent the standard error values. Table 2.
Soil enzyme activity content under different treatments.
-
Treatment
groupWeighing before fertilization (g) Weight at
harvest (g)Yield increasing rate (%) CK (0 t·ha−1) 164.62 ± 8.23 383.61 ± 19.18 0.00% CF1 (7.5 t·ha−1) 156.73 ± 7.84 425.75 ± 21.29* 38.59%* CF2 (13.5 t·ha−1) 164.04 ± 8.2 427.22 ± 21.36* 27.41%* CF3 (24.3 t·ha−1) 151.9 ± 7.59 535.53 ± 26.78* 119.45%* CF4 (43.7 t·ha−1) 178.25 ± 8.91 507.44 ± 25.37* 51.67%* CF5 (78.7 t·ha−1) 178.21 ± 8.91 418.3 ± 20.92 1.63% SF1 (7.5 t·ha−1) 165.02 ± 8.25 501.31 ± 25.07* 70.72%* SF2 (13.5 t·ha−1) 170.48 ± 8.52 492.94 ± 24.65* 56.18%* SF3 (24.3 t·ha−1) 171.55 ± 8.58 521.85 ± 26.09* 71.17%* SF4 (43.7 t·ha−1) 163.05 ± 8.15 538.44 ± 26.92* 97.22%* SF5 (78.7 t·ha−1) 160.96 ± 8.05 412.36 ± 20.62 23.19%* CK: no fertilizer treatment, CF: cow manure organic fertilizer treatment, SF: sheep manure organic fertilizer treatment. * indicates statistically significant comparisons with the CK on the same columns (p < 0.05) based on one-way ANOVA and LSD post-hoc test, the numbers after '±' represent the standard error values. Table 3.
Yield of F. unibracteata under different fertilization treatments.
Figures
(10)
Tables
(3)