-
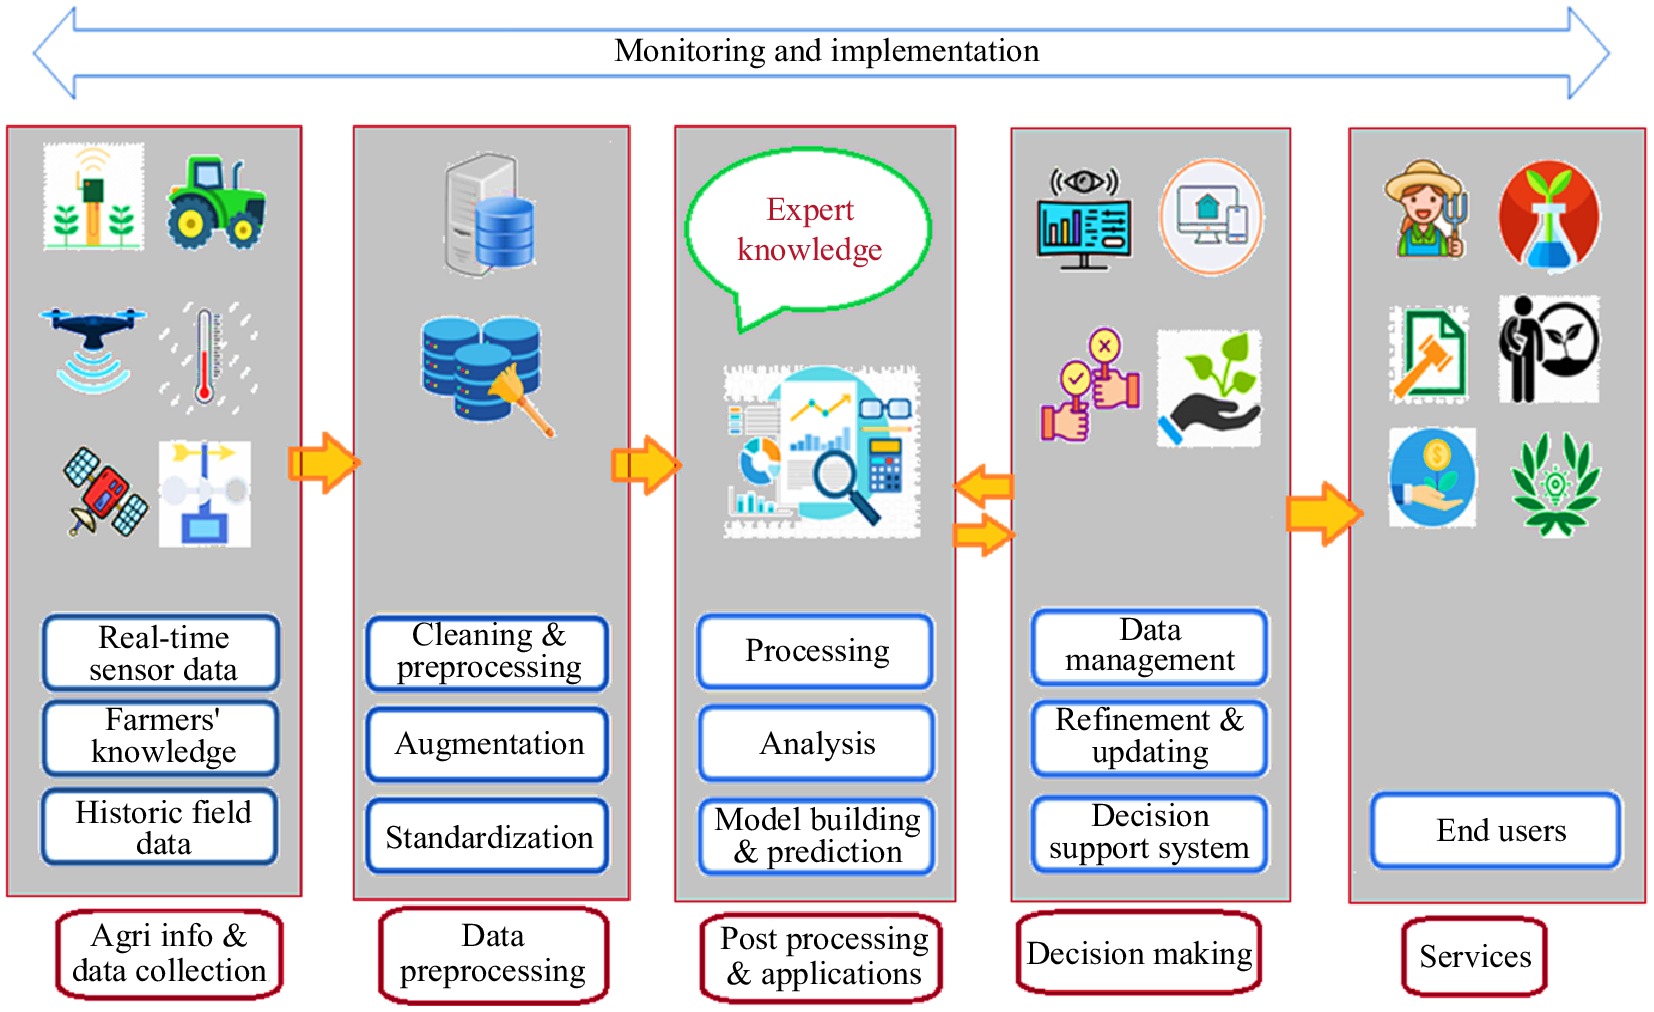
Figure 1.
An overview of the hierarchy of digital agricultural systems from data collection in the field to decision-making and services (from left to right), modified from Amiri-Zarandi et al.[26].
-
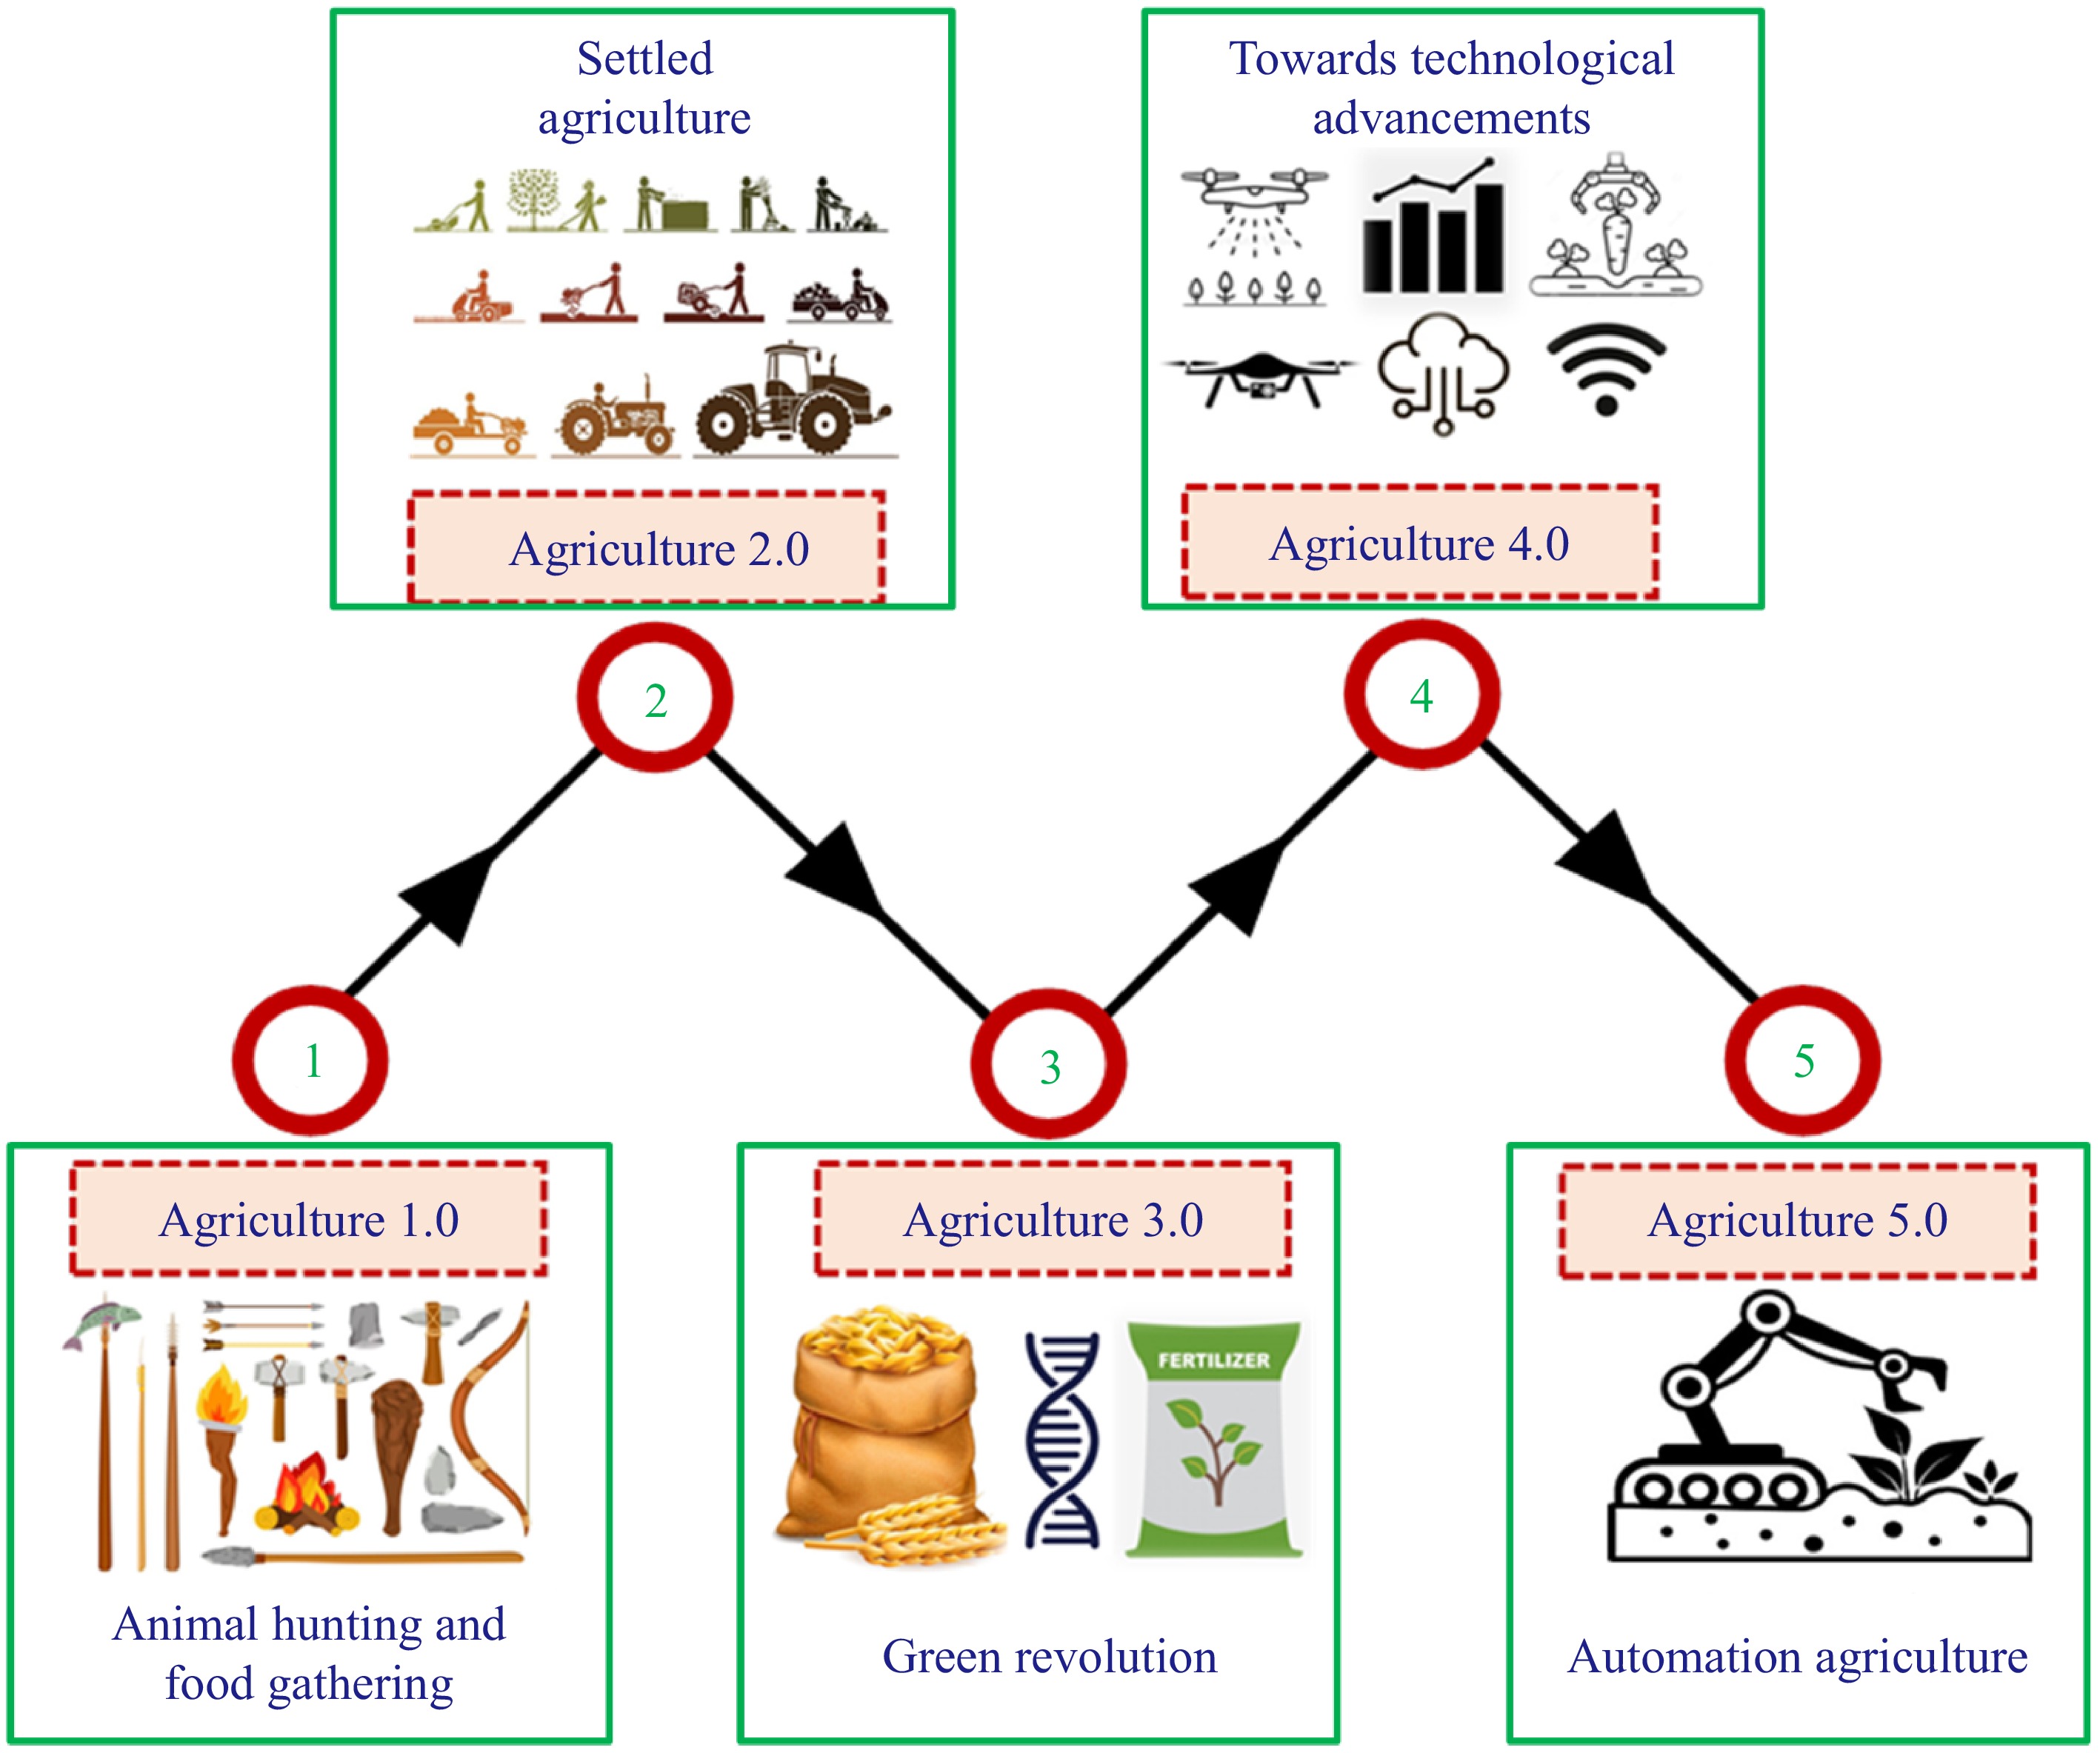
Figure 2.
A pictorial overview of agricultural transformation from manual to automated operation from Agriculture 1.0 to 5.0.
-
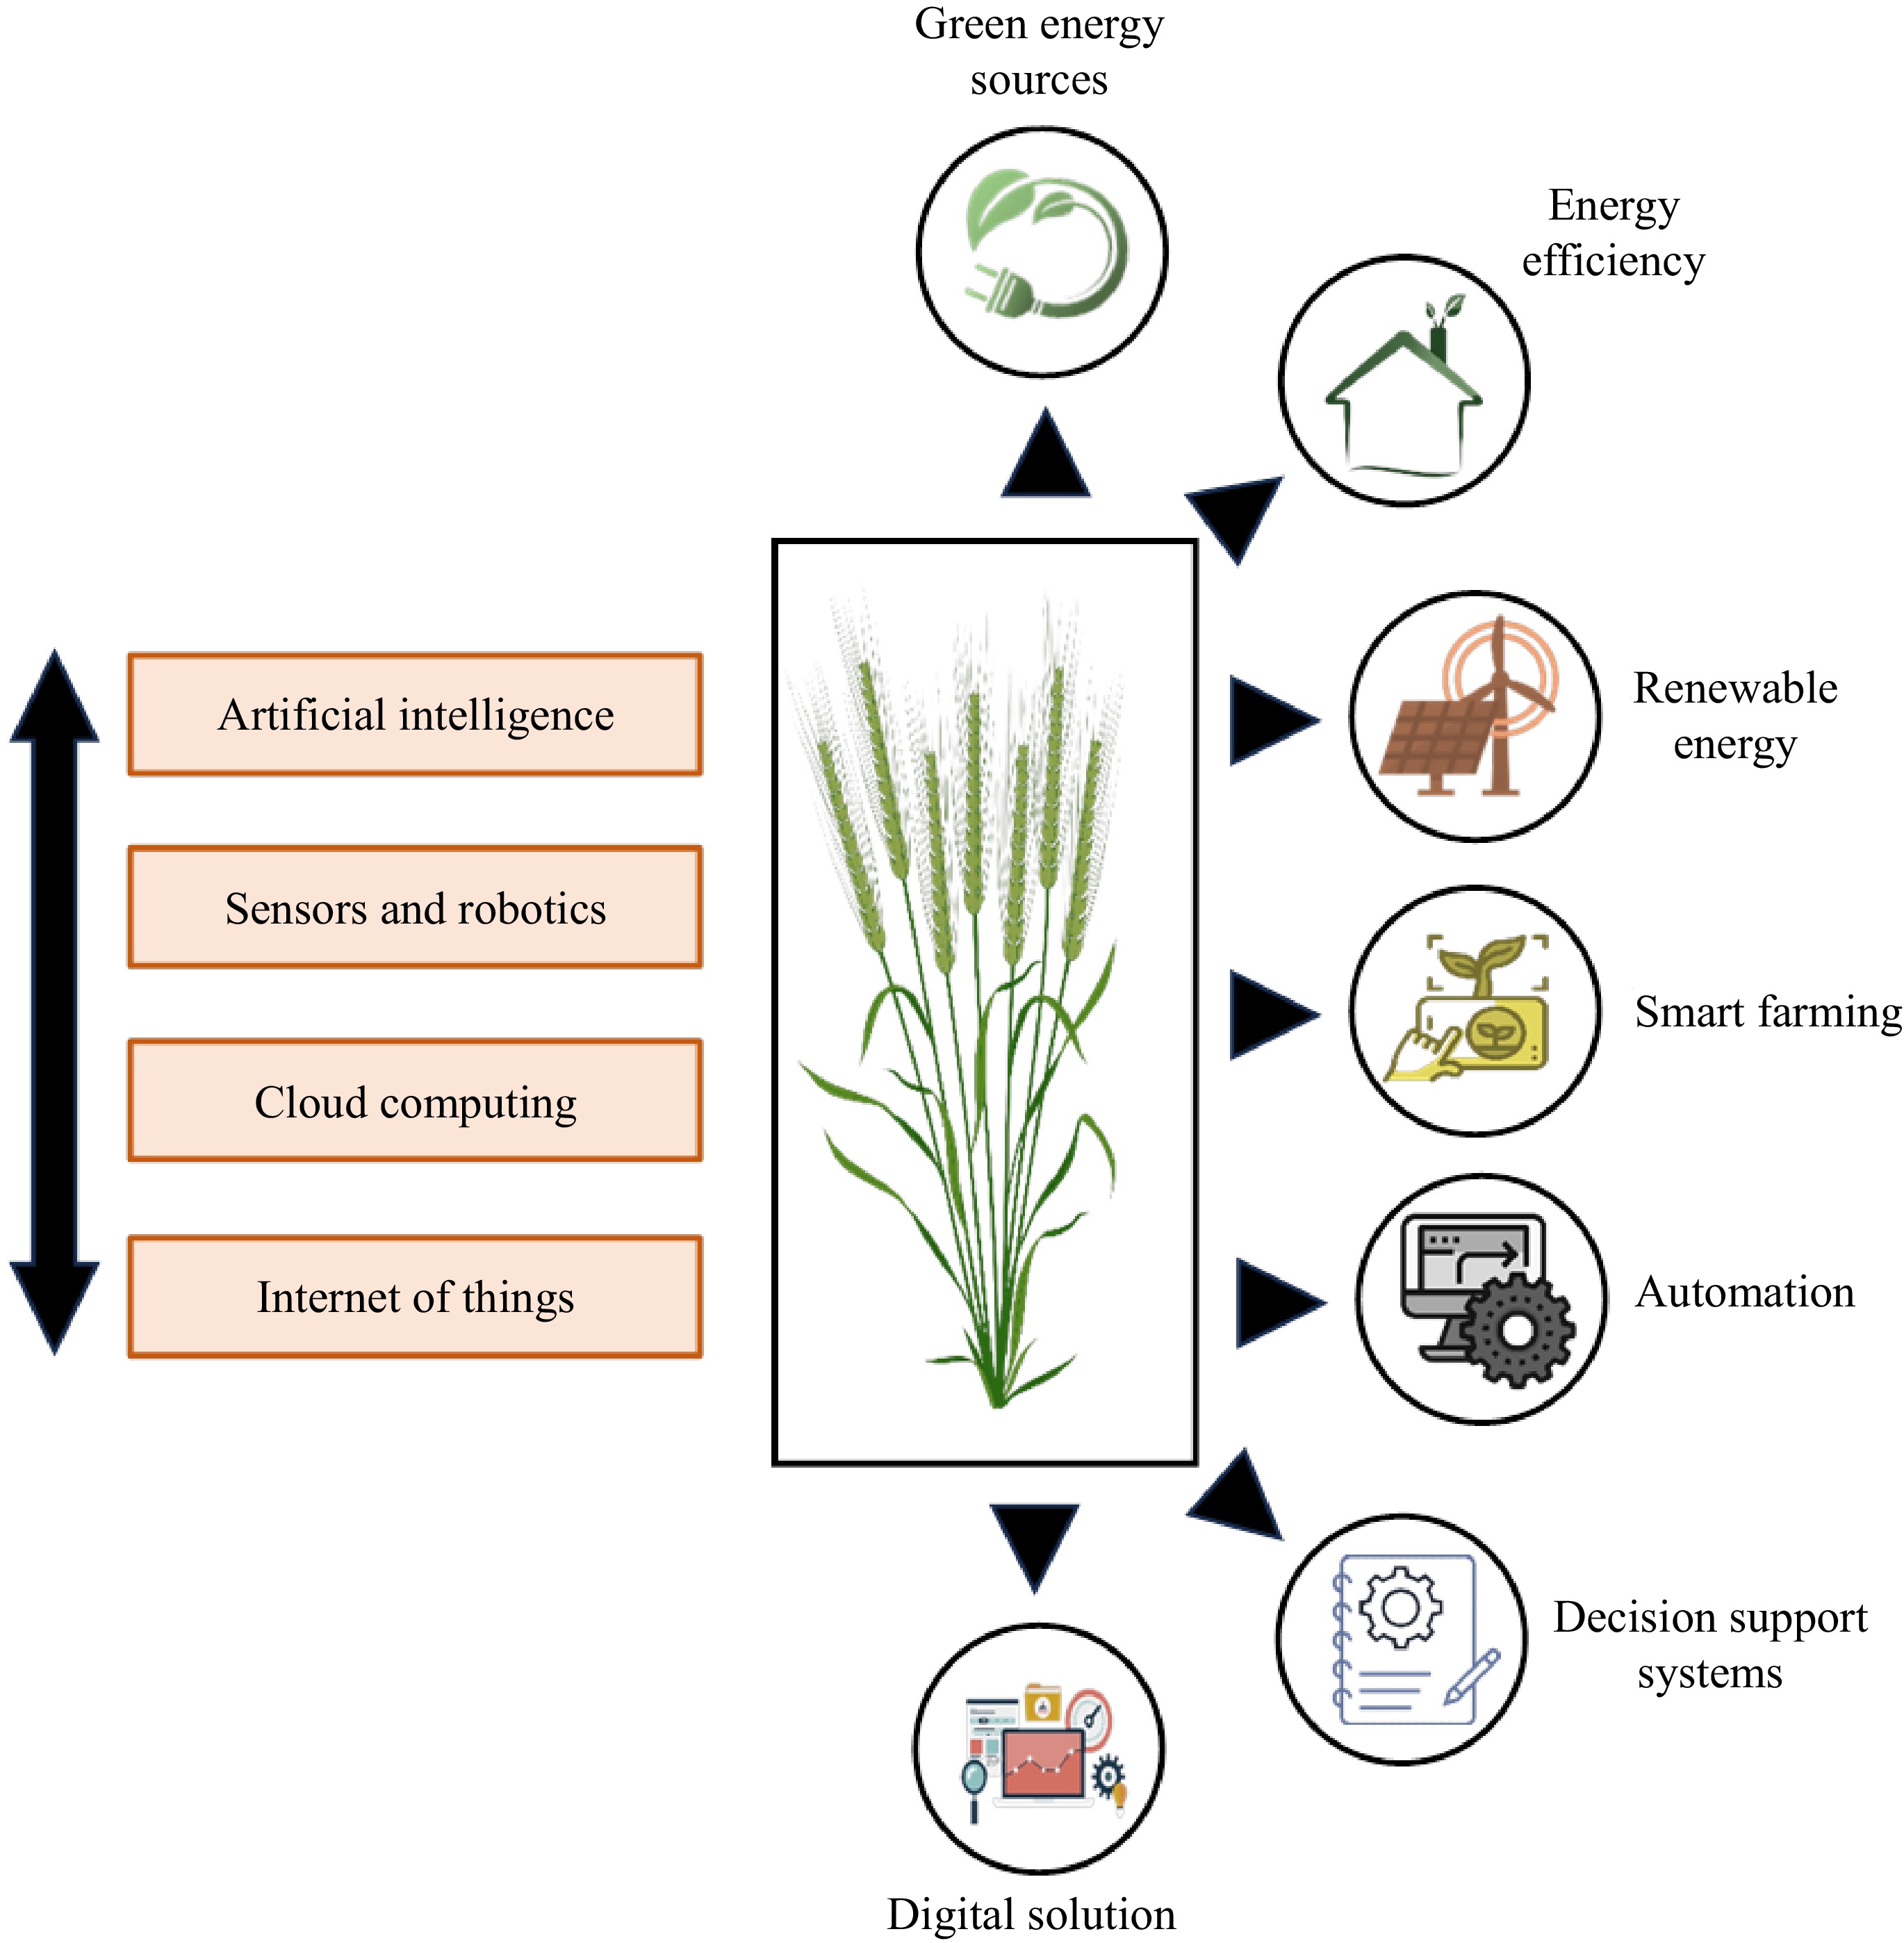
Figure 3.
Adoption of smart technologies for sustainable agricultural practices and digitalization.
-
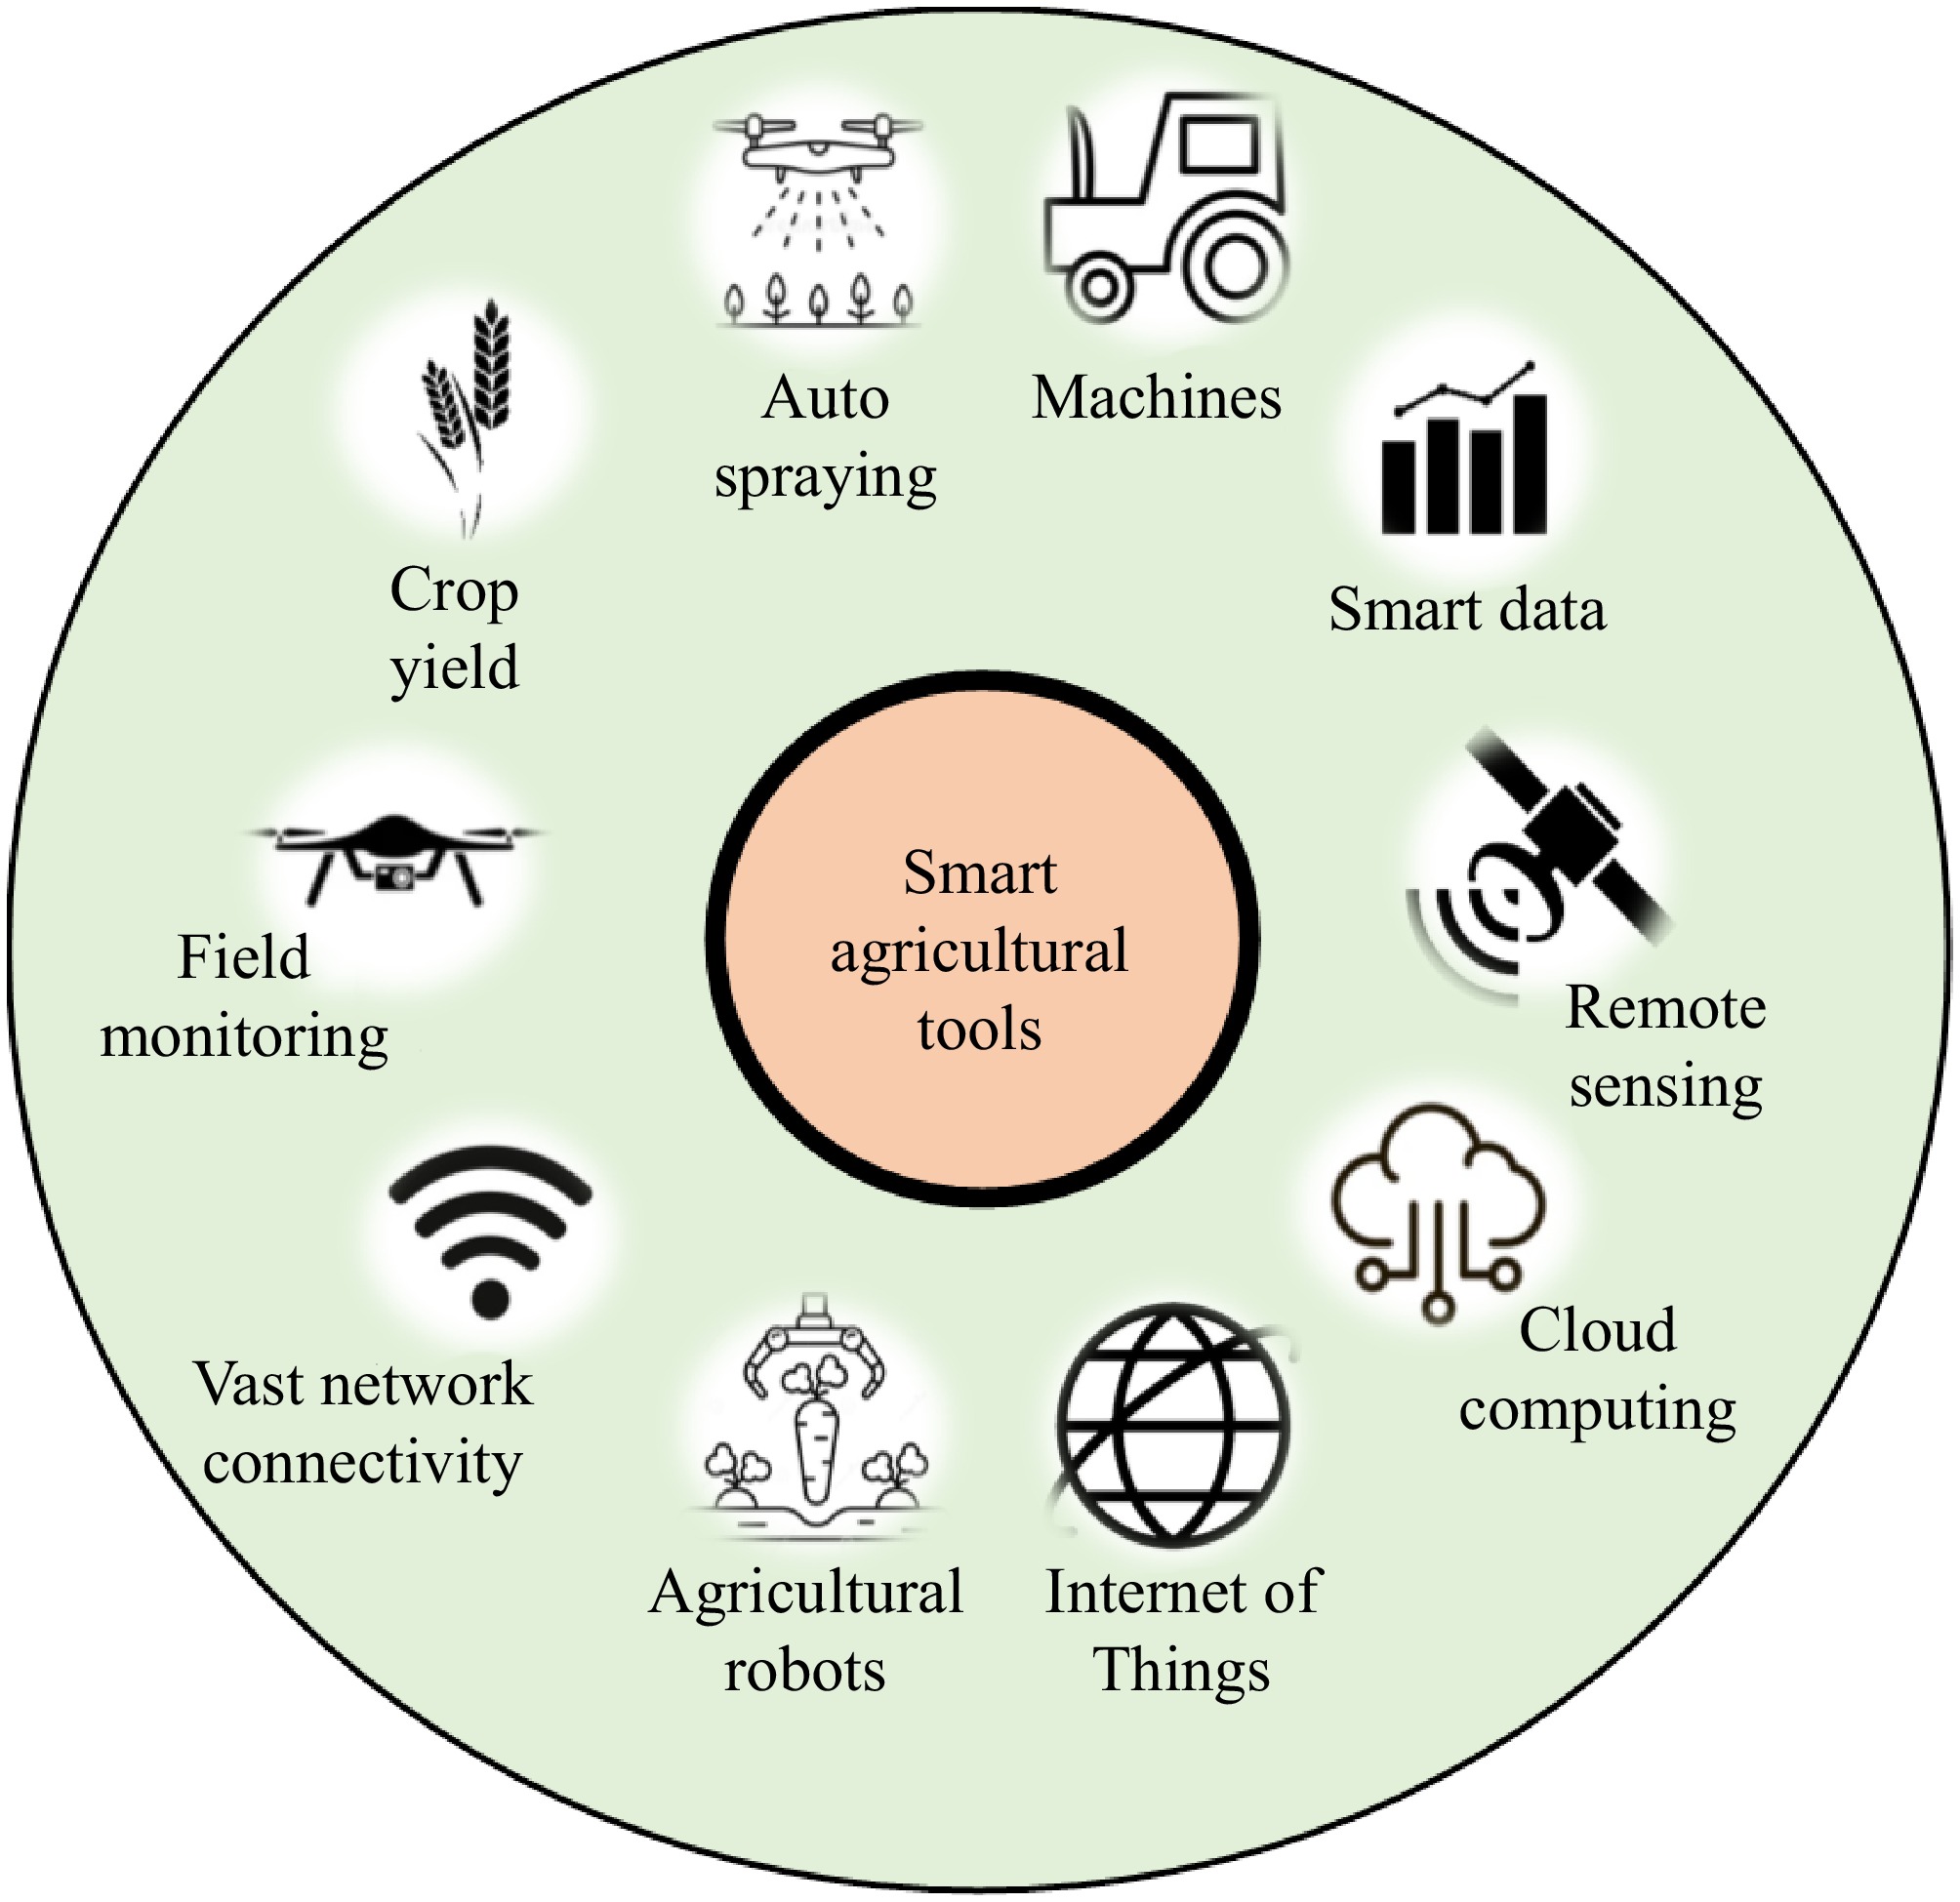
Figure 4.
Tools associated with smart and digital agricultural systems.
-
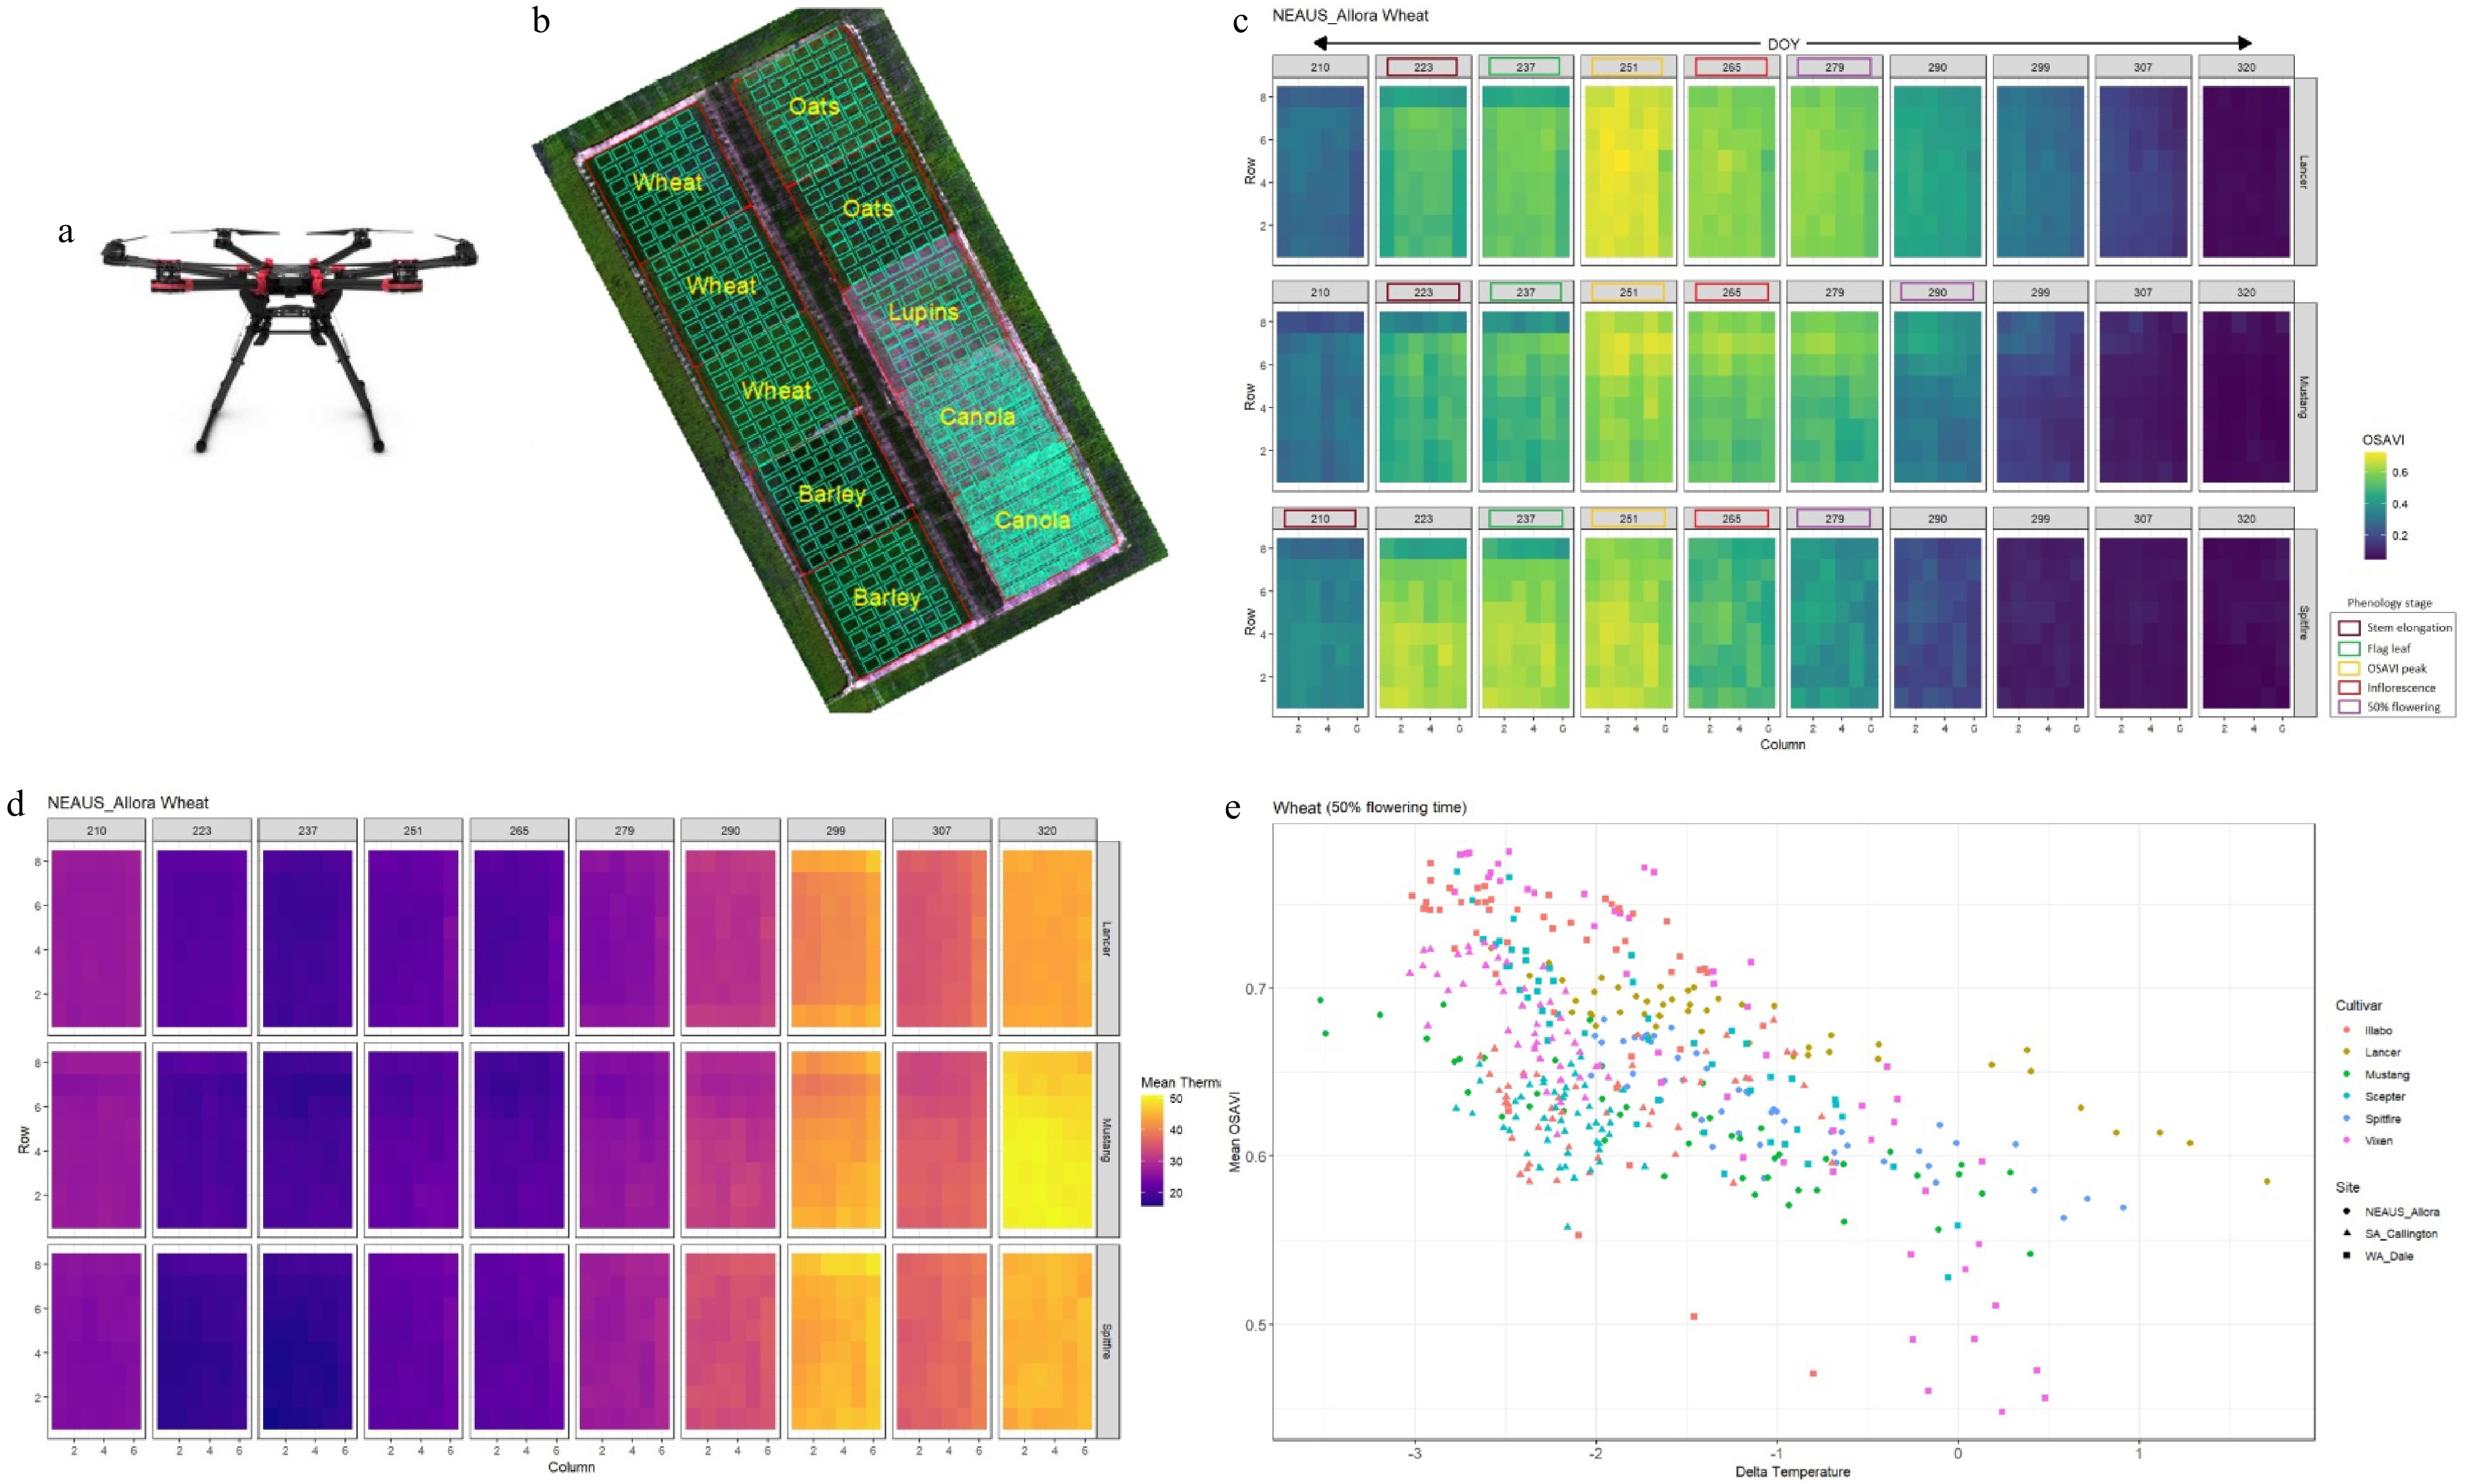
Figure 5.
(a) A UAV platform (DJI Matrice Hexacopter). (b) A composite five-band (blue, green, red, near-infrared, and longwave thermal infrared) multispectral image of a large multicropping field in Australia captured using the UAV. Each plot (60 m × 60 m) represents each crop and its different cultivars. The green rectangular boxes within each plot represent the gridded (6 m × 10 m) profile of each crop and/or cultivar to determine spatial variability within each plot (60 m × 60 m). (c) The 'Xtractori' outcome derived from the UAV-multispectral images over the season shows spatial and temporal variations (across the season on the day of year (DOY)) in crop greenness and vigour based on an optimized soil adjusted vegetation index (OSAVI) among different cultivars (Lancer, Mustang, and Spitfire) of wheat in a northeastern Australian field (NEAUS). A number of vegetation and soil indices, including land surface and canopy temperatures, can be extracted from the 'Xtractori' program. Among others, OSAVI was used as an example case. The colour scale of the OSAVI (right side) indicates a value ranging between 0 and 1. When OSAVI > 0.5 indicates adequate crop greenness and vigour, an OSAVI < 0.5 indicates relatively low greenness. Phenology observations of the cultivars (stem elongation, flag leaf, 50% flowering, etc.) were mapped using different colours on the spatiotemporal gridded OSAVI profile to determine the relationships between phonological changes and changes in greenness and vigour of the culivars/crop across the season (DOYwise). (d) The 'Xtractori' program was effectively used on seasonal UAV-multispectral images to determine spatiotemporal variations (DOYwise) in canopy temperature dynamics (mean thermal) among different cultivars of wheat in the NEAUS field. (e) Integrated UAV-multispectral imagery and the 'Xtractori' program-derived OSAVI and Delta temperature (air temperature, canopy temperature) was closely correlated for different wheat cultivars at 50% flowering stage across different sites in Australia (NEAUS, South Australia (SA), and Western Australia (WA)) (data source: Das et al.[91]).
-
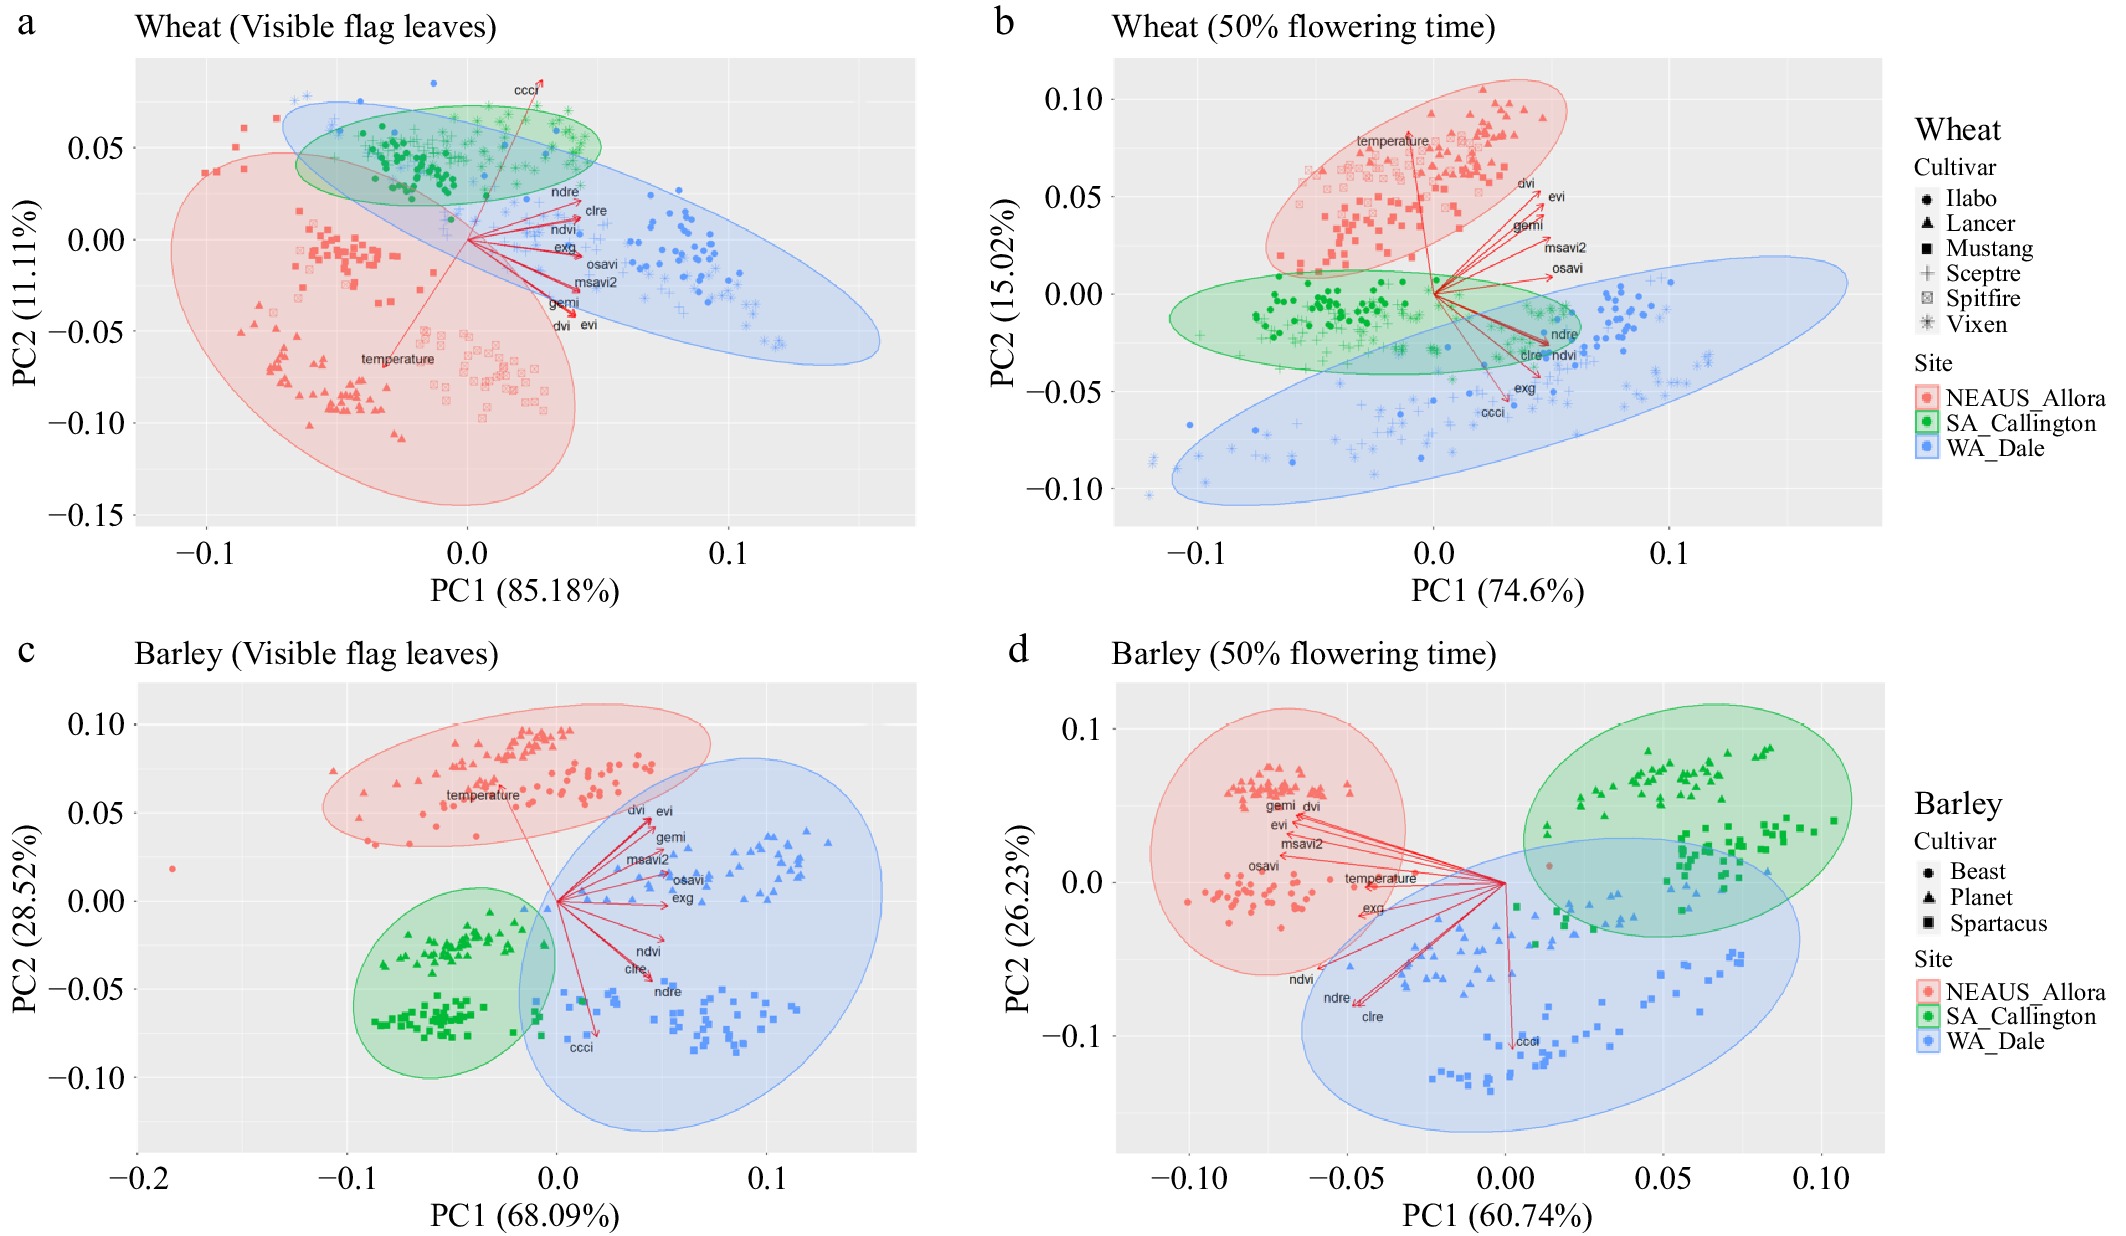
Figure 6.
Principal component analysis and clustering methods were applied to the UAV-multispectral images and the 'Xtractori'-derived multiple crop physiological and morphological traits, such as canopy temperature, canopy chlorophyll content index (ccci), chlorophyll rededge index (clre), normalized difference rededge index (ndre), normalized difference vegetation index (ndvi), excess green index (exg), optimized soil adjusted vegetation index (osavi), modified soil adjusted vegetation index 2 (msavi2), global environmental monitoring index (gemi), enhanced vegetation index (evi), and difference vegetation index (dvi), on different cultivars of wheat and barley crops across different sites in Australia (NEAUS, WA, and SA) to determine the associations and directions among the traits at different phenological stages. PCA biplots using two components (PC1 and PC2) indicating the interactions between crop traits and clustered datasets among cultivars across different sites and changes with the crop phenological stage: (a) wheat cultivars at the 'flag leaf' phenological stage; (b) wheat cultivars at the '50% flowering' phenological stage; (c) barley cultivars at the 'flag leaf' phenological stage; and (d) barley cultivars at the '50% flowering' phenological stage (data source: Das et al.[91]).
-
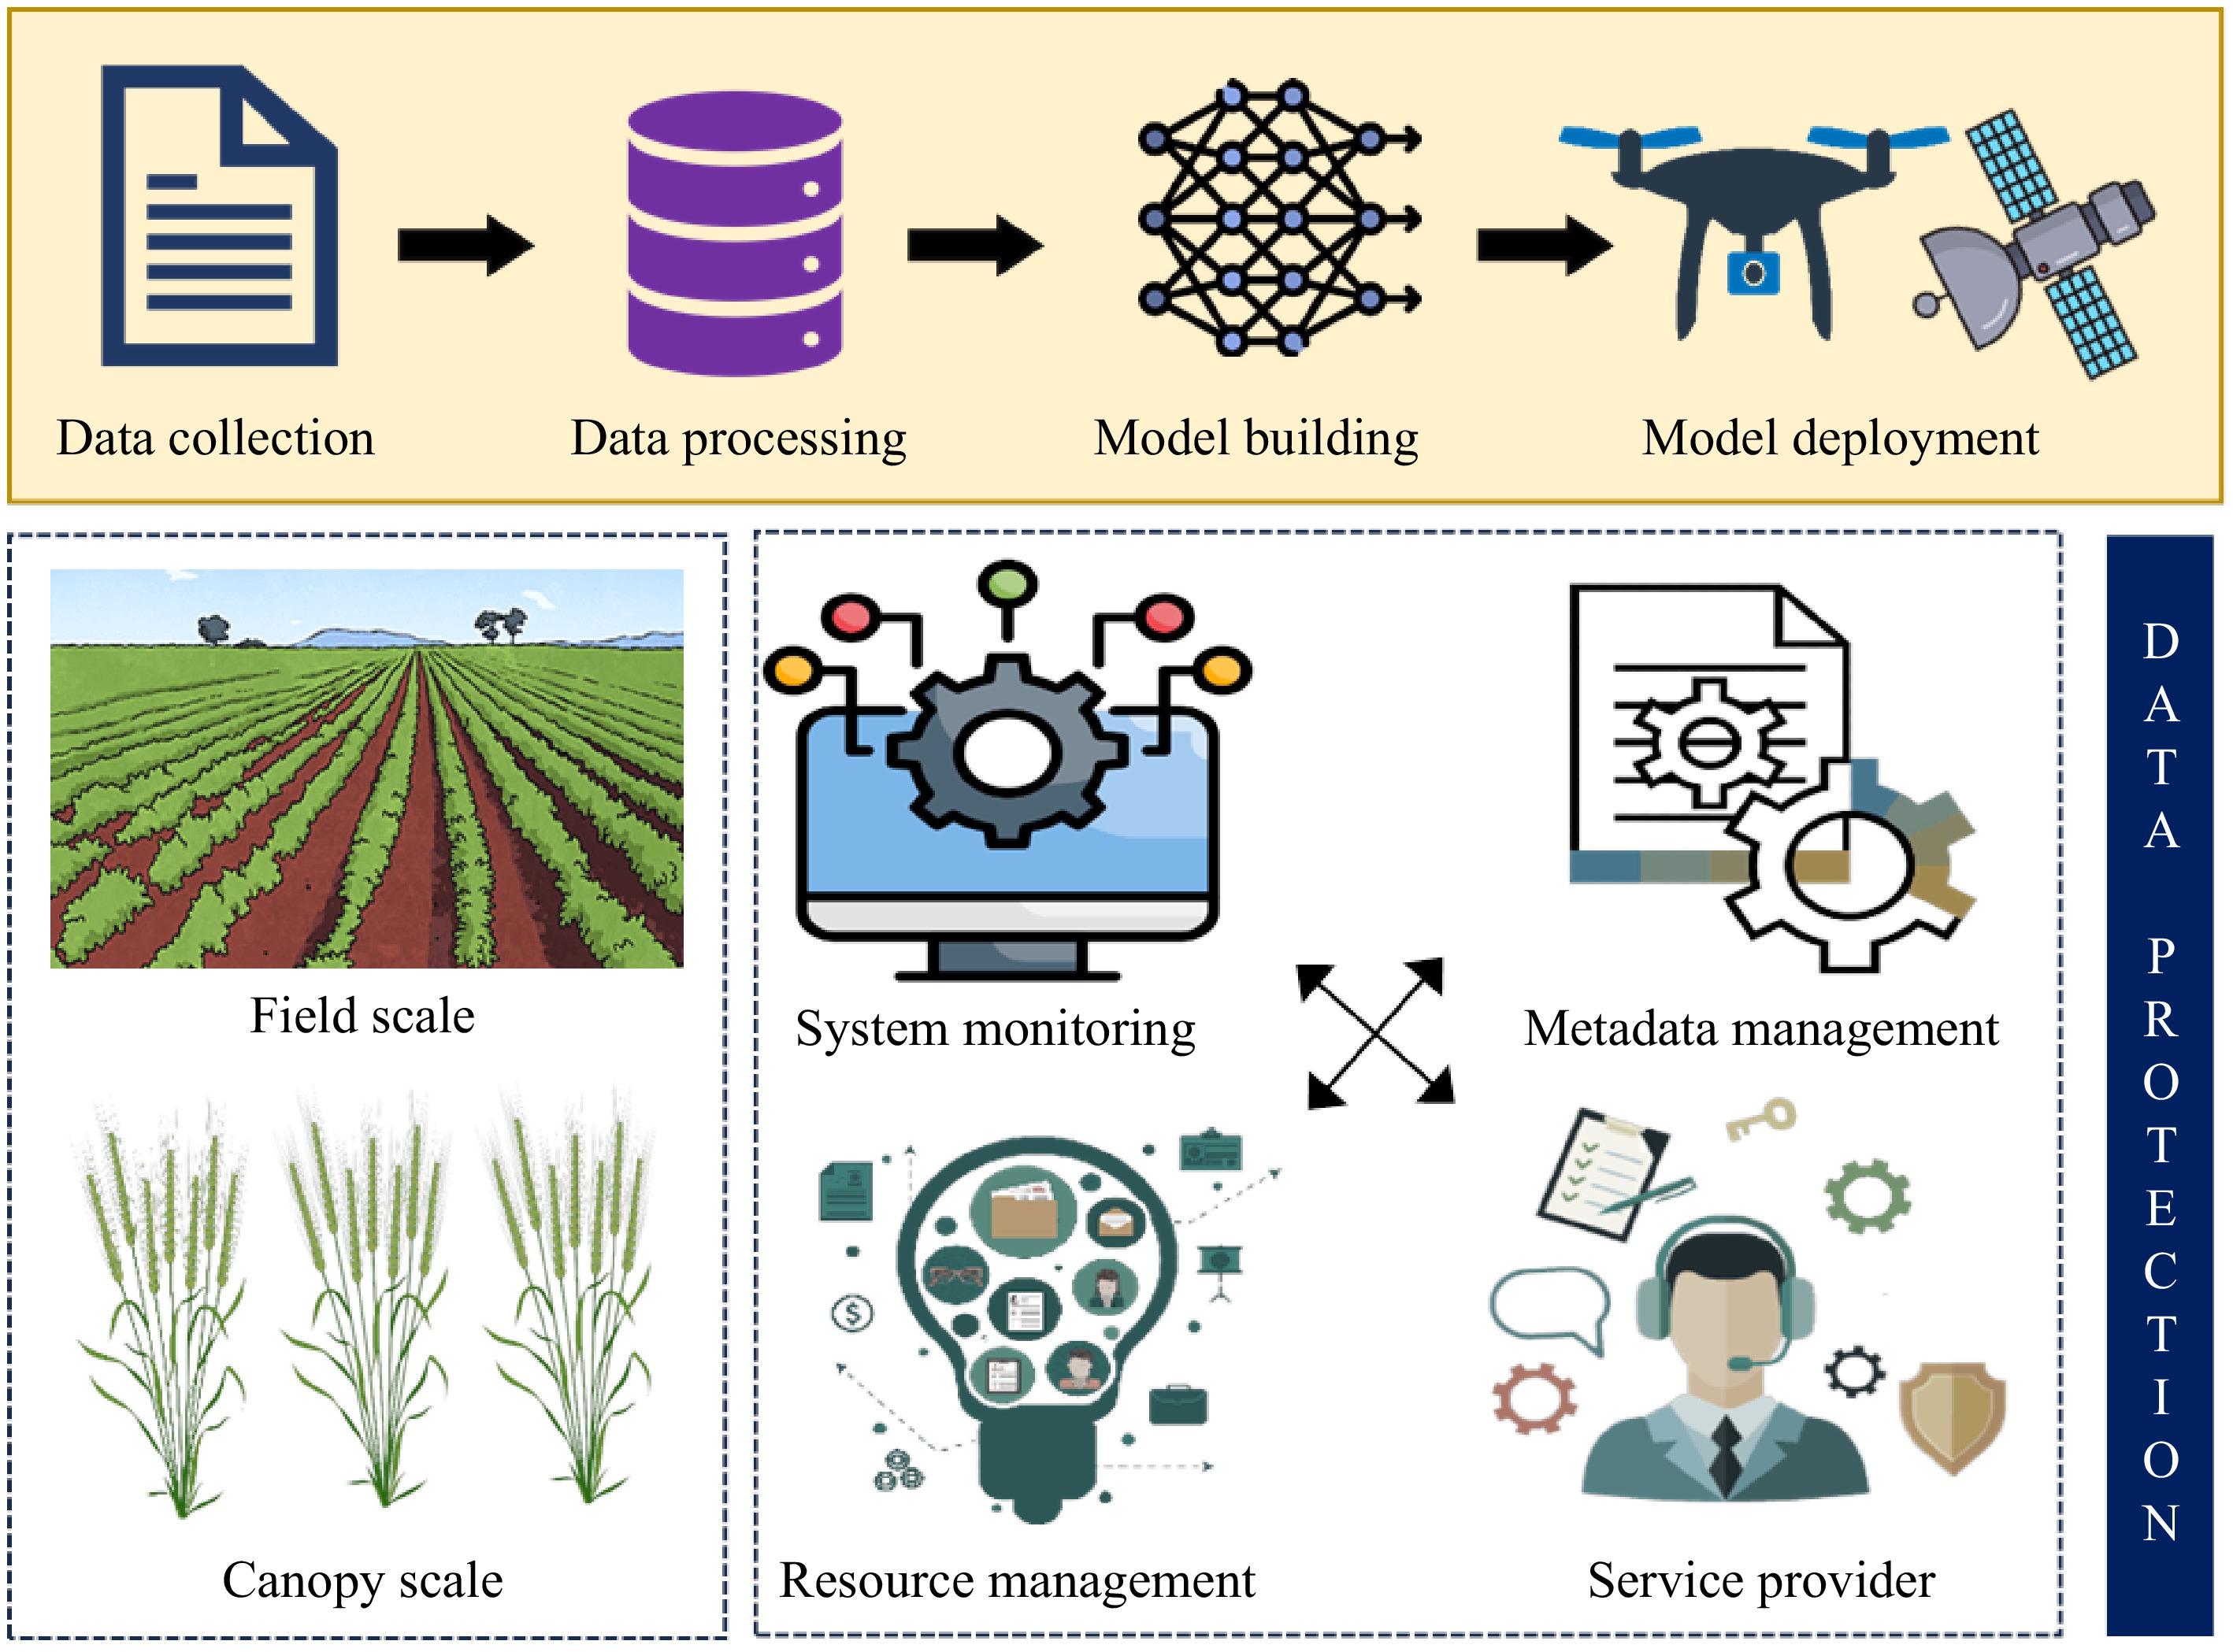
Figure 7.
Interconnections between agricultural data acquisition, data processing, model building and deployment, database generation, connections, and application building using digital technologies.
Figures
(7)
Tables
(0)