-
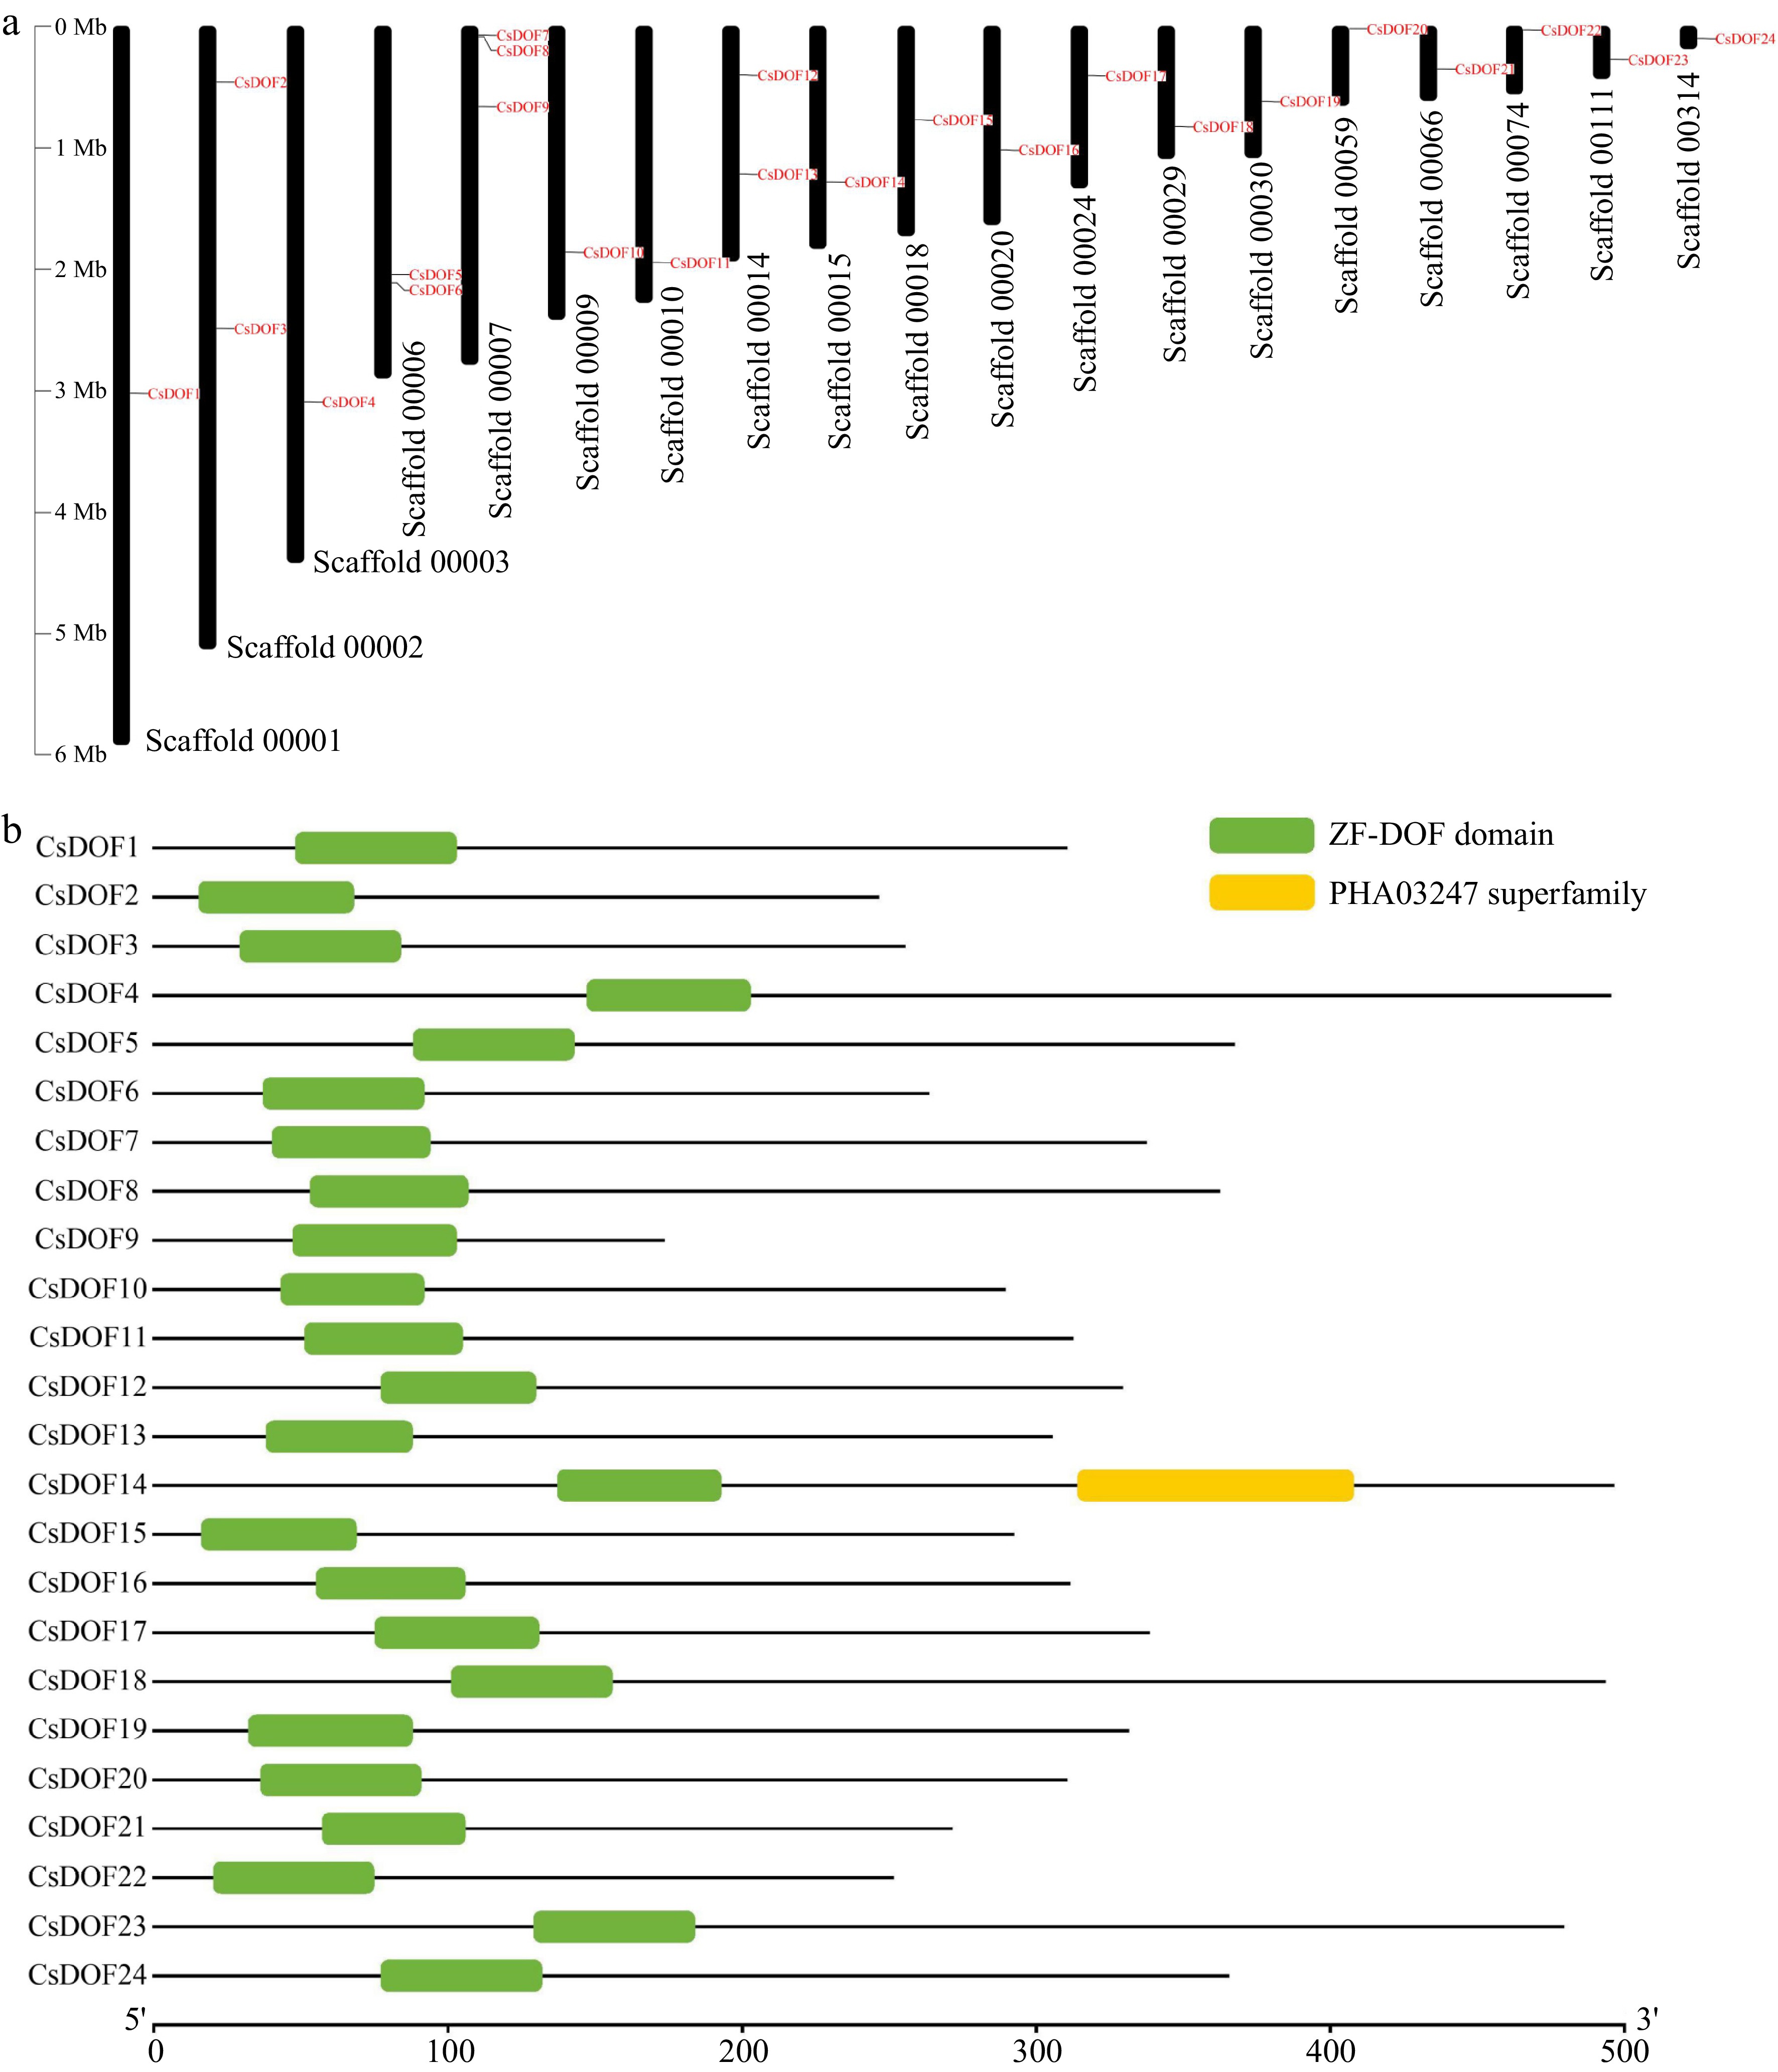
Figure 1.
Analysis of the position and structure of sweet orange DOF family members. (a) The positional information of CsDOF TFs on the chromosomes (scaffolds) of the sweet orange genome. (b) Conserved domain of CsDOF TFs.
-
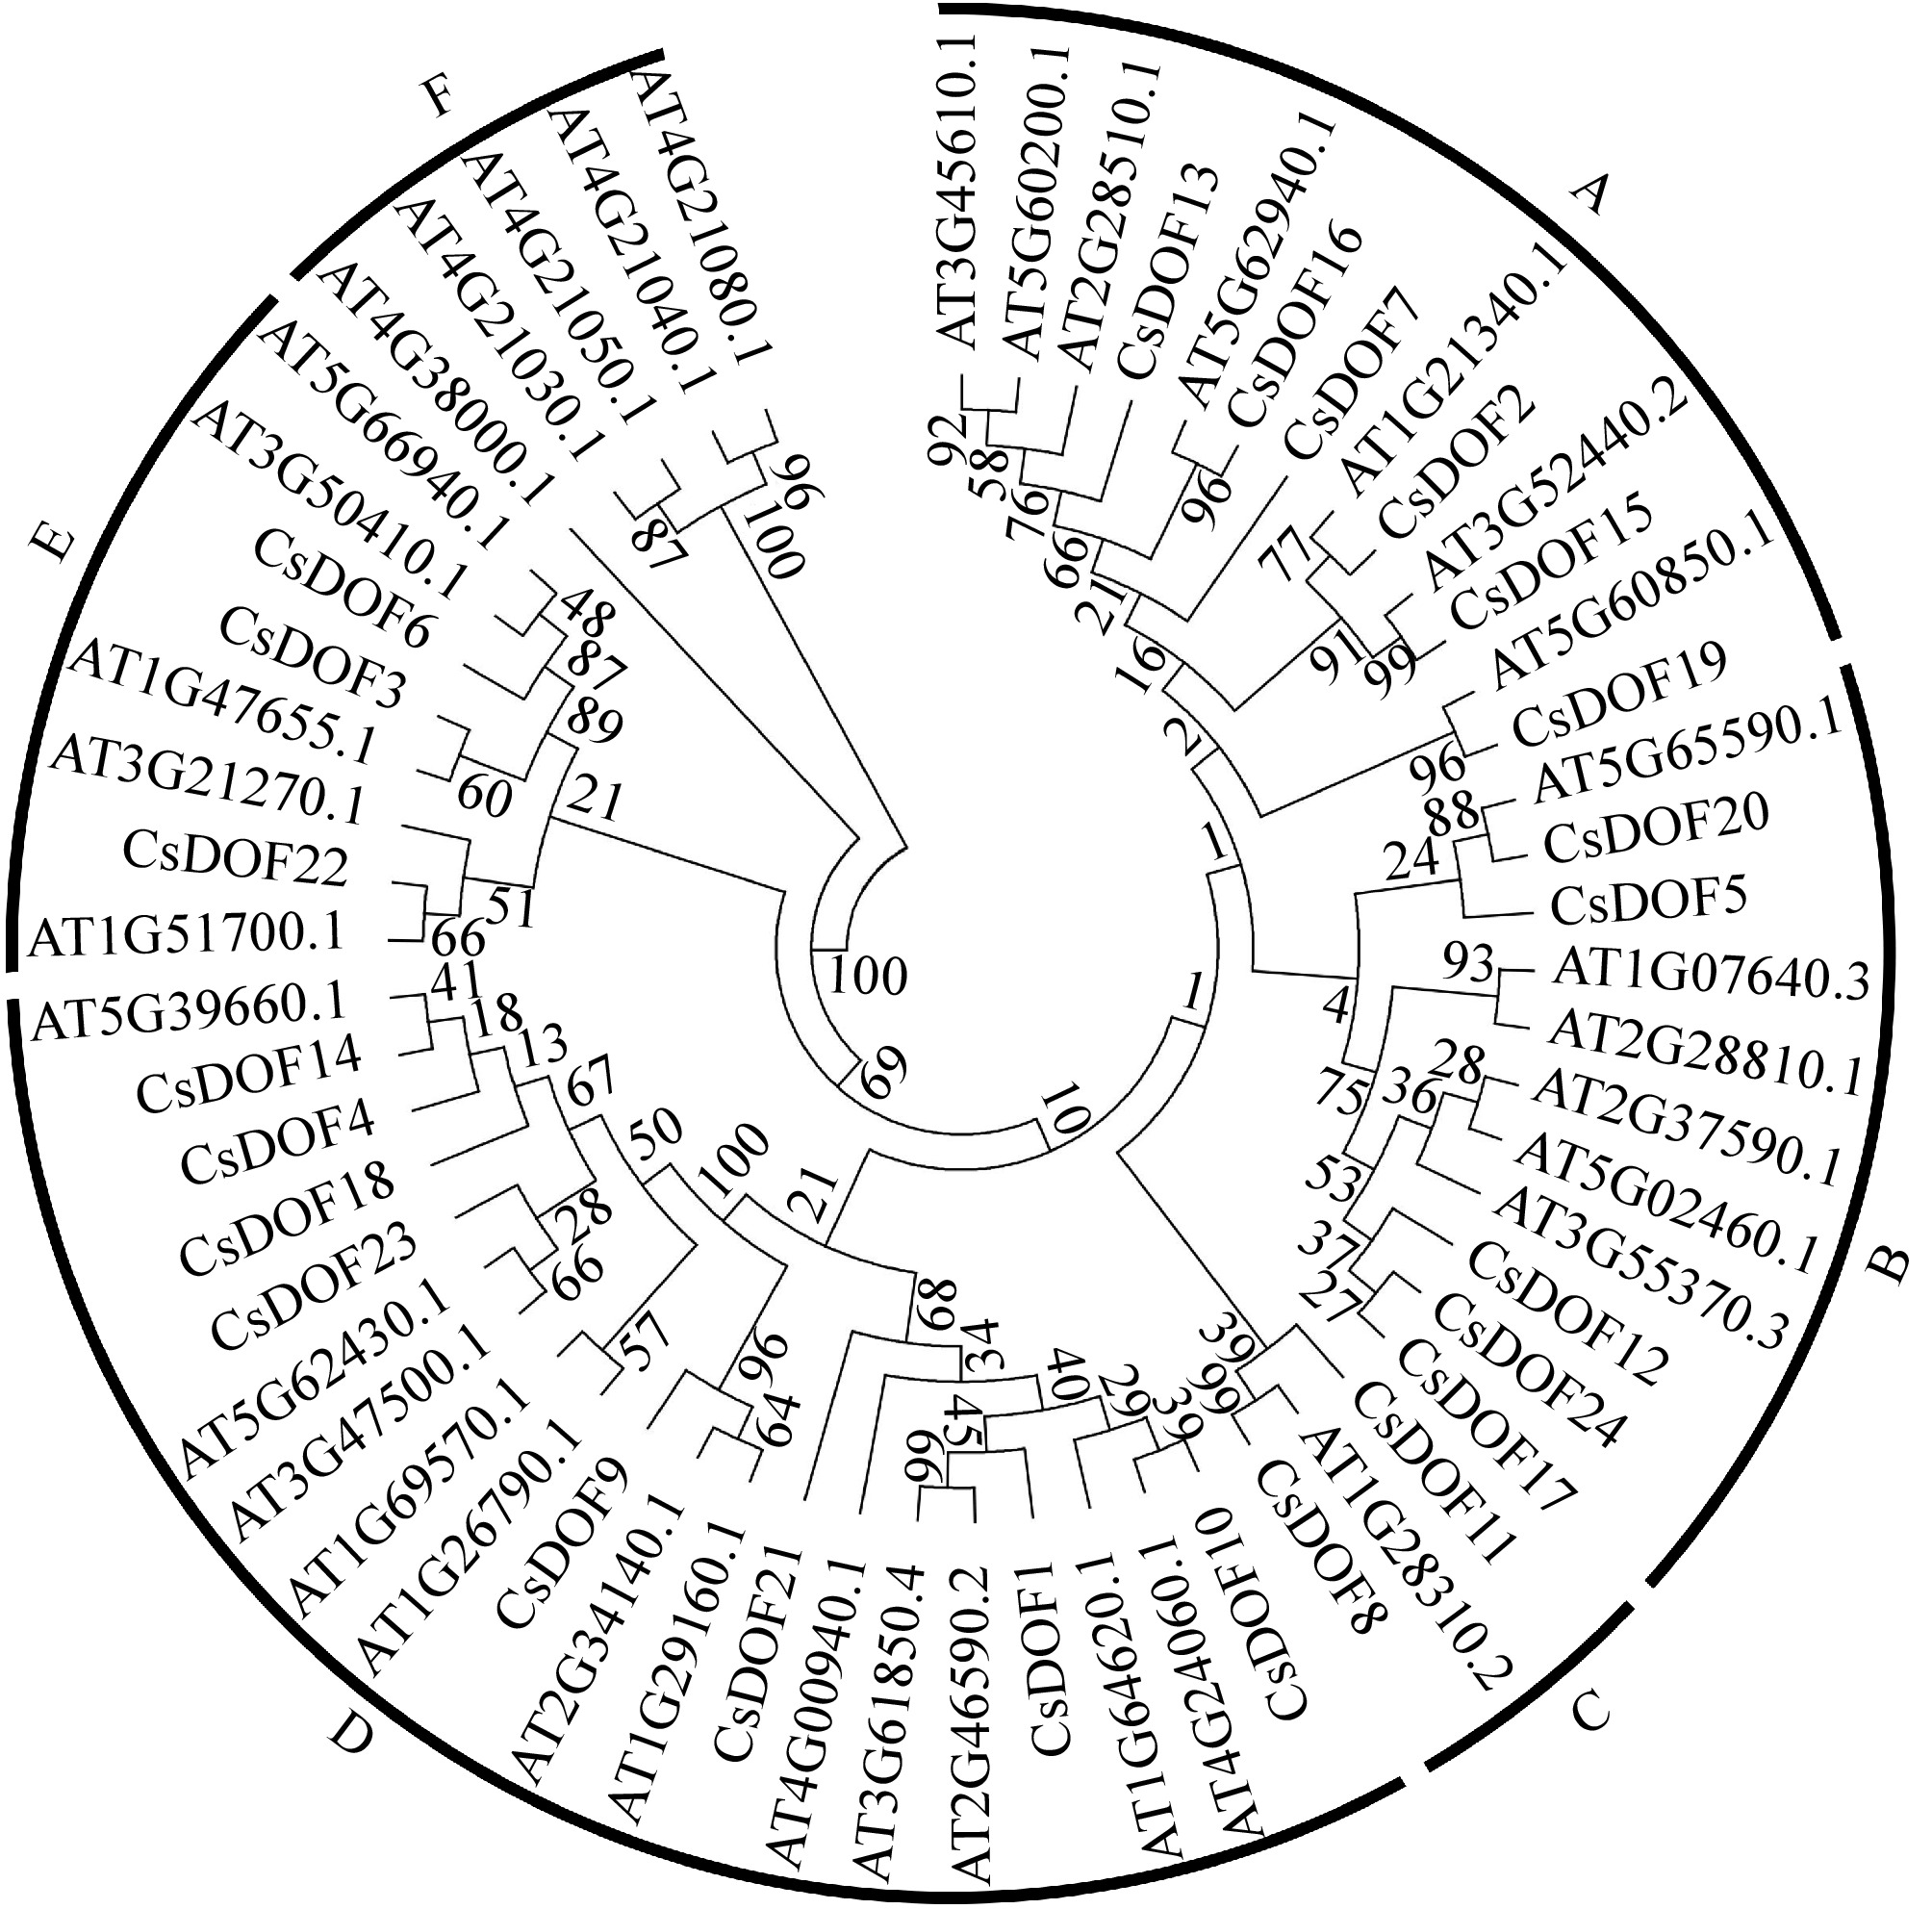
Figure 2.
Phylogenetic tree of CsDOFs from sweet orange and Arabidopsis. The complete amino acid sequences were aligned using ClustalX version 1.83, and a phylogenetic tree was generated with MEGA 7.0 employing the neighbor-joining method, supported by 1,000 bootstrap replicates.
-
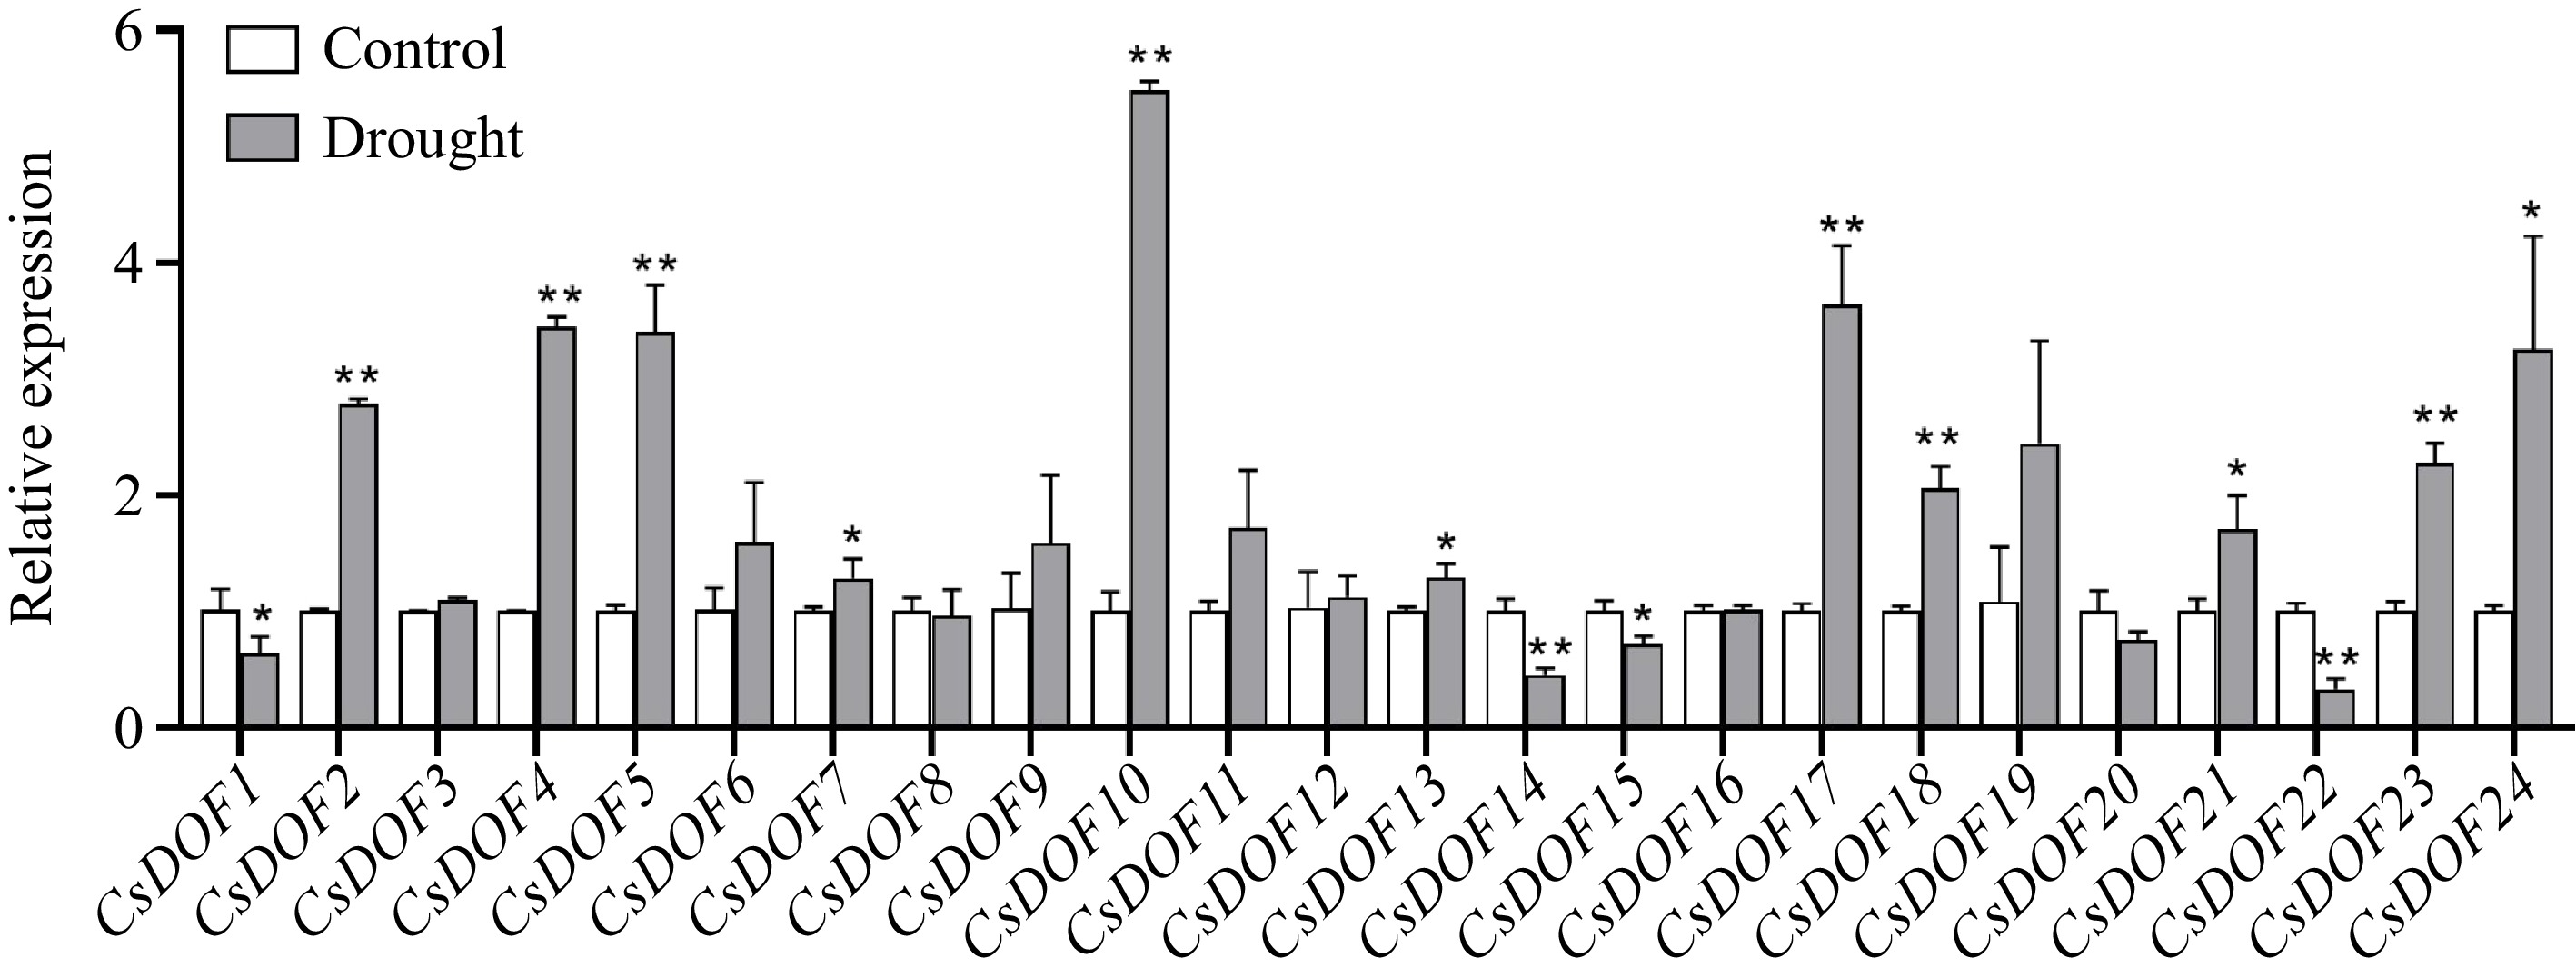
Figure 3.
Expression of CsDOFs in response to drought treatment. Fold changes of CsDOFs expression are shown. Error bars represent the standard deviations of means (n = 3). * and ** represent significant difference at p < 0.05 and p < 0.01, Students t-test (n = 3).
-
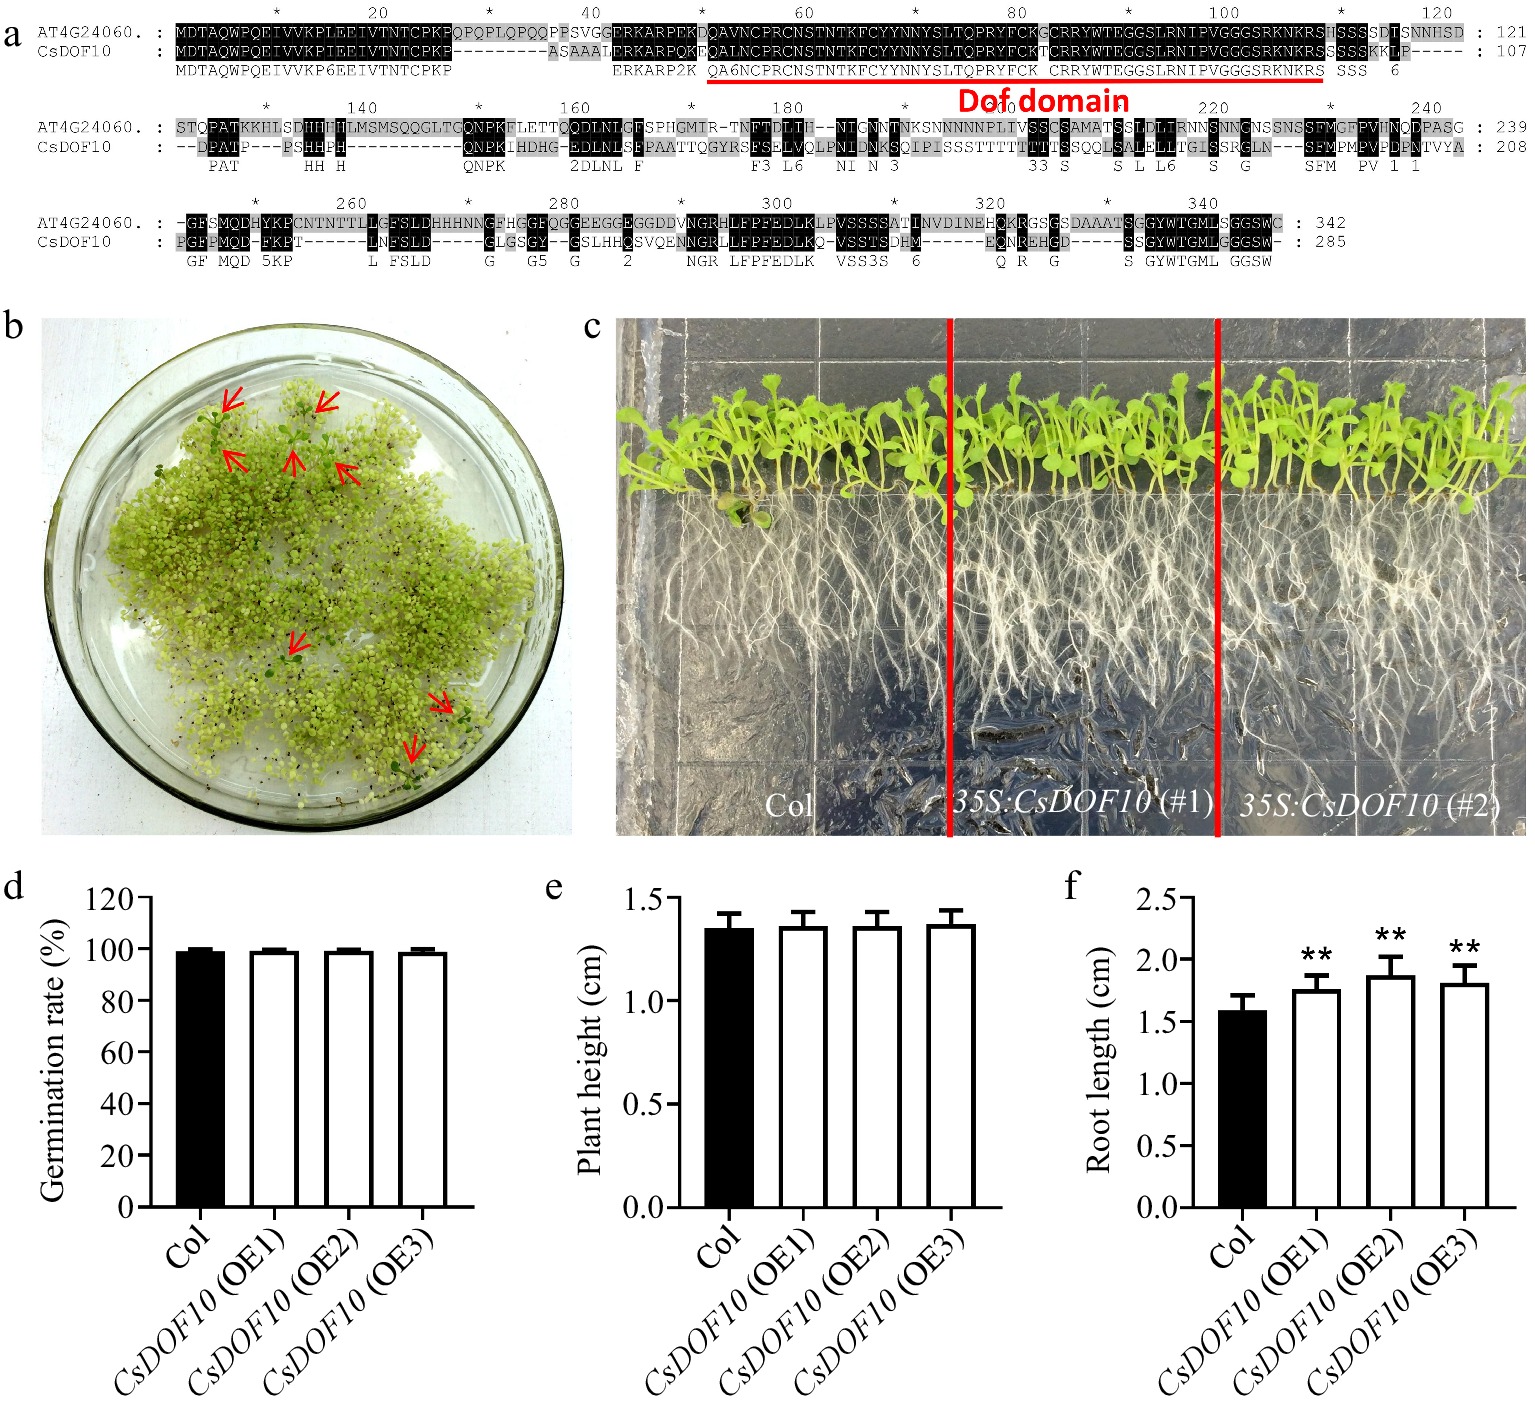
Figure 4.
Identification and functional study of CsDOF10 transgenic Arabidopsis. (a) Sequence alignment of CsDOF10 and Arabidopsis homologous protein AT4G24060 using ClustalX version 1.83. (b) Screening of transgenic positive seedlings using kanamycin. (c) Phenotypic analysis of root length in CsDOF10 transgenic Arabidopsis. (d) Statistical evaluation of seed germination rates in transgenic seedlings compared to wild-type controls. (e) Measurement of plant height in transgenic seedlings and controls. (f) Comparison of root lengths between transgenic seedlings and controls. Error bars represent the standard deviations of means (n = 10). ** represent significant difference at p < 0.01, Students t-test (n = 10).
-
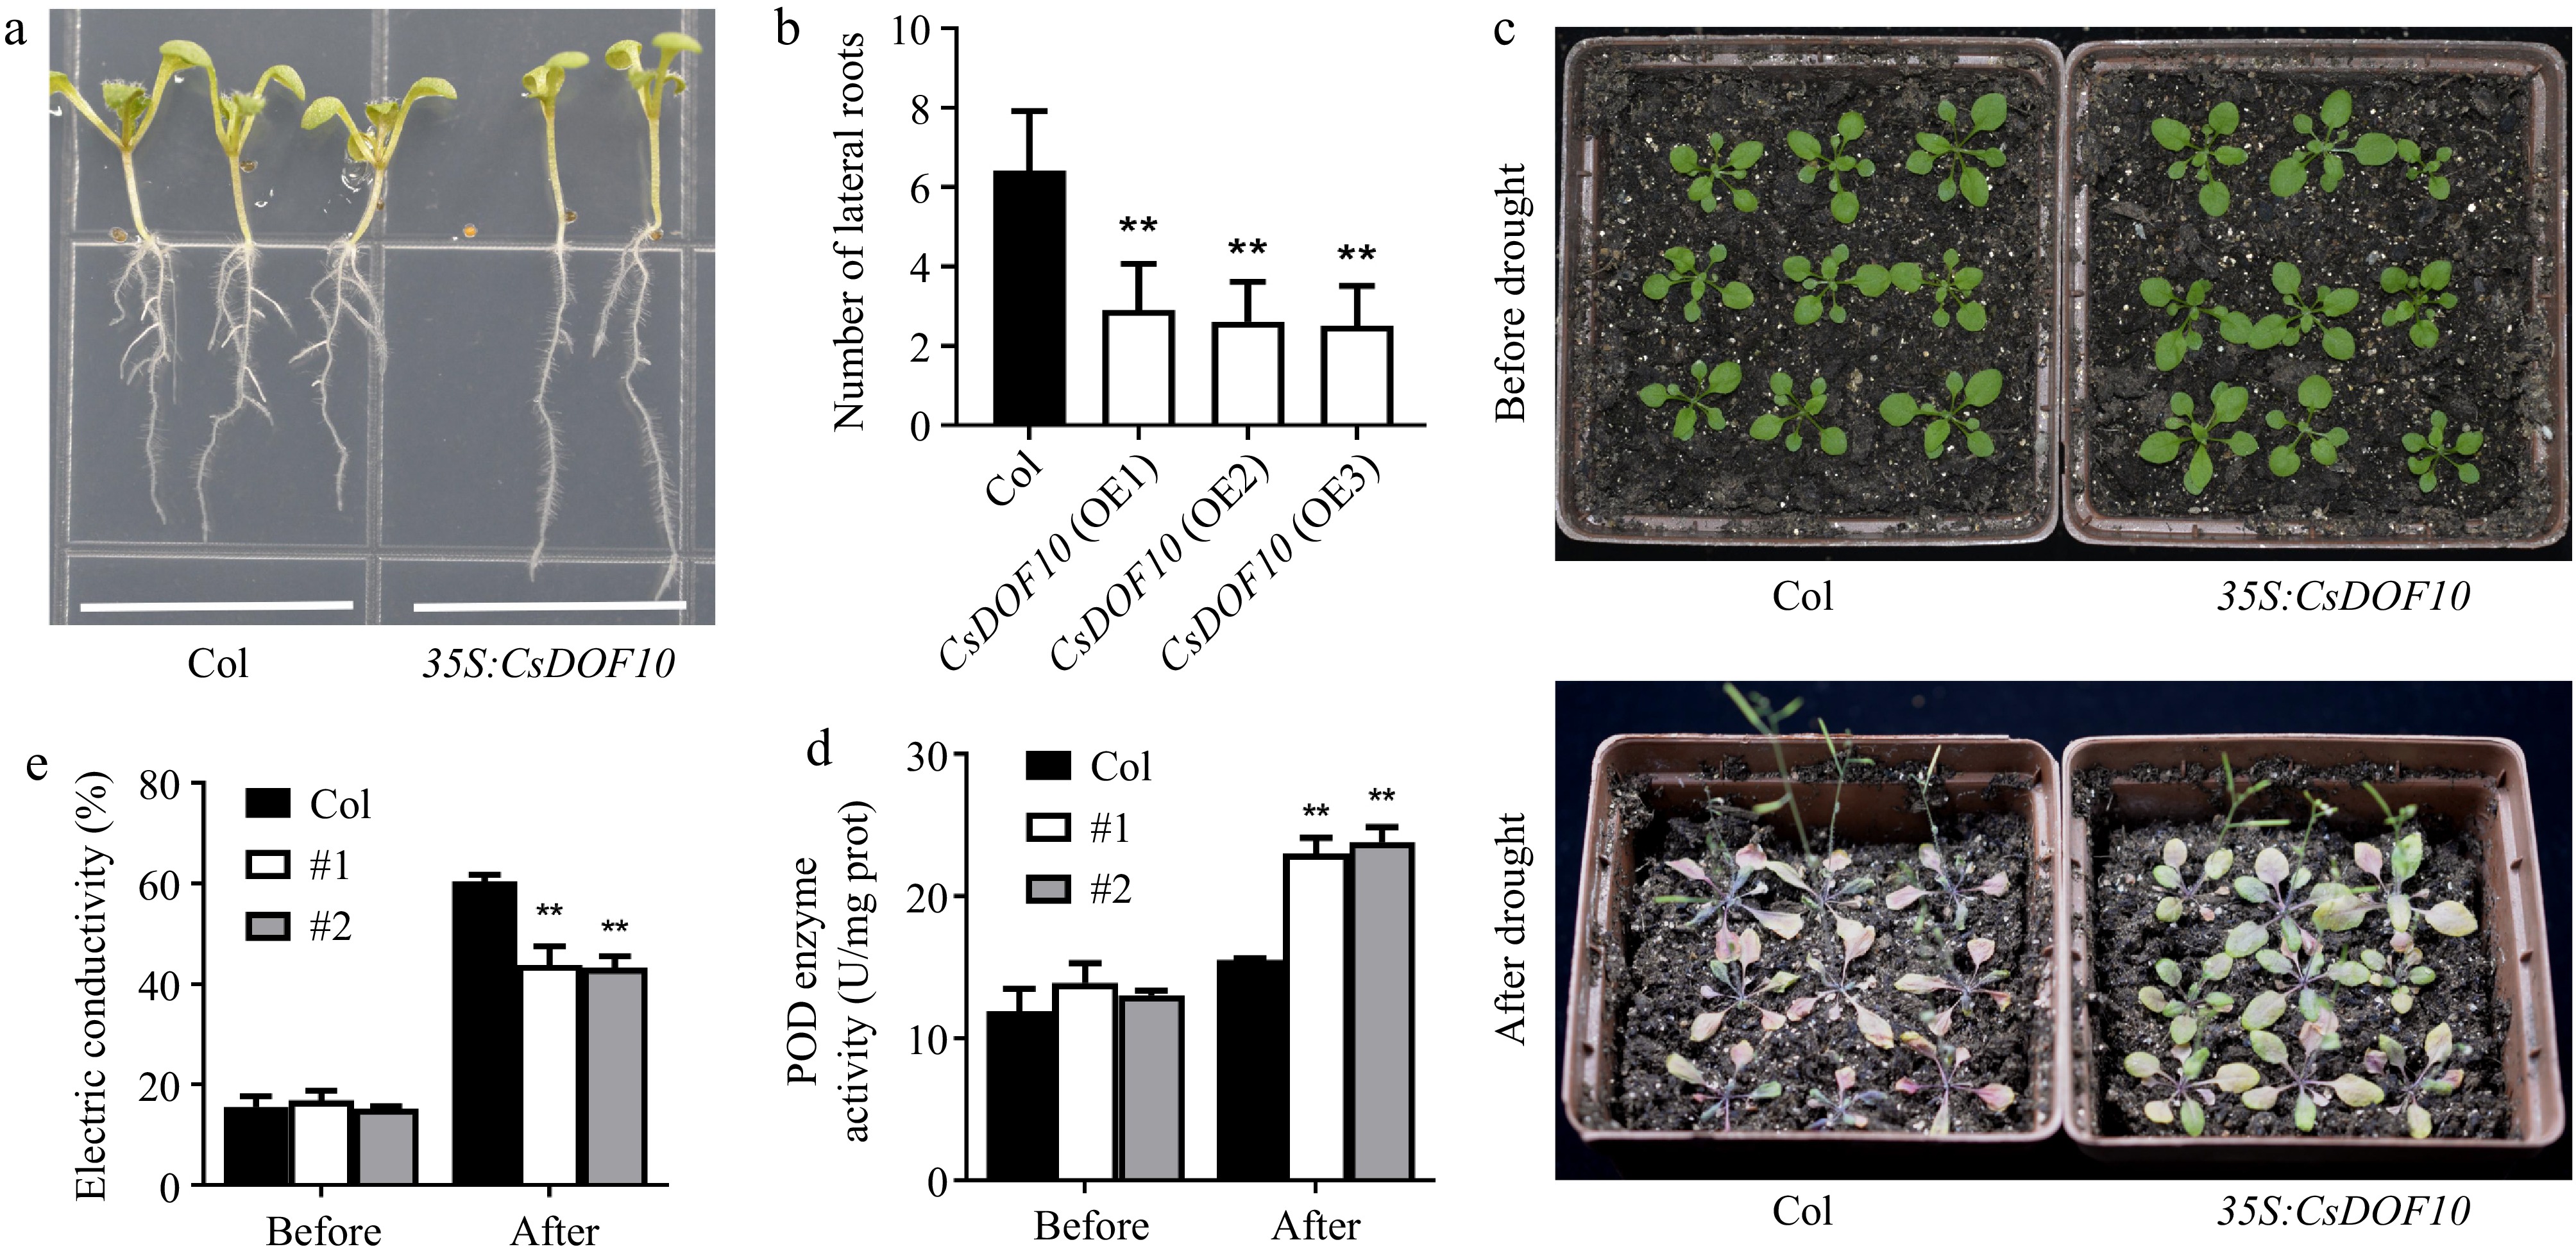
Figure 5.
CsDOF10 transgenic seedlings exhibit strong resistance to drought stress. (a) Root developmental phenotypes of CsDOF10 transgenic Arabidopsis compared to the control. (b) The quantity of lateral roots in CsDOF10 transgenic Arabidopsis vs the control. (c) Phenotypes of CsDOF10 transgenic Arabidopsis and control plants before and after drought treatment. (d) Variations in POD activity, and (e) electrical conductivity of CsDOF10 transgenic seedlings and controls before and after drought treatment. ** represent significant difference at p < 0.01, Students t-test (n = 10).
-
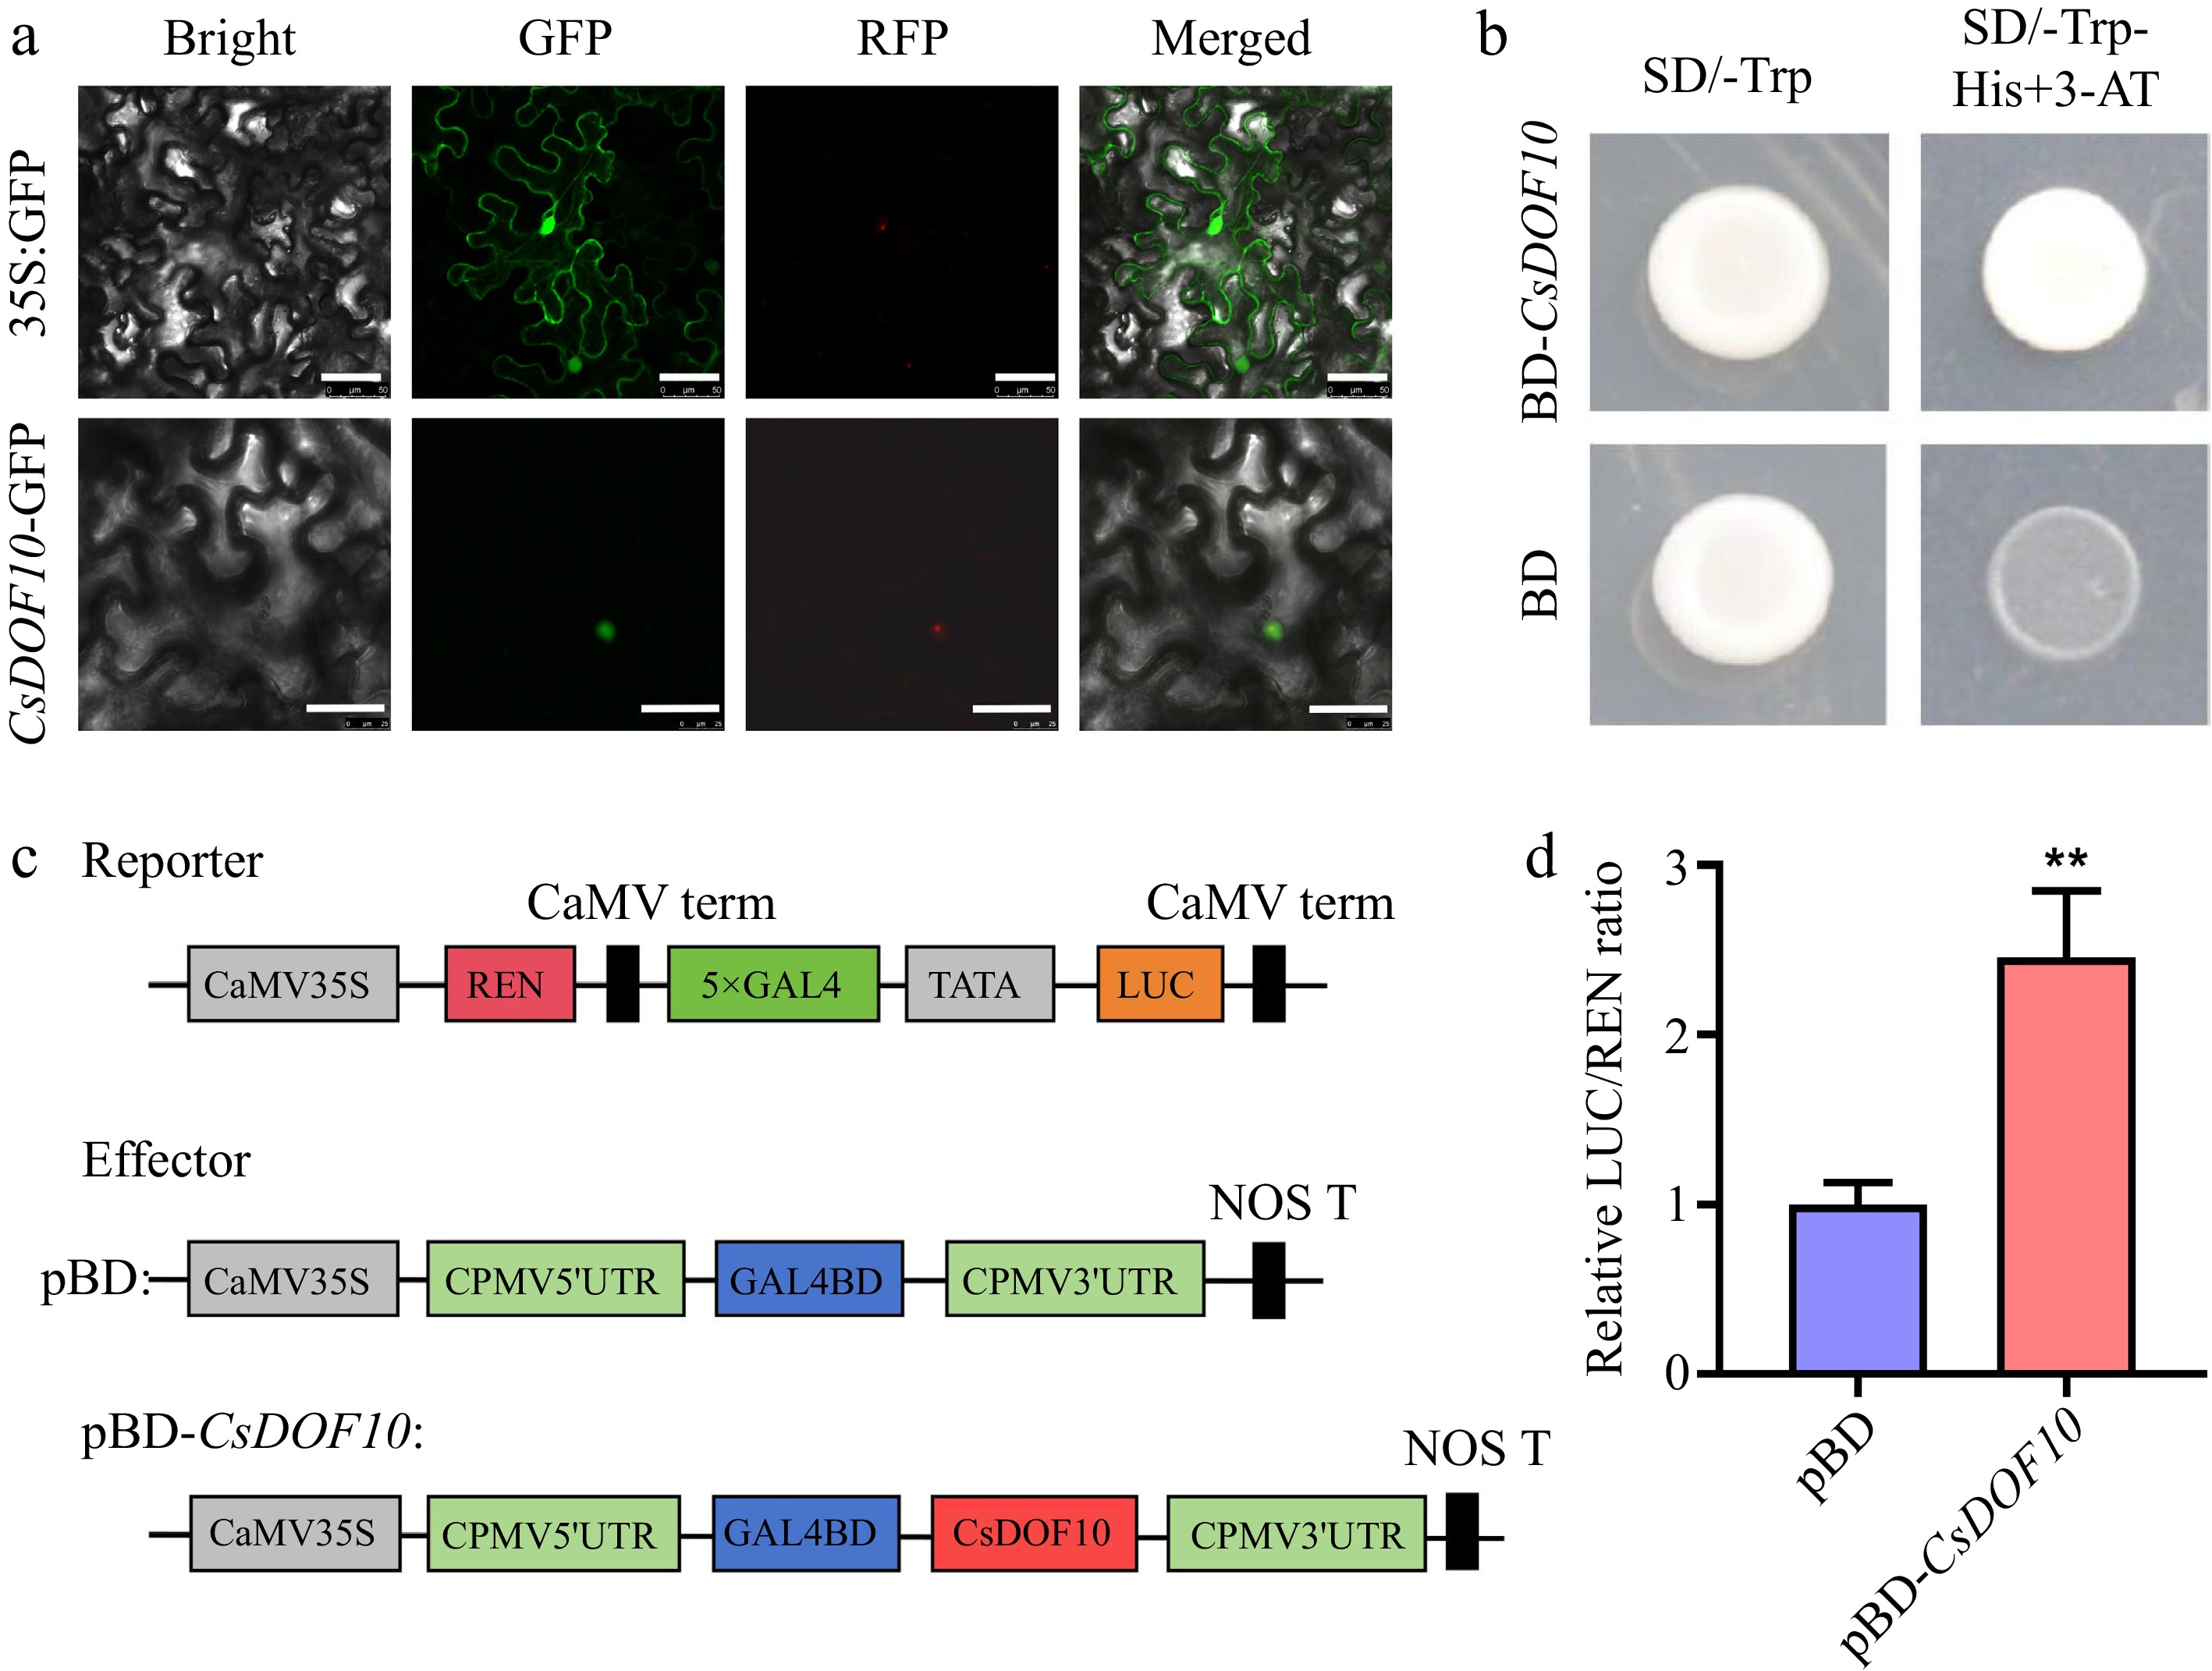
Figure 6.
Subcellular localization and transcriptional activity of CsDOF10. (a) Instantaneous transformation of tobacco leaves displayed that CsDOF10 is located in the nucleus of the cell. Red color represents the fluorescence of nuclear marker VirD2NLS-mCherry. Bars = 50 μm. (b) Yeast experiments have shown that CsDOF10 has transcriptional activation activity. (c) LUC experiments showed that CsDOF10 has transcriptional activation activity. ** represent significant difference at p < 0.01, Students t-test (n = 3).
-
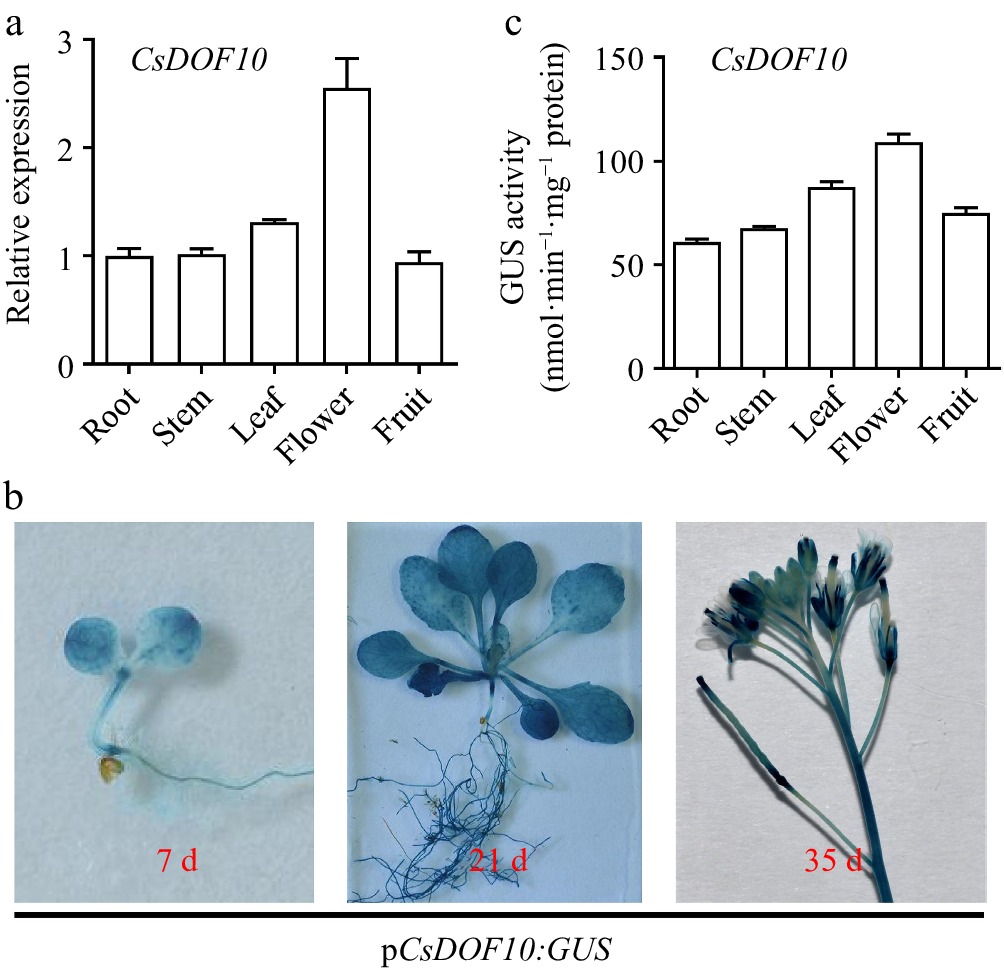
Figure 7.
Expression of CsDOF10 in various tissues and analysis of CsDOF10 promoter cis-elements. (a) The expression pattern of CsDOF10 in different tissues of sweet orange. (b) GUS staining analysis of pCsDOF10:GUS transgenic Arabidopsis plants. (c) Quantitative detection of GUS in different tissues of pCsDOF10:GUS transgenic seedlings.
-
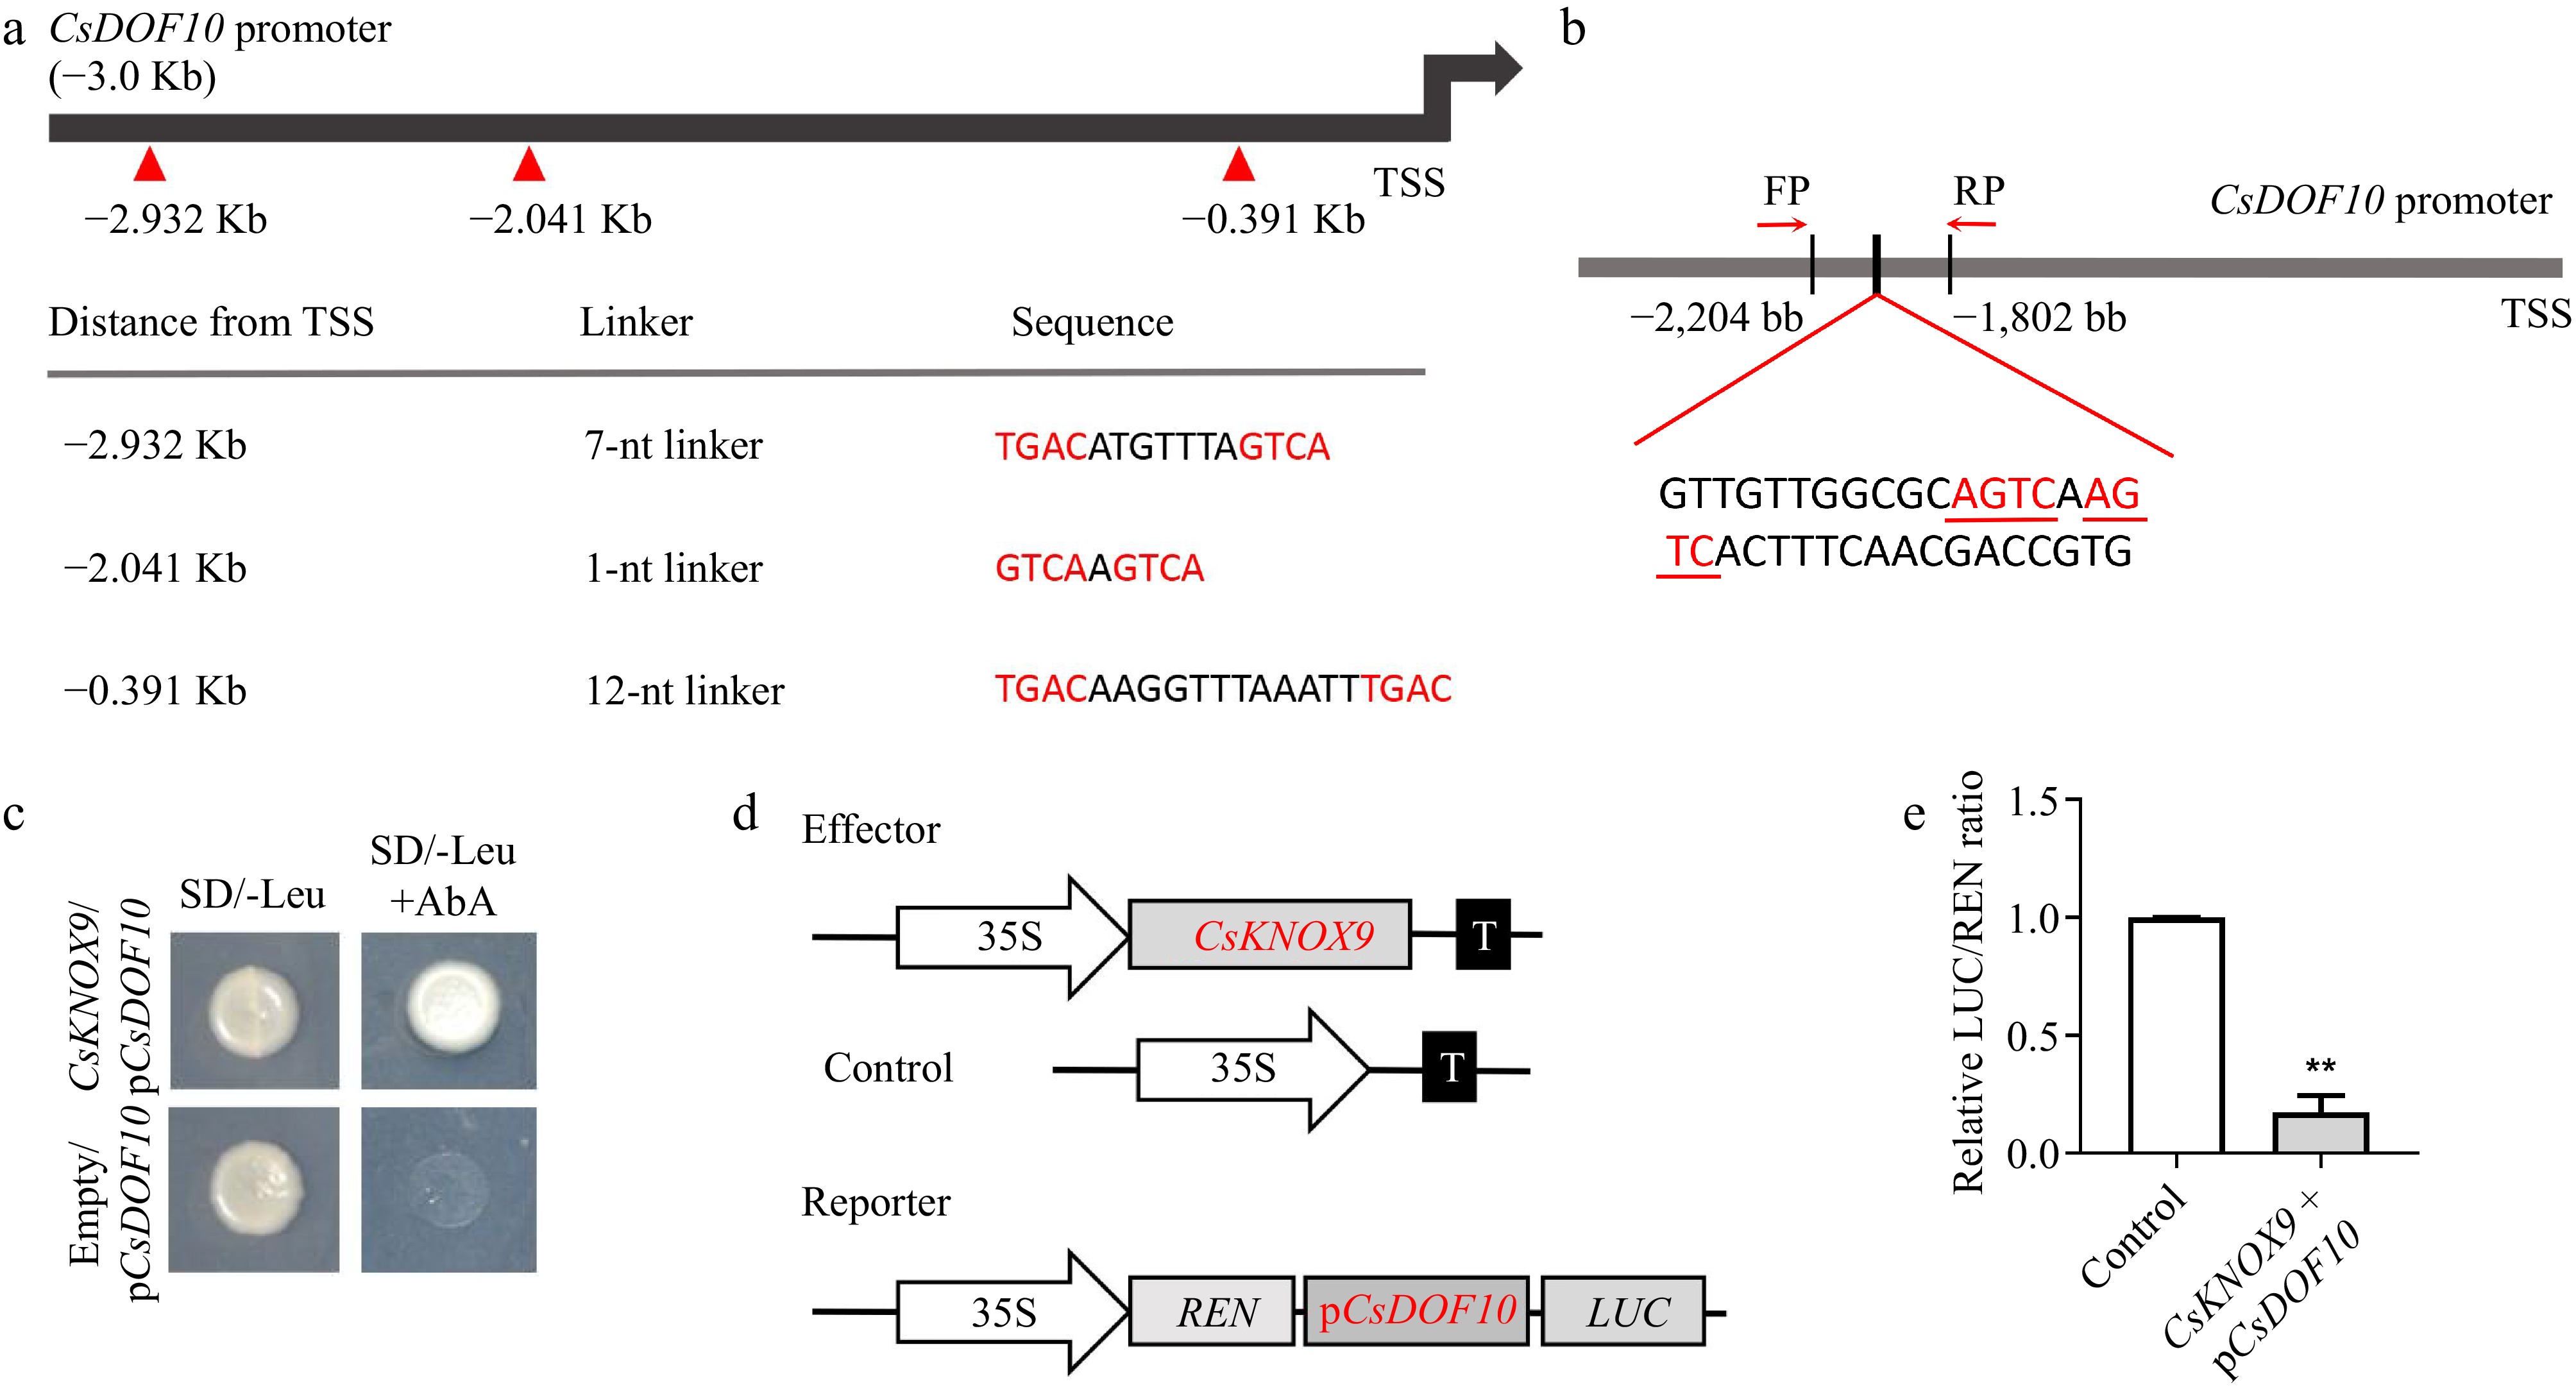
Figure 8.
CsKNOX9 binds to the CsDOF10 promoter and inhibits its expression. (a) Analysis of CsKNOX9 TF binding elements on the CsDOF10 promoter. (b) Schematic diagram illustrating the CsKNOX9 binding element on the CsDOF10 promoter. (c) Yeast one-hybrid assays demonstrate that CsKNOX9 binds to the CsDOF10 promoter. (d) A schematic diagram illustrates the effector and reporter used in the LUC assays. (e) LUC assay results indicate that CsKNOX9 inhibits the expression of CsDOF10. ** represent significant difference at p < 0.01, Students t-test (n = 3).
Figures
(8)
Tables
(0)