-
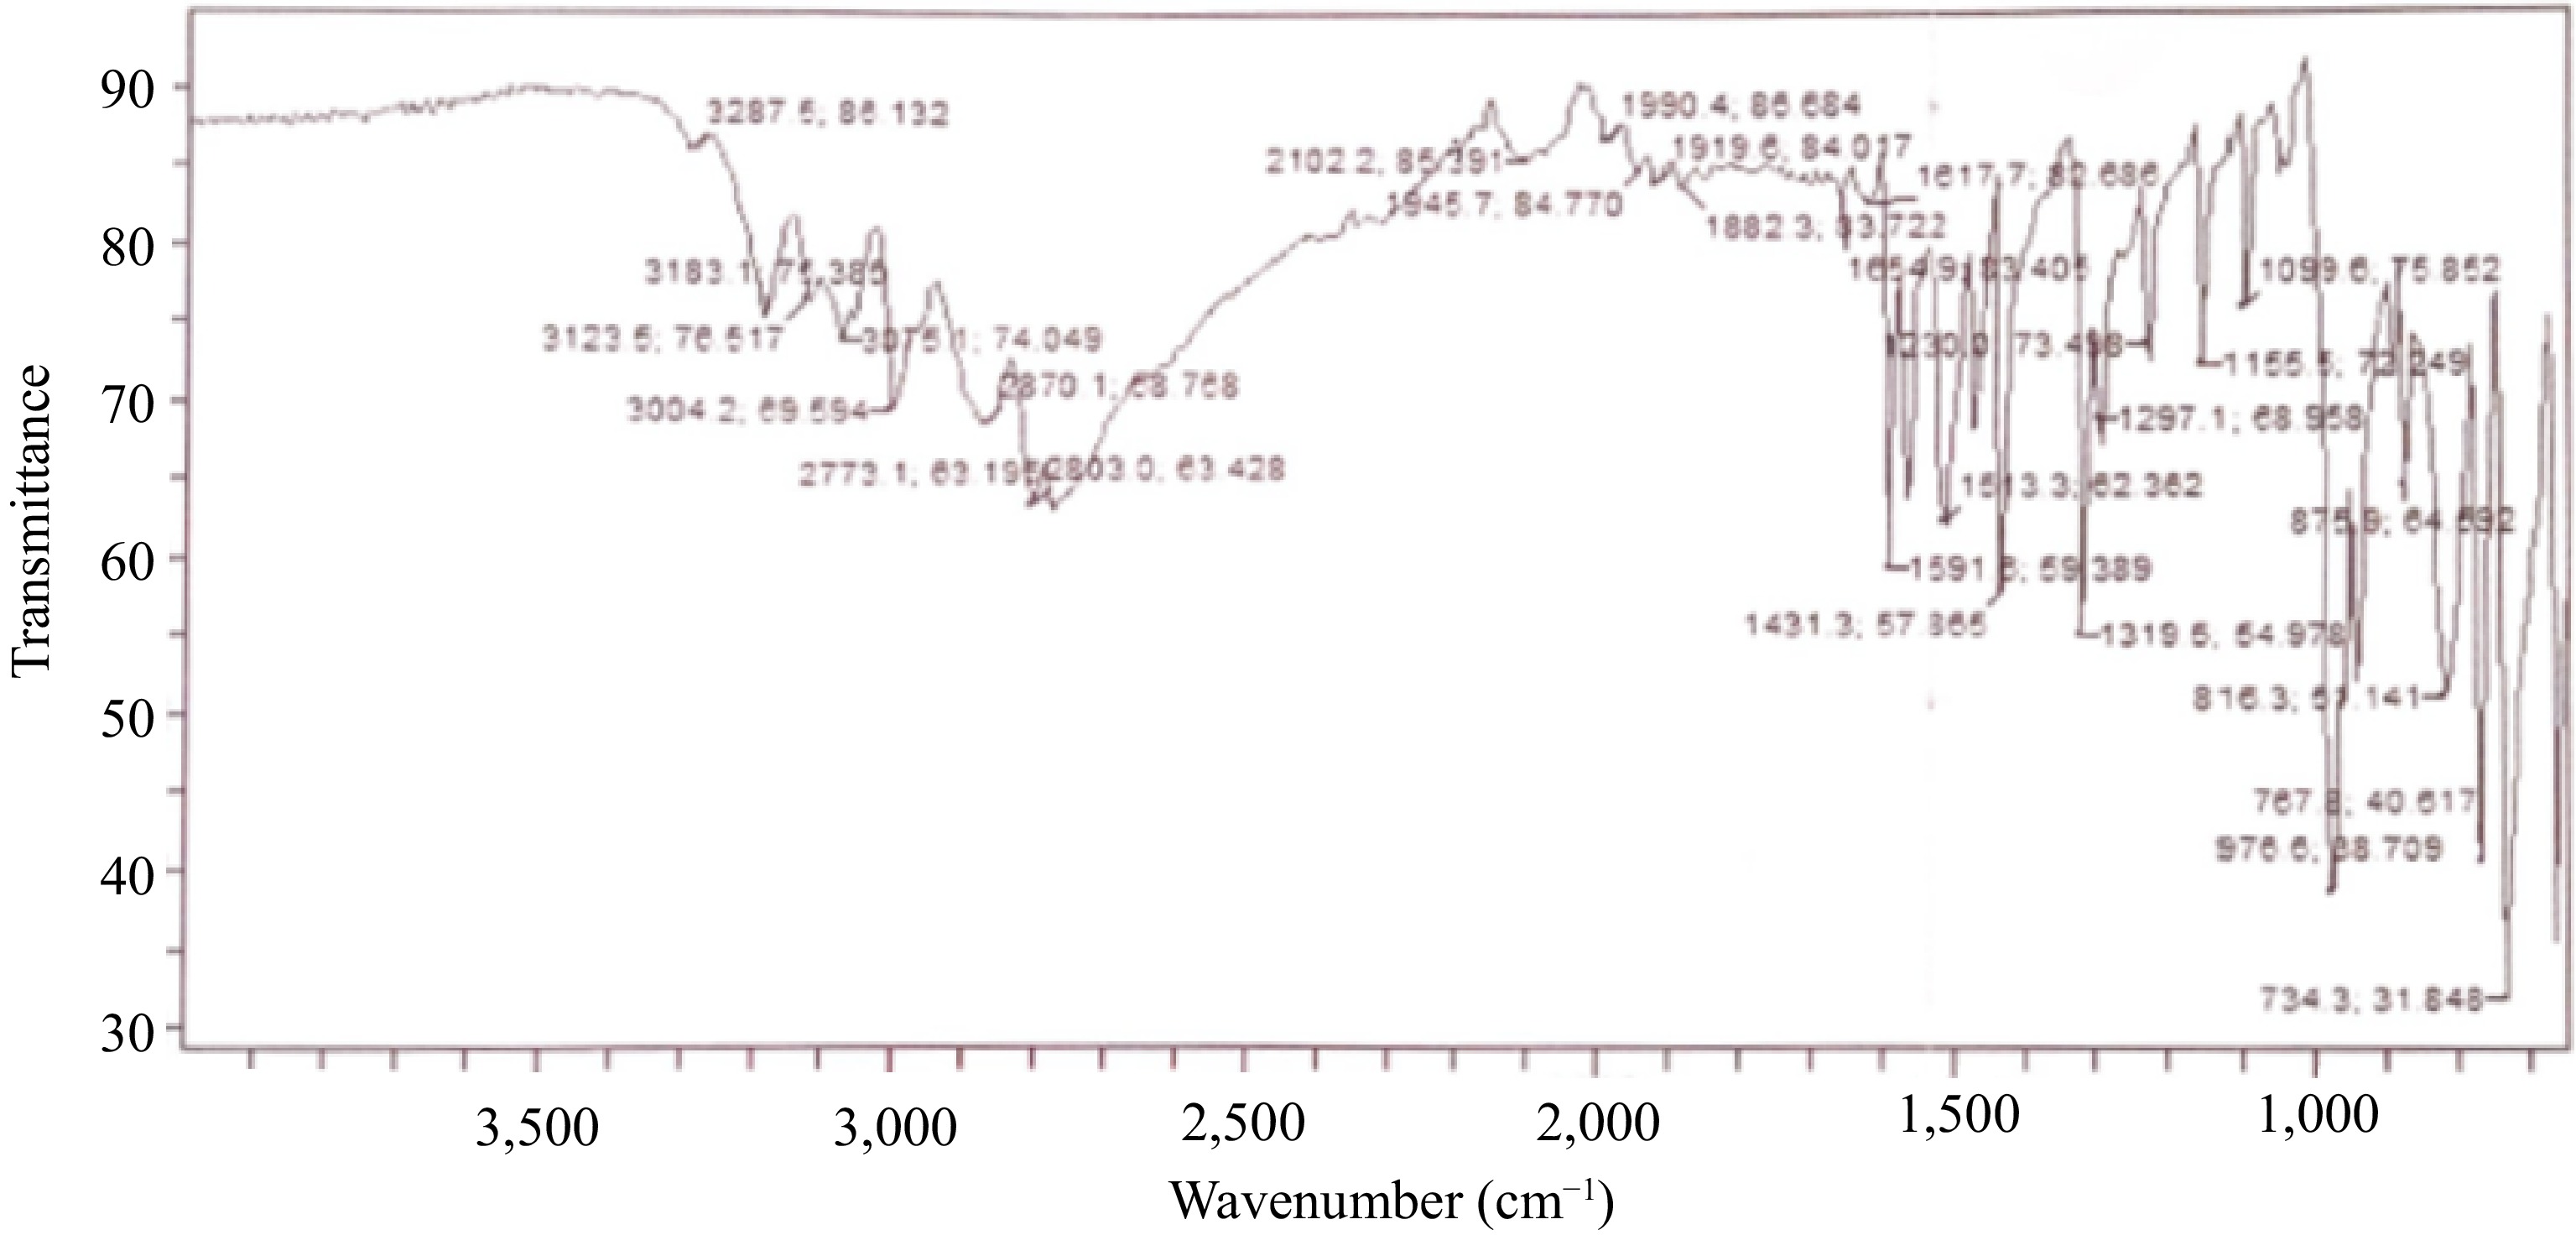
Figure 1.
Oxime-ligand FTIR spectrum.
-
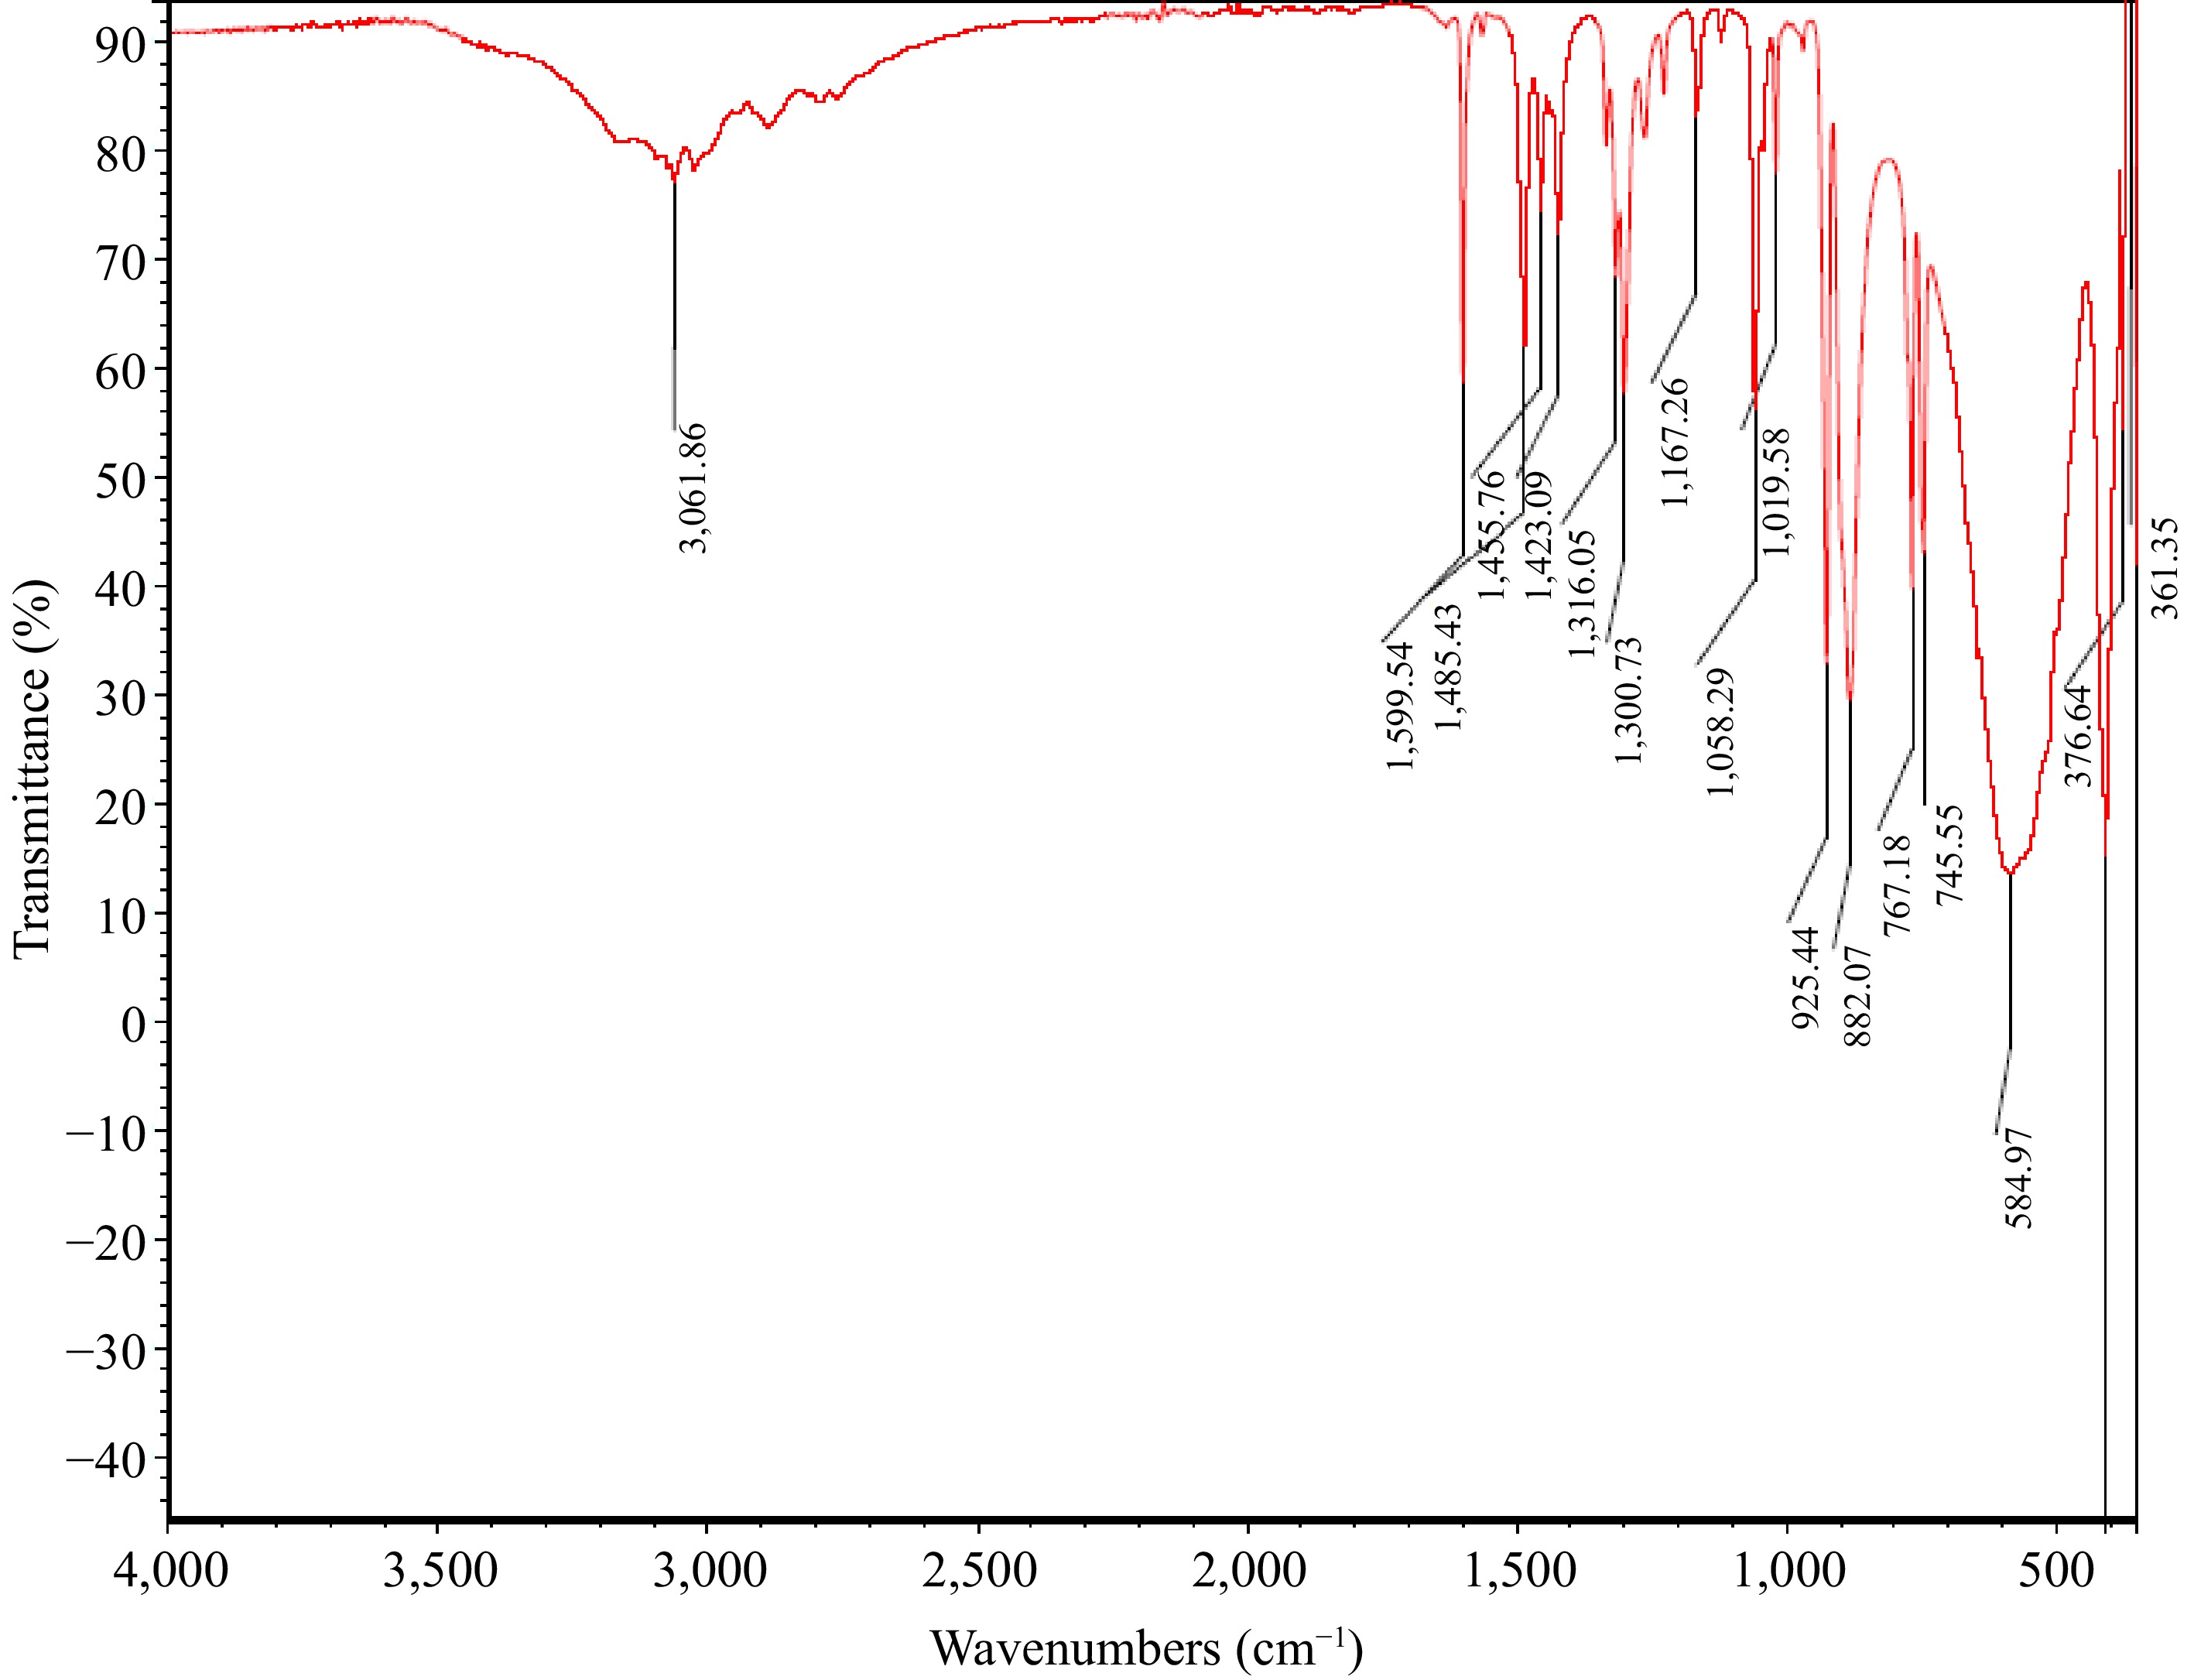
Figure 2.
MOC FTIR spectrum.
-
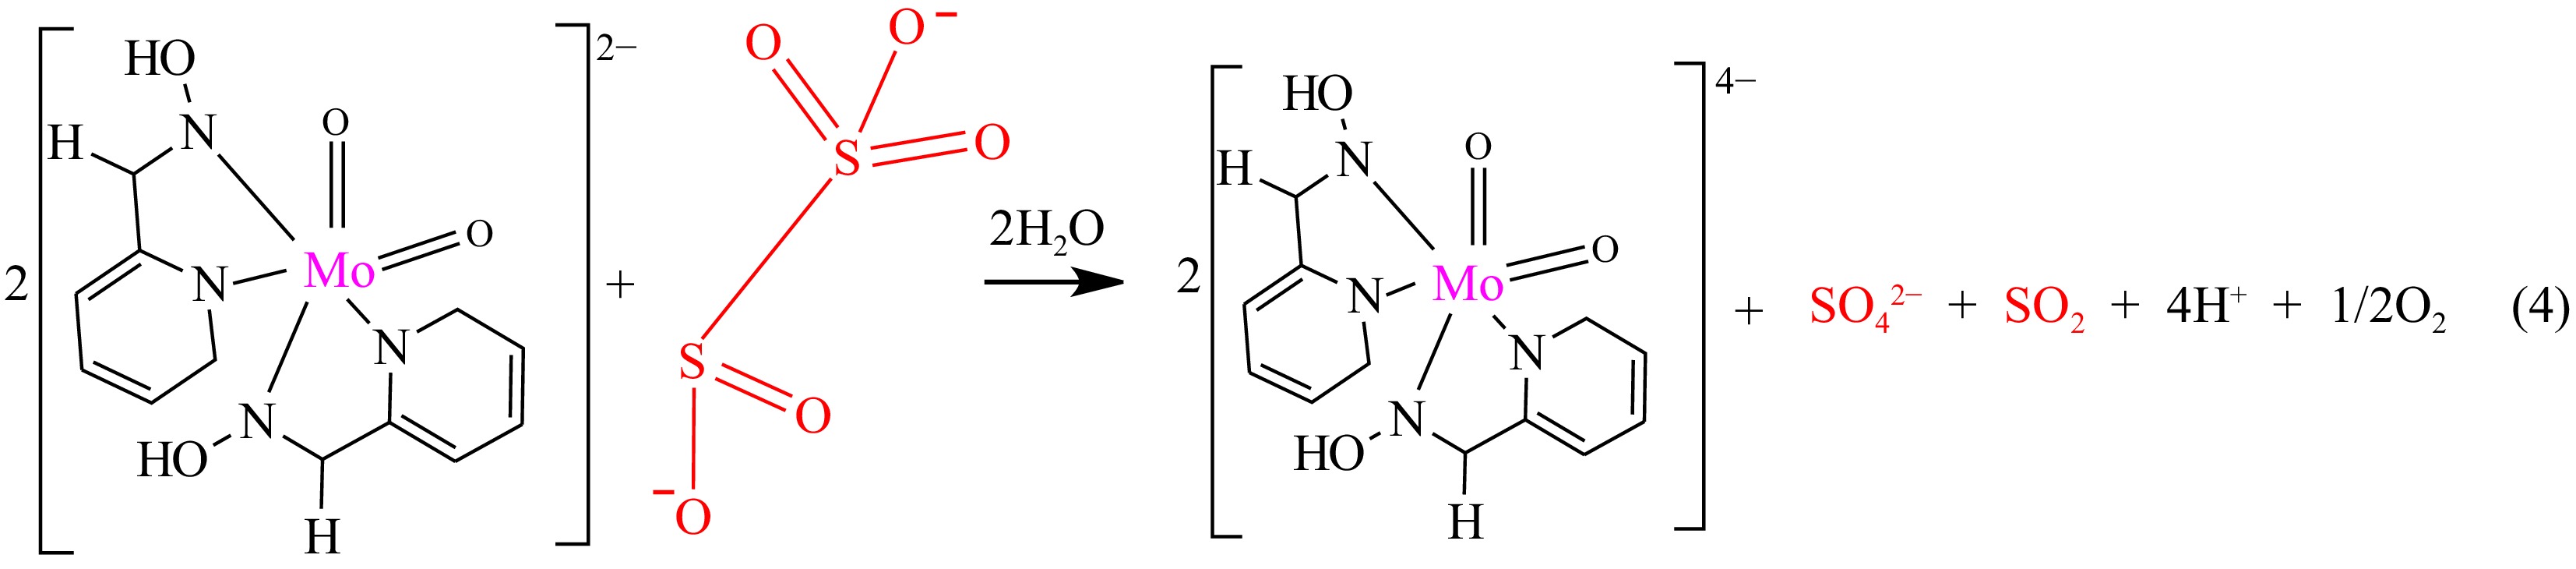
Figure 3.
Stoichiometric equation of the reaction of MOC and metabisulphite ion.
-
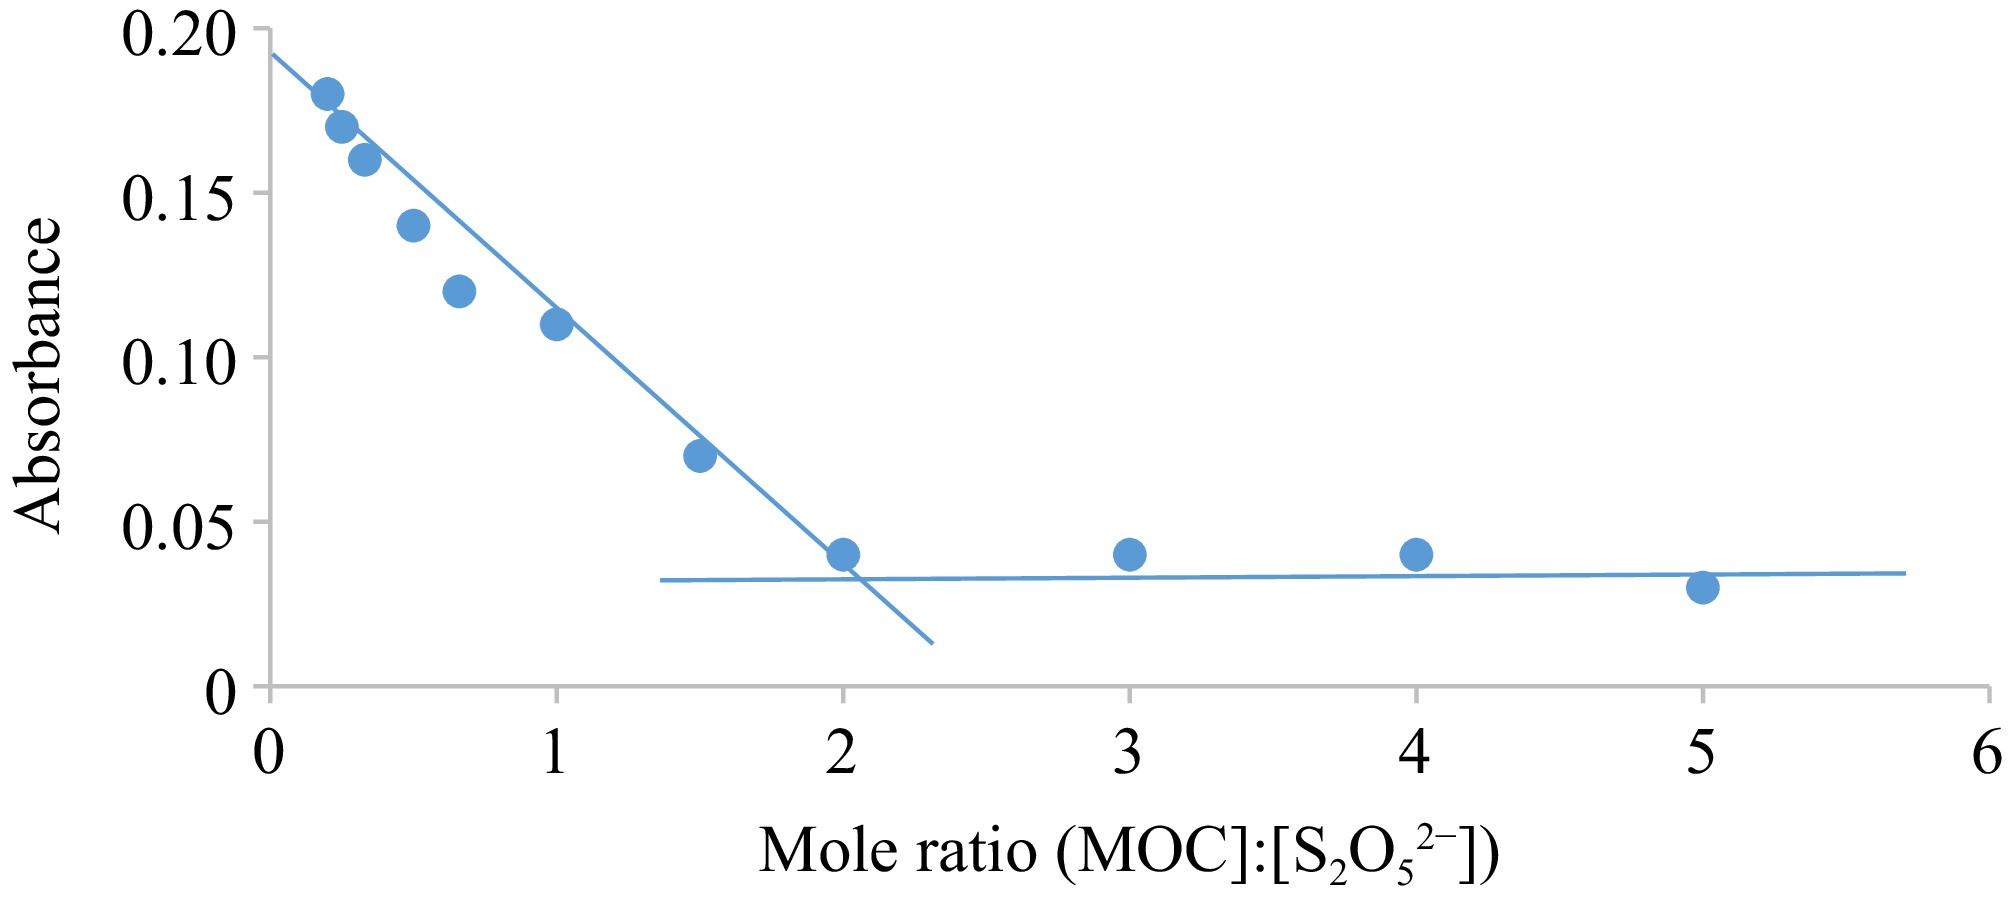
Figure 4.
Graph of Abs vs mole ratio for the oxidation of S2O52− by MOC. Condition: [MOC] = 1.9 × 10⁻³ mol·dm−3, [S2O52−] = (0.4.18 – 95.0) × 10−4 mol·dm−3, [H+] = 0.02 mol·dm−3, T = 301 K, λmax = 560 nm.
-
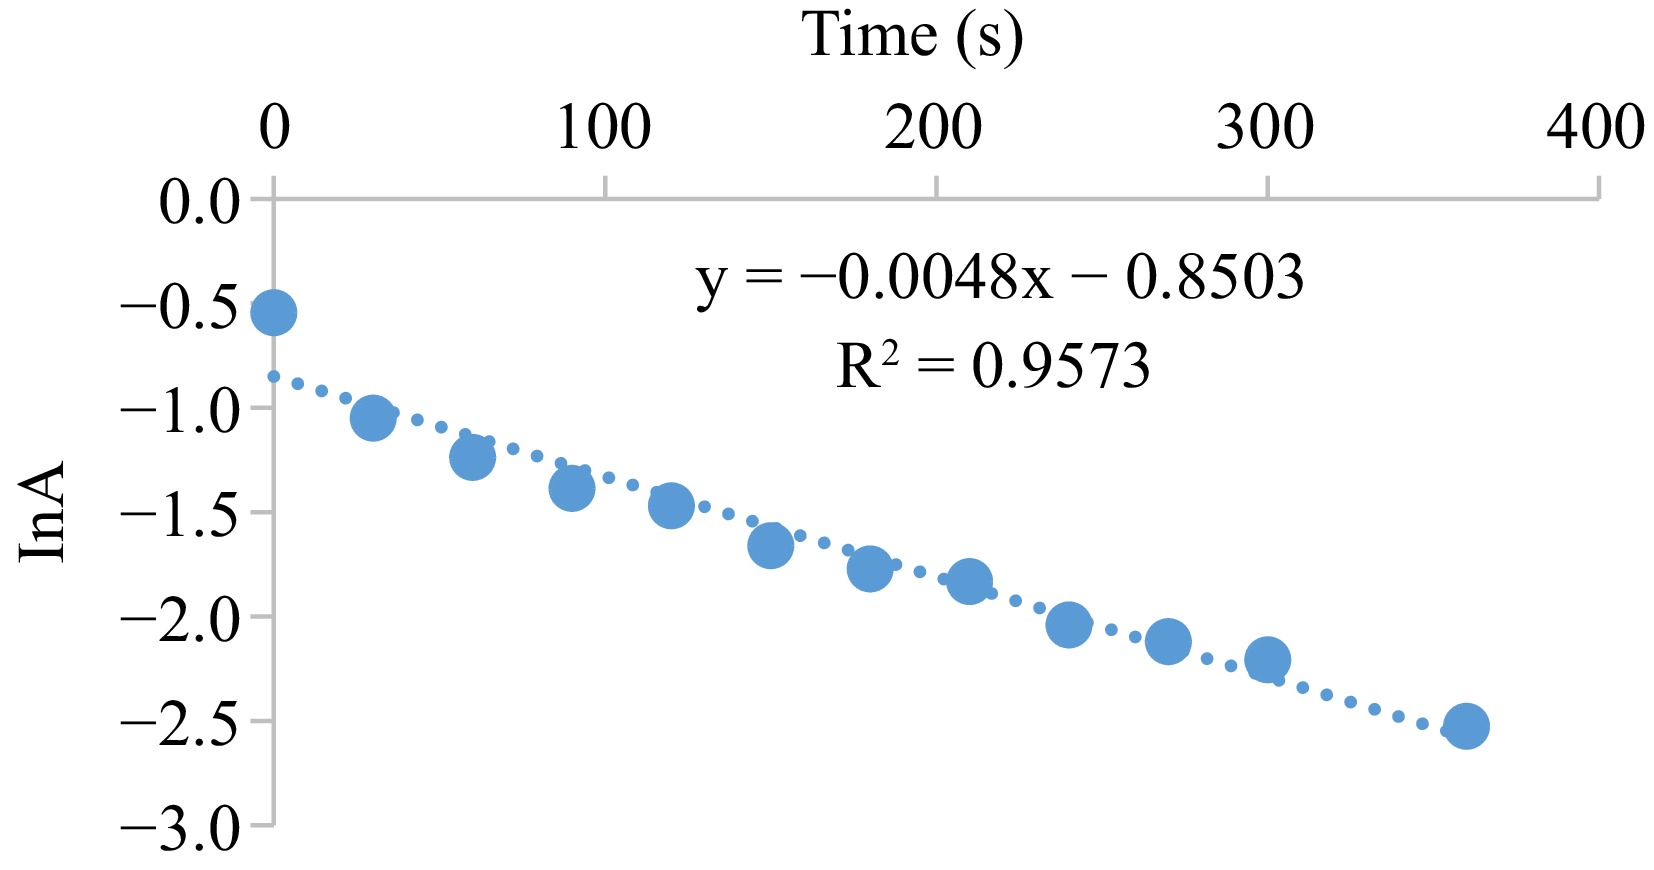
Figure 5.
Typical pseudo-first order plot for the oxidation of S2O52− by MOC. Condition: [MOC] = 1.9 × 10⁻³ mol·dm−3, [S2O52−] = 9.5 × 10⁻² mol·dm−3, [H+] = 0.02 mol·dm−3, T = 301 K, λmax = 560 nm.
-
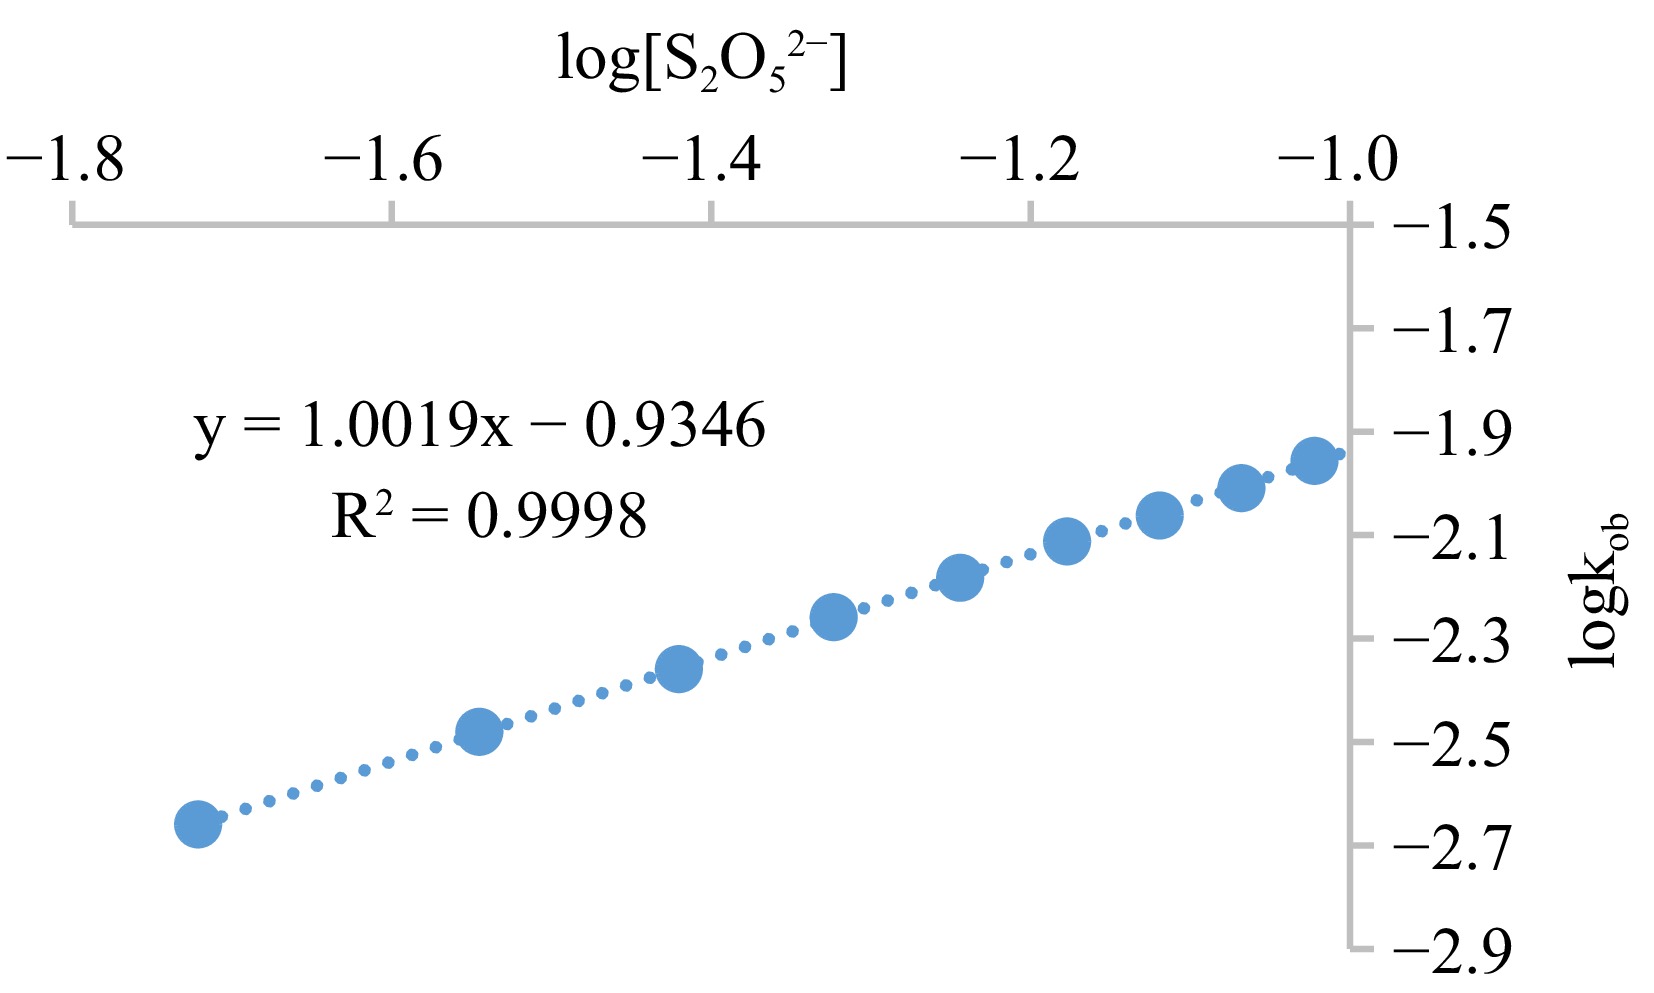
Figure 6.
Graph of logkob against log[S2O52−] for the oxidation of S2O52− by MOC. Condition: [MOC] = 1.9 × 10⁻³ mol·dm−3, [S2O52−] = (1.9 − 11.4) × 10−2 mol·dm−3, [H+] = 0.02 mol·dm−3, T = 301 K, λmax = 560 nm.
-
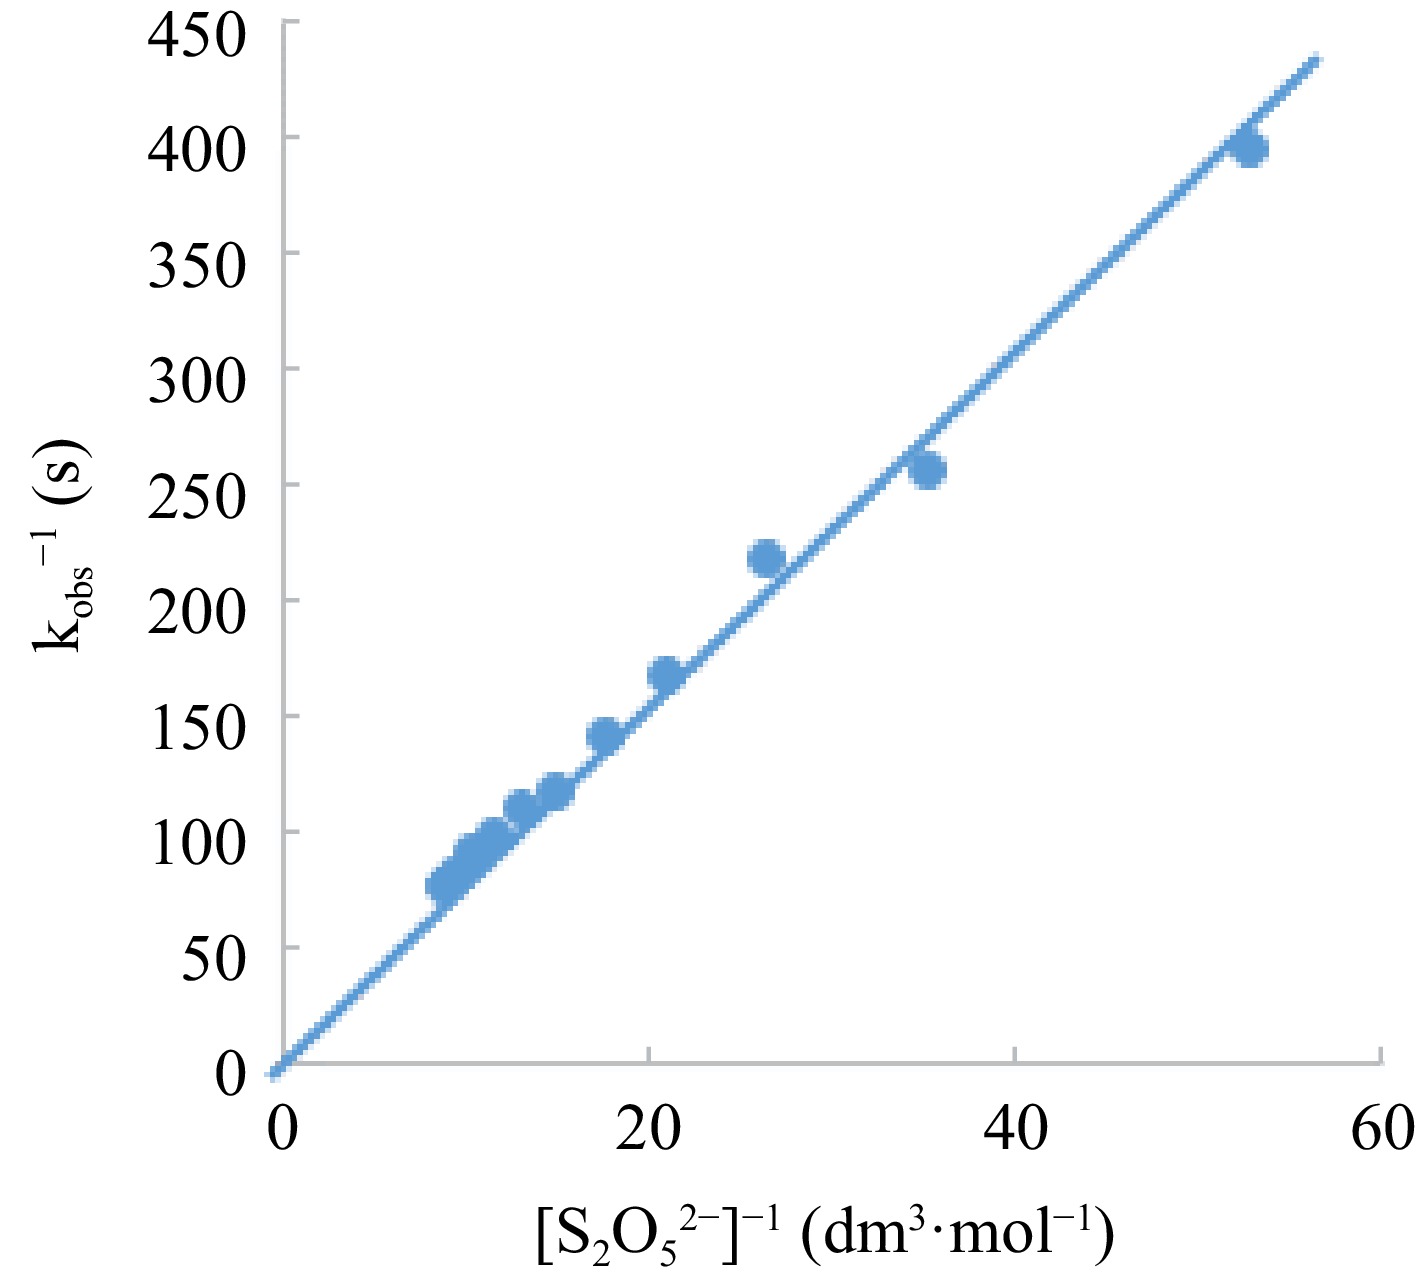
Figure 7.
Lineweaver-Burk plot of Michealis-Menten’s plot modification for intermediate determination.
-
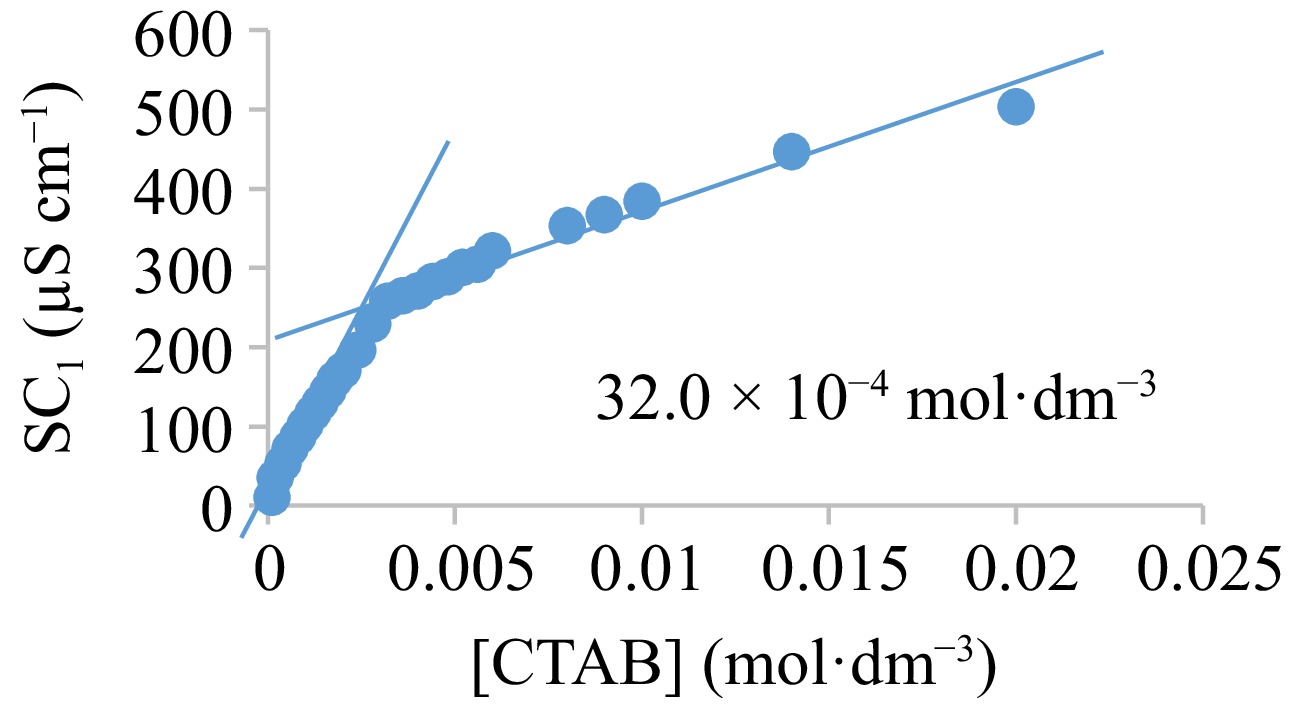
Figure 8.
Specific conductance-concentration curve for CTAB.
-
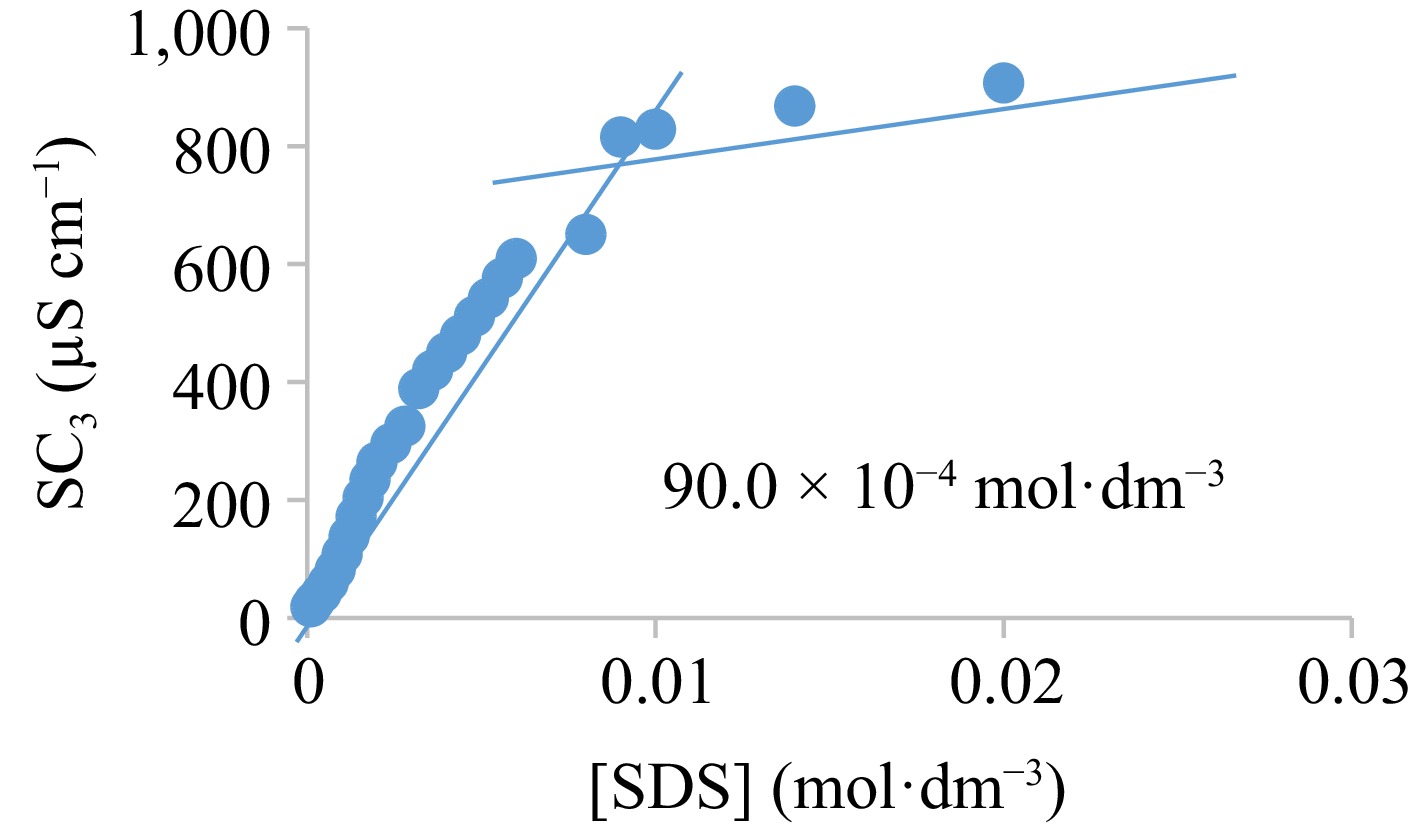
Figure 9.
Specific conductance-concentration curve for SDS.
-
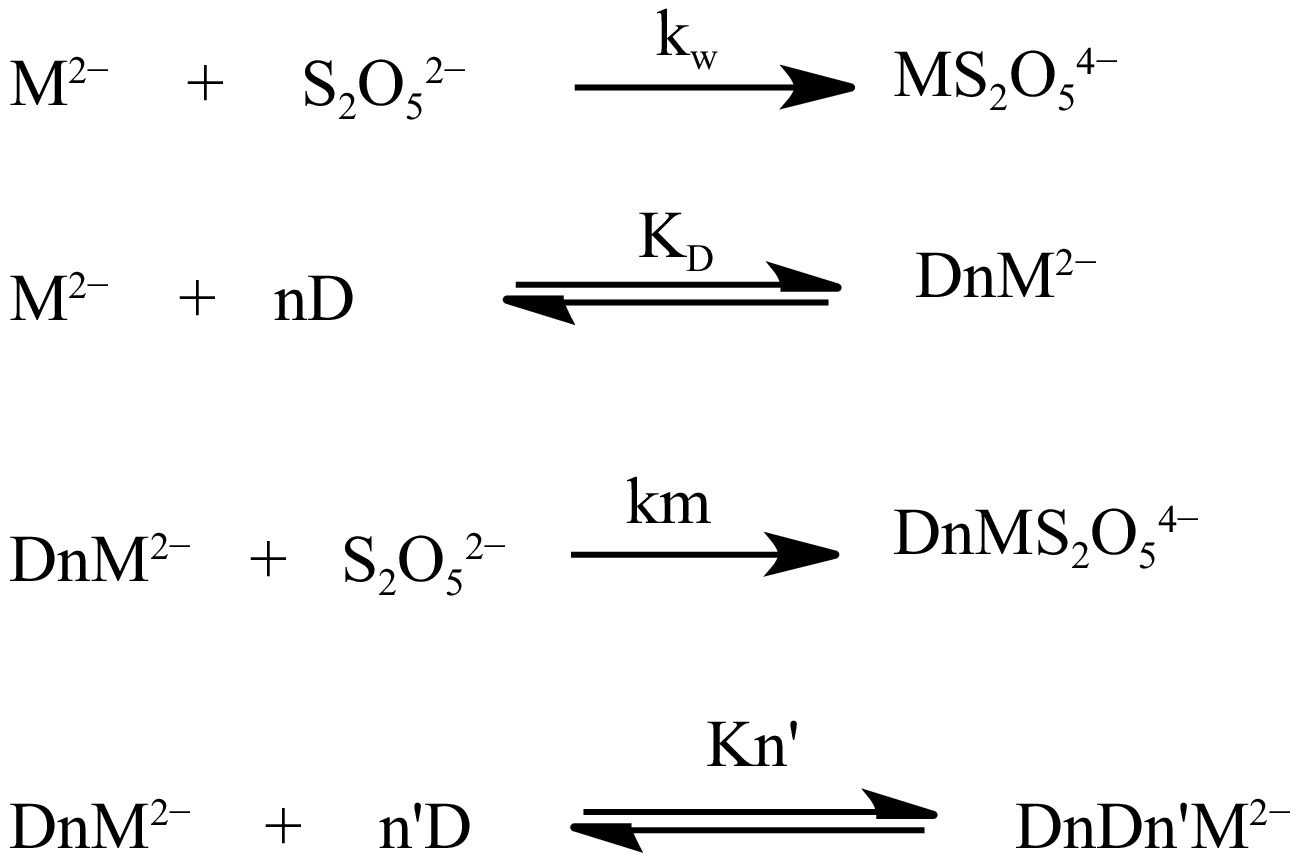
Figure 10.
The catalytic micelle - substrate model of Piszkiewicz's concept.
-
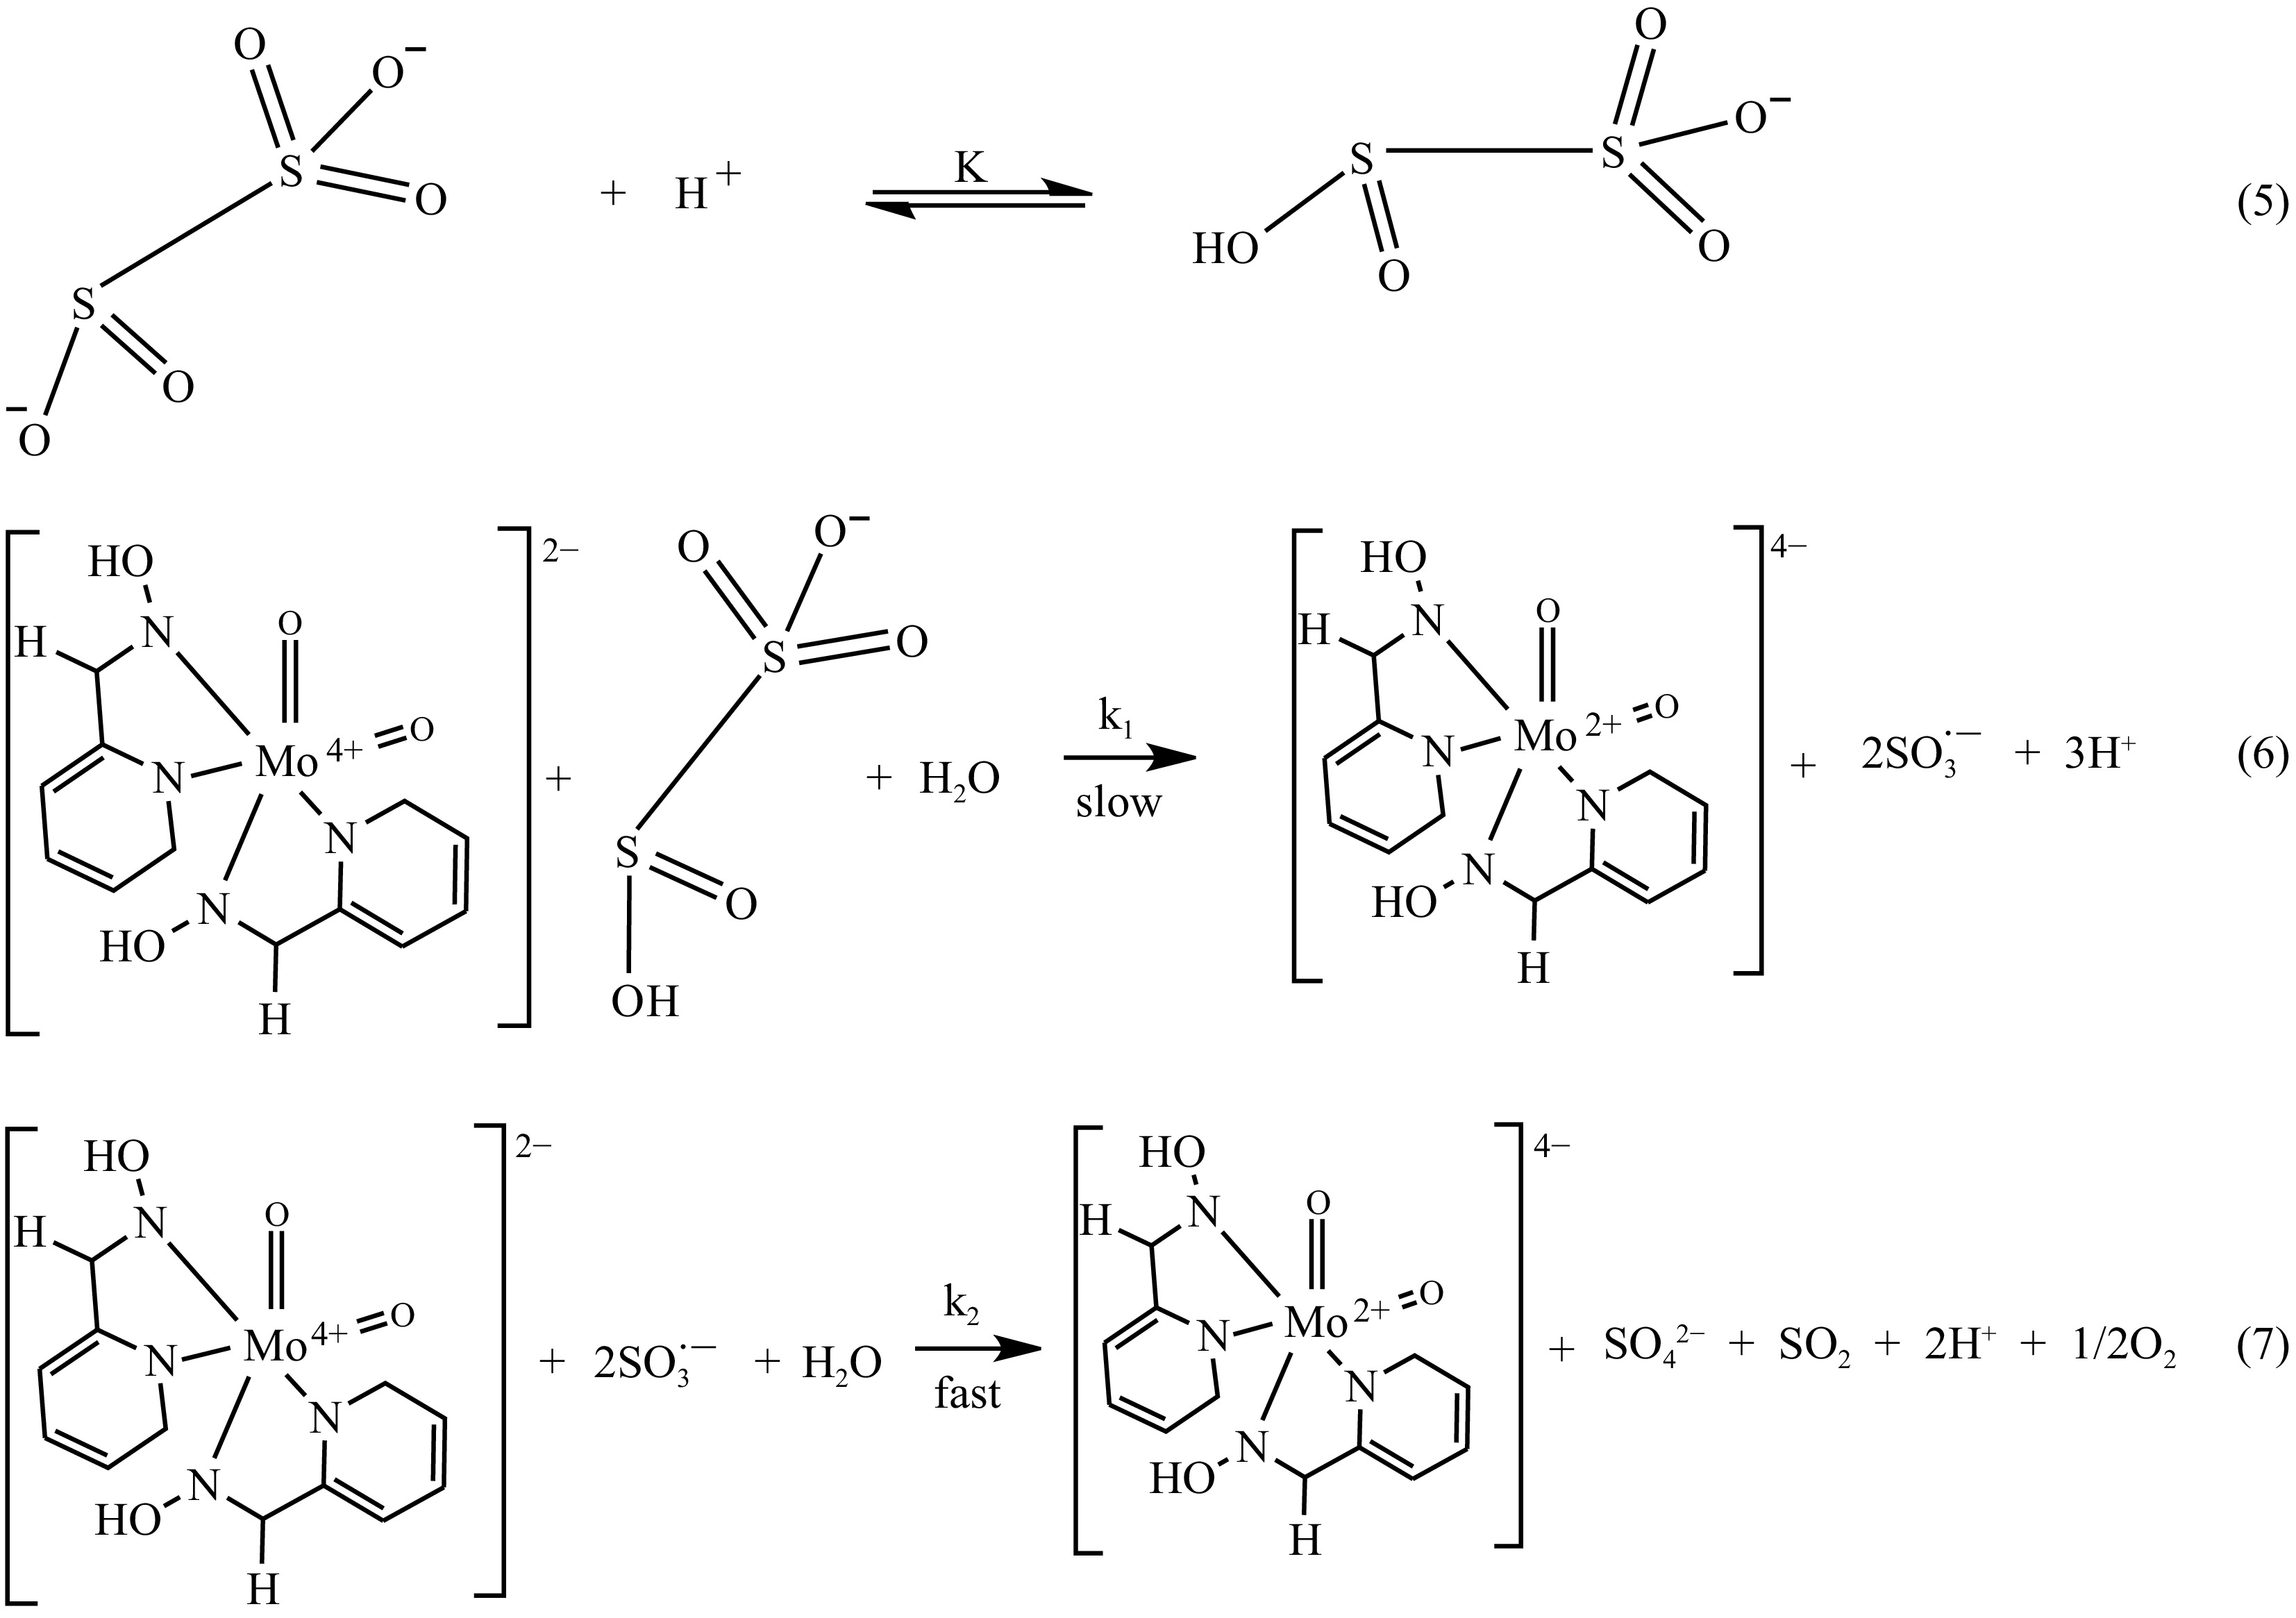
Figure 11.
Simple redox routes of MOC and S2O52−.
-
Item Band (cm−1) Assignment Ligand 1,654.9 C=N (stretching) 1,591.8 N-O (bending) MOC 767.1 & 745.5 Mo=O (stretching) 584.7 Mo-N (stretching) 1,300.7 C-N (stretching) 1,599.5 N-O (bending) Molar conductivity 133 S·cm2·mol−1 Table 1.
Molecular vibrations of interest for the MOC and its molar conductivity.
-
102[S2O52−] (mol·dm−3) 102[H+] (mol·dm−3 ) μ
(mol·dm−3 )103kob
(s−1 )102k2 (dm3·mol−1·s−1) 1.9 2.0 0.40 2.53 11.53 2.9 2.0 0.40 3.92 11.61 3.8 2.0 0.40 4.61 11.52 4.8 2.0 0.40 5.99 11.61 5.7 2.0 0.40 7.14 11.53 6.7 2.0 0.40 8.52 11.62 7.6 2.0 0.40 9.21 11.40 8.6 2.0 0.40 10.13 11.45 9.5 2.0 0.40 11.05 11.64 10.5 2.0 0.40 12.21 11.68 11.4 2.0 0.40 13.13 11.52 9.5 2.0 0.40 11.05 11.64 9.5 2.5 0.40 11.52 12.12 9.5 3.0 0.40 12.21 12.84 9.5 3.5 0.40 12.44 13.09 9.5 4.0 0.40 12.89 13.58 9.5 4.5 0.40 13.13 13.82 9.5 5.0 0.40 14.05 14.79 9.5 5.5 0.40 14.74 15.51 9.5 6.0 0.40 16.58 17.45 9.5 6.5 0.40 17.50 18.42 9.5 7.0 0.40 17.96 18.91 9.5 2.0 0.35 9.21 9.69 9.5 2.0 0.40 11.05 11.64 9.5 2.0 0.45 11.98 12.61 9.5 2.0 0.50 12.67 13.33 9.5 2.0 0.55 14.05 14.79 9.5 2.0 0.60 16.59 17.45 9.5 2.0 0.65 18.65 19.63 9.5 2.0 0.70 21.42 22.55 9.5 2.0 0.80 25.33 26.67 9.5 2.0 0.85 34.55 36.36 Condition: [MOC] = 1.9 × 10⁻³ mol·dm−3, [H+] = 0.02 mol·dm−3, T = 301 K, λmax = 560 nm. Table 2.
Rate constants for the oxidation of S2O52− ion by MOC.
-
D 103kob (s−1) 102k2 (dm3·mol−1·s−1) 77.2 11.05 11.64 76.5 9.44 9.94 75.9 9.21 9.69 75.2 7.83 8.24 74.5 7.14 7.52 73.9 6.45 6.79 73.2 5.53 5.82 72.5 4.61 4.85 71.9 4.38 4.61 71.2 3.92 4.12 Condition: [MOC] = 1.9 × 10⁻³ mol·dm−3, [S2O52−] = 9.5 × 10⁻³ mol·dm−3, [H+] = 0.02 mol·dm−3, T = 301 K, λmax = 560 nm. Table 3.
Effect of medium polarity on the oxidation speed of S2O52− ion by MOC at λmax = 560 nm.
-
Ion 103[Ion]
(mol·dm3)103kob
(s−1)102k2
(dm3·mol−1·s−1)NH4+ 0.00 11.05 11.64 8.00 12.21 12.85 12.0 12.46 13.43 16.0 12.89 13.58 20.0 13.36 14.06 24.0 14.05 14.79 28.0 11.95 15.76 HCOO− 0.00 11.05 11.64 8.00 9.90 10.42 12.0 8.06 8.42 16.0 7.37 7.76 20.0 5.76 6.06 24.0 5.07 5.33 28.0 4.38 4.61 Condition: [MOC] = 1.9 × 10⁻³ mol·dm3, [S2O52−] = 9.5 × 10⁻³ mol·dm−3, [H+] = 0.02 mol·dm−3, T = 301 K, λmax = 560 nm. Table 4.
Effect of counter-ions on the oxidation speed of S2O52− ion by MOC at λmax = 560 nm.
-
Micelle
generatorn KD KD−1 km
(dm3·mol−1·s−1)r2 kw
(dm3·mol−1·s−1)CTAB 1.4955 0.6114 1.6355 0.8623 0.9898 0.1164 SDS 2.2751 0.8367 1.1951 0.0155 0.9451 0.1164 Table 5.
Factors of Piszkiewicz kinetic model.
Figures
(11)
Tables
(5)