-
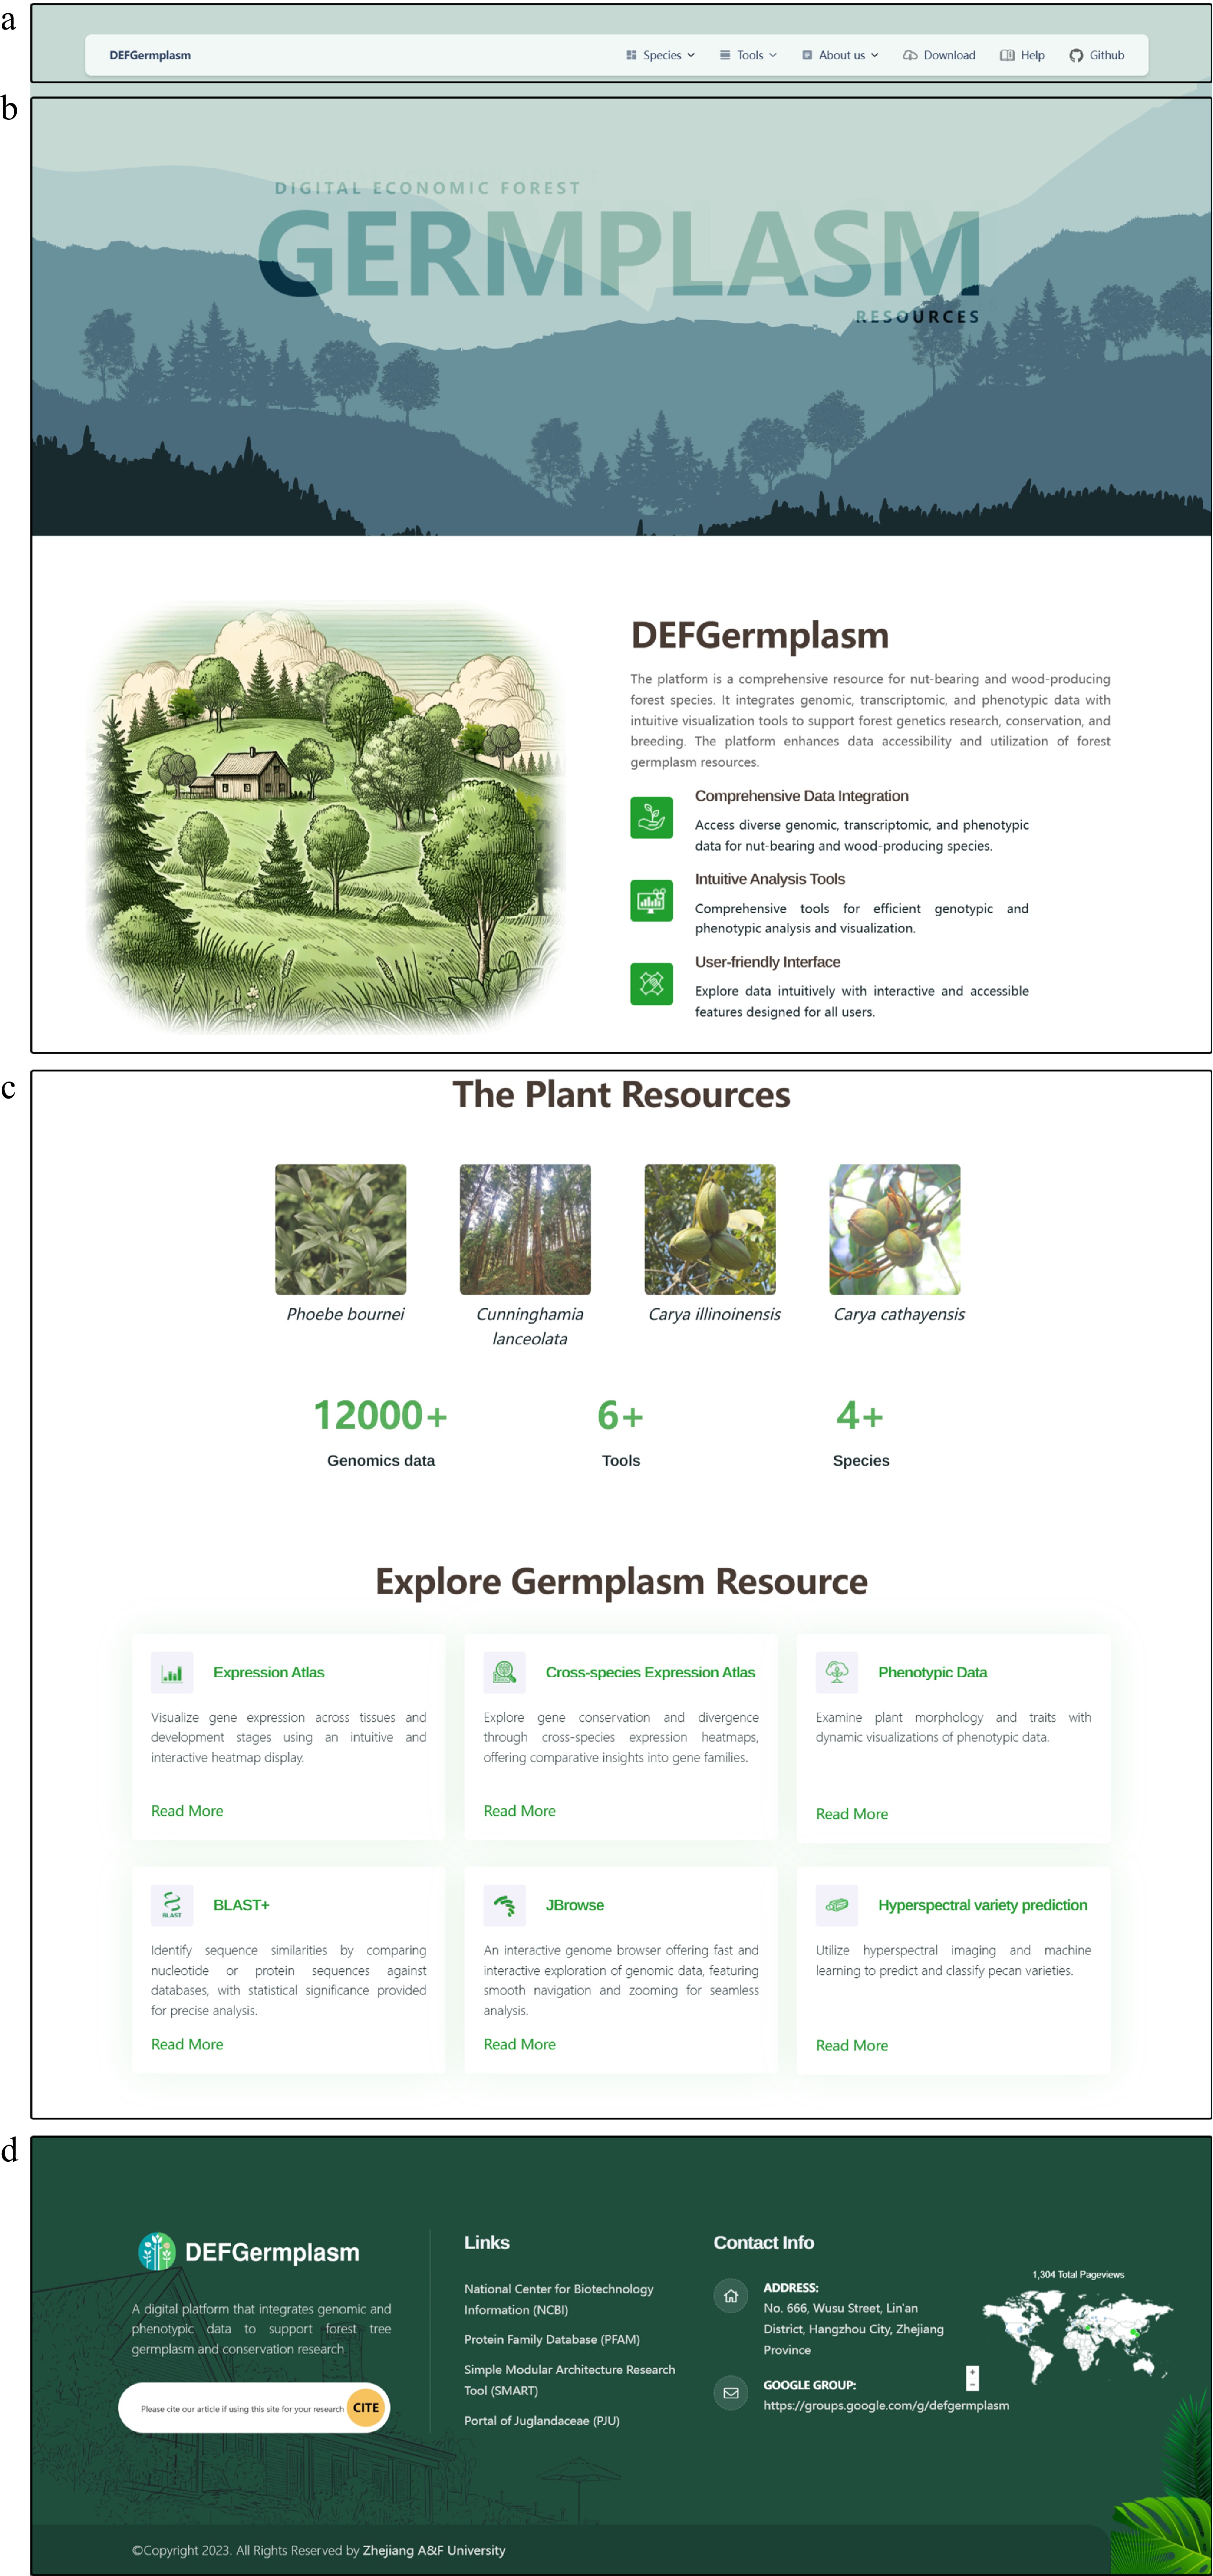
Figure 1.
The front page of the Digital Repository for Characteristic Economic Forest Germplasm Resources Platform (DEFGermplasm). (a) The navigation bar offers access to species pages, data downloads, analytical tools, and user help. (b) The homepage features a waterfall effect and silhouettes of species, emphasizing the platform's theme. (c) The main content section displays clickable images of species, offering quick access to their respective pages. This section also summarizes the platform's key datasets and tools. (d) The footer offers links to external analysis sites, website information, contact options, and a plug-in that tracks visitor data.
-
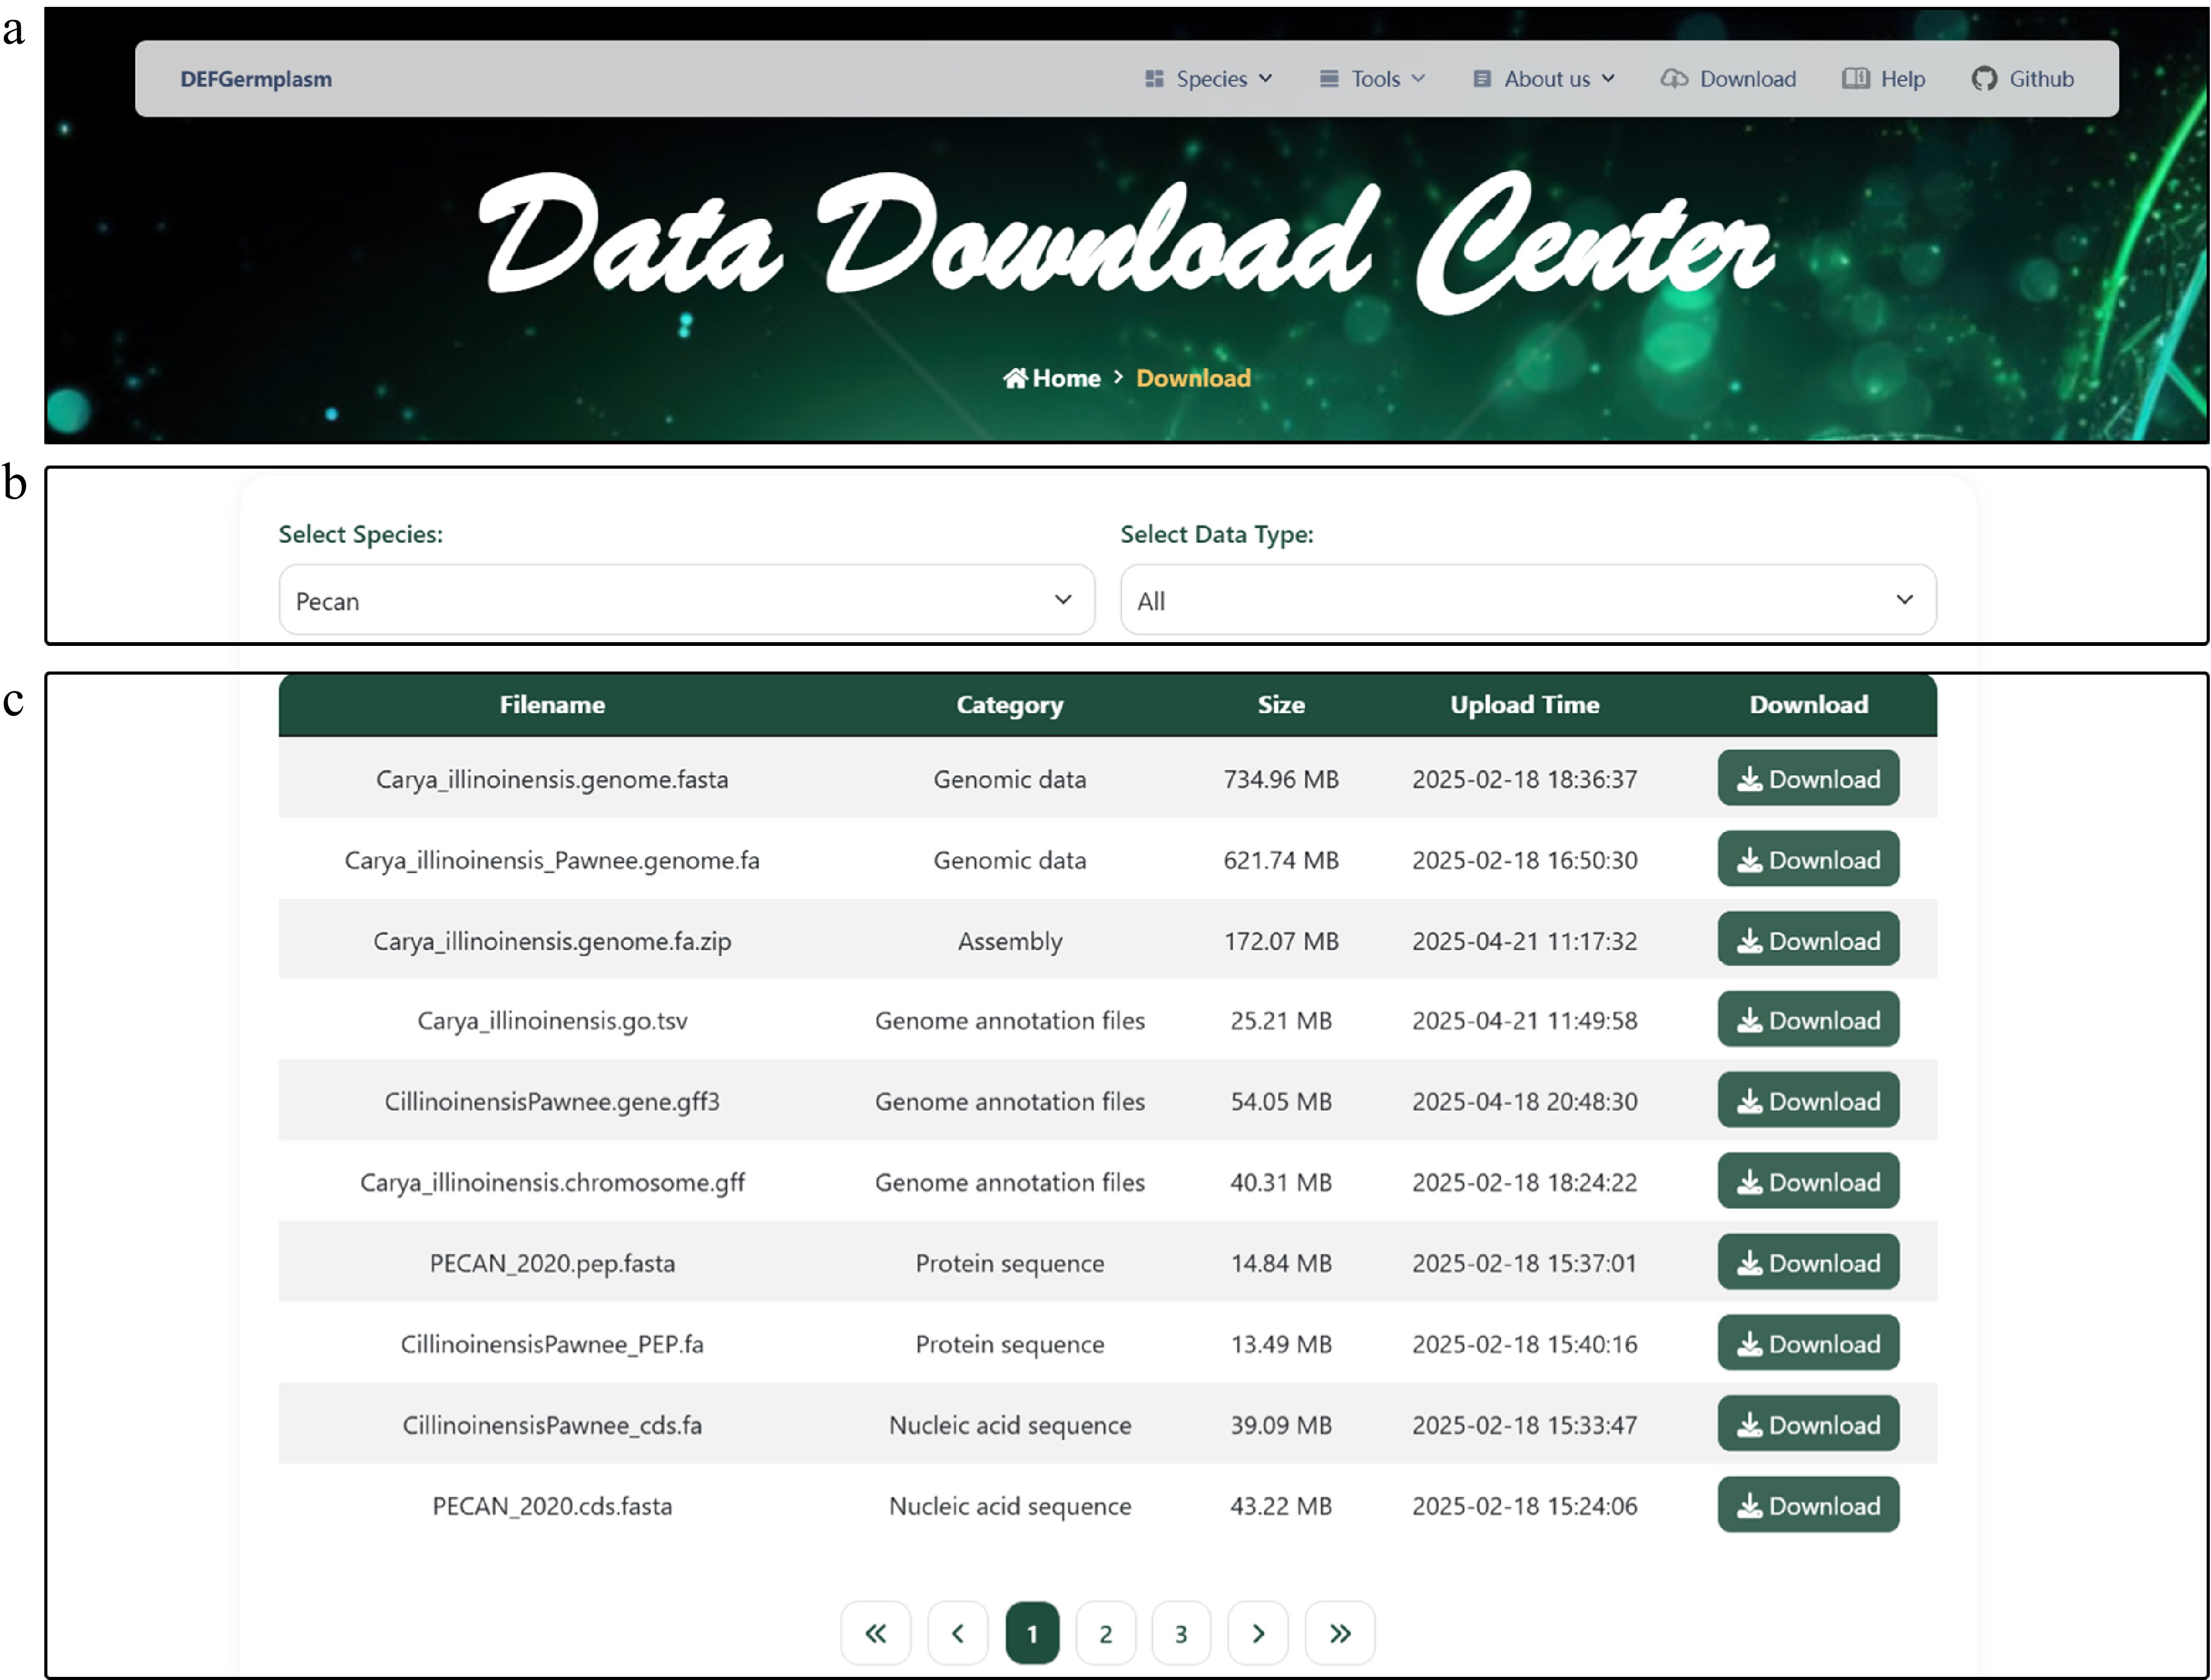
Figure 2.
Data Download Center interface. (a) The navigation bar. (b) The data download interface enables users to filter datasets based on specific criteria and download the selected data for further analysis. (c) Presentation of diverse downloadable data for pecan, including genomic, transcriptomic, and phenotypic data.
-
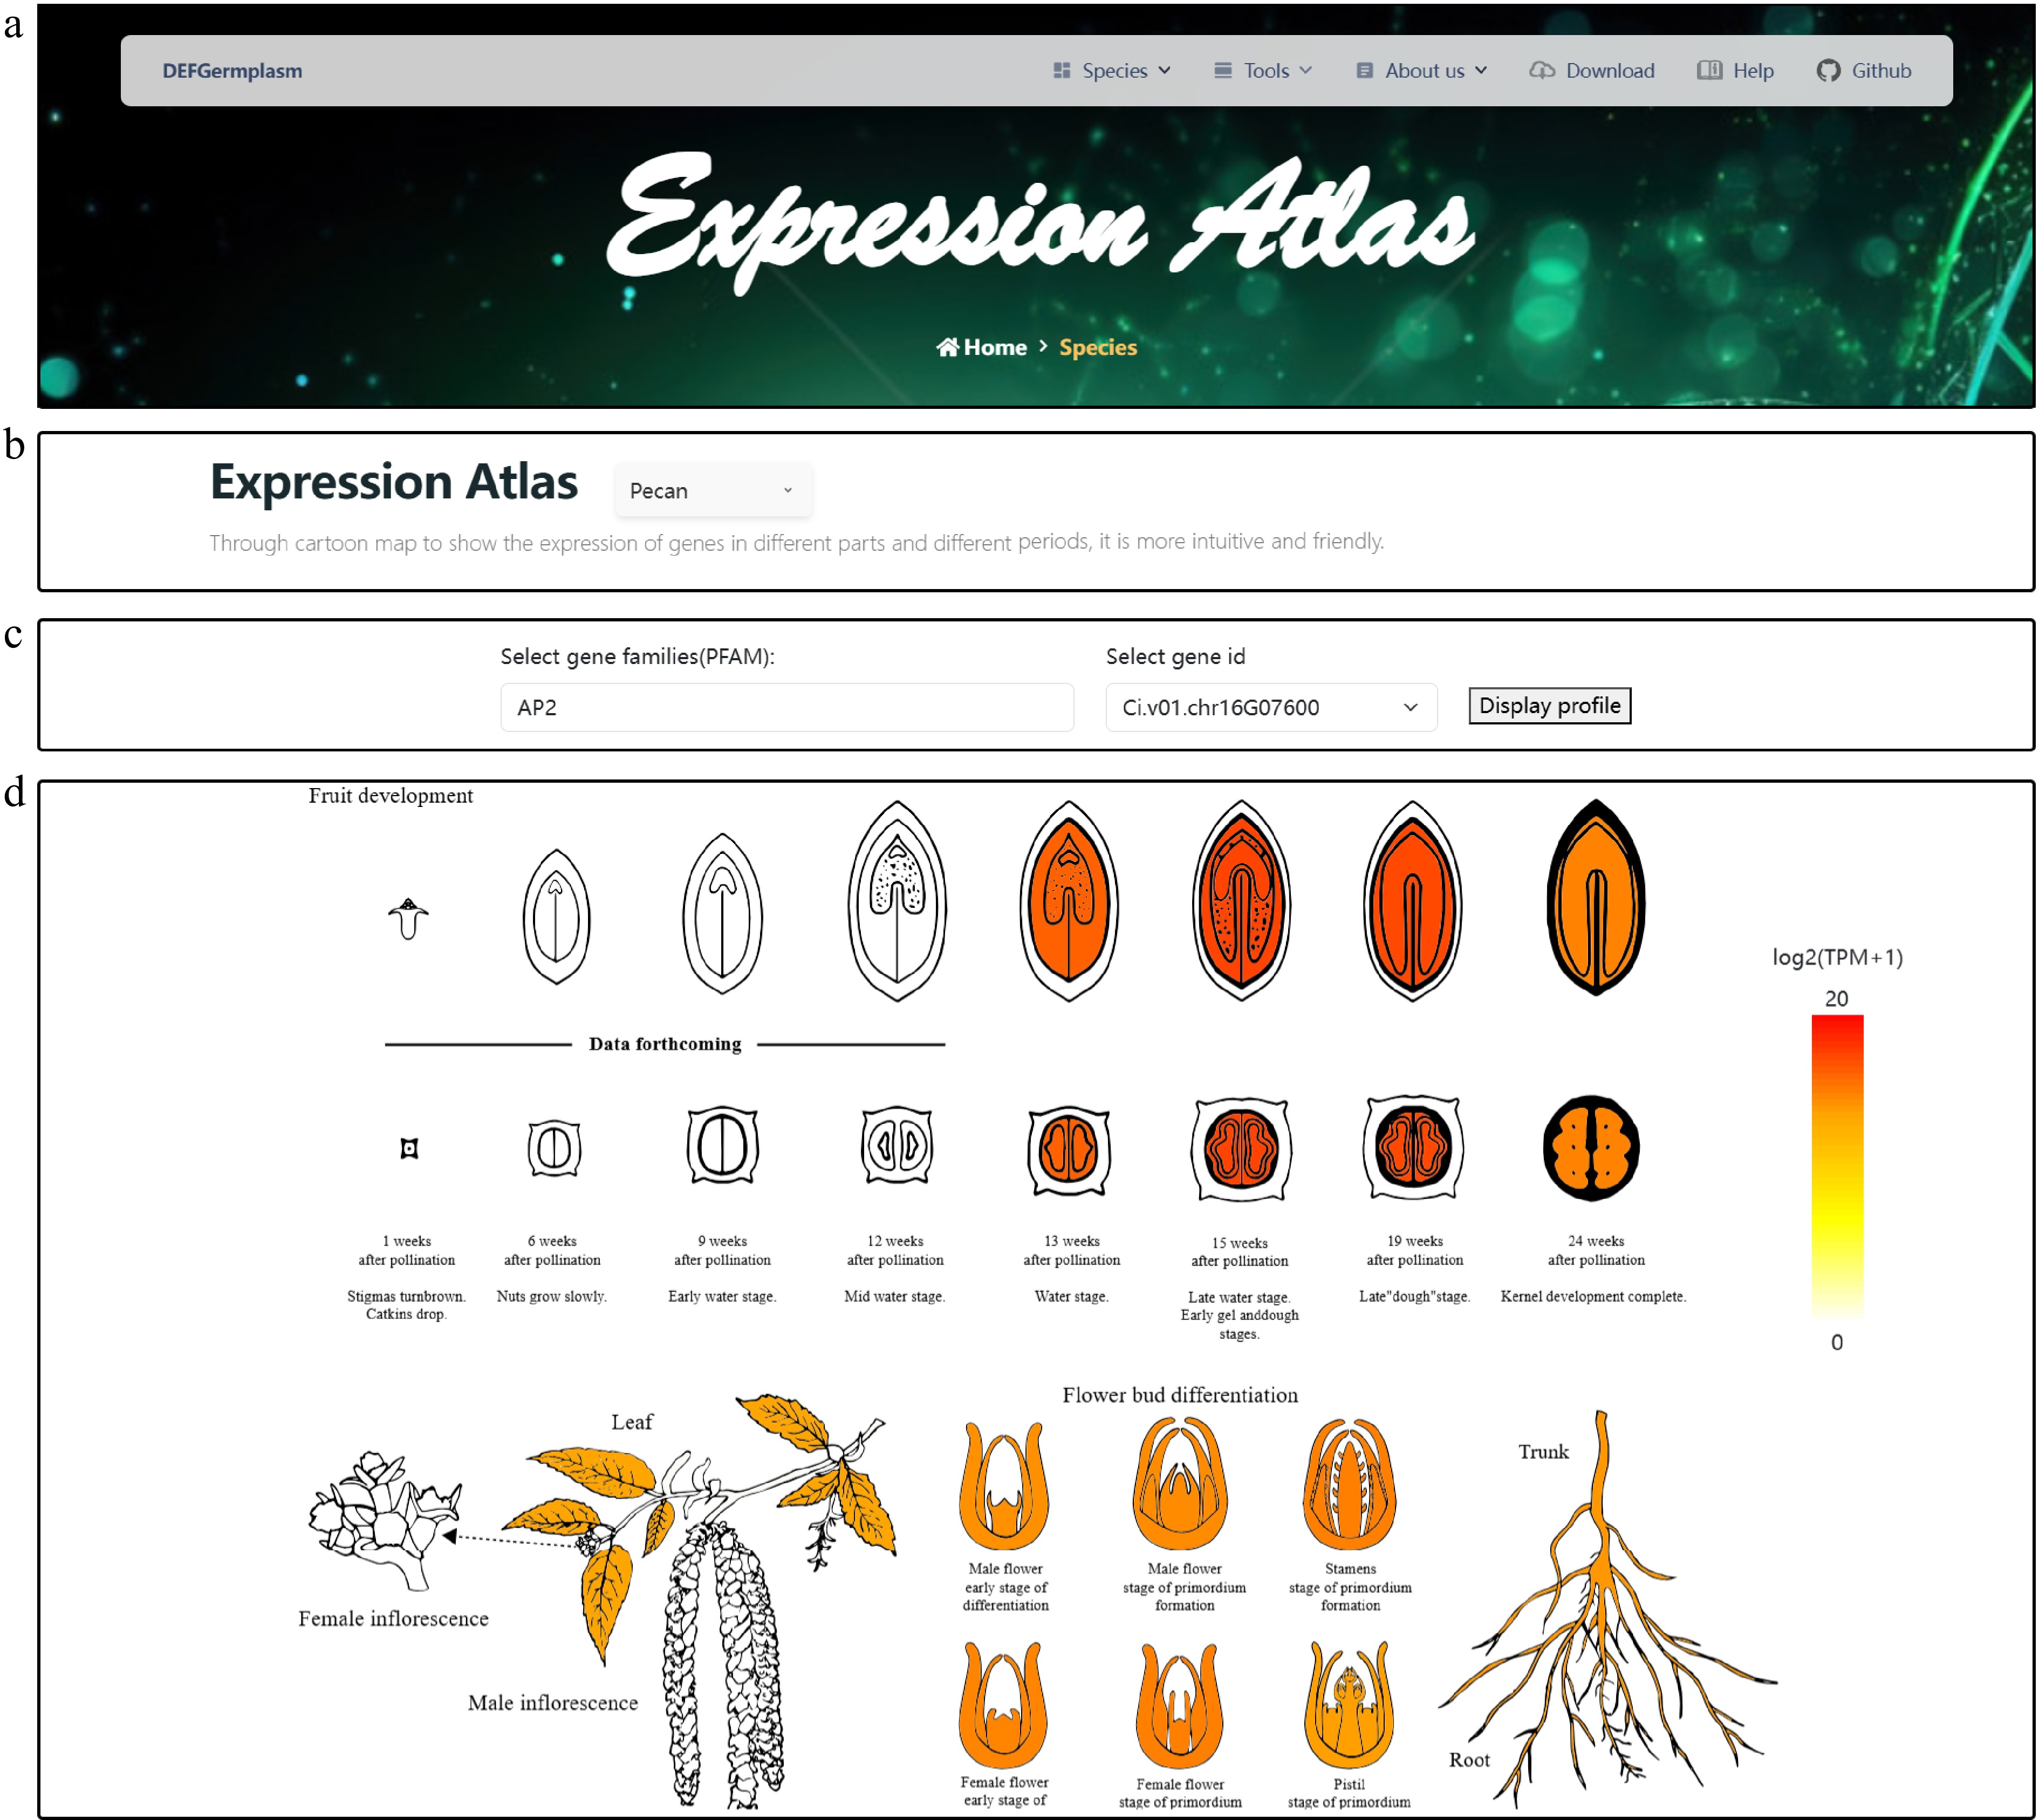
Figure 3.
Visualization of the gene expression atlas across different tissues of pecan. (a) Expression atlas logo and navigation bar. (b) Species selection interface for gene family analysis. Users can choose from multiple integrated species, which enables targeted gene family search and comparison. (c) Gene family and gene ID selection interface. Users can select a gene family of interest from a dropdown menu. The platform supports both direct input and fuzzy search to efficiently retrieve specific gene IDs within the selected family. By clicking the 'Display' button, users can generate a tissue-specific gene expression heat map for the selected gene, enabling intuitive visualization of expression patterns. (d) Detailed visualization of gene expression patterns in pecan for gene Ci.v01.chr16G07600, highlighting differences across various tissues. The heat map provides functional insights by illustrating the spatial expression profile of the gene within the plant.
-
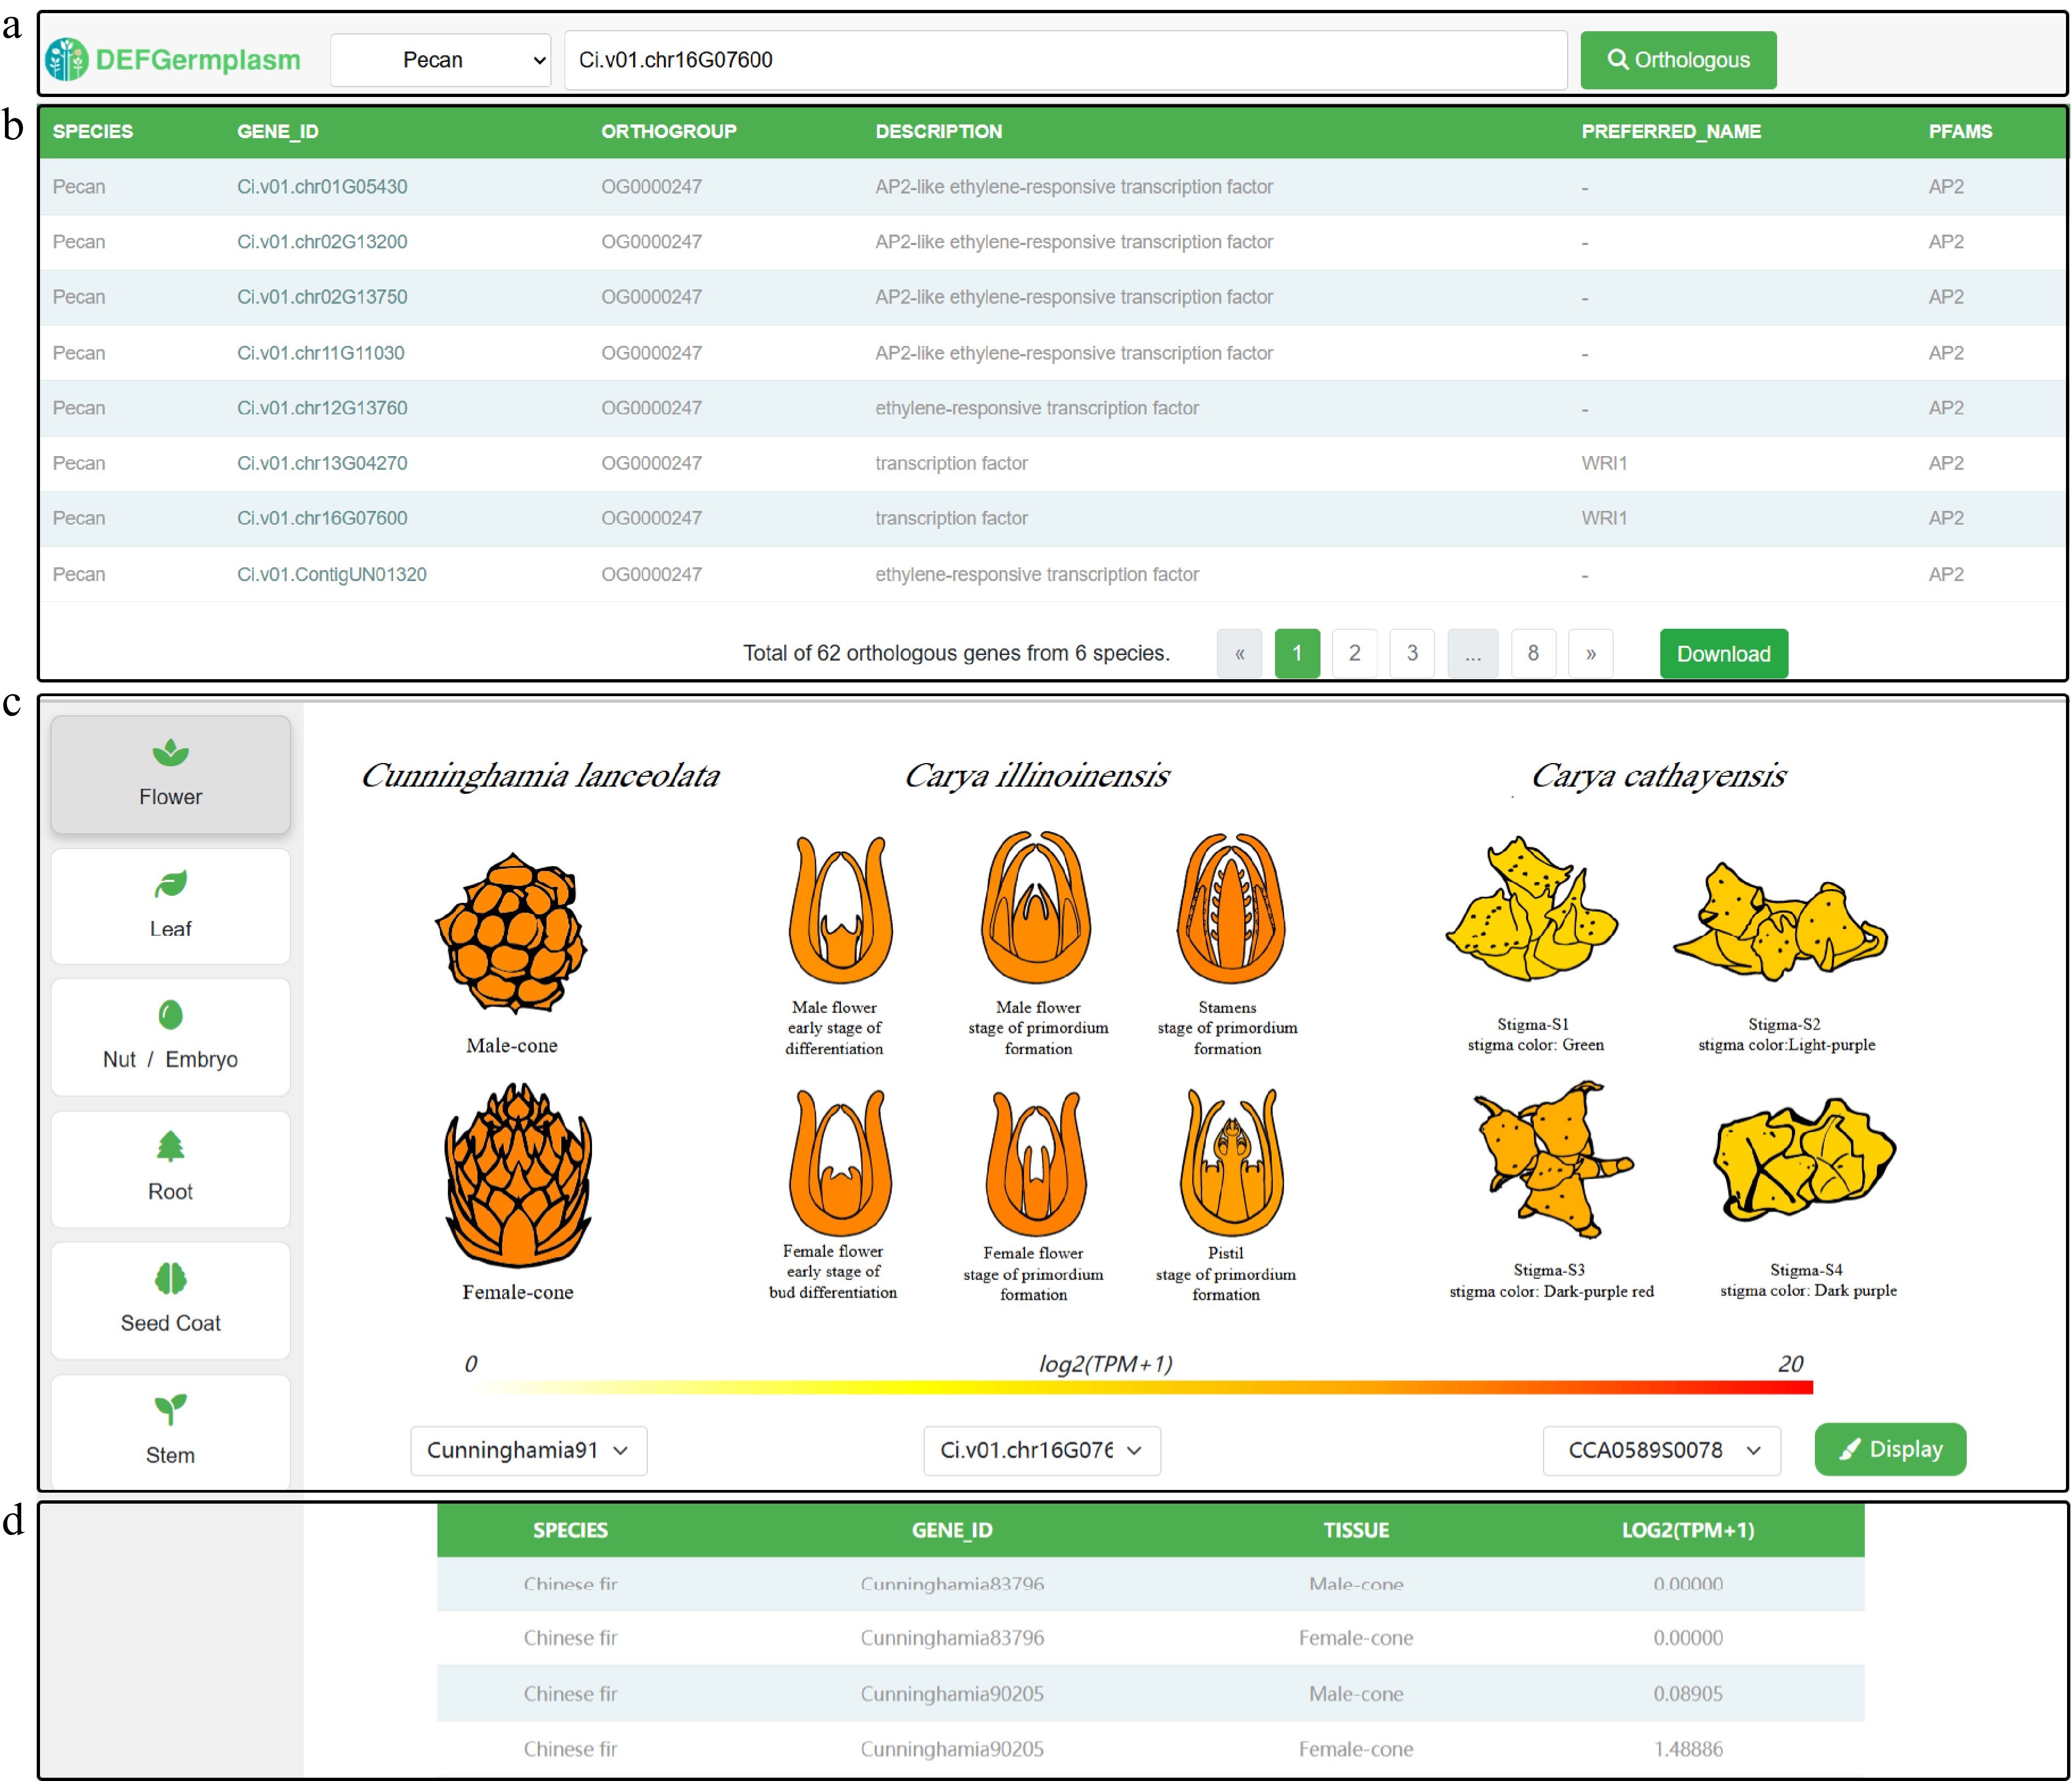
Figure 4.
Visualization of cross-species tissue gene expression. (a) Dropdown menu for selecting species and input box for searching genes using gene IDs. (b) Search results table showing orthologous genes, their annotations, and an option to download data for further analysis. (c) Detailed visualization of orthologous gene expression patterns across the same tissue in different species, highlighting tissue-specific differences for functional insights. (d) The summary table shows the gene IDs and their corresponding expression levels in different species, sorted by highest expression level.
-
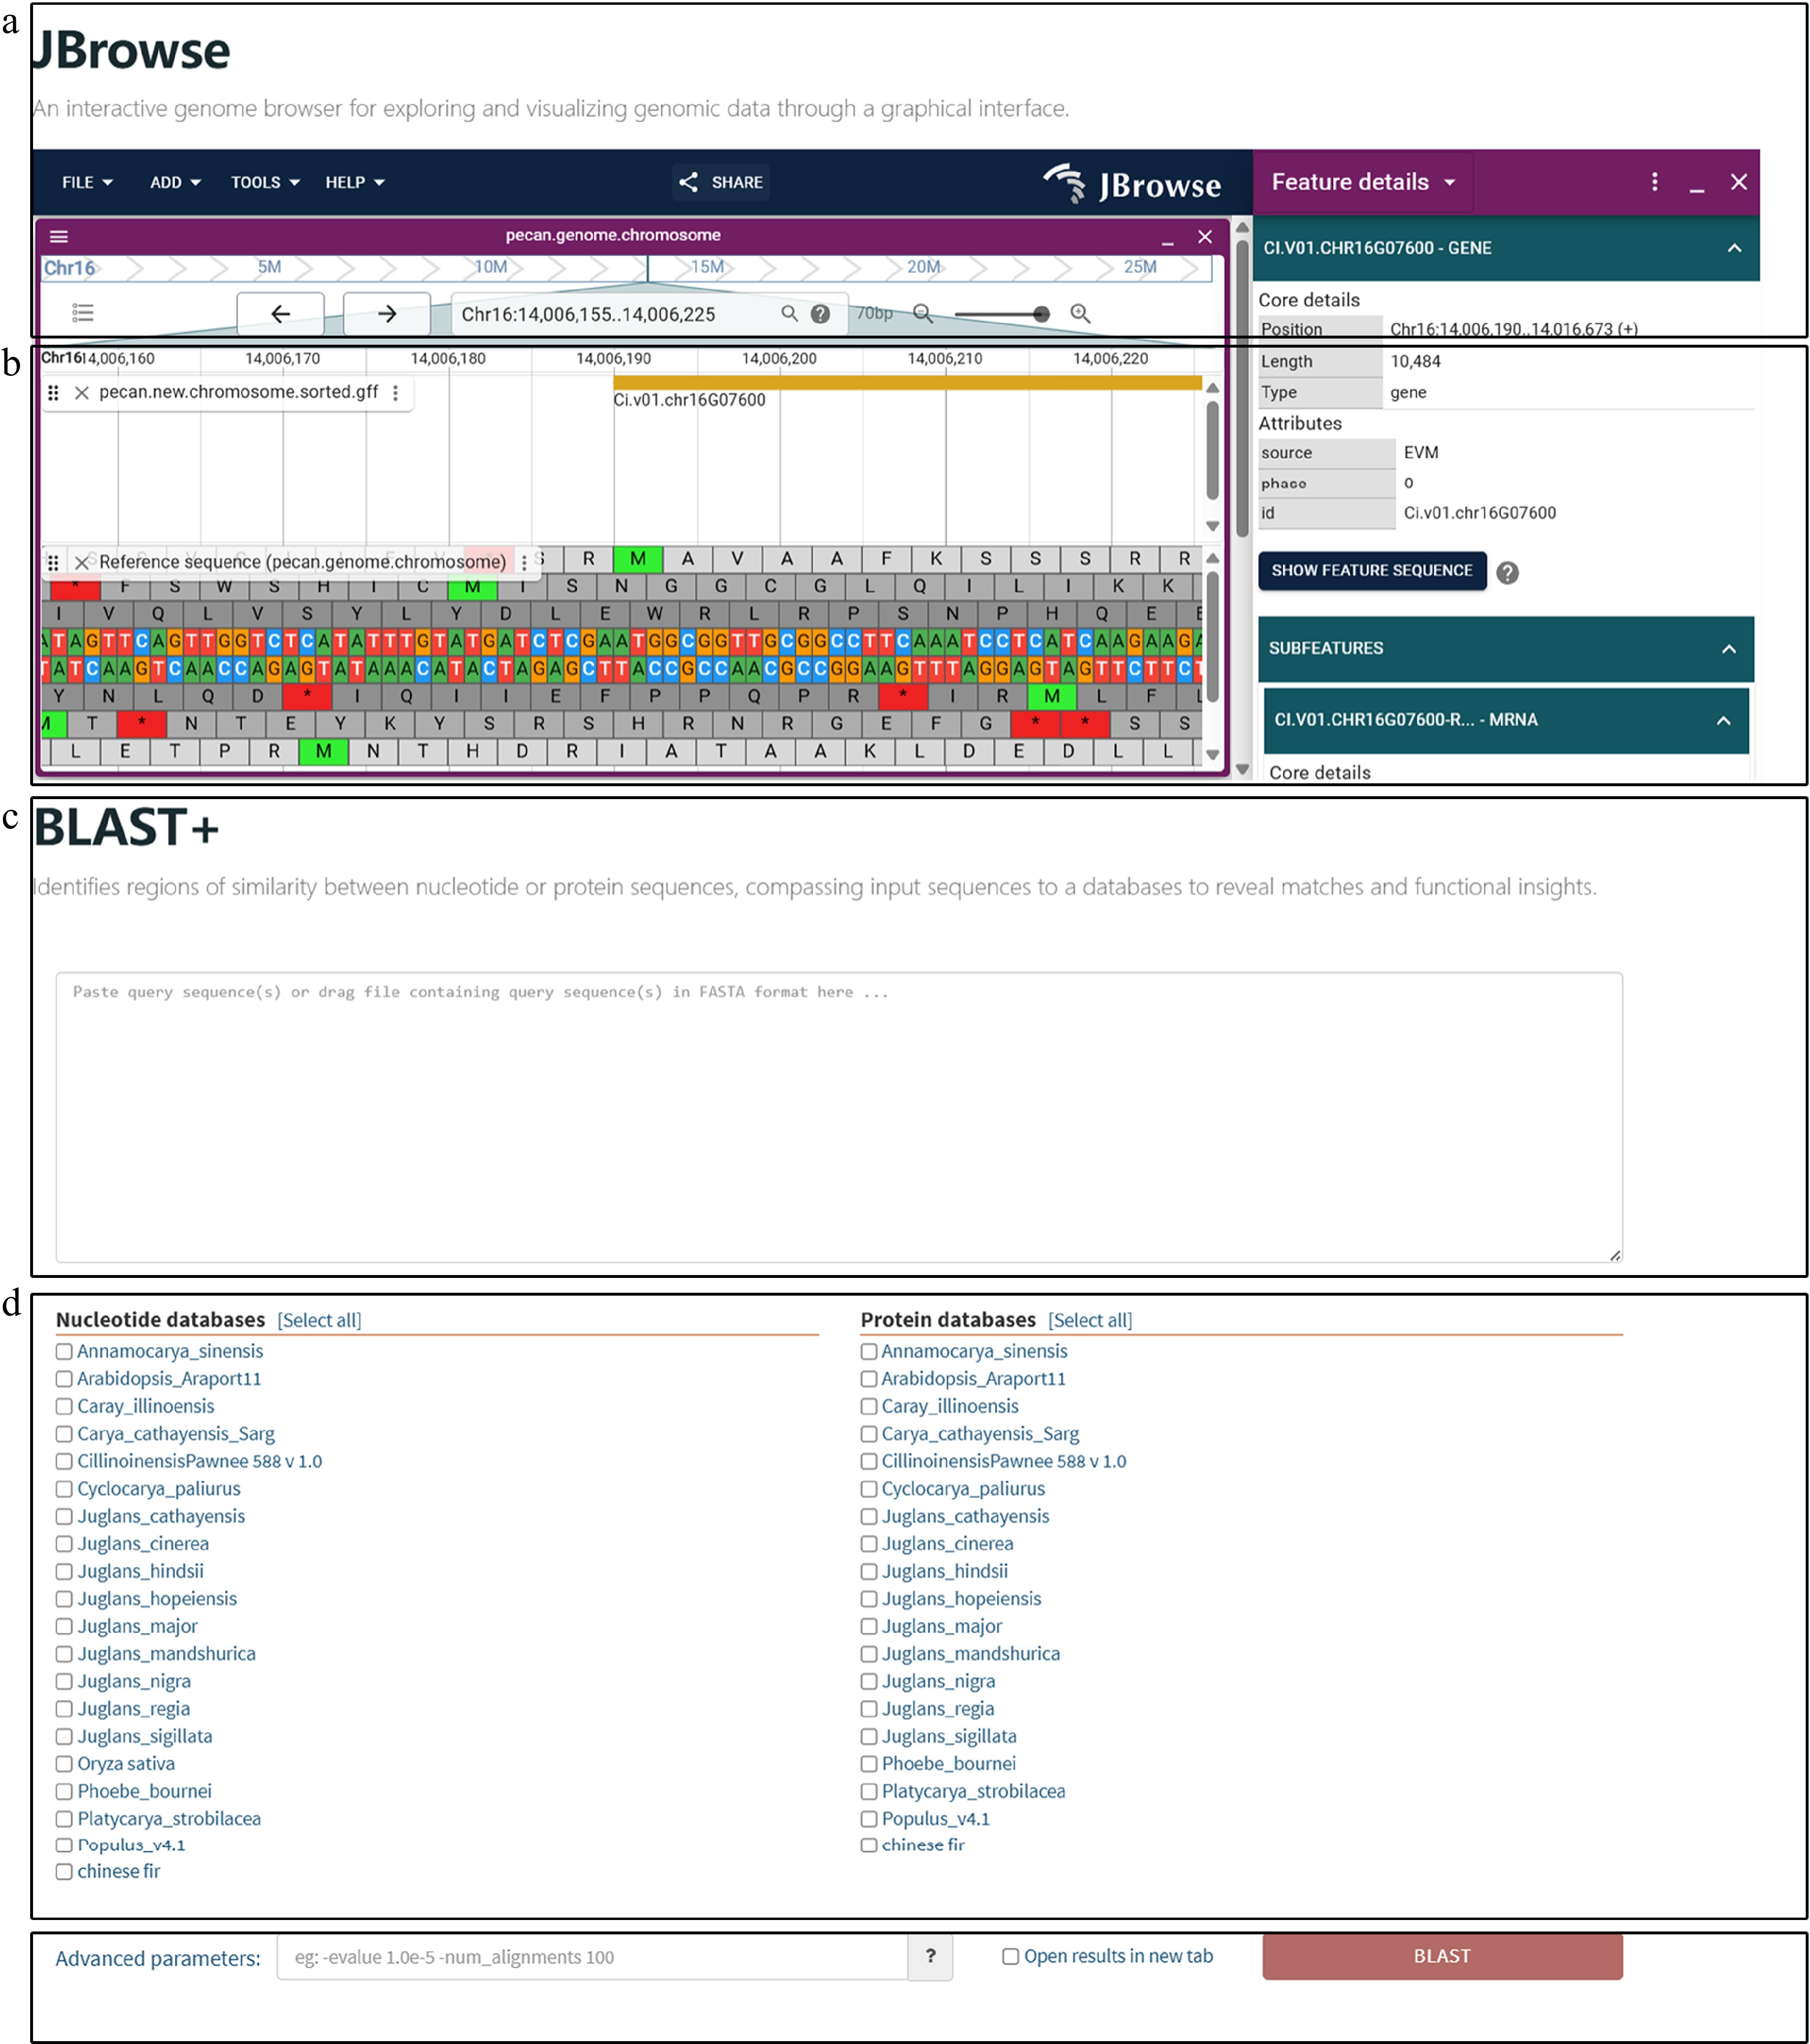
Figure 5.
Sequence homology search and interactive visualization of genomic data. (a) Genome browser interface implemented with JBrowse. Users can explore genome structures and annotations through an intuitive graphical interface. (b) Detailed genome view in JBrowse showing gene structures, including exons and introns, along with functional annotations. Users can zoom into specific regions to explore gene features, regulatory elements, and expression data for in-depth genetic analysis. (c) Homology searches are initiated by inputting CDS or PEP sequences through a user-friendly interface that supports both pasting and uploading. Detailed results include alignment scores, match statistics, and sequence similarities. (d) Users can select the desired algorithm (BLASTN or BLASTP) and reference database for comparison. The platform integrates genomic datasets from pecan, hickory, Chinese fir, phoebe, and public databases, enabling multi-species comparisons. (e) Additional parameters, such as e-value thresholds, can be configured to refine search criteria and enhance result precision.
-
Common name Scientific name Tissue Accession ID Pecan Carya illinoinensis (Wangenh.) K.Koch Fruit PRJNA839178 (NCBI) Pecan Carya illinoinensis (Wangenh.) K. Koch Leaf PRJNA1232222(NCBI) Pecan Carya illinoinensis (Wangenh.) K. Koch Root PRJNA967165 (NCBI) Pecan Carya illinoinensis (Wangenh.) K. Koch Flower PRJNA839160 (NCBI)[59] Hickory Carya cathayensis Sarg. Fruit PRJNA687050 (NCBI)[60] Hickory Carya cathayensis Sarg. Flower stigma PRJNA810757 (NCBI)[61] Chinese fir Cunninghamia lanceolata (Lamb.) Hook Leaf CRA003755 (NGDC)[62] Chinese fir Cunninghamia lanceolata (Lamb.) Hook Root Chinese fir Cunninghamia lanceolata (Lamb.) Hook Stem Chinese fir Cunninghamia lanceolata (Lamb.) Hook Stem bark Chinese fir Cunninghamia lanceolata (Lamb.) Hook Stem xylem Chinese fir Cunninghamia lanceolata (Lamb.) Hook Male cone Chinese fir Cunninghamia lanceolata (Lamb.) Hook Female cone Phoebe Phoebe bournei (Hemsl.) Yen C.Yang Leaf PRJNA628065 (NCBI)[58] Phoebe Phoebe bournei (Hemsl.) Yen C.Yang Root Phoebe Phoebe bournei (Hemsl.) Yen C.Yang Root bark Phoebe Phoebe bournei (Hemsl.) Yen C.Yang Root xylem Phoebe Phoebe bournei (Hemsl.) Yen C.Yang Stem xylem Phoebe Phoebe bournei (Hemsl.) Yen C.Yang Stem bark Table 1.
Transcriptomics data obtained from species' tissues.
Figures
(5)
Tables
(1)