-
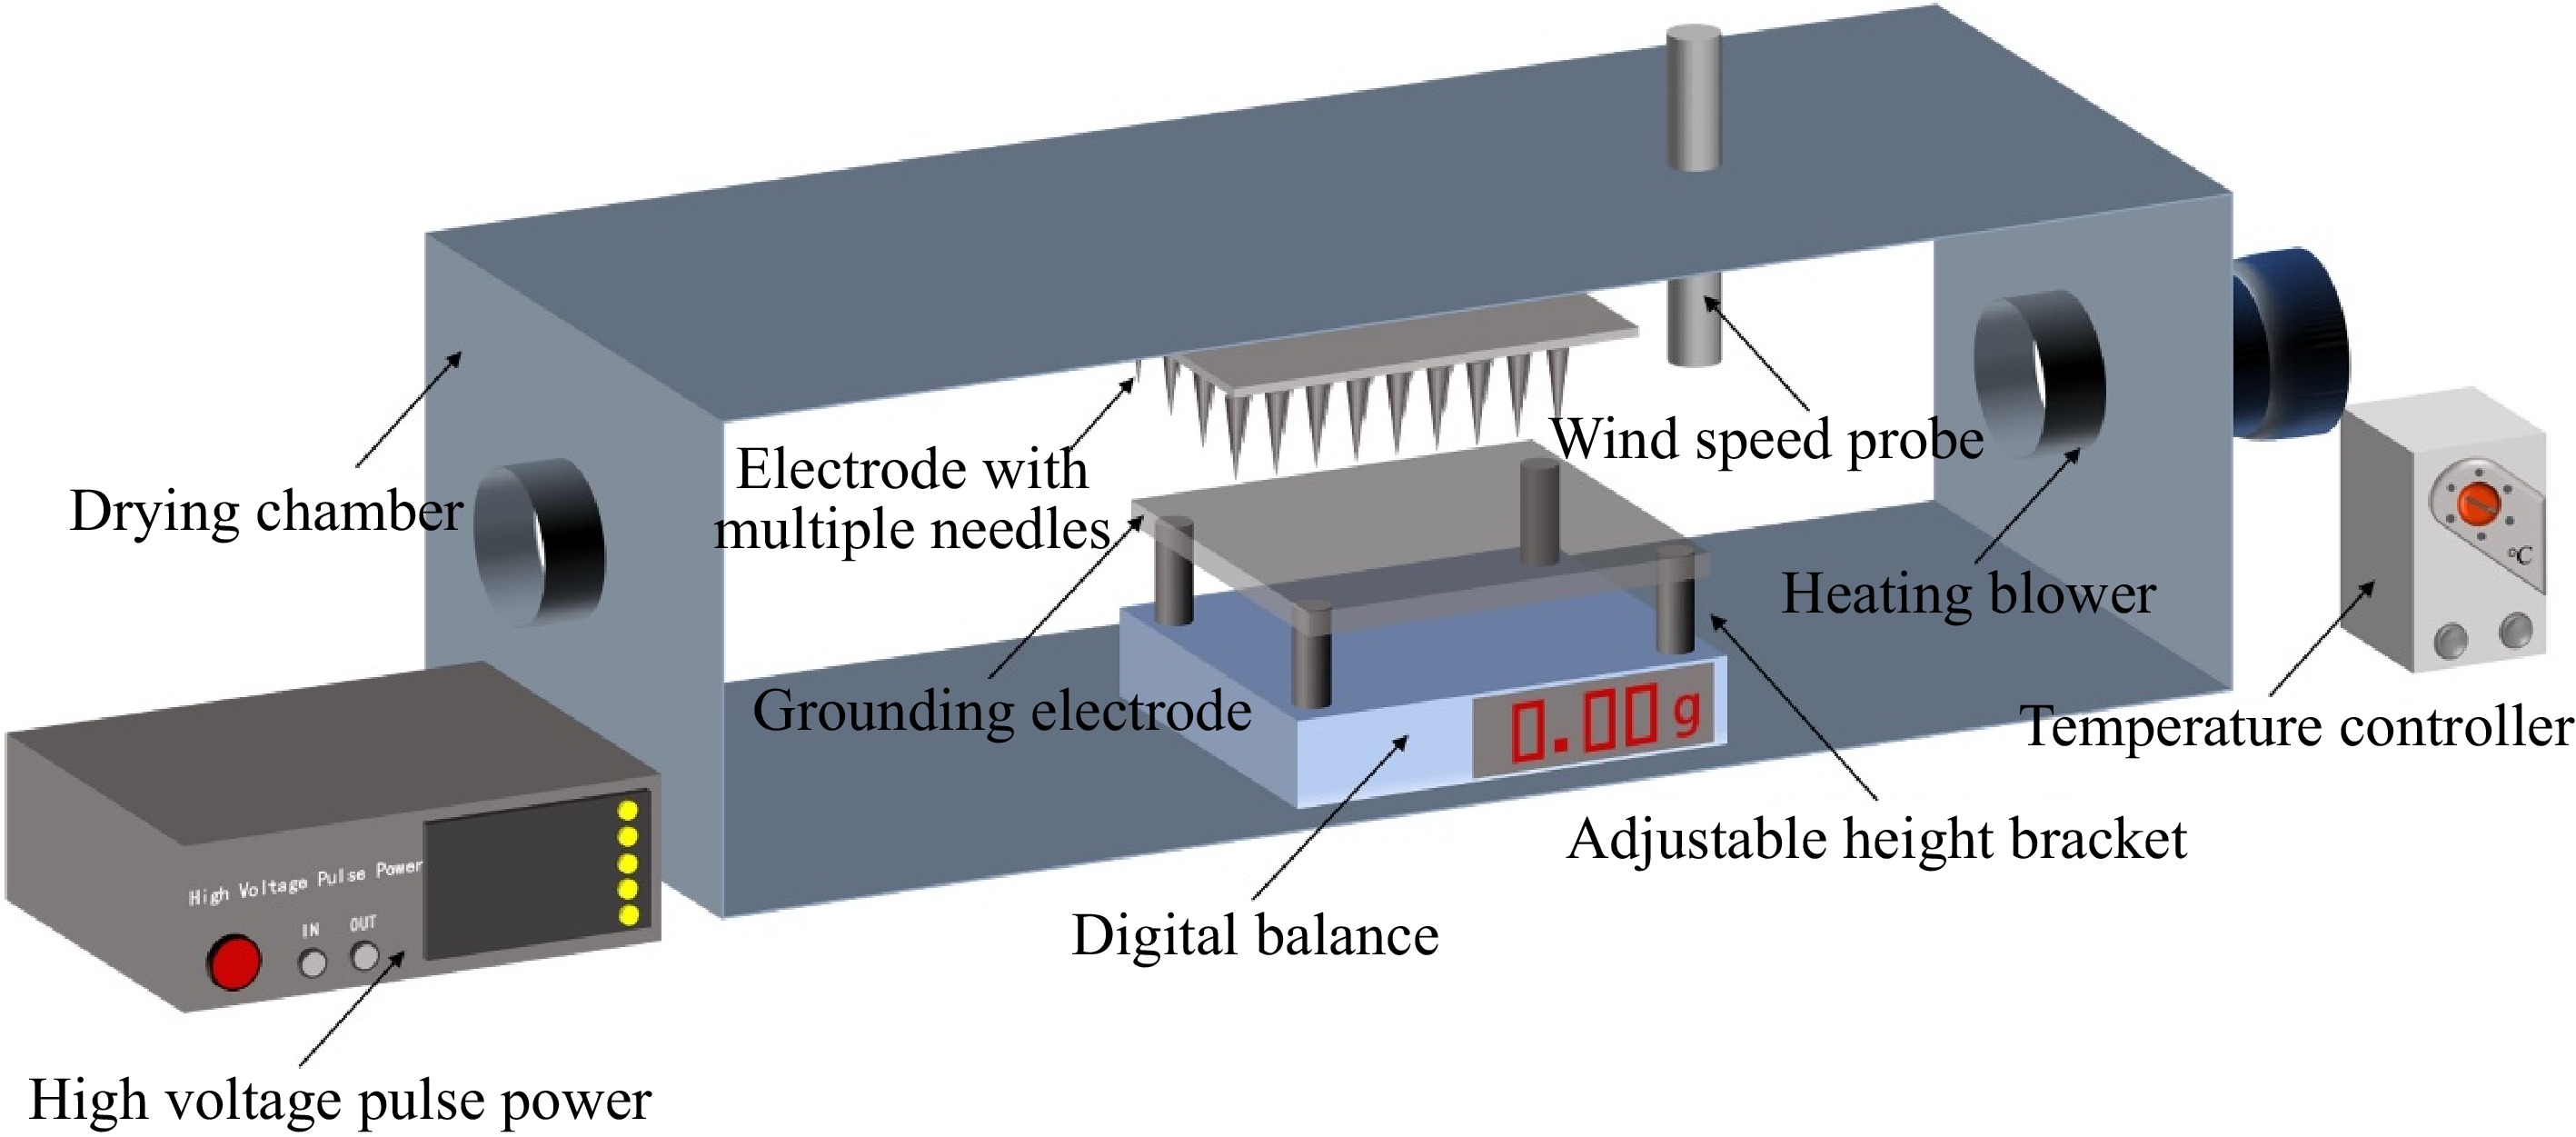
Figure 1.
Plasma drying experimental setup.
-
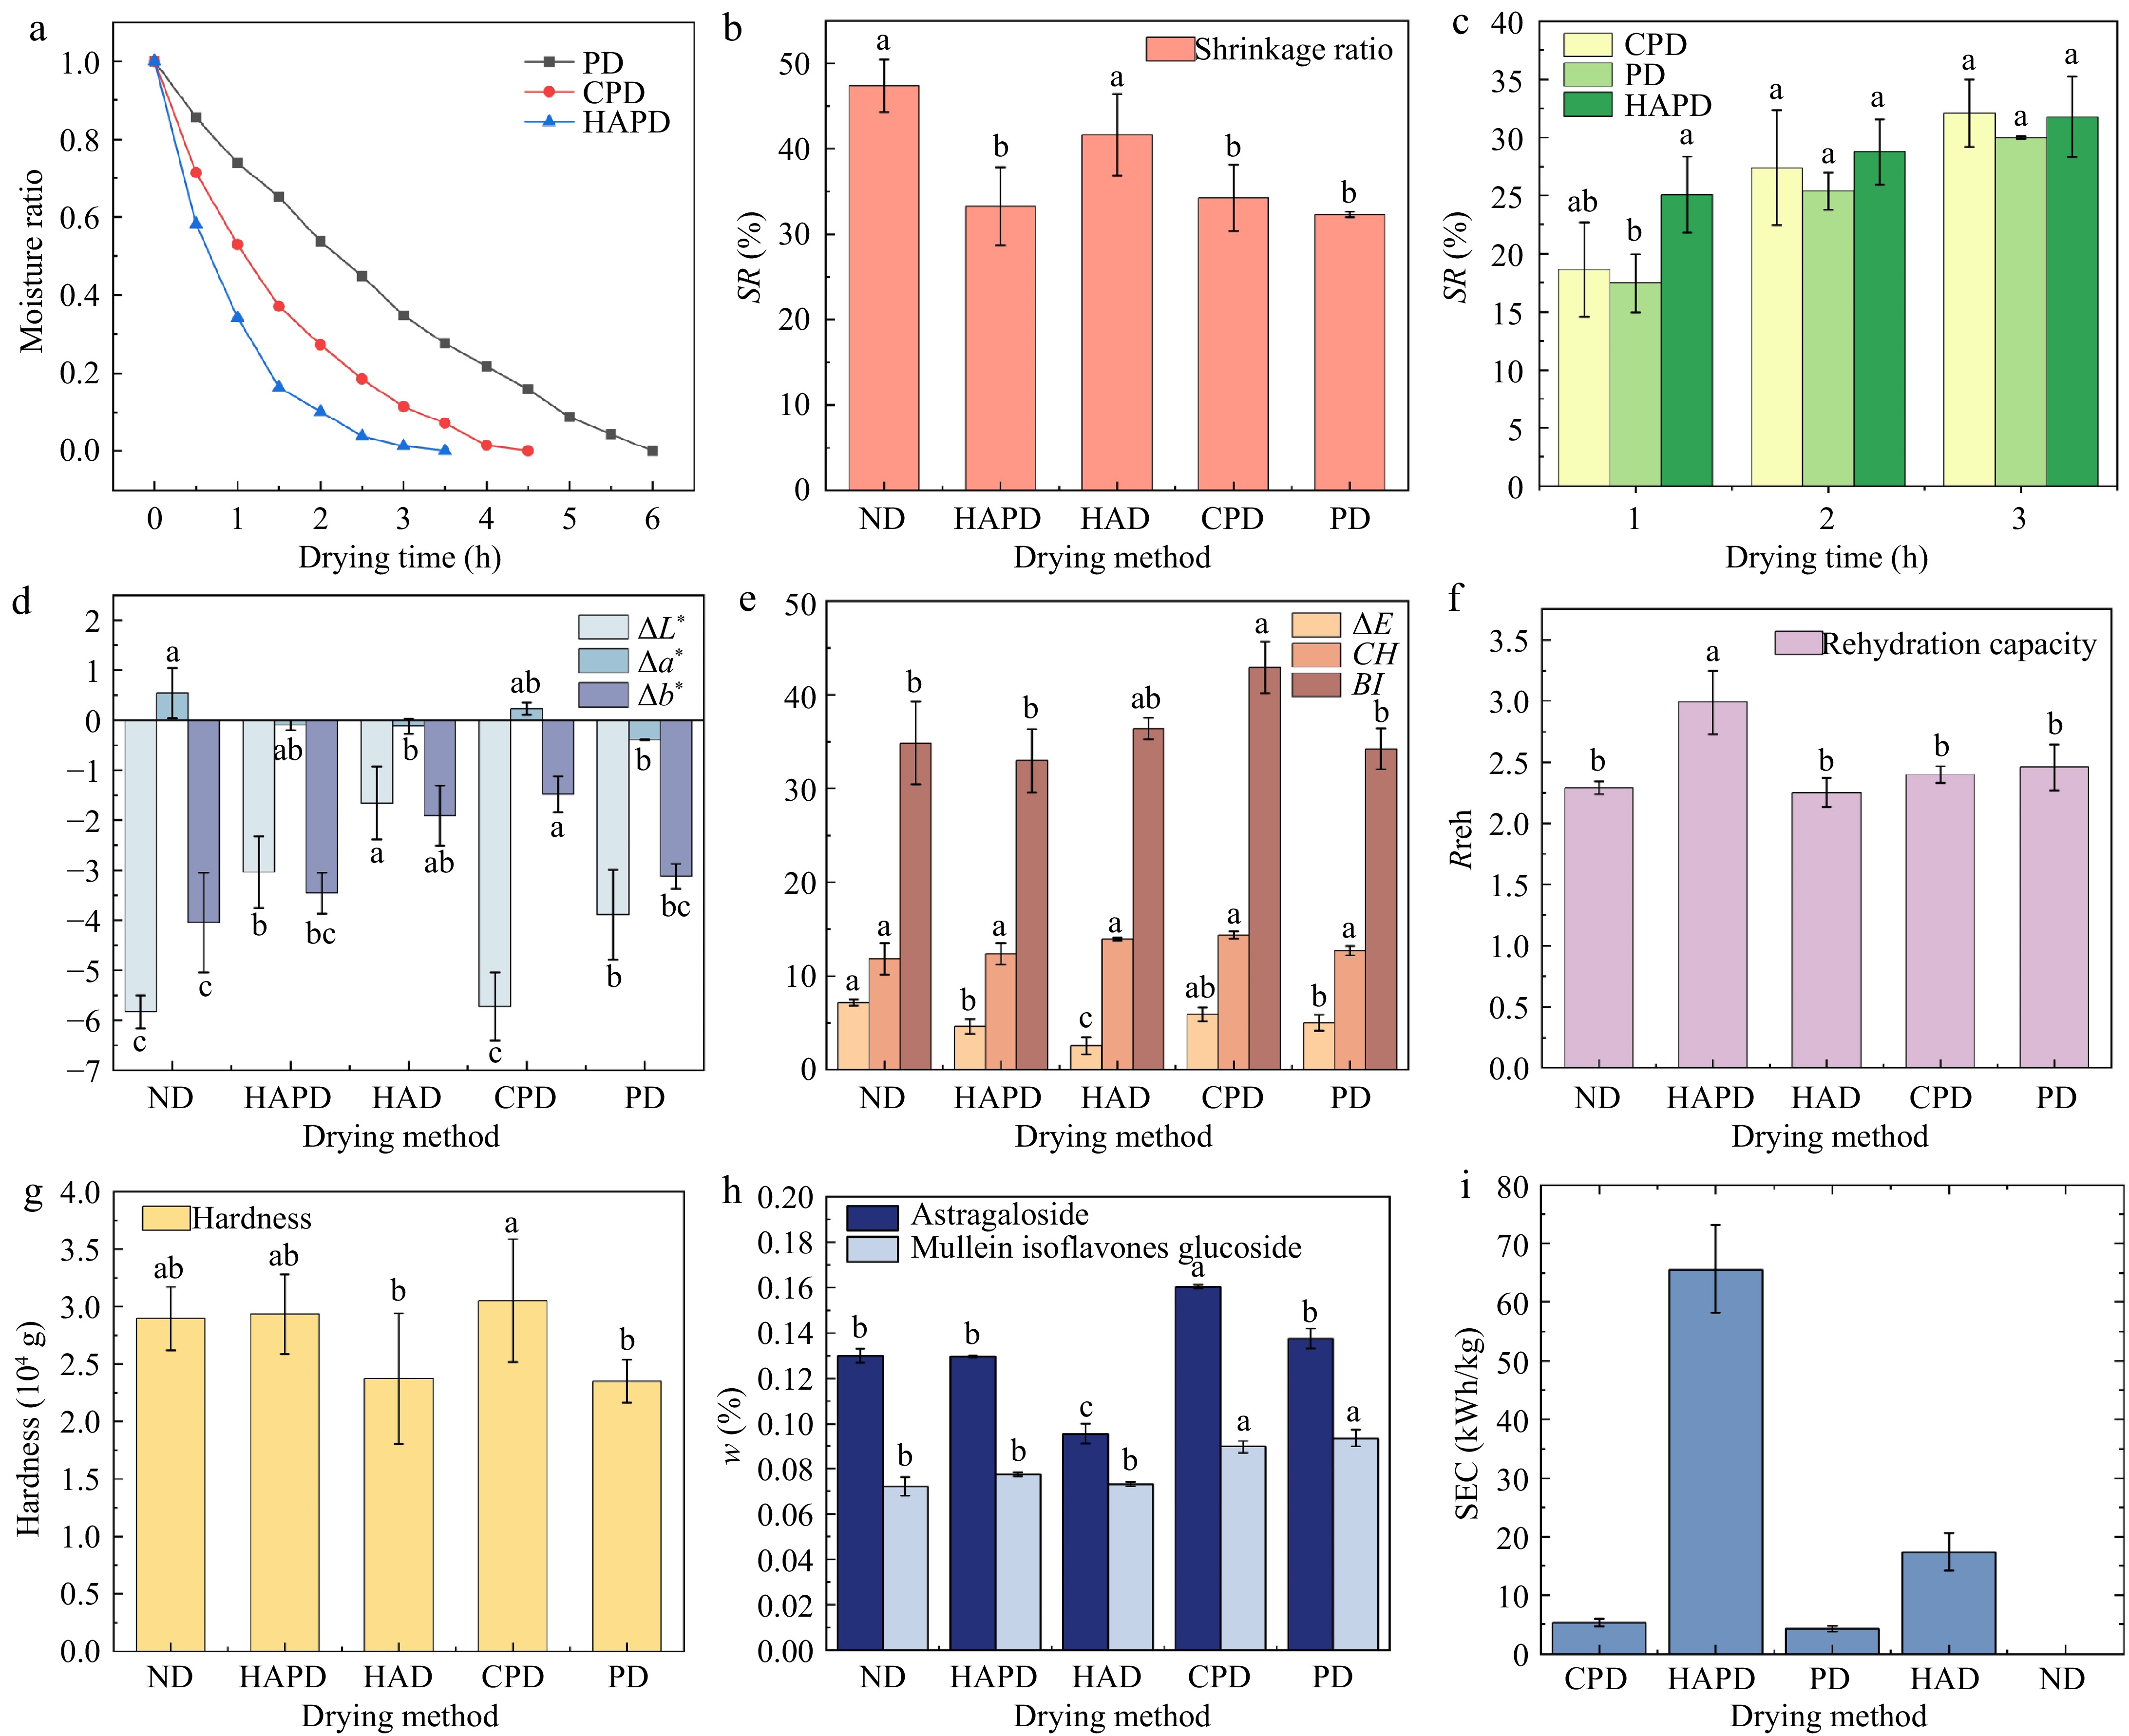
Figure 2.
Parameters of Astragalus slices under different drying treatments: (a) Moisture ratio; (b), (c) Shrinkage ratio; (d), (e) Color parameters; (f) Rehydration ratio; (g) Hardness; (h) Active ingredients; and (i) SEC. Letters above the bars in the same plot indicate significant differences between treatments at the 95% confidence level (p < 0.05).
-
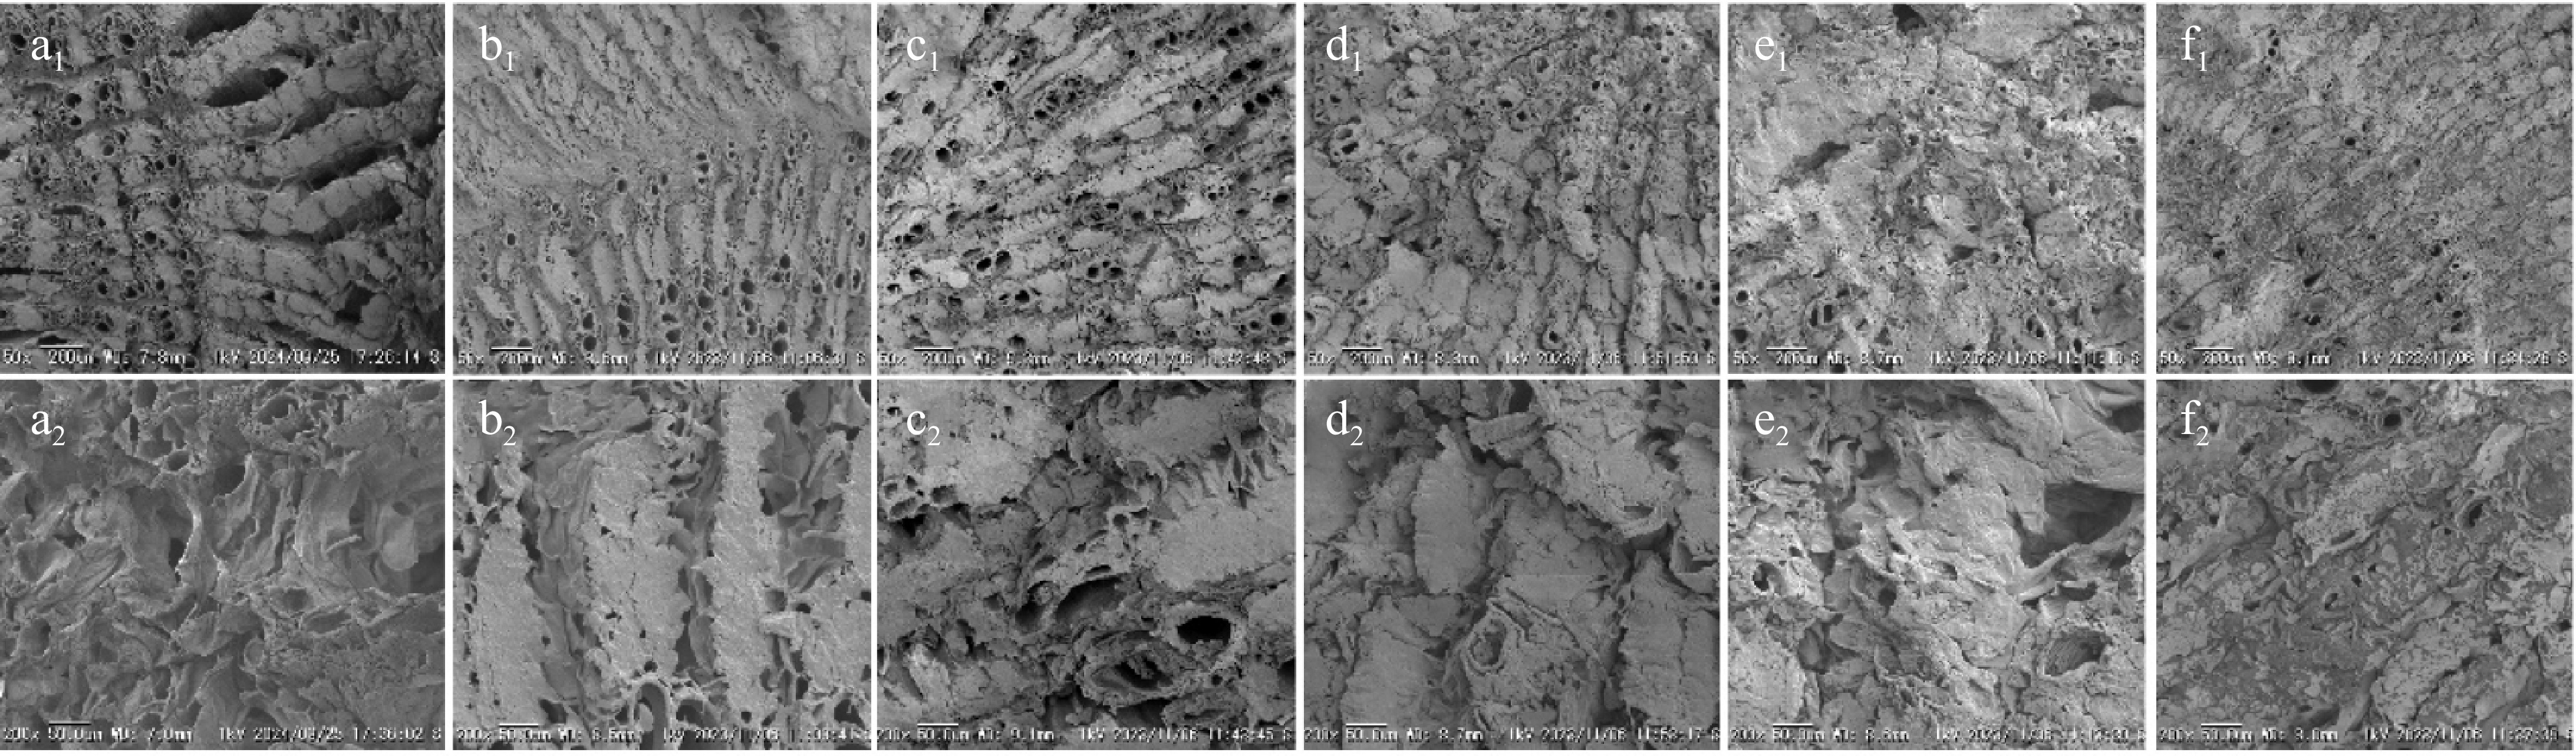
Figure 3.
Scanning electron micrographs of Astragalus slices. (a1), (a2) Fresh. (b1), (b2) PD; (c1), (c2) CPD; (d1), (d2) HAPD; (e1), (e2) HAD; and (f1), (f2) ND. Scale bars: (a1)−(f1) 50x magnification, (a2)−(f2) 200x magnification.
-
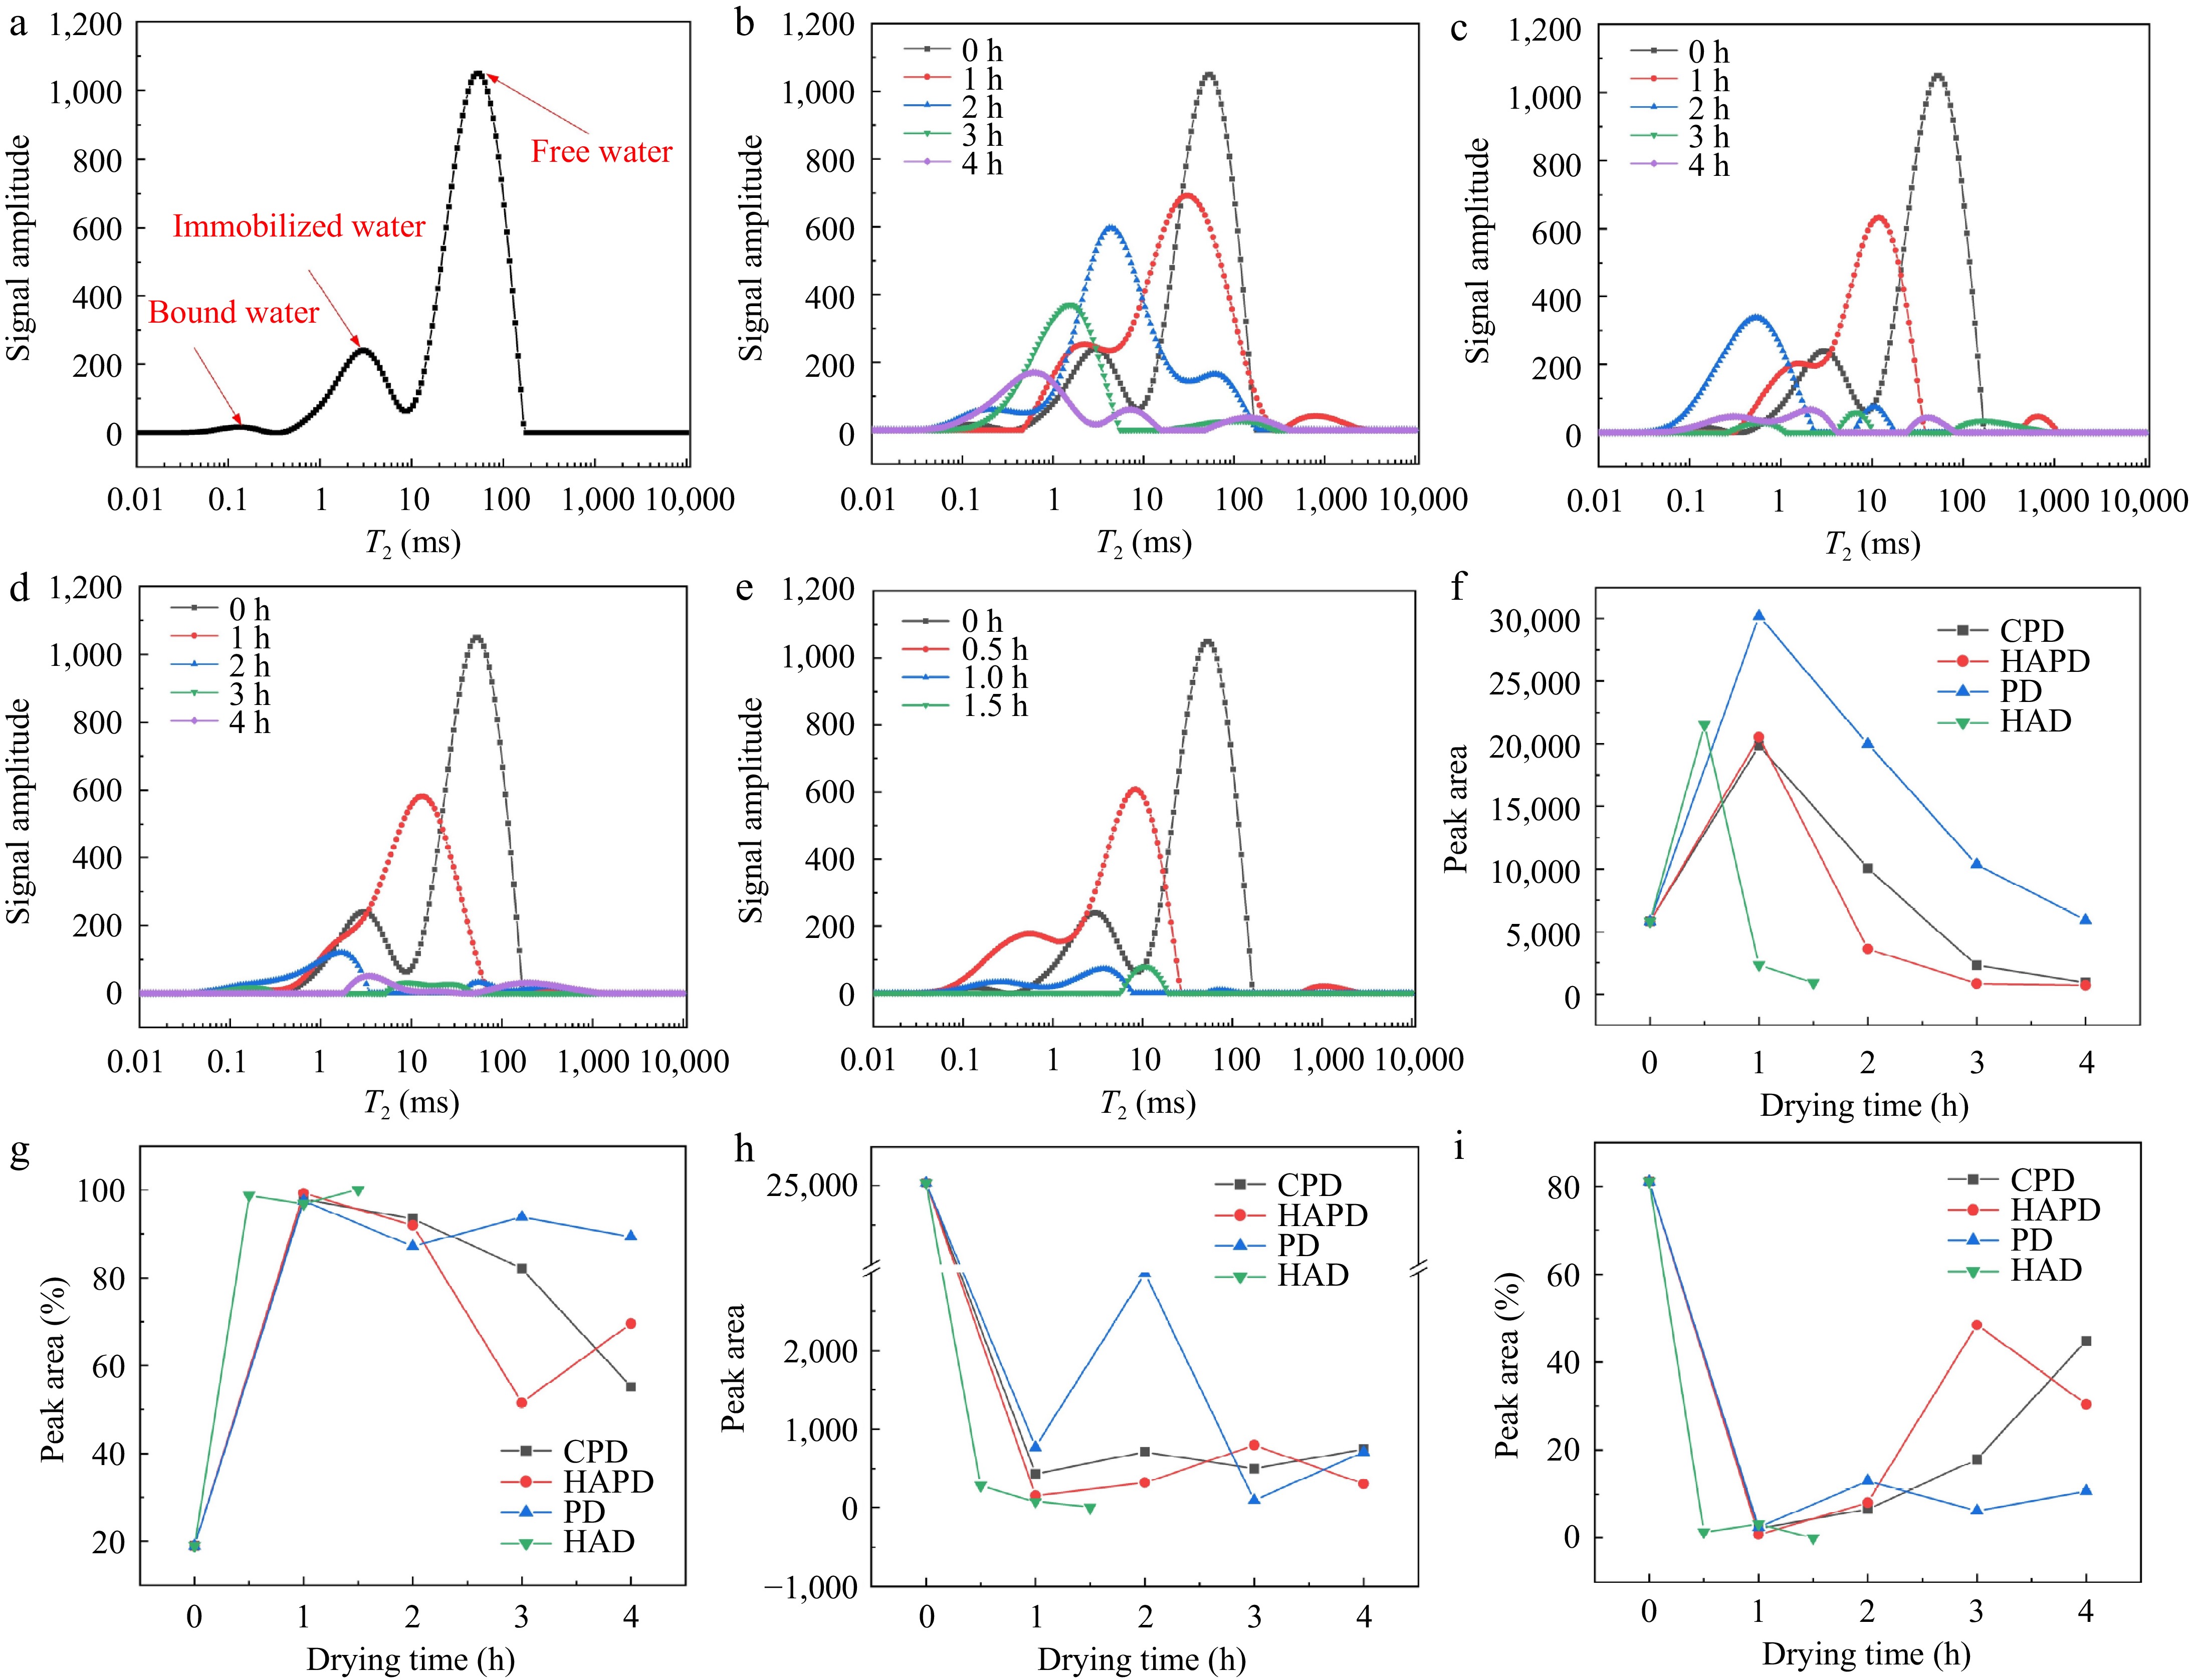
Figure 4.
Inverse plot of the transverse relaxation time of (a) fresh Astragalus slices, (b) Astragalus slices during PD, (c) Astragalus slices during CPD, (d) Astragalus slices during HAPD, and (e) Astragalus slices during HAD. Peak areas and peak ratios of moisture in different states of Astragalus slices during drying by different drying methods. (f), (g) Bound water + immobilized water. (h), (i) Free water.
-
PD CPD HAPD Needle-plate distance (mm) 25 25 25 High voltage electric field (kV) 17 17 17 Convective air velocity (m/s) 0.2 3.5 3.5 Airflow temperature (°C) 25 25 50 Table 1.
Parameter settings of the plasma drying device.
-
Drying methods Abbreviations Drying equipment Drying conditions Natural drying ND − Temperature of 24−27 °C and relative humidity of 55%−61% Hot air drying HAD Mingtu Machinery Equipment Co. (China) XMA-2000 The heating temperature is set to 50 °C Plasma drying PD Home-made (Fig. 1) Table 1 Convection-plasma synergistic drying CPD Hot air-plasma synergistic drying HAPD Table 2.
Five drying methods and conditions.
-
Time (min) Mobile phase A: CH3CN B: HAc 0 20% 80% 20 40% 60% 30 40% 60% Table 3.
Gradient elution conditions.
-
ND HAPD HAD CPD PD Drying time (h) 36 3.5 1.5 4.5 6 Moisture content (%) 12.77 ± 0.86a 12.10 ± 2.02a 13.64 ± 2.00a 13.14 ± 1.12a 12.73 ± 0.44a Sample image after drying 


Data are shown as the mean ± SD. For each response, means with different lowercase letters are significantly different (p < 0.05). Table 4.
Drying duration, moisture content, and images at the end of drying under different drying methods.
Figures
(4)
Tables
(4)