-
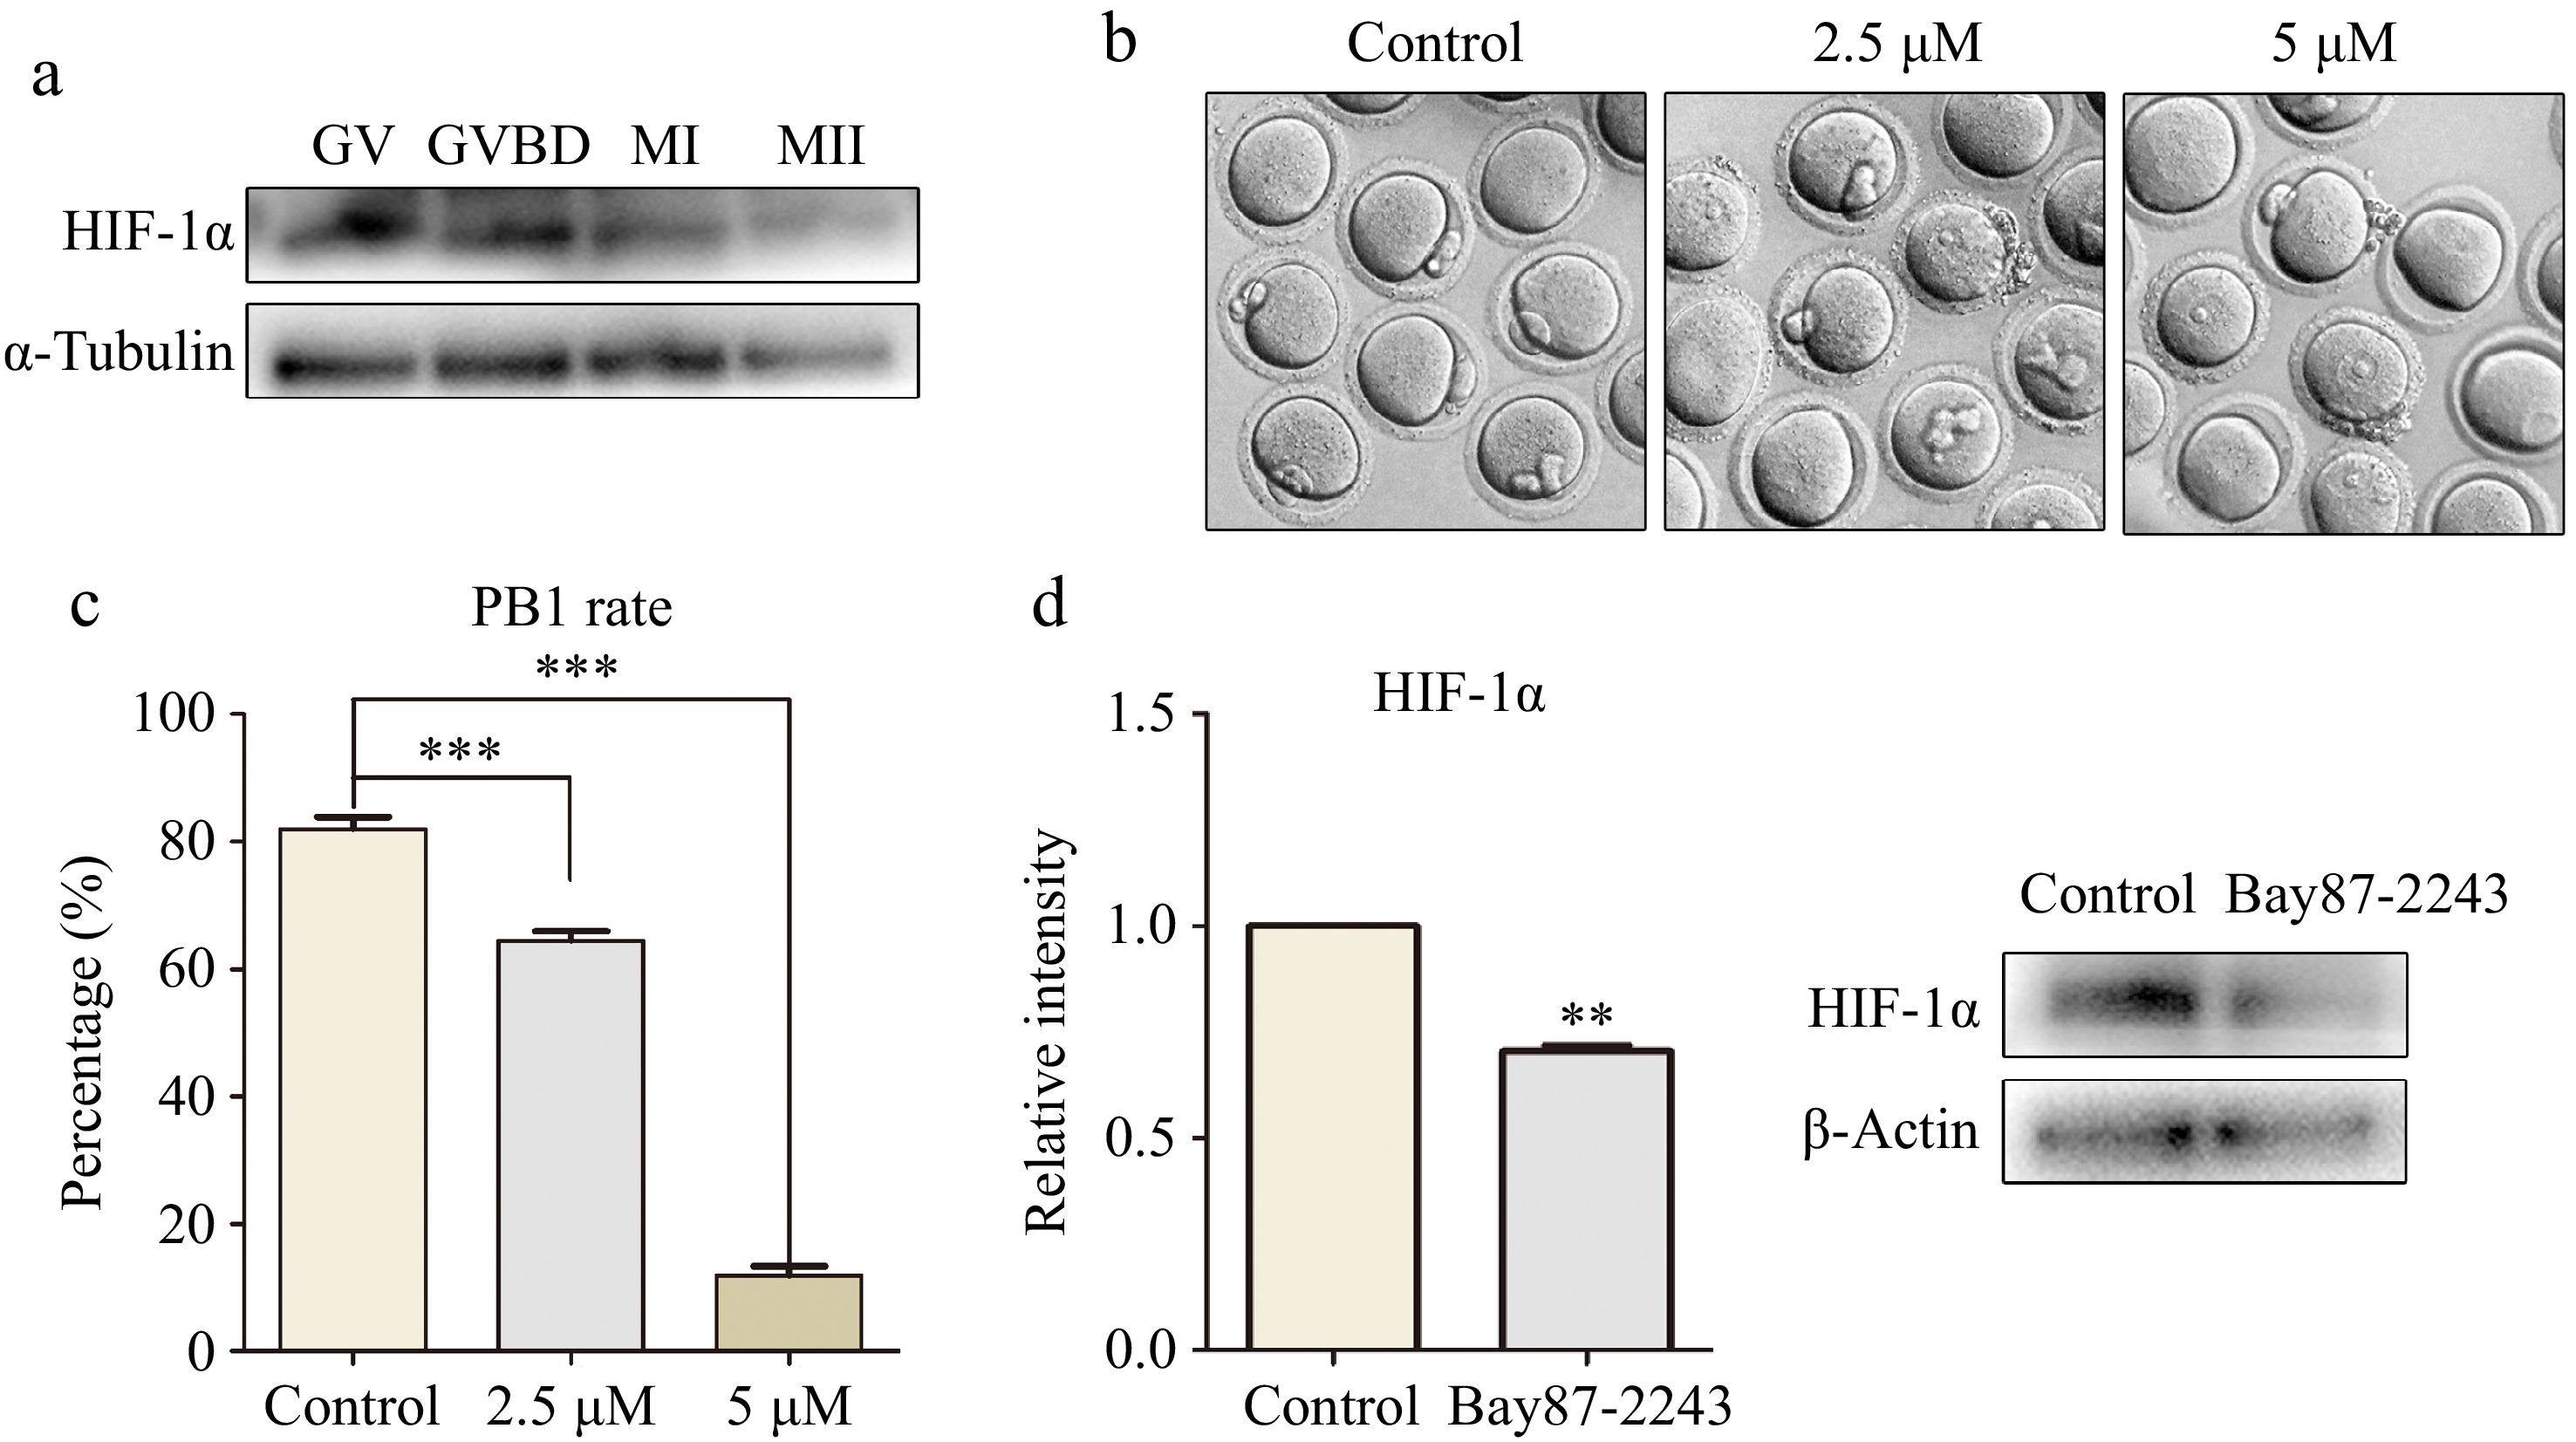
Figure 1.
The inhibition of HIF-1α activity led to the failure of oocyte maturation. (a) Western blot results showed that mouse oocytes expressed HIF-1α at different maturation stages (GV, GVBD, MI, and MII). (b) Digital image correlation (DIC) images of control oocytes and Bay87-2243 treated oocytes after 14 h of culture. Bar = 80 μm. (c) The rate of polar body extrusion after 14 h of culture in the control group and Bay87-2243 treatment group. *** Significant difference (p < 0.001). (d) Western blot was used to analyze the inhibition efficiency of Bay87-2243 on HIF-1α protein expression. HIF-1α protein intensity analysis. ** Significant difference (p < 0.01).
-
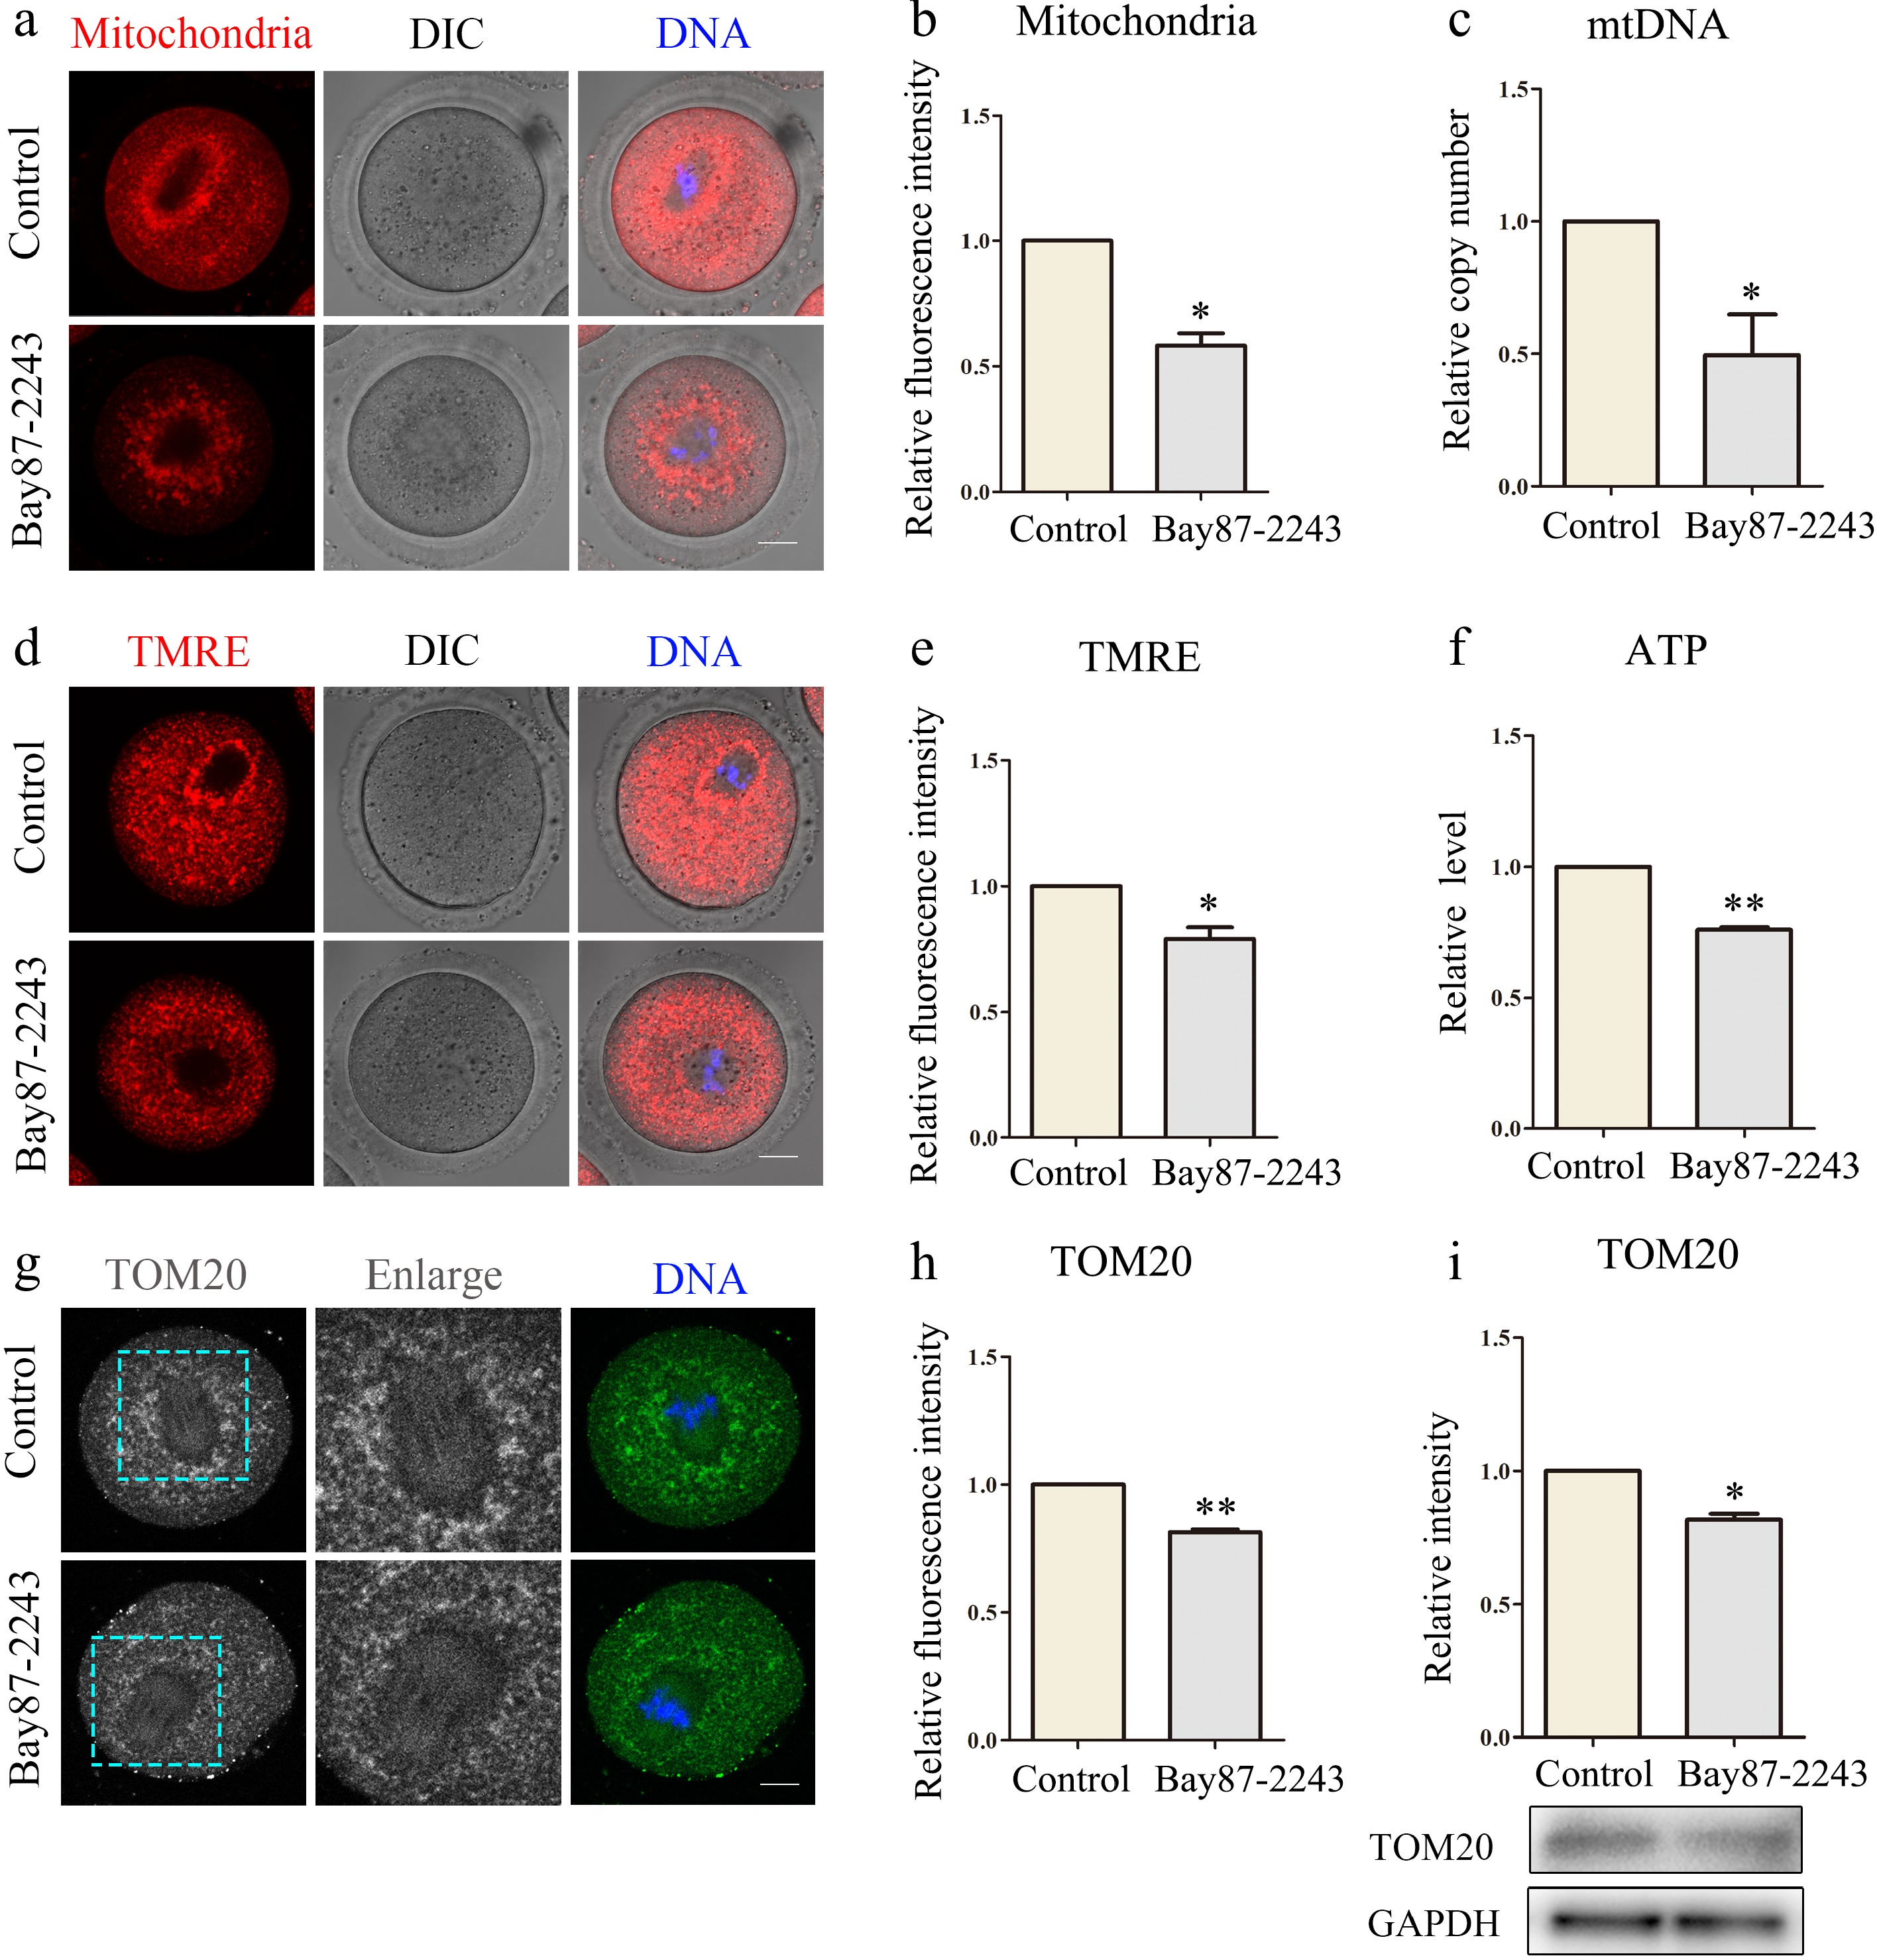
Figure 2.
Inhibition of HIF-1α impairs mitochondrial function in oocytes. (a) Typical map of mitochondrial distribution of oocytes in control group and Bay87-2243 treatment group. Red, mitochondria; blue, DNA. Bar = 20 μm. (b) Relative fluorescence intensity of mitochondrial signal after Bay87-2243 treatment. (c) The relative mtDNA copy number was evaluated in both control and Bay87-2243 treatment oocytes. (d) Typical graphs of TMRE in control and Bay87-2243 treatment groups. Red, TMRE; blue, DNA. Bar = 20 μm. (e) Relative fluorescence intensity of TMRE in the control group and Bay87-2243 treatment group. (f) The relative ATP levels were measured in both the control and Bay87-2243 treatment groups. (g) Typical graphs of TOM20 in control and Bay87-2243 treatment groups. Green, TOM20; blue, DNA. Bar = 20 μm. (h) Relative fluorescence intensity of TOM20 in control group and Bay87-2243 treatment group. (i) Western blot was used to detect the expression of TOM20 protein in the control group and Bay87-2243 treatment group. * Significant difference (p < 0.05); ** Significant difference (p < 0.01).
-
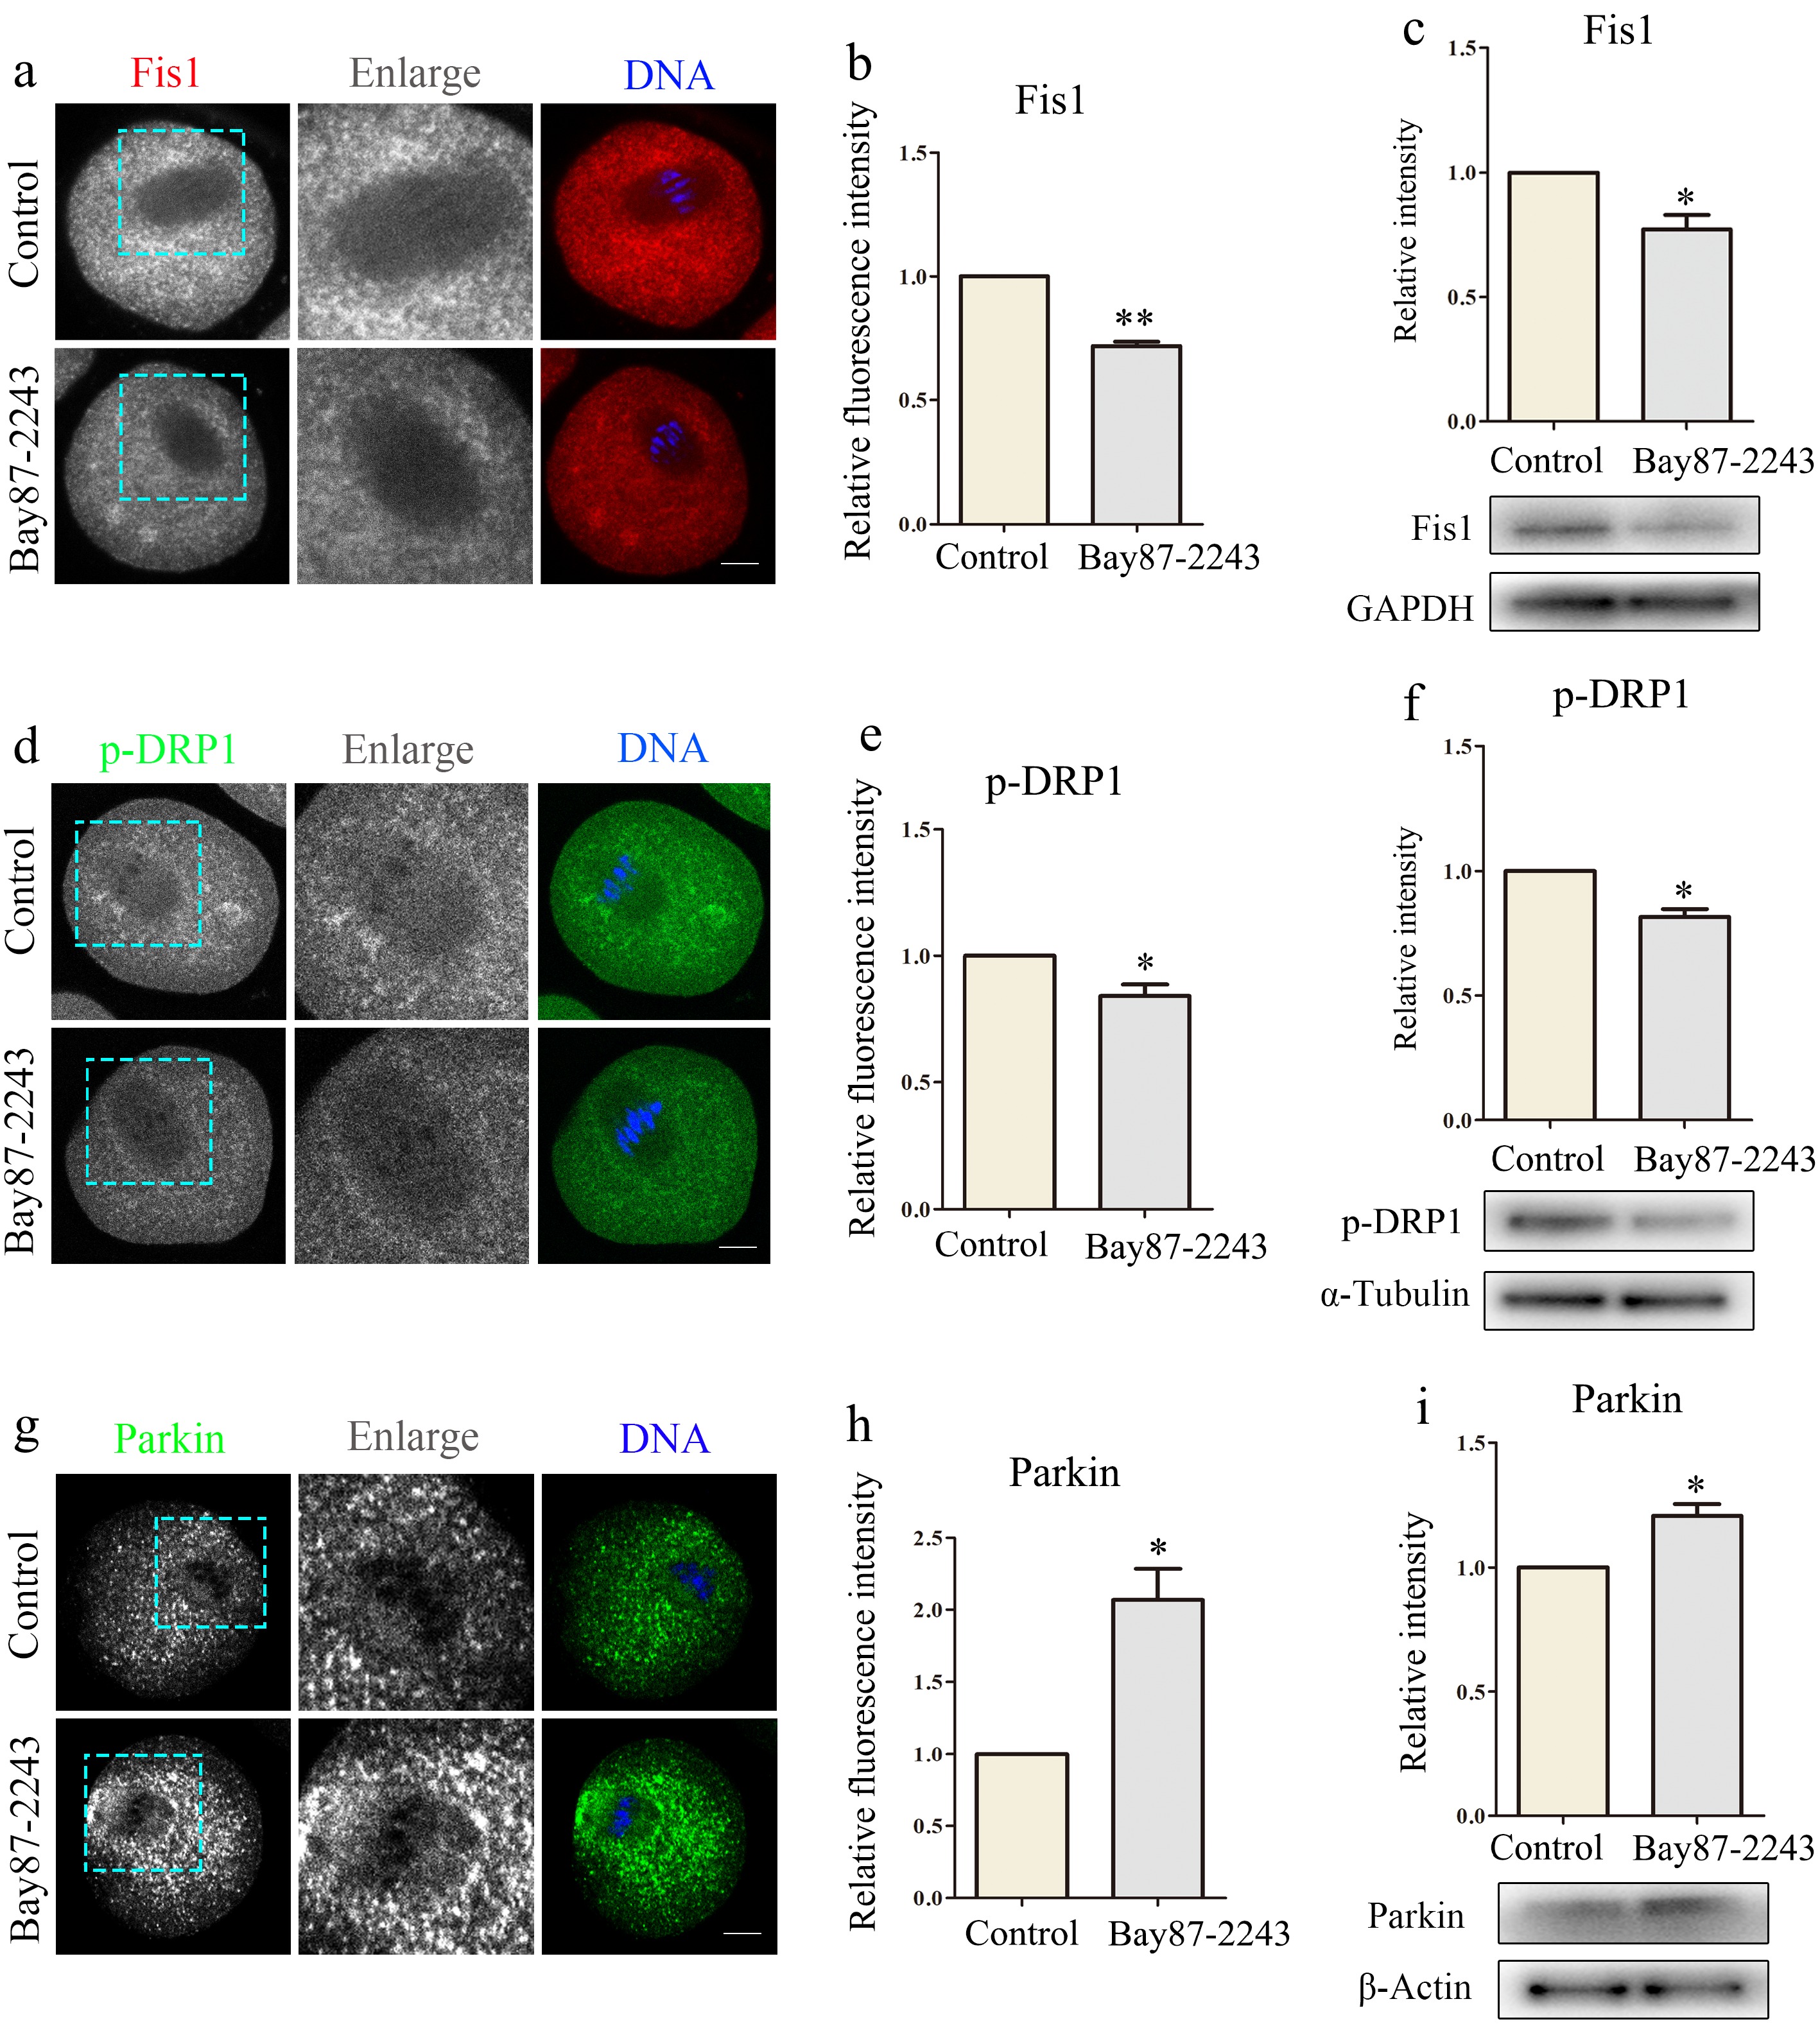
Figure 3.
Inhibition of HIF-1α leads to abnormal mitochondrial dynamics in oocytes. (a) Typical graphs of Fis1 in control and Bay87-2243 treatment groups. Red, Fis1; blue, DNA. Bar = 20 μm. (b) Relative fluorescence intensity of Fis1 in control group and Bay87-2243 treatment group. (c) Western blot was used to detect the expression of Fis1 protein in the control group and Bay87-2243 treatment group. (d) Typical graphs of p-Drp1 in control and Bay87-2243 treatment groups. Green, p-Drp1; blue, DNA. Bar = 20 μm. (e) Relative fluorescence intensity of p-Drp1 in control group and Bay87-2243 treatment group. (f) Western blot was used to detect the expression of p-Drp1 protein in the control group and Bay87-2243 treatment group. (g) Typical graphs of Parkin in control and Bay87-2243 treatment groups. Green, Parkin; blue, DNA. Bar = 20 μm. (h) Relative fluorescence intensity of Parkin in control group and Bay87-2243 treatment group. (i) Western blot was used to detect the expression of Parkin protein in the control group and Bay87-2243 treatment group. * Significant difference (p < 0.05); ** Significant difference (p < 0.01).
-
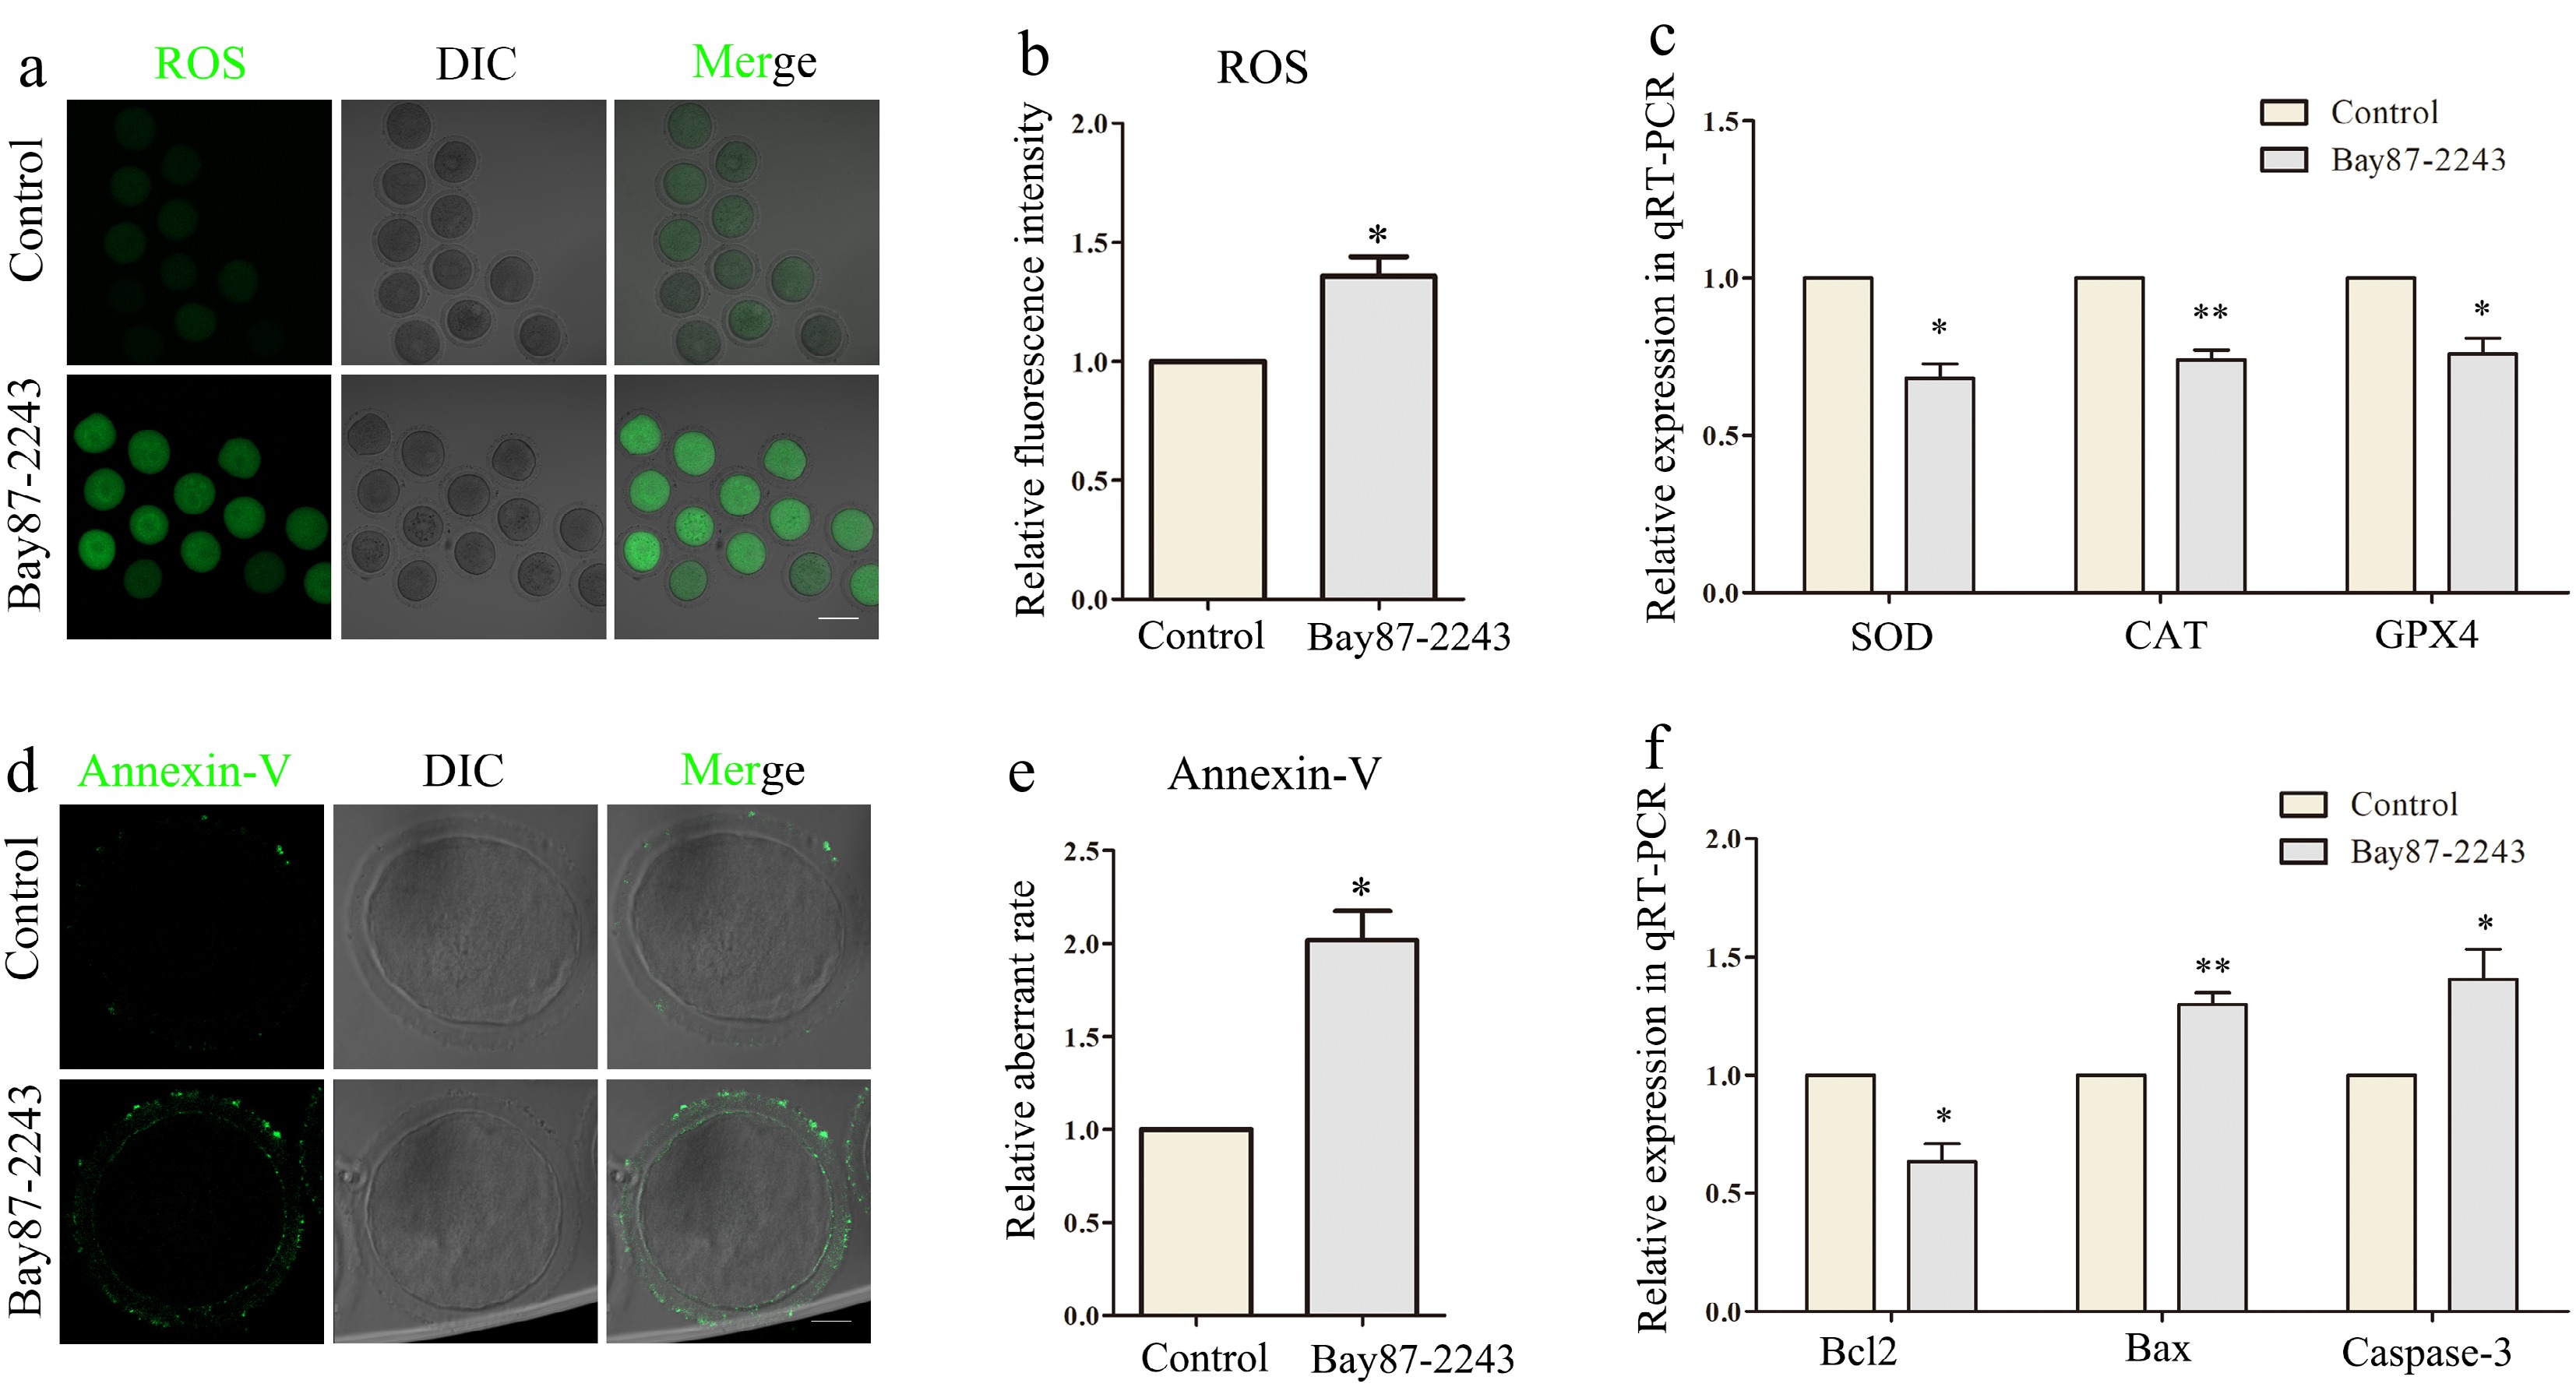
Figure 4.
Inhibition of HIF-1α induces oxidative stress and apoptosis of oocytes. (a) The reactive oxygen species (ROS) level in the control and Bay87-2243 treatment groups of oocytes. Green, ROS. Bar = 80 μm. (b) Relative fluorescence intensity of ROS in control group and Bay87-2243 treatment group. (c) Effects of HIF-1α on expression of the several oxidative stress‐related genes in oocytes. The levels of SOD, CAT, and GPX4 expression in the Bay87-2243 treated oocytes decline than the control oocytes. (d) Annexin‐V signals in the control and Bay87-2243 treatment group oocytes. Green, Annexin‐V. Bar = 20 μm. (e) Relative fluorescence intensity of Annexin‐V in control group and Bay87-2243 treatment group. (f) Effect of HIF-1α on the expression of several apoptosis-related genes in oocytes. The expression levels of Bcl2, Bax, and Caspase-3 increased in oocytes treated with Bay87-2243 compared with the control group. * Significant difference (p < 0.05); ** Significant difference (p < 0.01).
-
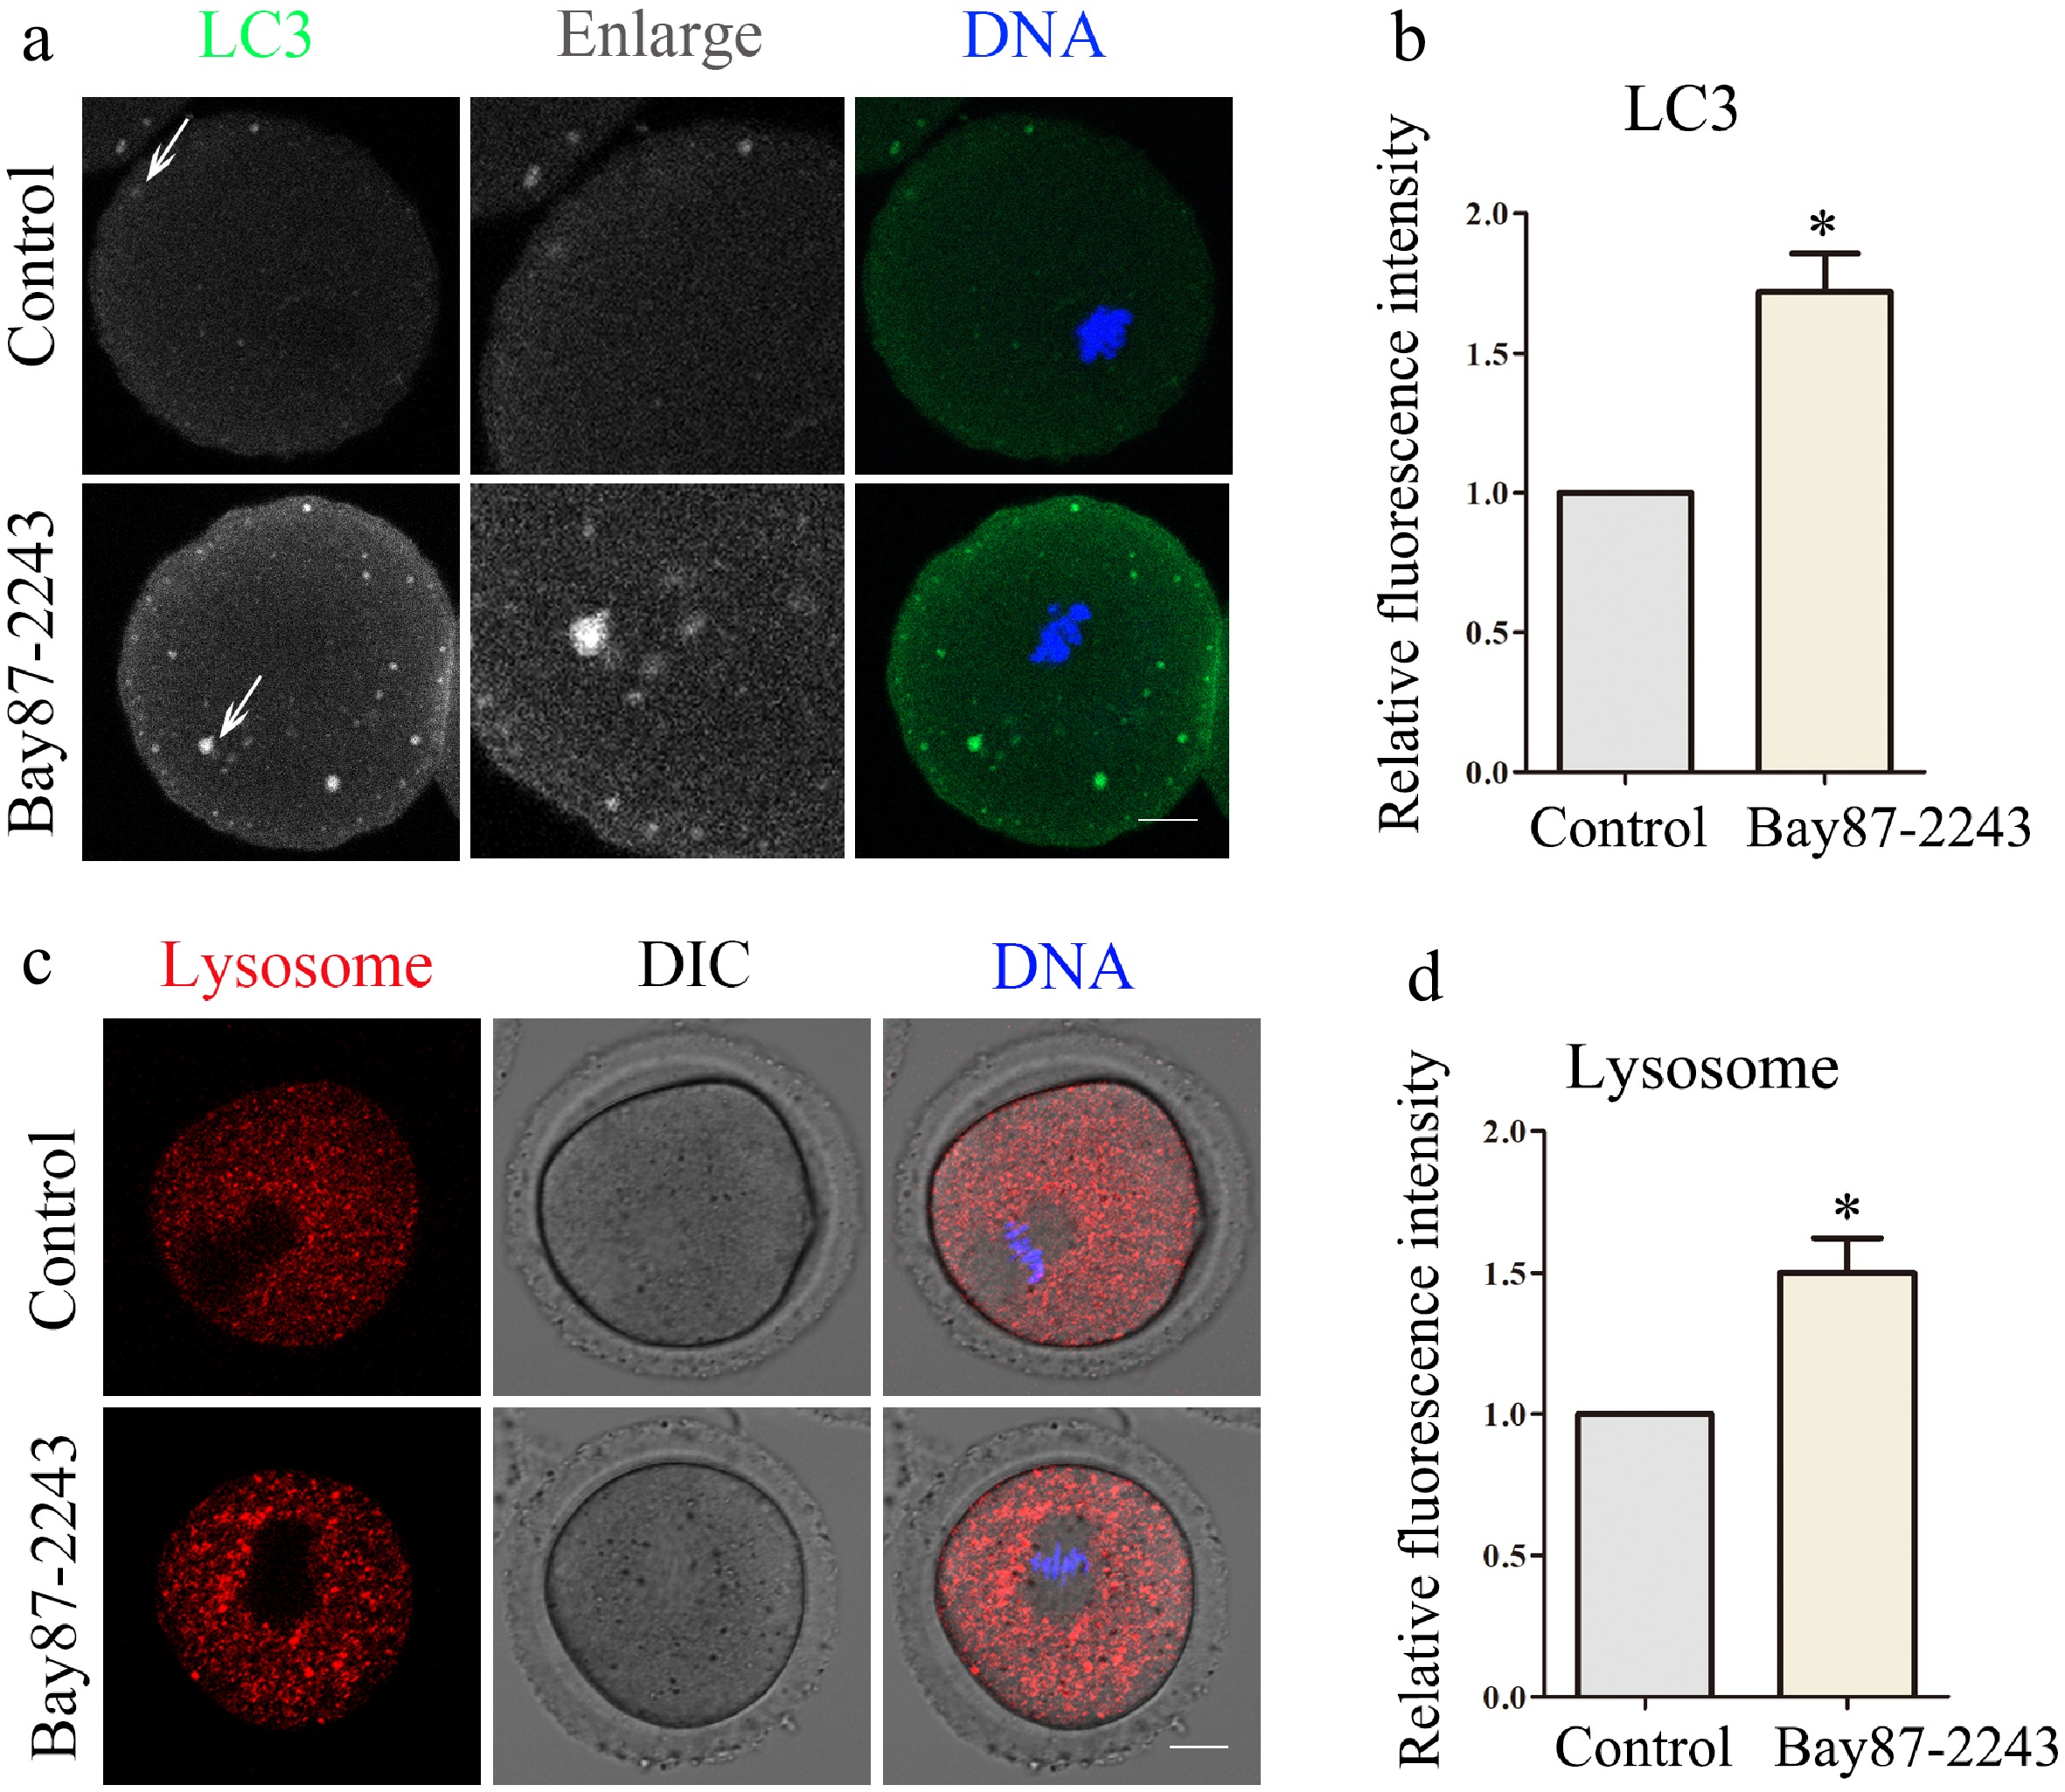
Figure 5.
Inhibition of HIF-1α impairs oocyte autophagy and lysosomal function. (a) Typical graphs of LC3 in control and Bay87-2243 treatment groups. Green, LC3; blue, DNA. Bar = 20 μm. (b) Relative fluorescence intensity of LC3 in control group and Bay87-2243 treatment group. (c) Typical graphs of lysosome in control and Bay87-2243 treatment groups. Green, Lysosome; blue, DNA. Bar = 20 μm. (d) Relative fluorescence intensity of lysosome in control group and Bay87-2243 treatment group. * Significant difference (p < 0.05).
Figures
(5)
Tables
(0)