-
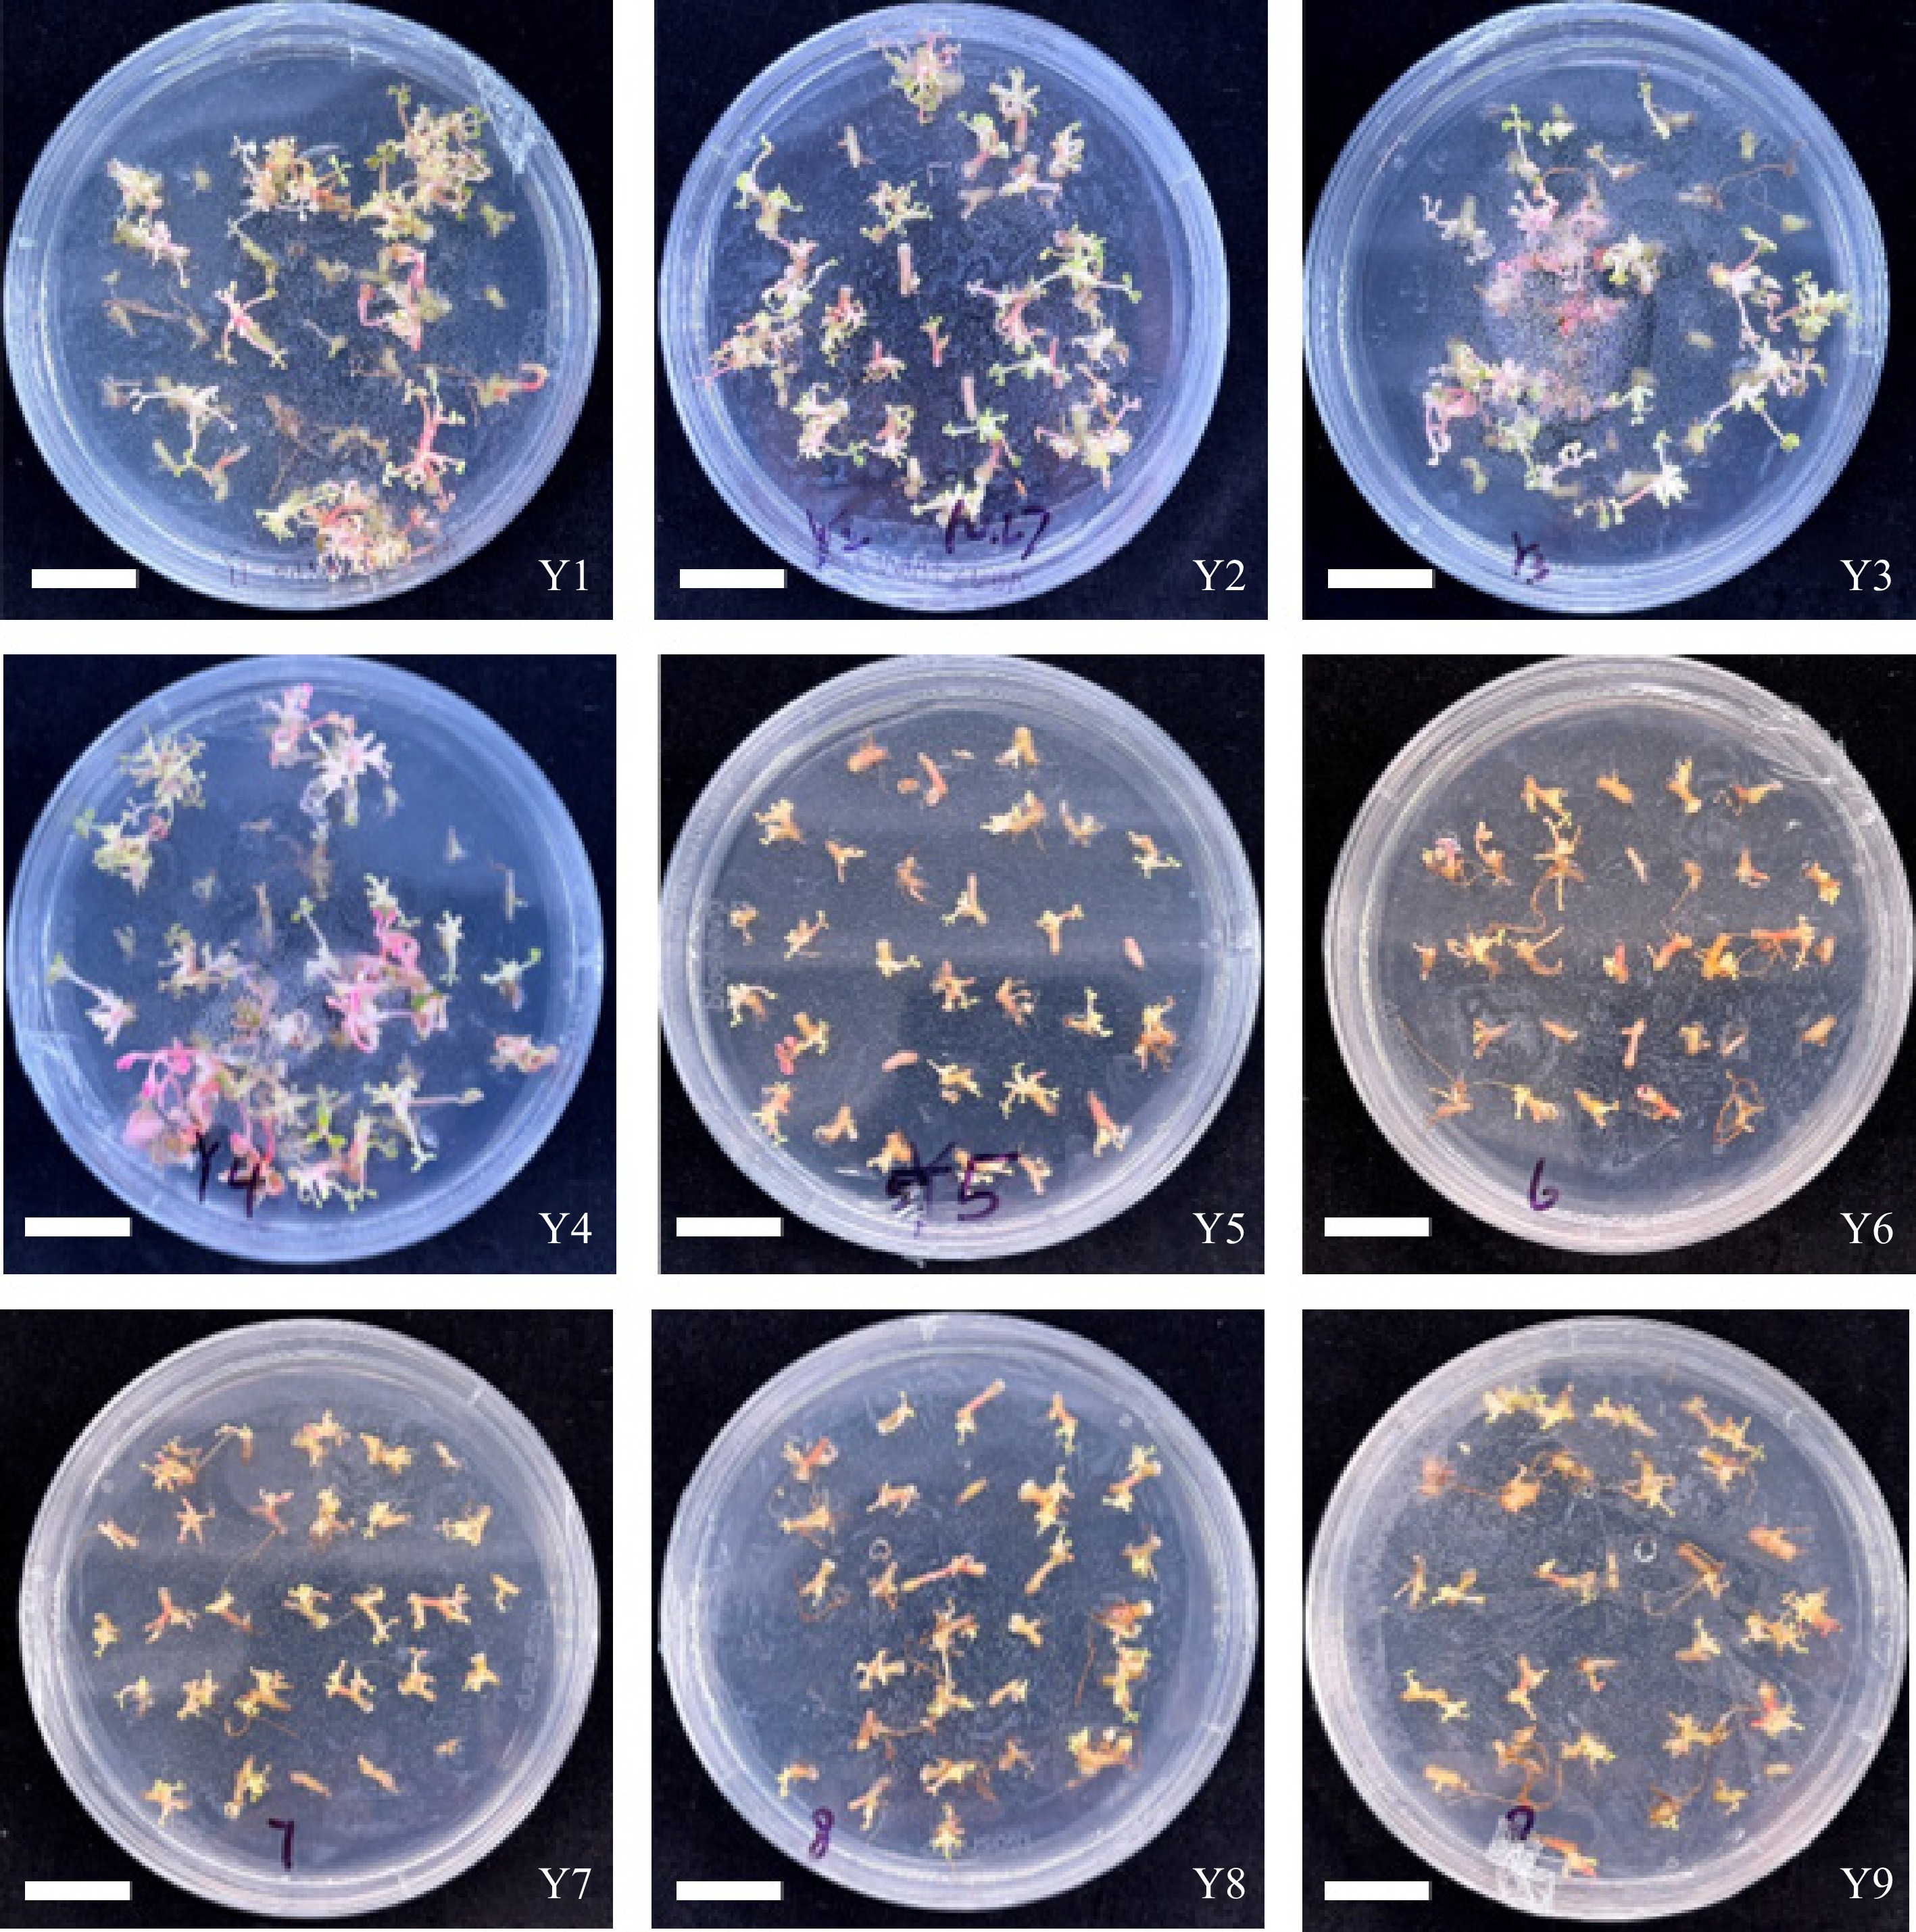
Figure 1.
Effects of 6-BA and NAA on clumping bud induction after, Y1: 0.1 mg·L−1 NAA + 1 mg·L−1 6-BA, Y2: 0.1 mg·L−1 NAA + 2 mg·L−1 6-BA, Y3: 0.1 mg·L−1 NAA + 3 mg·L−1 6-BA, Y4: 0.5 mg·L−1 NAA + 1 mg·L−1 6-BA,Y5: 0.5 mg·L−1 NAA + 2 mg·L−1 6-BA, Y6: 0.5 mg·L−1 NAA + 3 mg·L−1 6-BA,Y7: 1 mg·L−1 NAA + 1 mg·L−1 6-BA, Y8: 1 mg·L−1 NAA + 2 mg·L−1 6-BA, Y9: 1 mg·L−1 NAA + 3 mg·L−1 6-BA, the culture conditions are: light intensity at 2,000 lx, a 12-h light/dark cycle, a temperature of 25 ± 2 °C, and relative humidity of 50%−70%. Scale bars = 1 cm.
-
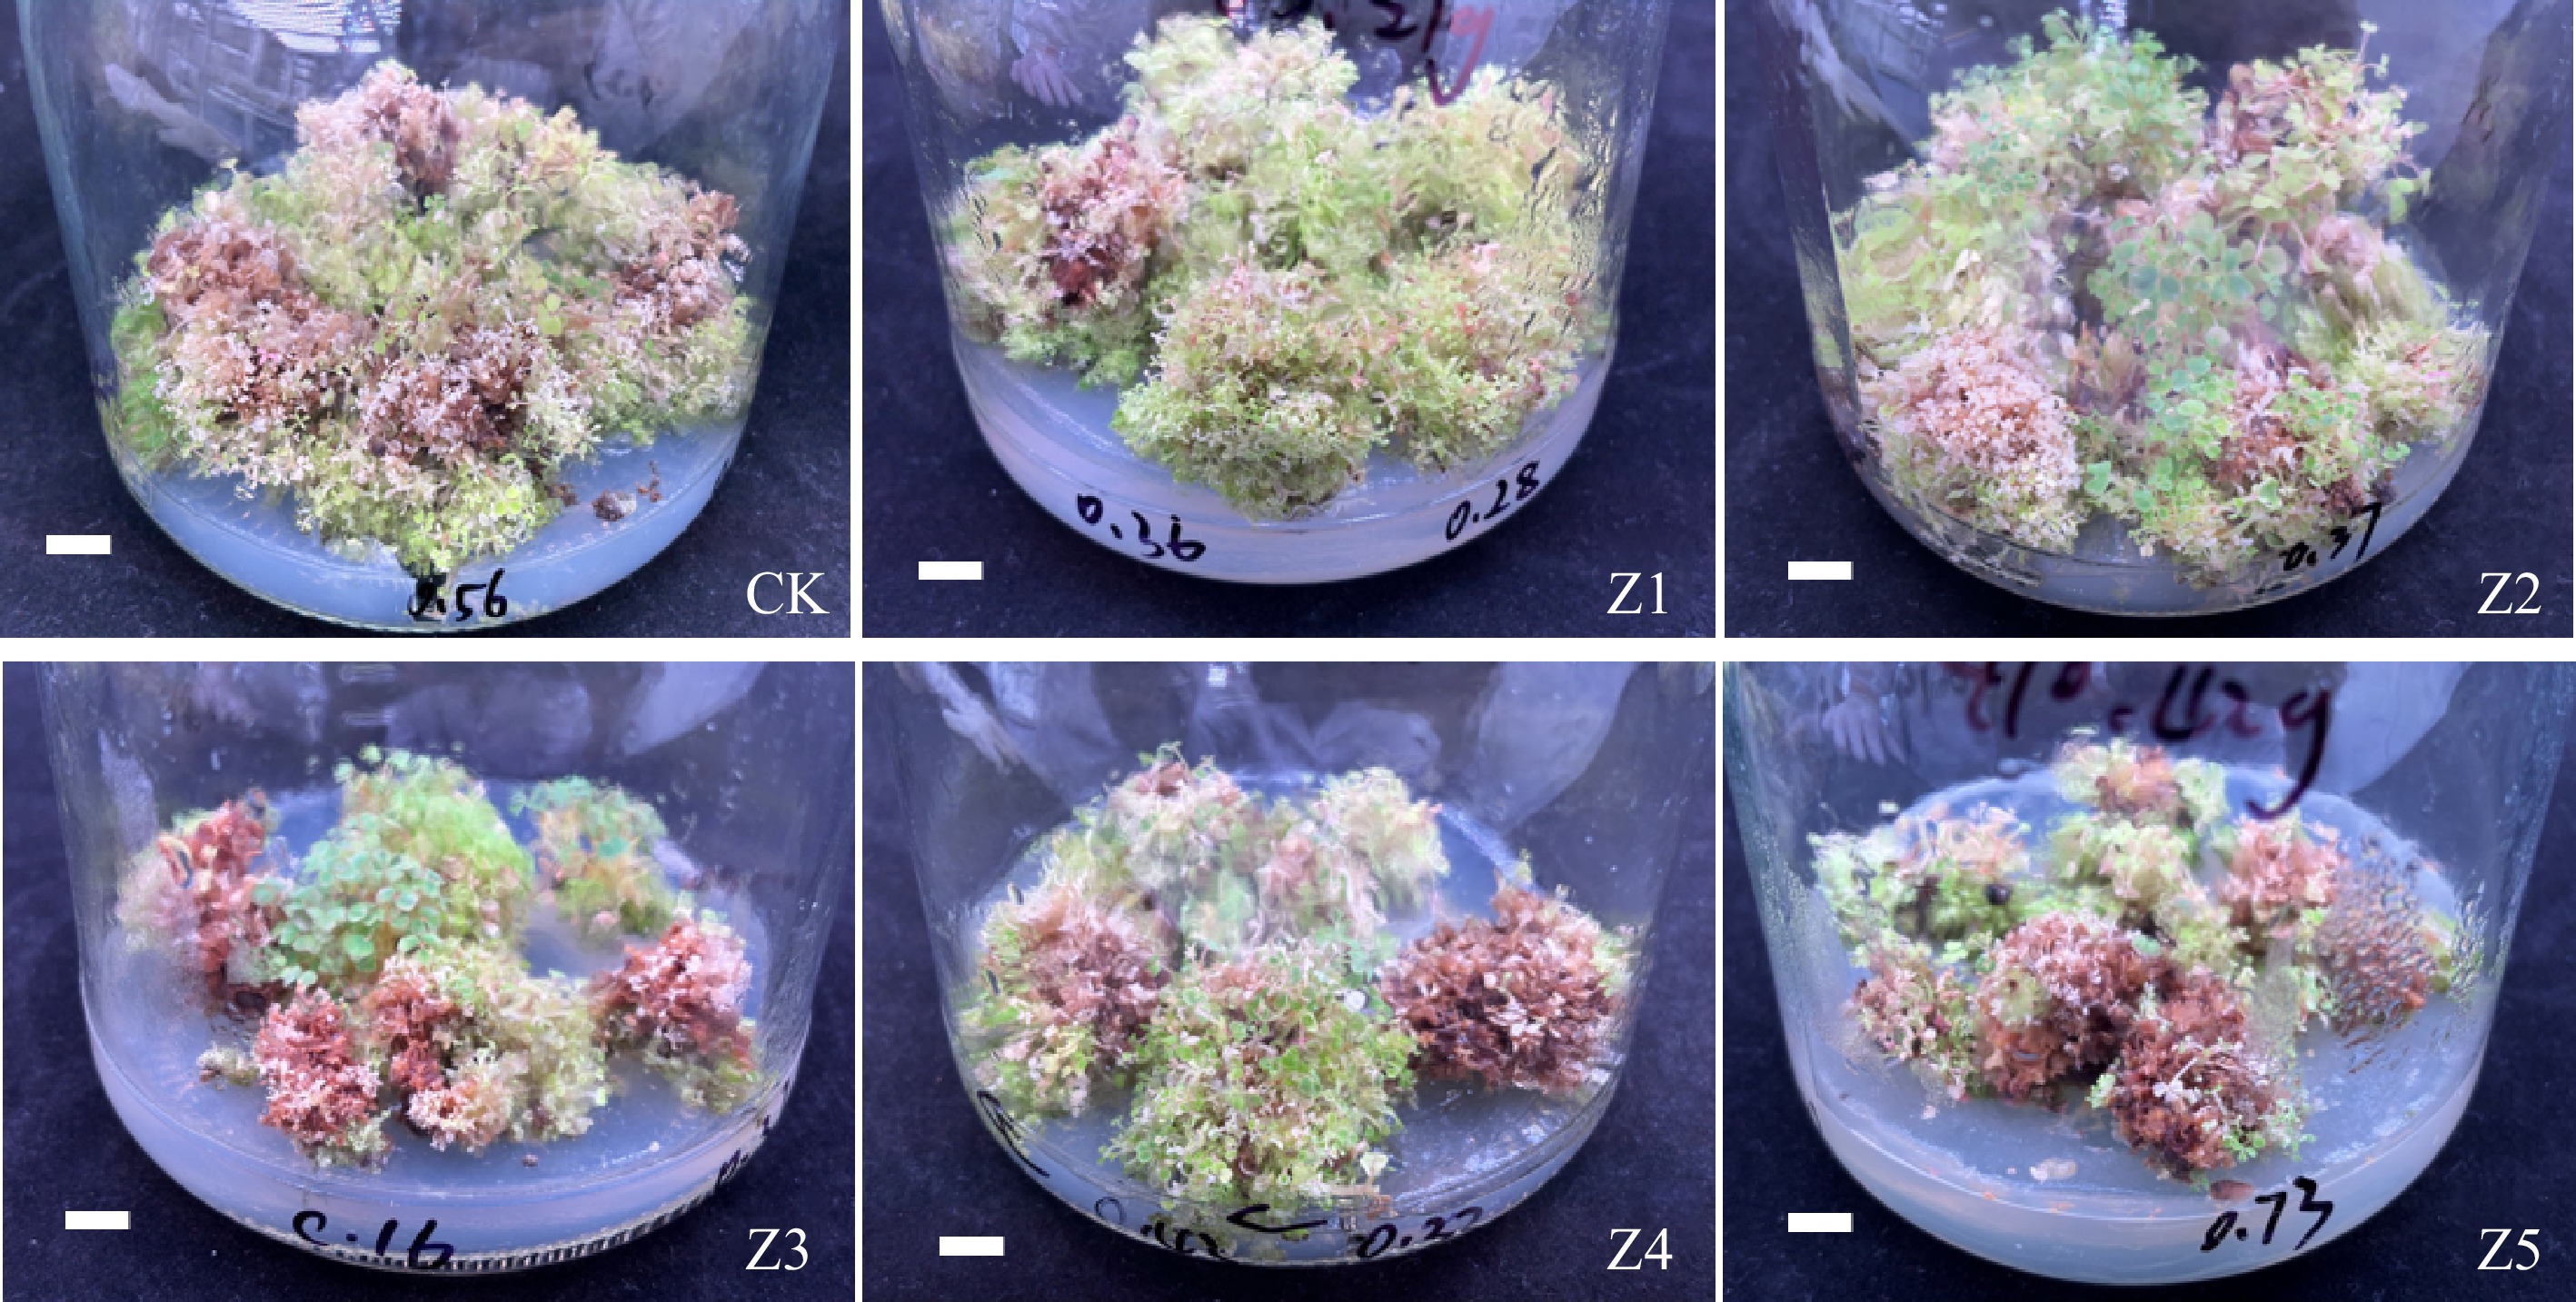
Figure 2.
Proliferation of clustered shoots (scale bars = 1 cm), CK: 0.00 mg·L−1 IBA, Z1: 0.10 mg·L−1 IBA, Z2: 0.20 mg·L−1 IBA, Z3: 0.30 mg·L−1 IBA, Z4: 0.40 mg·L−1 IBA, Z5: 0.50 mg·L−1 IBA, the culture conditions are: light intensity at 2,000 lx, a 12-h light/dark cycle, a temperature of 25 ± 2 °C, and relative humidity of 50%−70%.
-
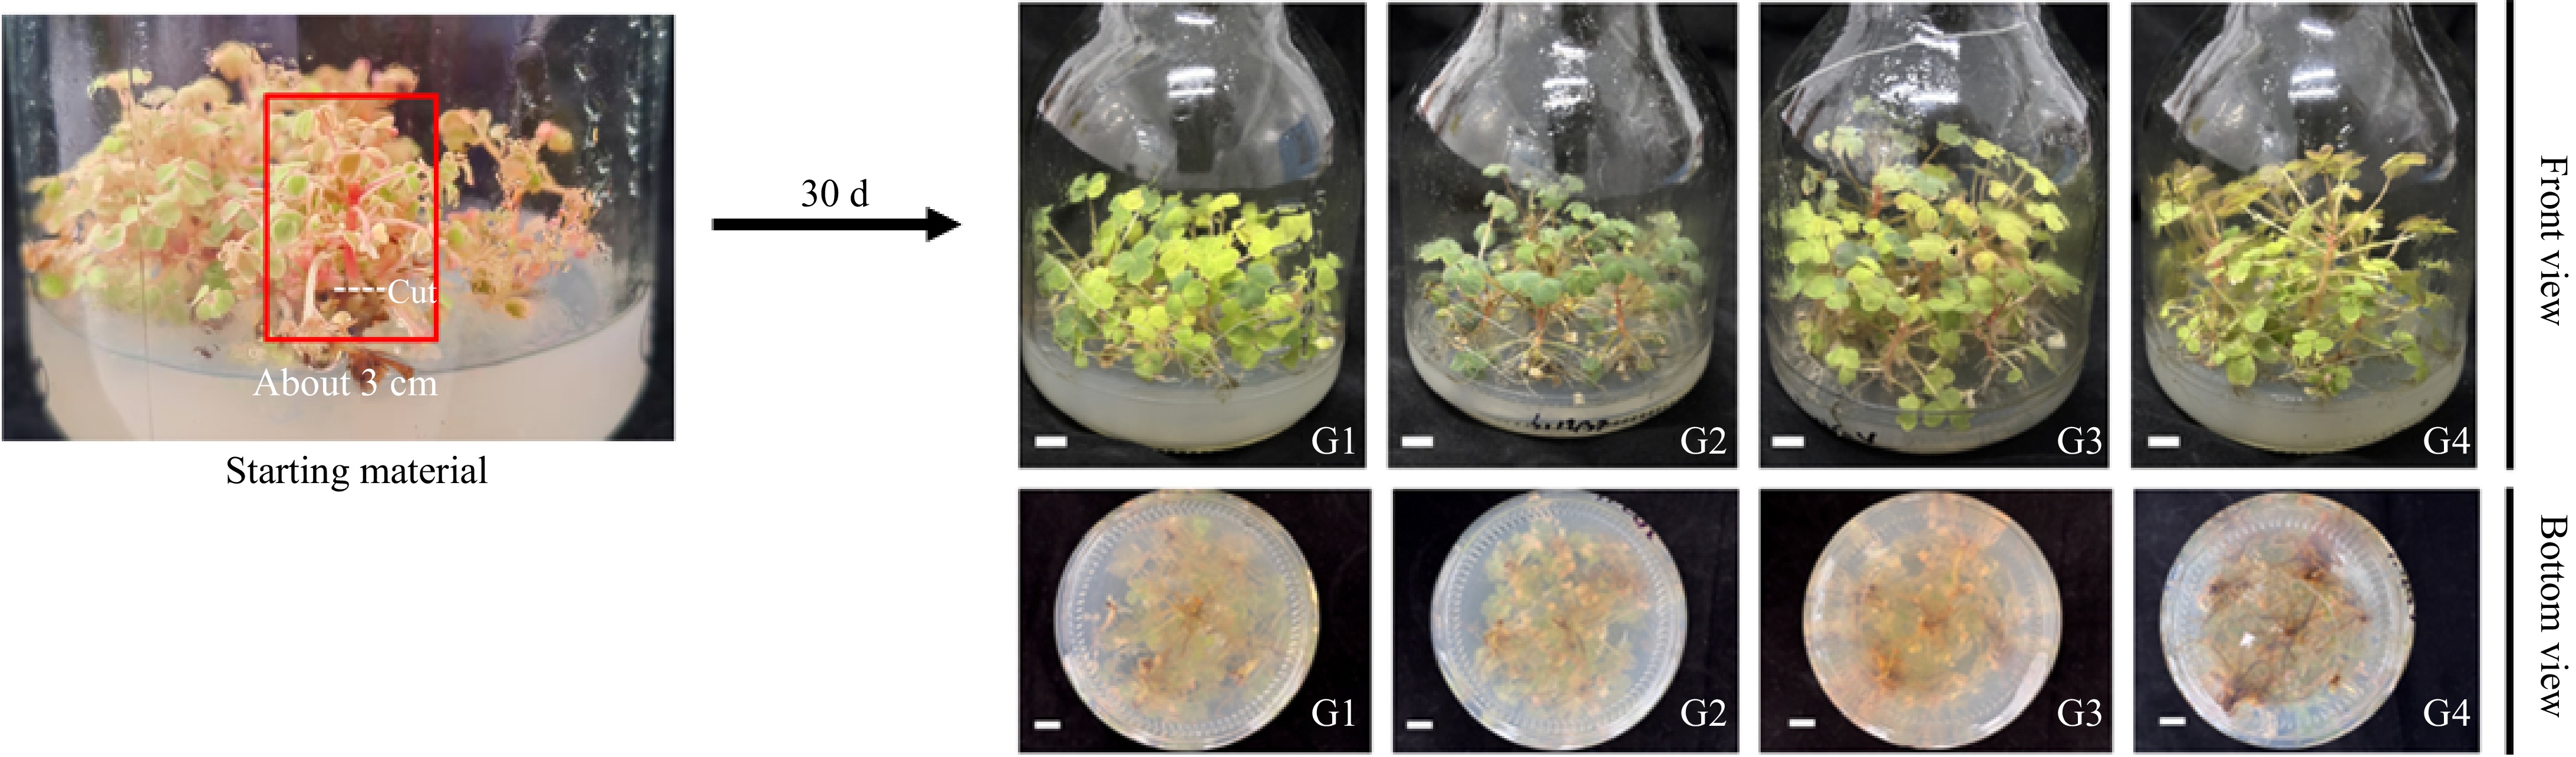
Figure 3.
Thirty days of plant growth and rooting , the starting material was to cut about 3 cm from the tip of the shoot of the clumping buds cultured on the optimal proliferation medium for two generations to be used as an explant insertion into the rooting medium, G1: 0.00 mg·L−1 NAA, G2: 0.05 mg·L−1 NAA, G3: 0.10 mg·L−1 NAA, G4: 0.20 mg·L−1 NAA, the culture conditions are: light intensity at 2,000 lx, a 12-h light/dark cycle, a temperature of 25 ± 2 °C, and relative humidity of 50%−70%, scale bars = 1 cm.
-
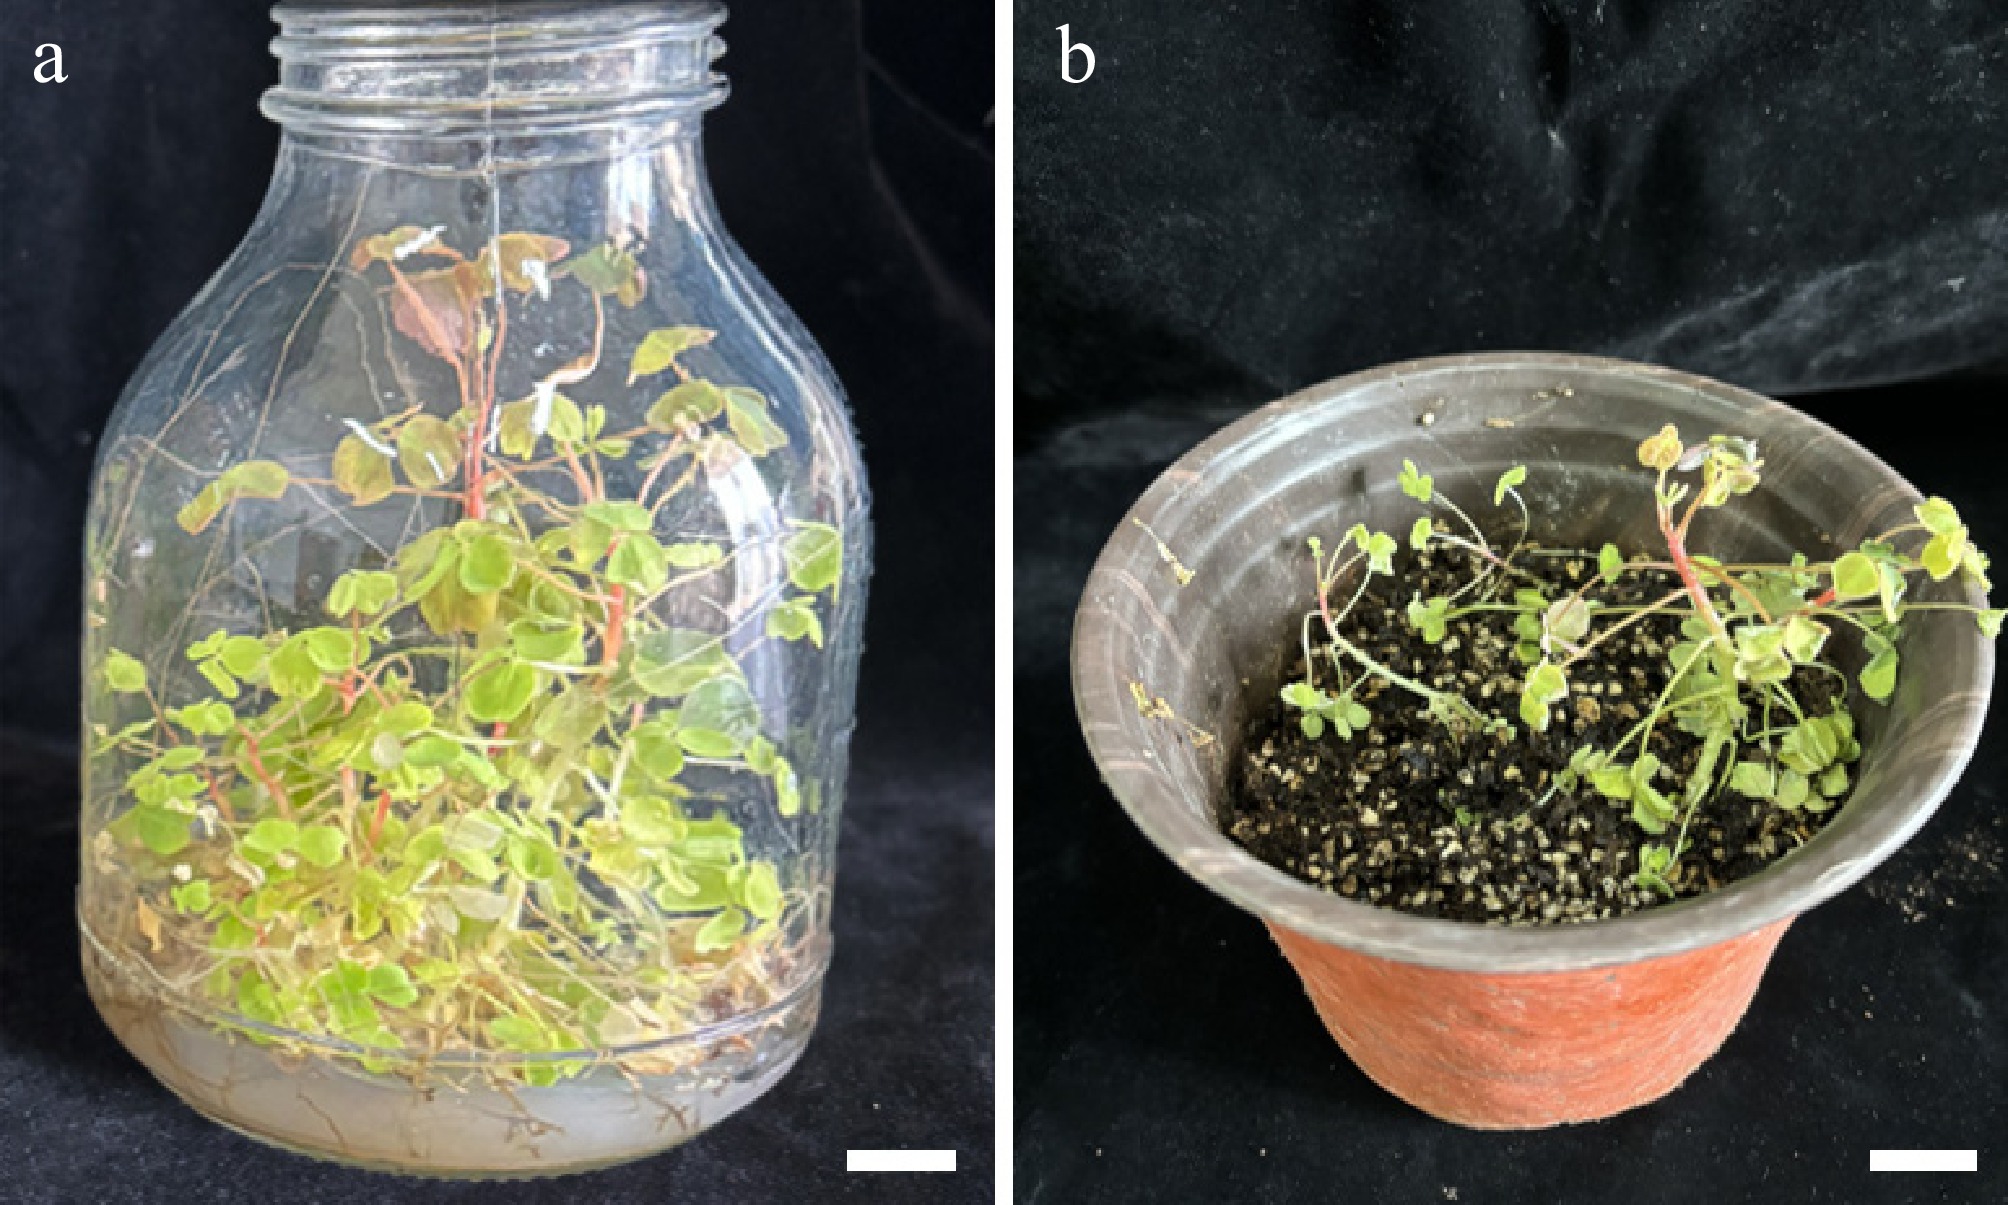
Figure 4.
Tissue culture seedlings refining situation (scale bars = 1 cm). (a) Tissue culture seedlings. (b) The growth of seedlings after refining.
-
Treatment 75% alcohol (min) 3% sodium hypochlorite
(min)Contamination rate (%) Germination rate (%) T1 1 10 92.22 ± 5.09a 0.00 ± 0.00e T2 1 12 55.56 ± 5.09b 4.44 ± 3.85e T3 1 15 33.33 ± 3.33e 24.44 ± 3.85bc T4 2 10 50.00 ± 5.77b 5.56 ± 1.92e T5 2 12 24.44 ± 3.85cd 31.11 ± 5.09b T6 2 15 14.44 ± 1.92ef 50.00 ± 3.33a T7 3 10 46.67 ± 6.67b 24.44 ± 5.09bc T8 3 12 23.33 ± 3.33de 18.89 ± 1.92cd T9 3 15 10.00 ± 3.33f 16.67 ± 3.33d The data are mean ± standard deviation, and different letters after the same column of numbers indicate significant differences between different treatments (p < 0.05). Each treatment contains 30 explants, and each treatment was repeated three times. Table 1.
Statistics of disinfection contamination rate of 75% alcohol and 3% sodium hypochlorite.
-
Treatment NAA
concentrations
(mg·L−1)6-BA
concentrations
(mg·L−1)Induction
rate (%)Bud length
(cm)Y1 0.1 1 38.89 ± 1.92d 0.96 ± 0.31a Y2 0.1 2 70.00 ± 3.33ab 0.69 ± 0.29b Y3 0.1 3 50.00 ± 3.33c 0.60 ± 0.18bc Y4 0.5 1 74.45 ± 6.94a 0.99 ± 0.34a Y5 0.5 2 71.11 ± 1.92ab 0.38 ± 0.10cd Y6 0.5 3 44.44 ± 5.09cd 0.28 ± 0.10d Y7 1 1 74.44 ± 5.09a 0.34 ± 0.08d Y8 1 2 71.11 ± 5.09ab 0.25 ± 0.11d Y9 1 3 60.00 ± 3.33b 0.31 ± 0.07d The data are mean ± standard deviation, and different letters after the same column of numbers indicate significant differences between different treatments (p < 0.05). Each treatment contains 30 explants, and each treatment was repeated three times. Table 2.
Effect of different hormone combinations on induction and multiplication of O. vulcanicola 'Sunset Velvet'.
-
Treatment IBA concentrations (mg·L−1) Biomass multiplication (folds) Browning rate (%) CK 0.00 20.32 ± 0.54a 18.65 ± 0.32d Z1 0.10 17.39 ± 0.70b 10.21 ± 0.33e Z2 0.20 14.99 ± 0.77c 17.98 ± 0.34d Z3 0.30 13.09 ± 0.38d 22.30 ± 0.46c Z4 0.40 11.78 ± 0.49d 26.88 ± 0.35b Z5 0.50 9.71 ± 0.59e 31.63 ± 0.19a The data are mean ± standard deviation, and different letters after the same column of numbers indicate significant differences between different treatments (p < 0.05). Each treatment contains 30 explants, and each treatment is repeated three times. Table 3.
Effect of different IBA concentrations on the proliferation of clustered shoots.
-
Treatment NAA concentrations (mg·L−1) Rooting rate (%) Number of roots Average root length (cm) Plant height (cm) G1 0.00 93.33 ± 3.33b 7.05 ± 0.10d 2.10 ± 0.49d 3.51 ± 0.06c G2 0.05 100.00 ± 0.00a 10.10 ± 0.44c 2.54 ± 0.04b 3.62 ± 0.08c G3 0.10 100.00 ± 0.00a 14.10 ± 0.10a 2.73 ± 0.15a 4.26 ± 0.05a G4 0.20 87.77 ± 1.93c 12.83 ± 0.25b 2.40 ± 0.10c 3.97 ± 0.11b The data are mean ± standard deviation, and different letters after the same column of numbers indicate significant differences between different treatments (p < 0.05). Each treatment contains 30 explants, and each treatment is repeated three times. Table 4.
Effects of different concentrations of NAA on plant growth and rooting.
Figures
(4)
Tables
(4)