-
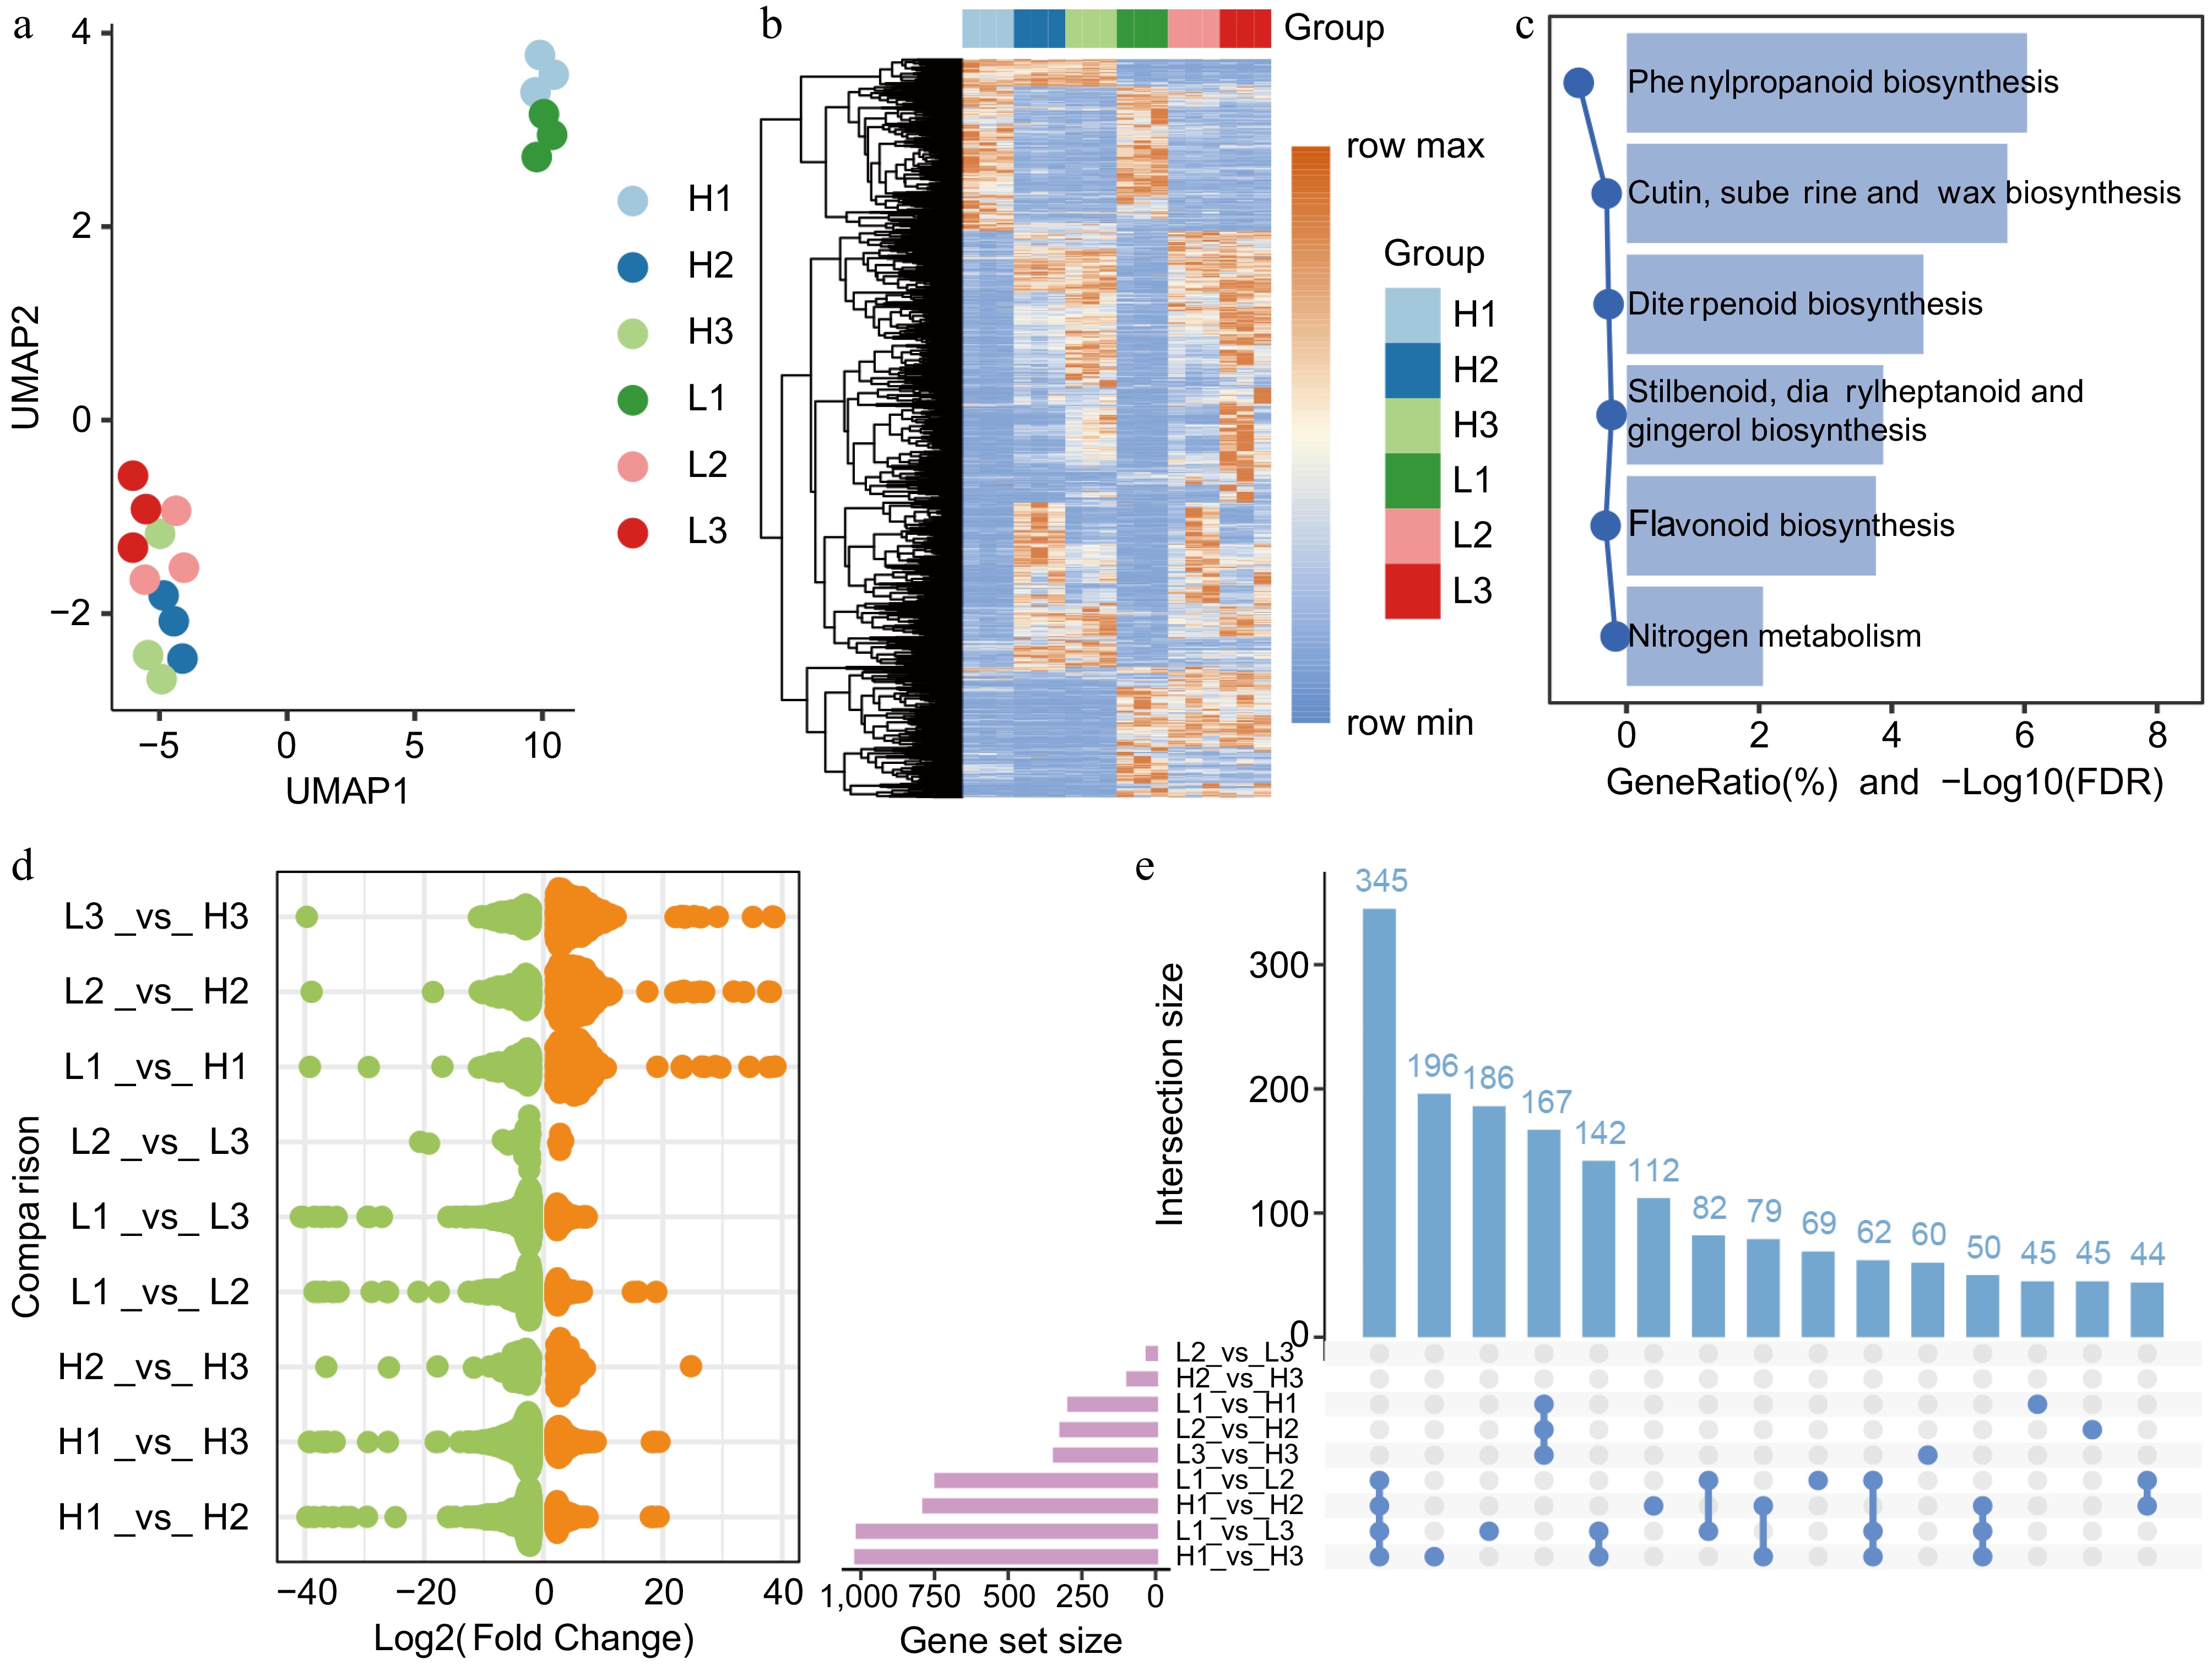
Figure 1.
Transcriptomic characteristics of flower bud developmental stages in C. wilsoniana. (a) UMAP scatterplot of flower bud samples. (b) Hierarchical clustering heatmap of the relative abundance of 2,013 DEGs. (c) KEGG enrichment analysis of 2,013 DEGs. (d) Log2(Fold Change) distribution of upregulated (orange, adjusted p-value < 0.05) and downregulated (green, adjusted p-value < 0.05) genes in different comparison groups. (e) Bar chart of DEG counts across different comparison groups.
-
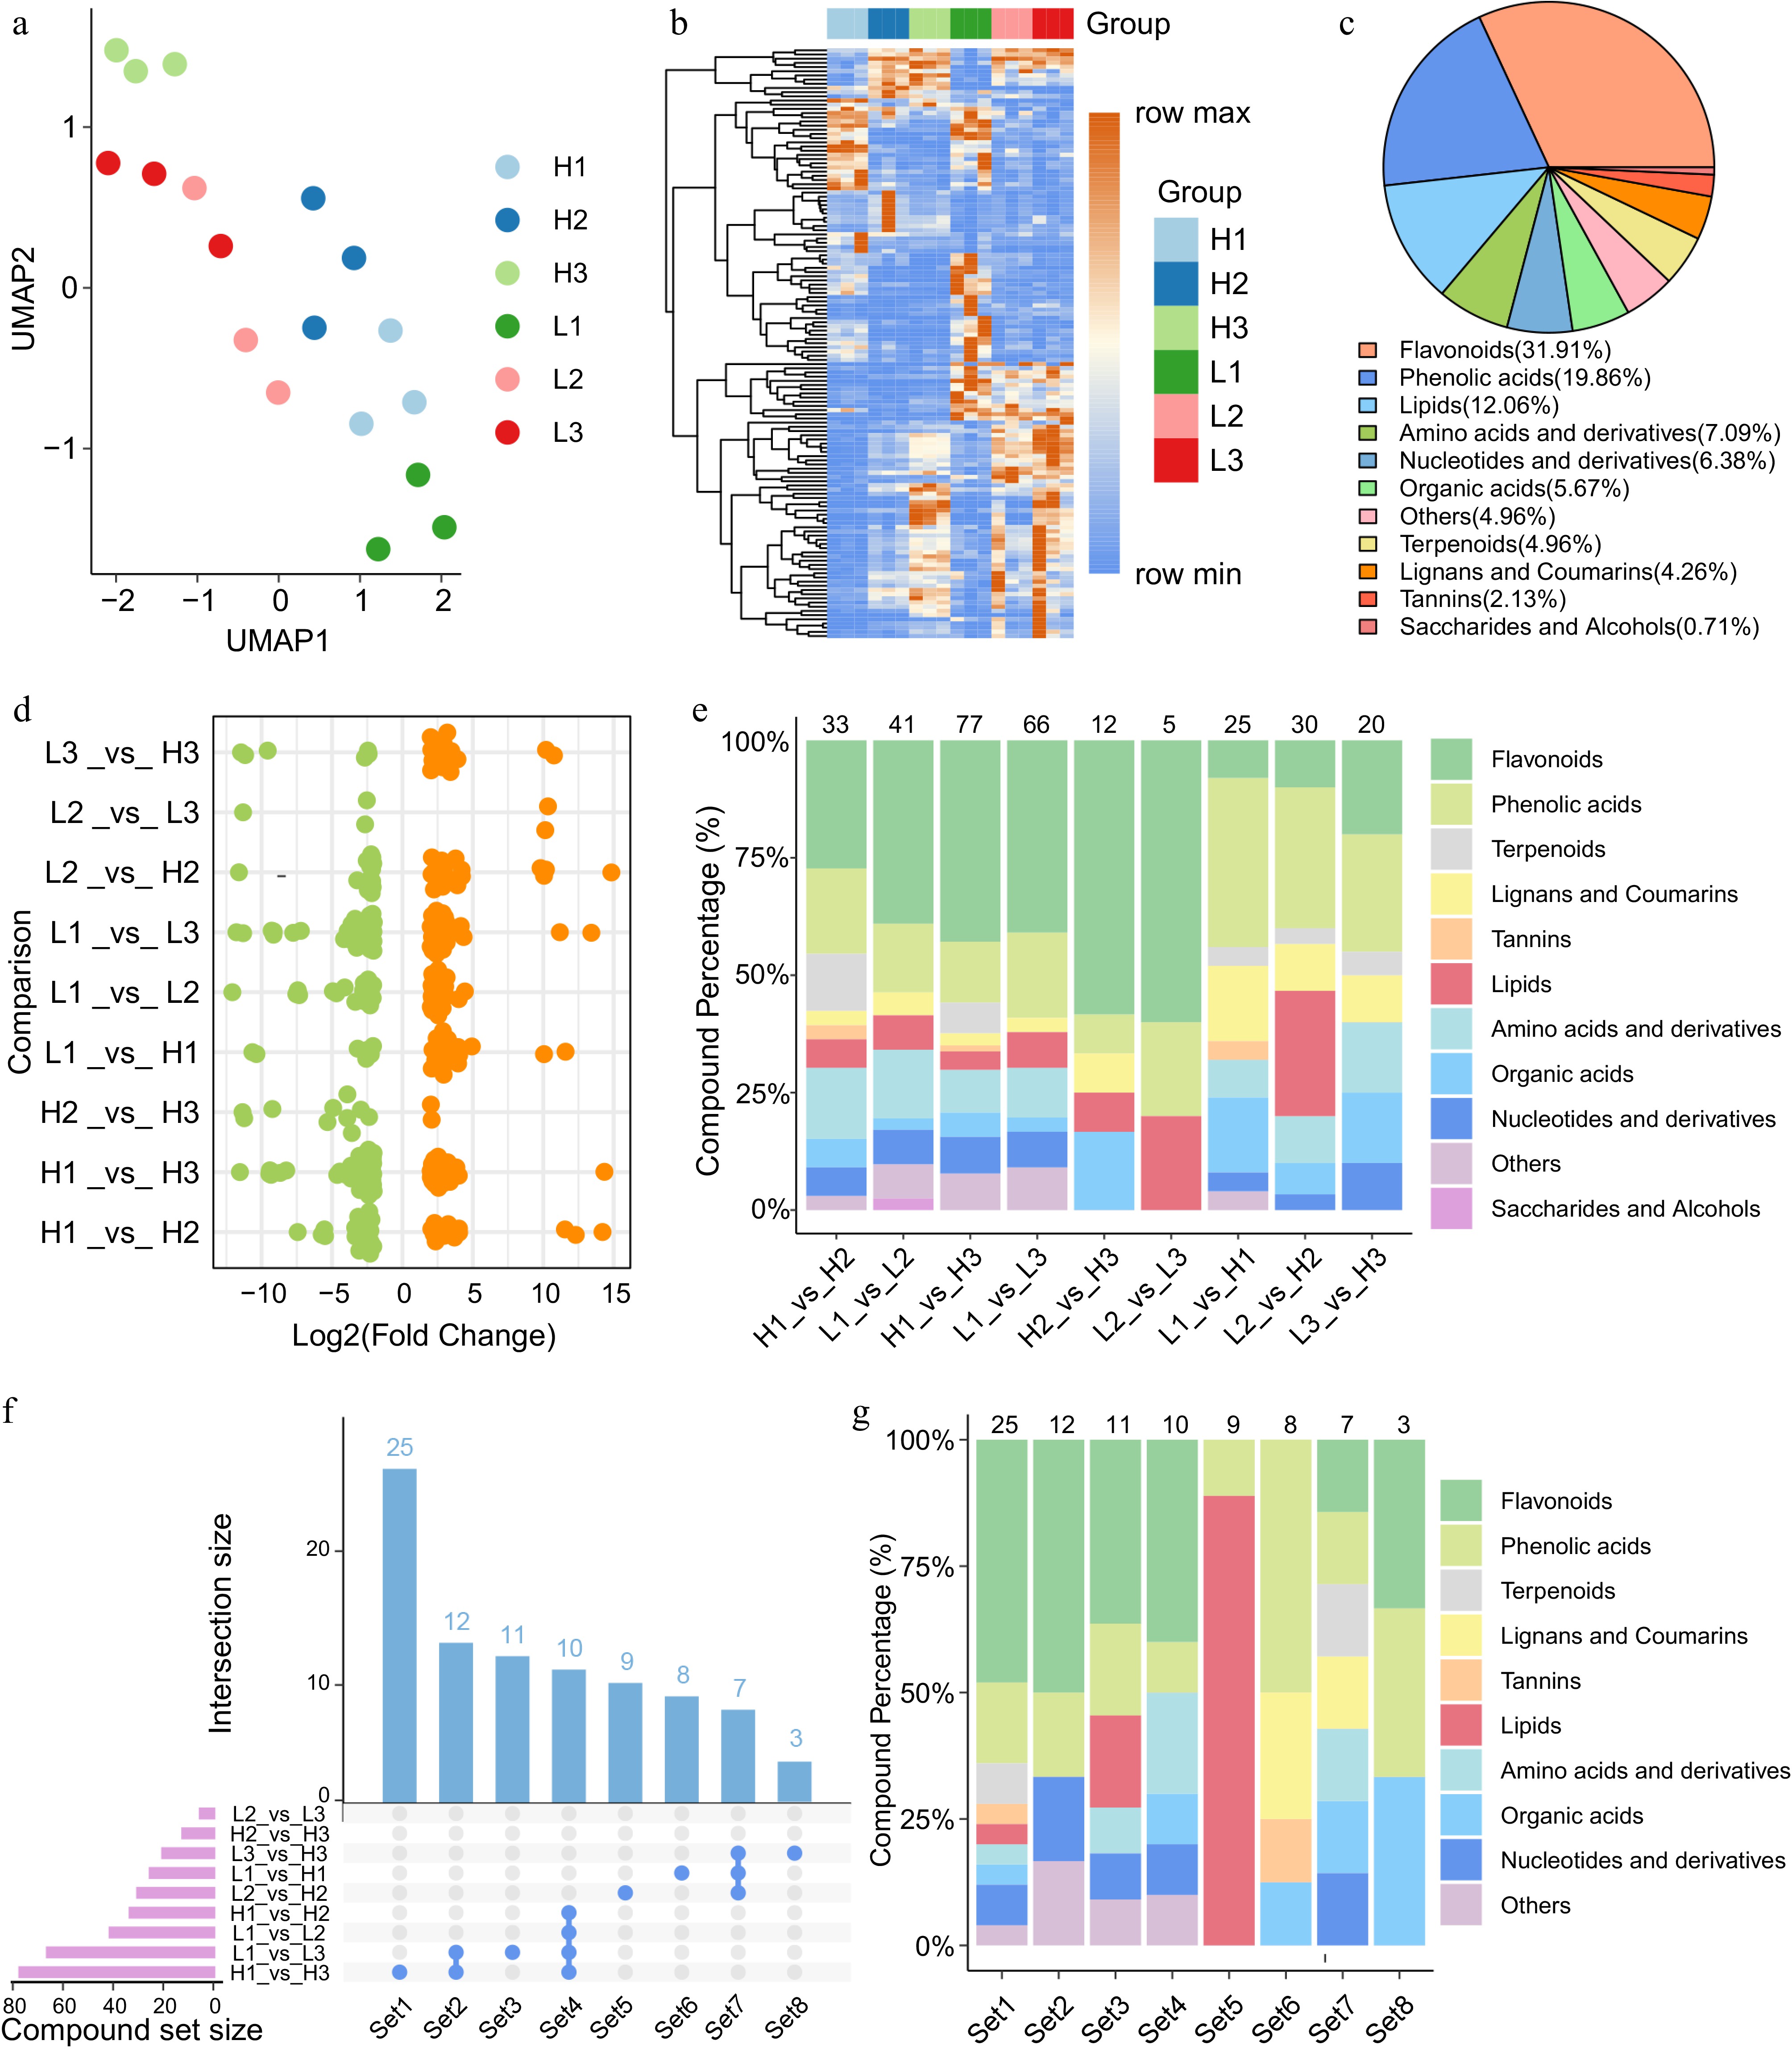
Figure 2.
Metabolomic characteristics of flower bud developmental stages in C. wilsoniana. (a) UMAP scatterplot of flower bud samples. (b) Hierarchical clustering heatmap of the relative abundance of 141 DEMs. (c) Classification of the 141 DEMs detected during flower bud developmental stages in C. wilsoniana. (d) Log2(Fold Change) distribution of upregulated (orange, Adjusted p-value < 0.05) and downregulated (green, Adjusted p-value < 0.05) metabolites across different comparison groups. (e) Trends in the proportional changes of DEM categories across the comparison groups. (f) Bar chart of DEM counts across different comparison groups. (g) Class composition of different sets of DEMs. Supplementary Table S5 lists the information for Set1−Set8.
-
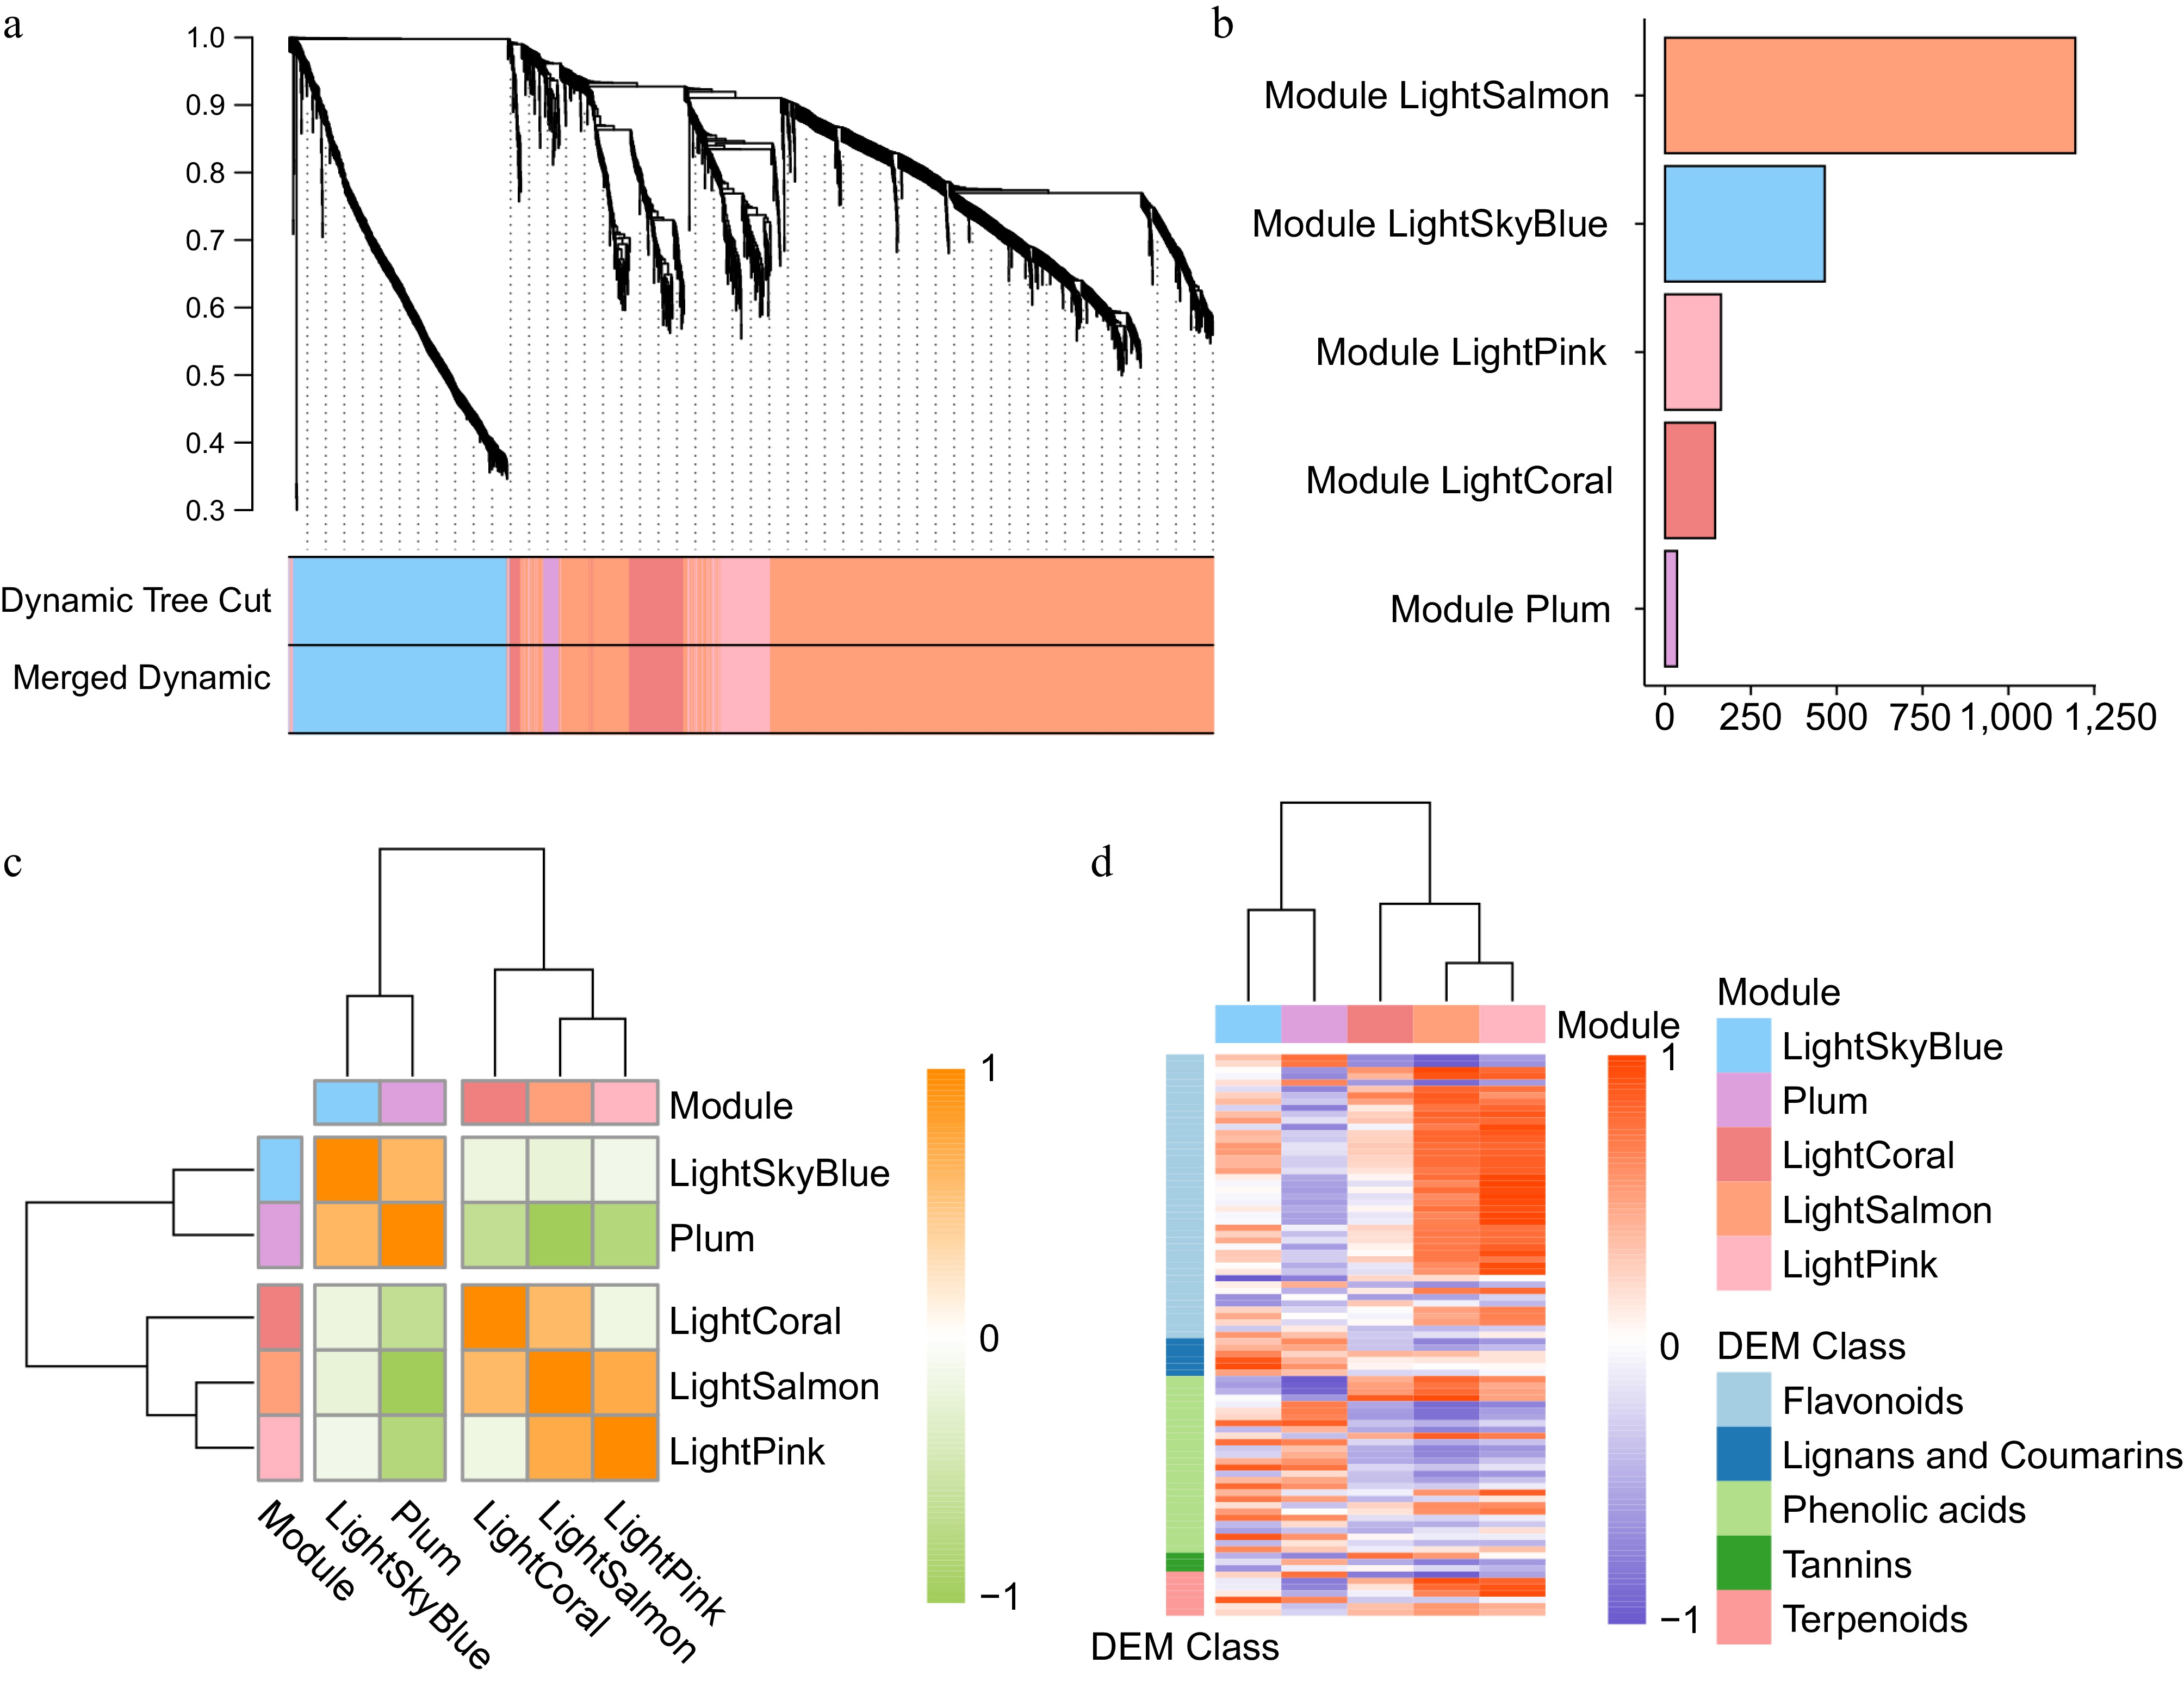
Figure 3.
WGCNA reveals key modules associated with secondary metabolism. (a) Hierarchical clustering dendrogram of DEGs based on topological overlap dissimilarity, with module identification using dynamic tree cut and merged dynamic methods. (b) Distribution of the gene number in each module. (c) Heatmap illustrating Pearson correlation among module genes within co-expression modules. (d) Heatmap showing the expression correlation between modules and different categories of differentially expressed SMs.
-
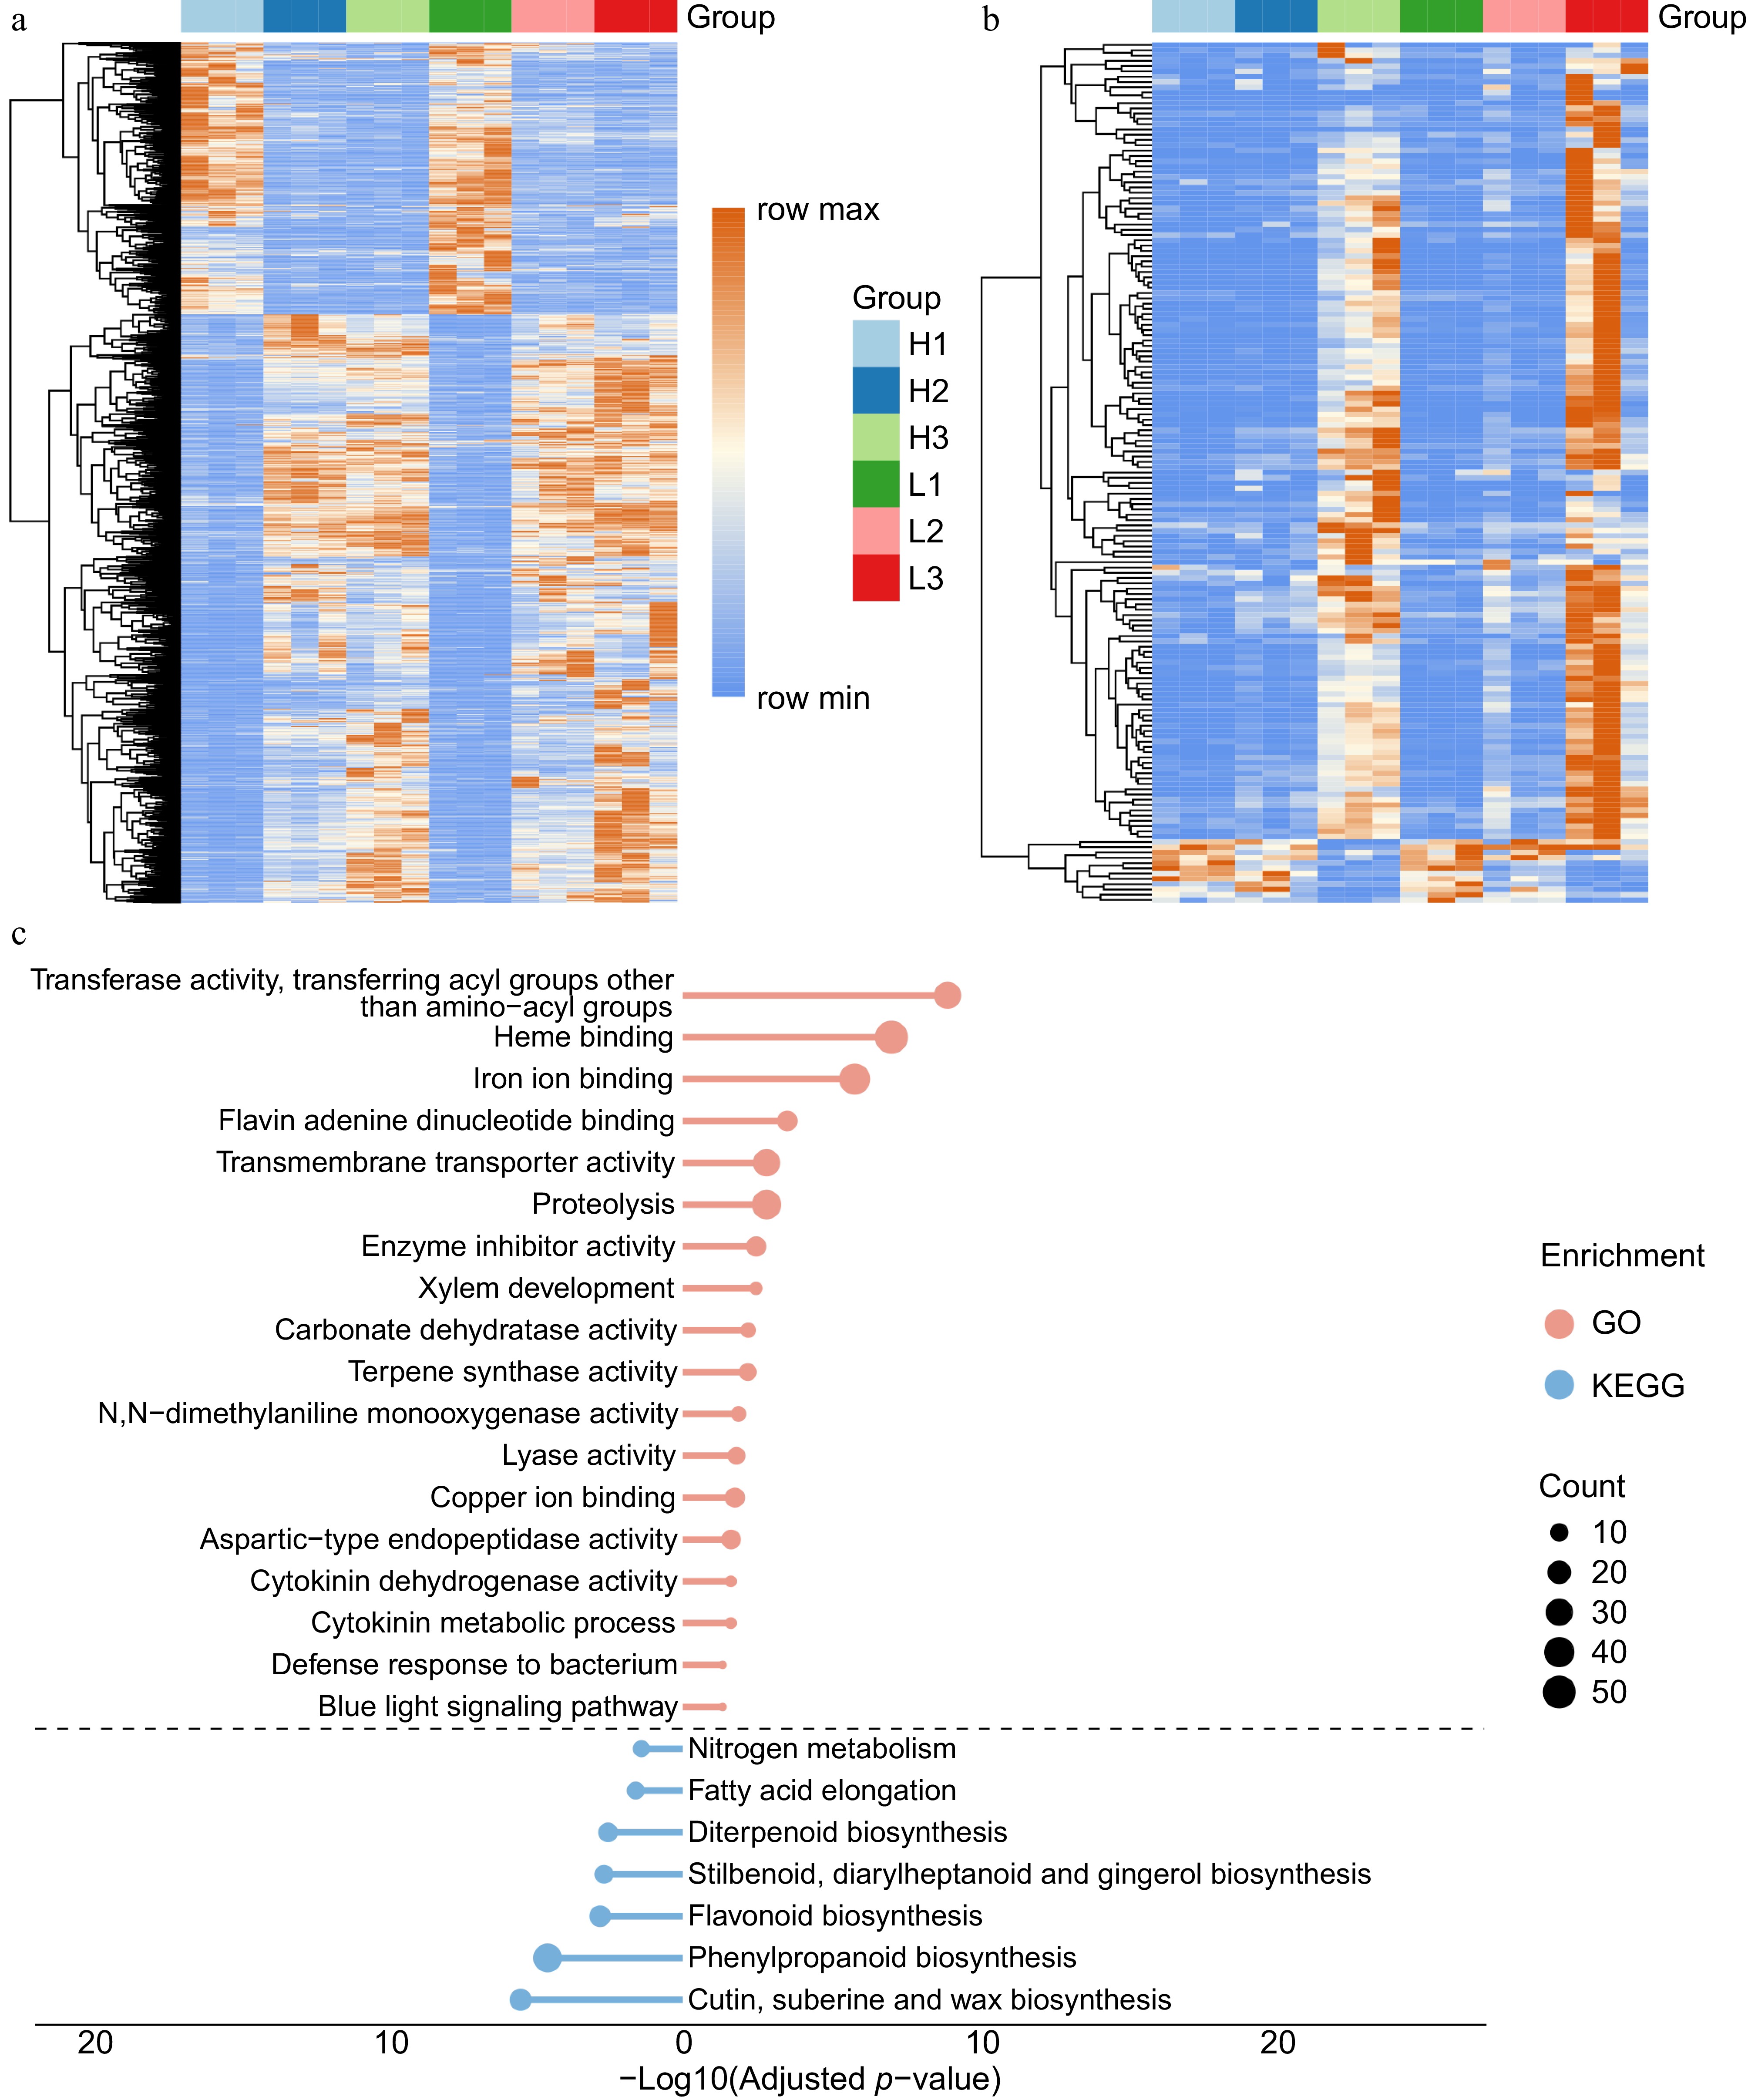
Figure 4.
Expression patterns of DEGs in different modules related to flavonoids. (a) Expression patterns of DEGs in the LightSalmon module. (b) Expression patterns of DEGs in the LightPink module. (c) Typical significantly enriched GO terms for the DEGs in the LightSalmon and LightPink modules.
-
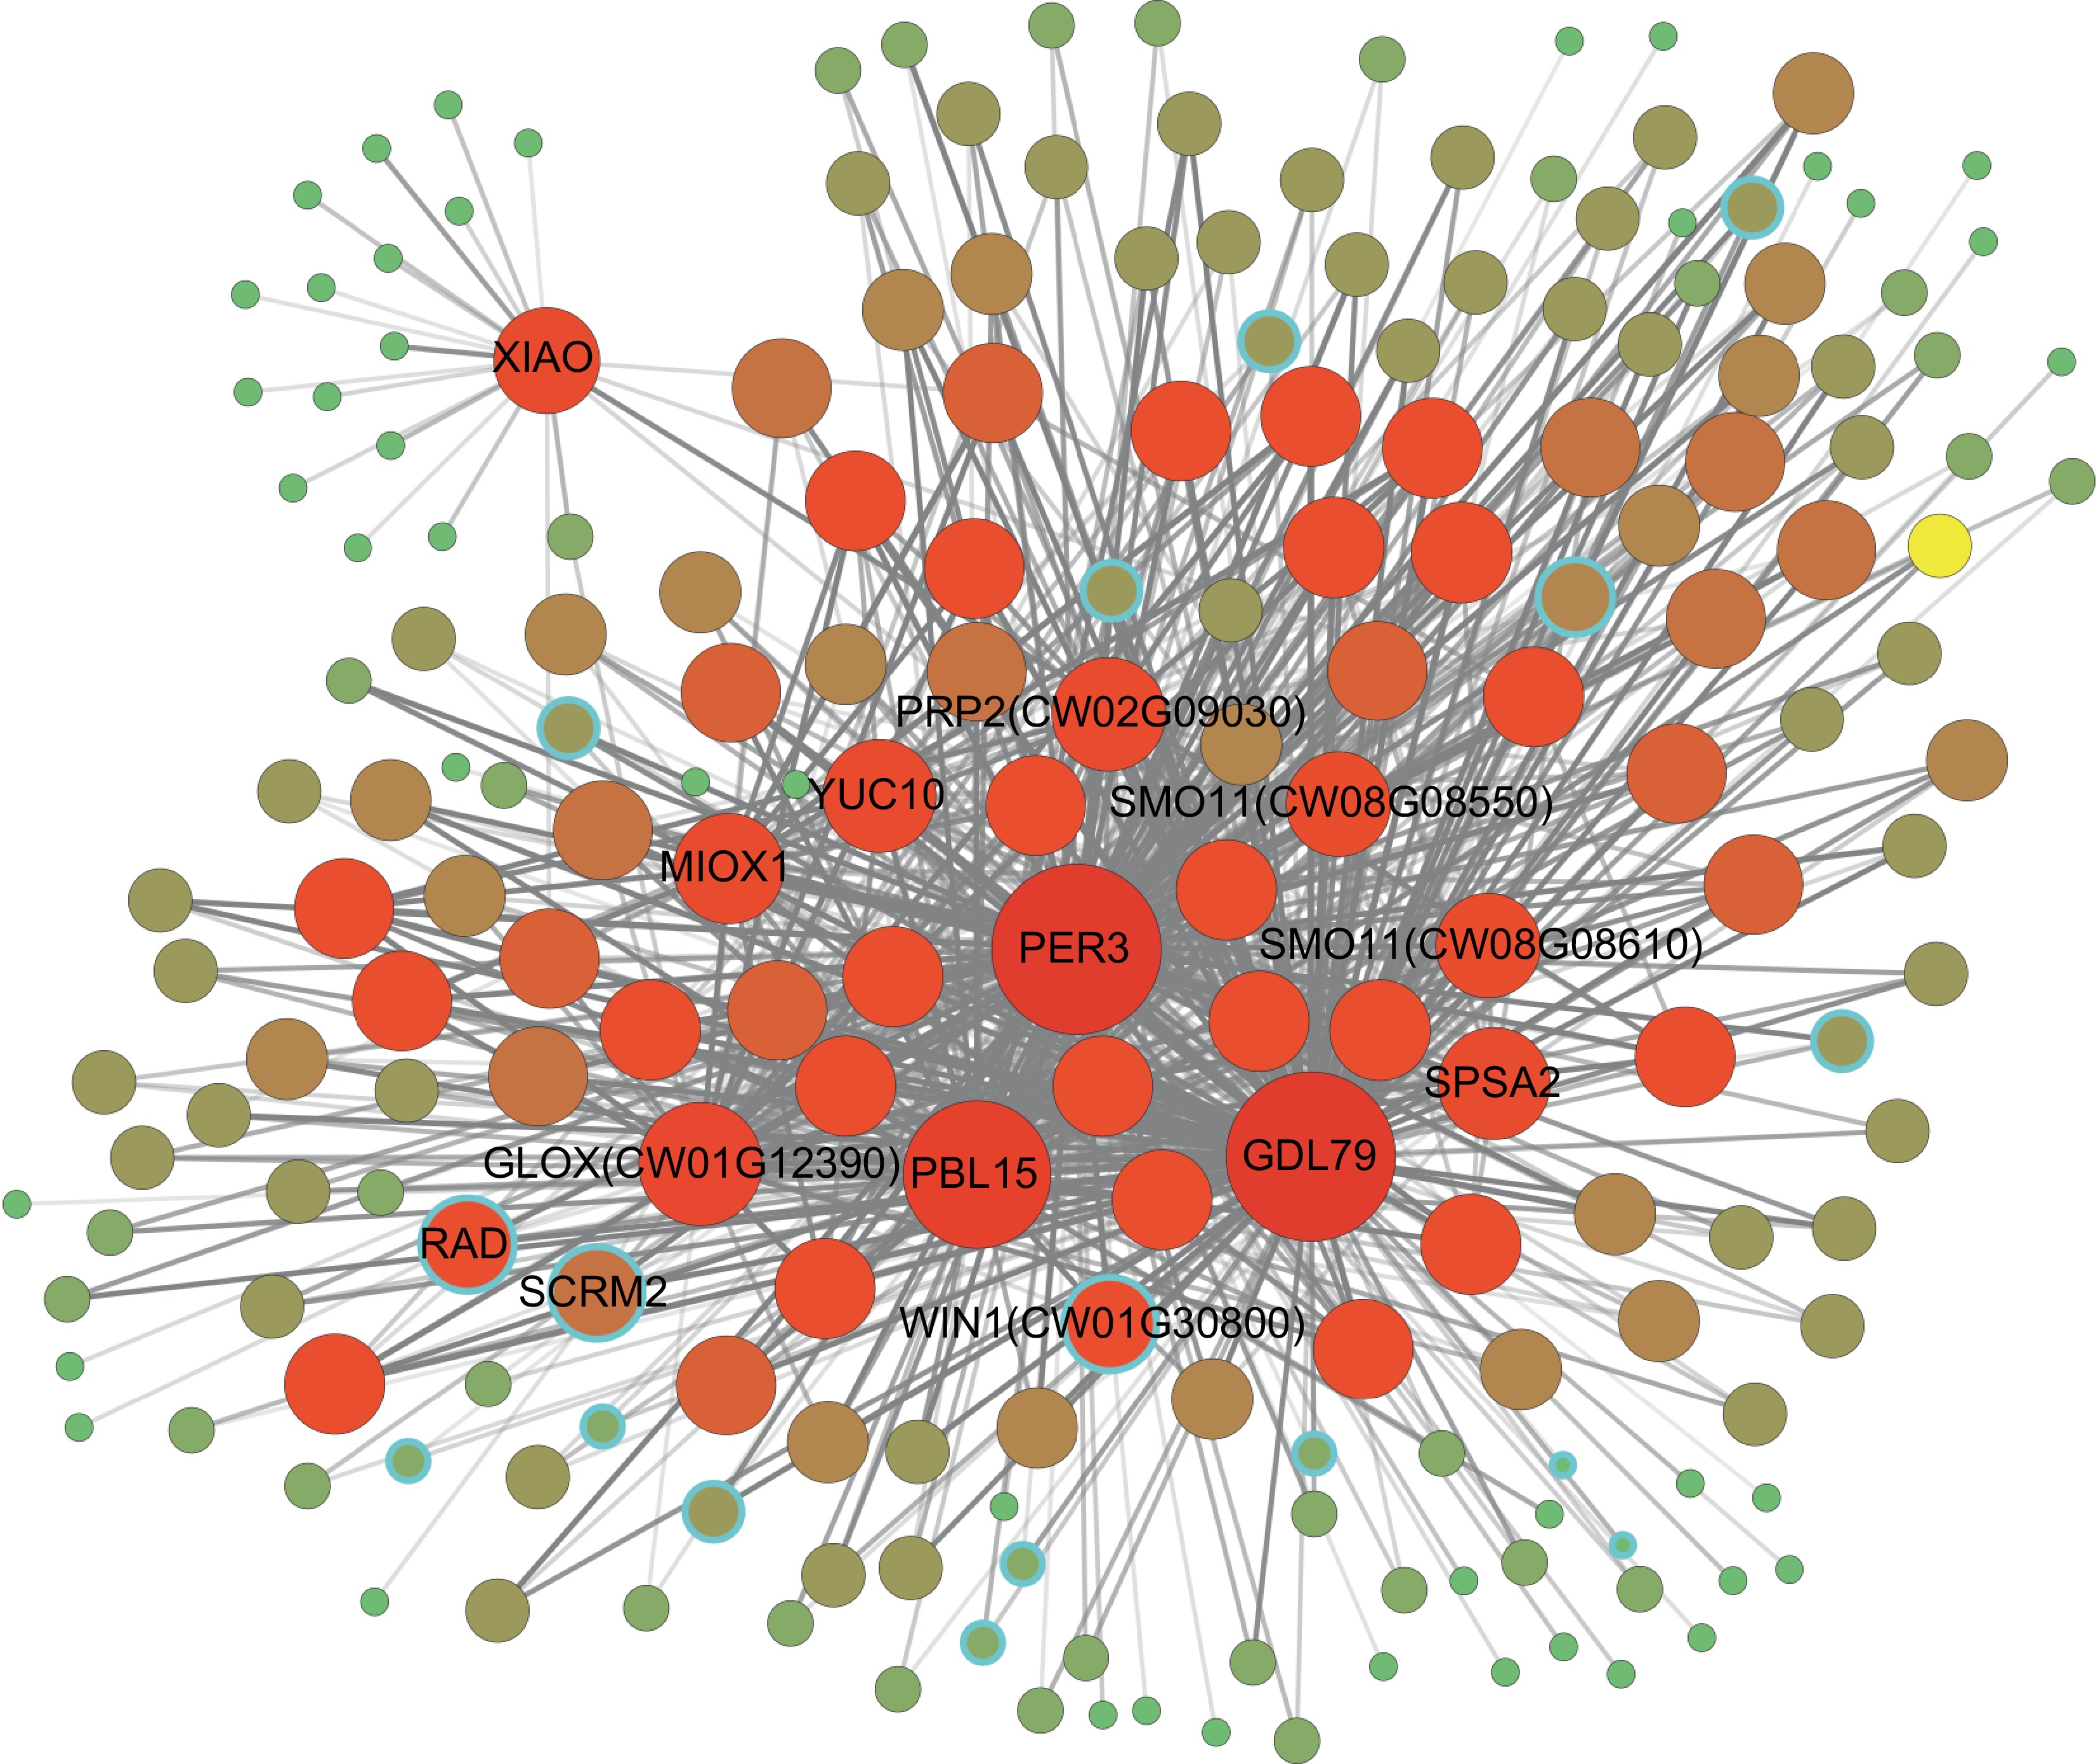
Figure 5.
Co-expression network of flavonoid-related genes. The size and color depth of the nodes represent the connectivity of the nodes. Nodes with a blue border represent TFs. Supplementary Table S9 lists the information for G1−G12. The depth of the colored edges represents the weight values. The distant region and elliptical region indicate two highly interactive gene clusters.
-
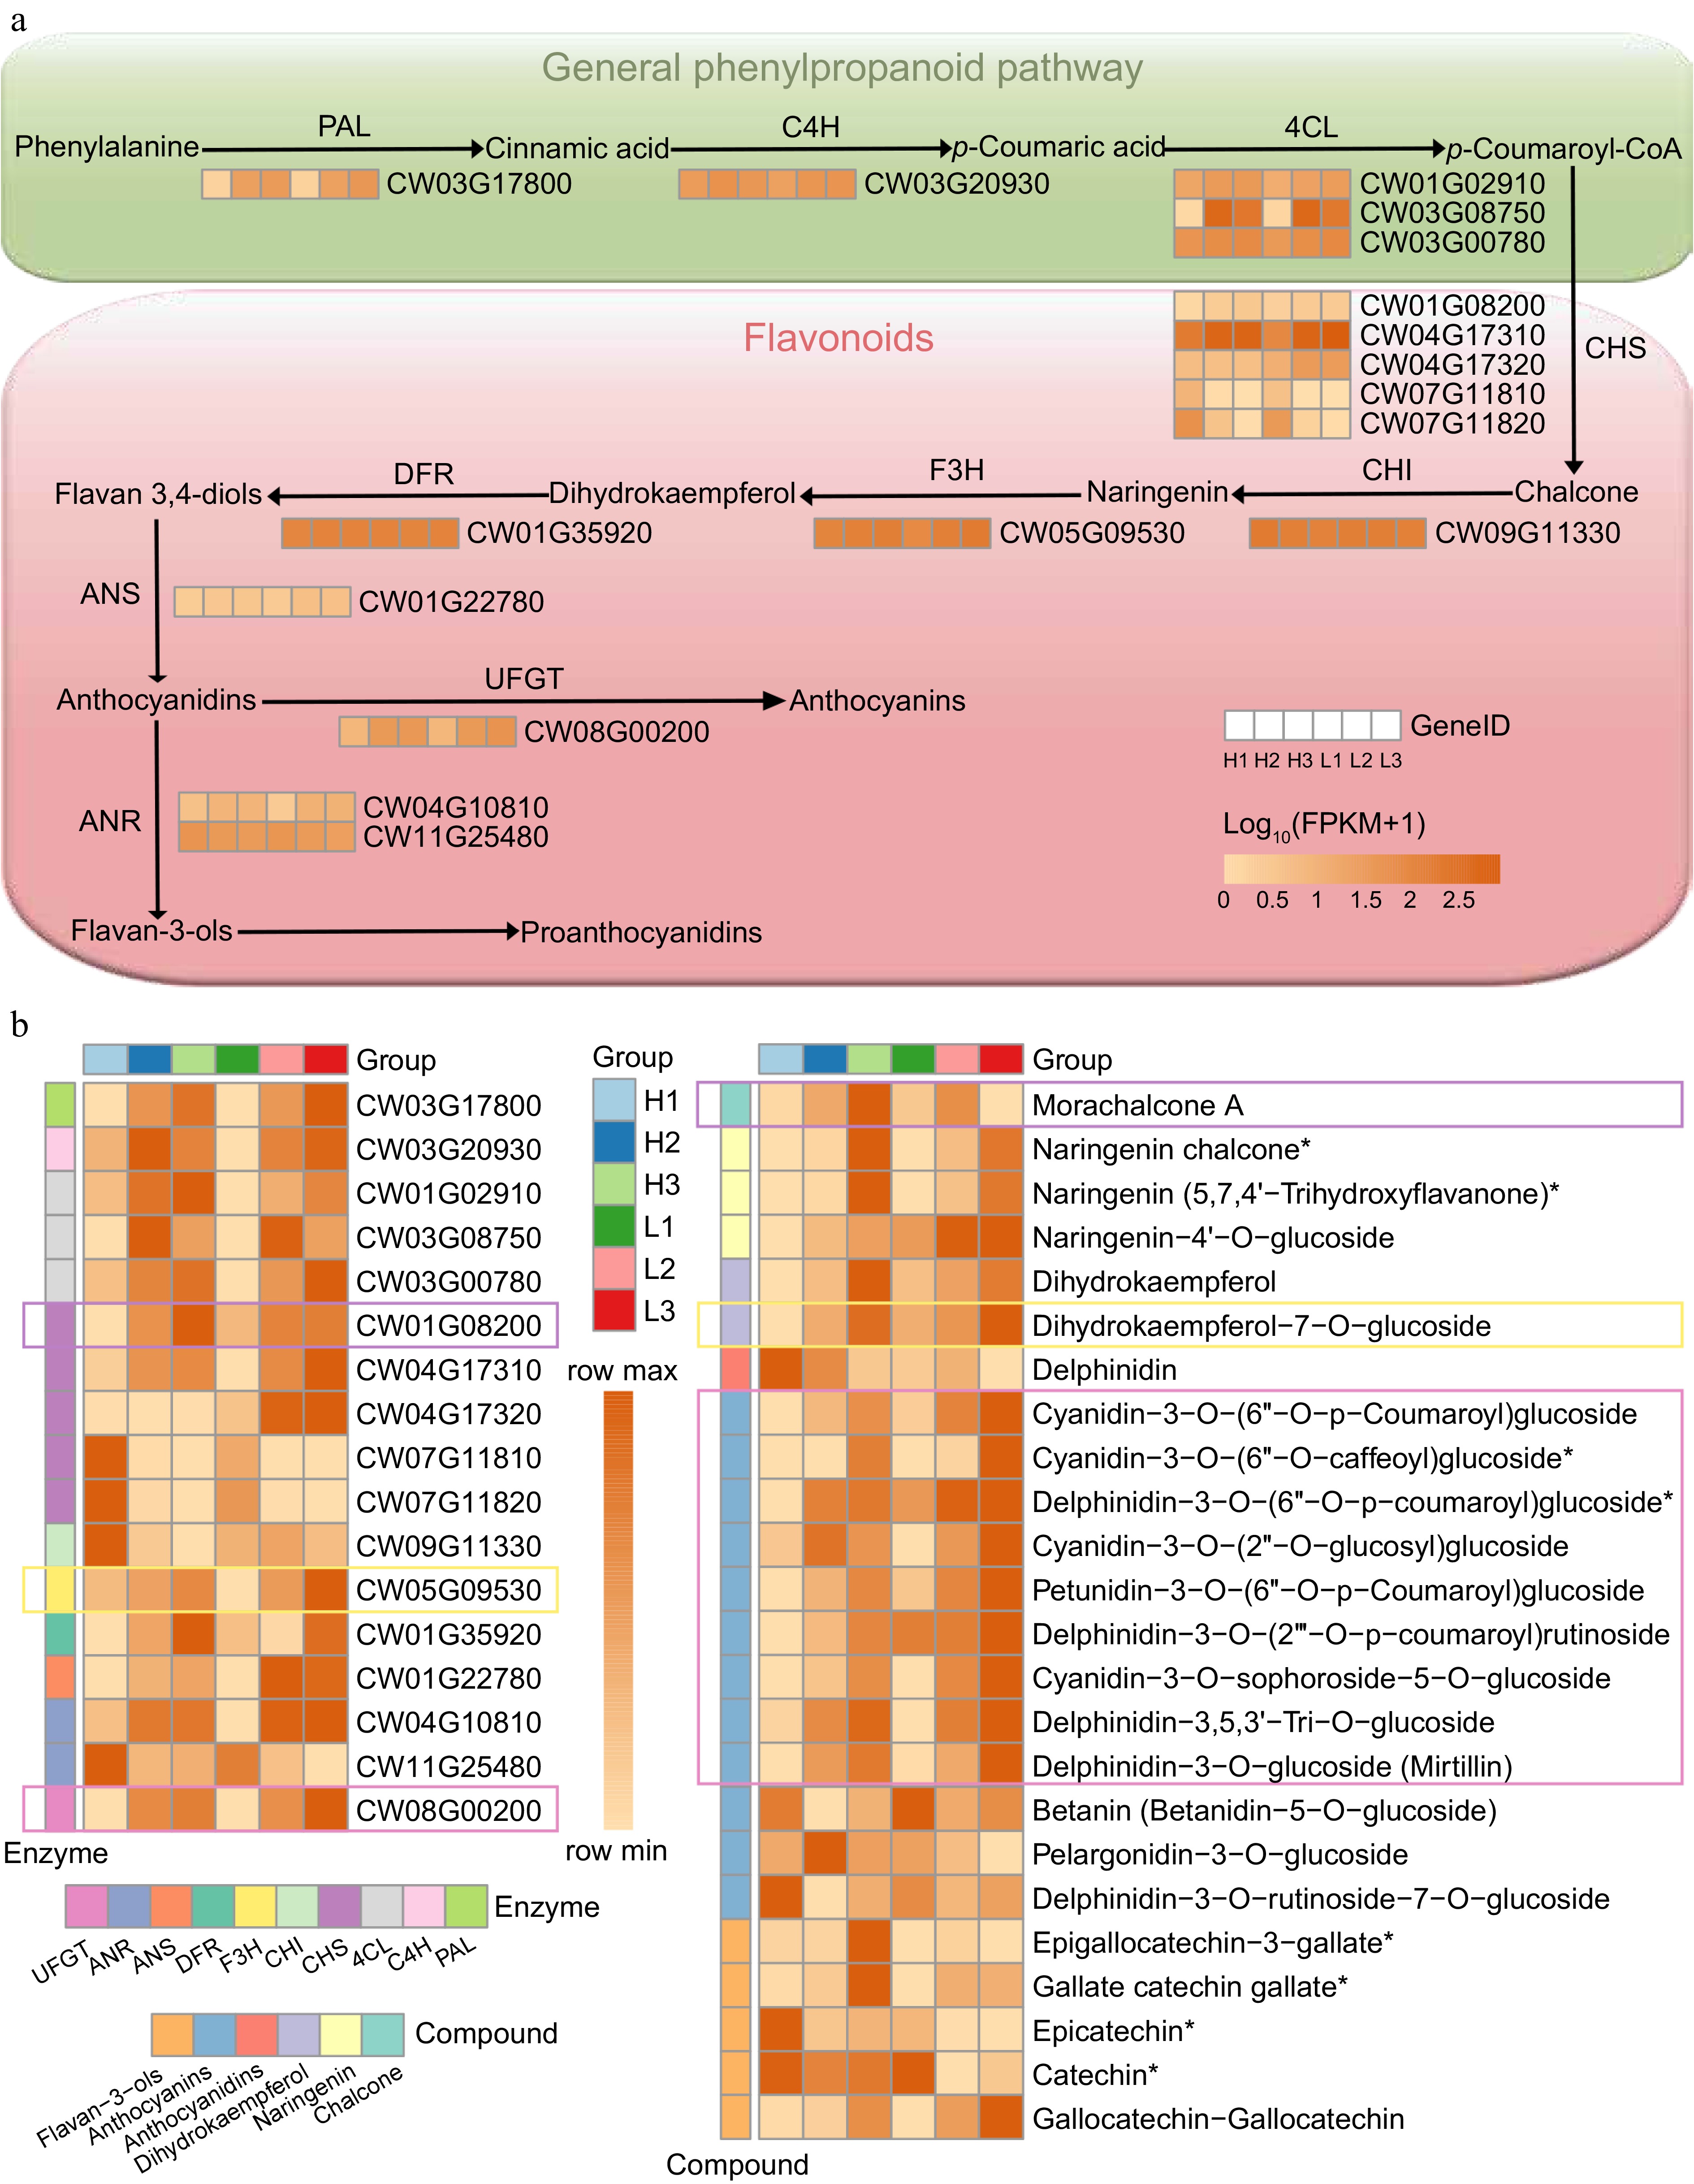
Figure 6.
Genes involved in flavonoid biosynthesis. (a) A simplified representation of the flavonoid biosynthesis pathway, where the expression levels of each gene were estimated based on FPKM from RNA sequencing of flower bud tissue from high-yield and low-yield genotypes. (b) A heatmap of the expression abundances of key enzymes and metabolites in the anthocyanin pathway during the flower bud development stages, with expression levels standardized by the Max-Min method. Rectangles of different colors represent enzymes and metabolites with similar expression patterns. * indicates metabolites with possible structural isomers.
Figures
(6)
Tables
(0)