-
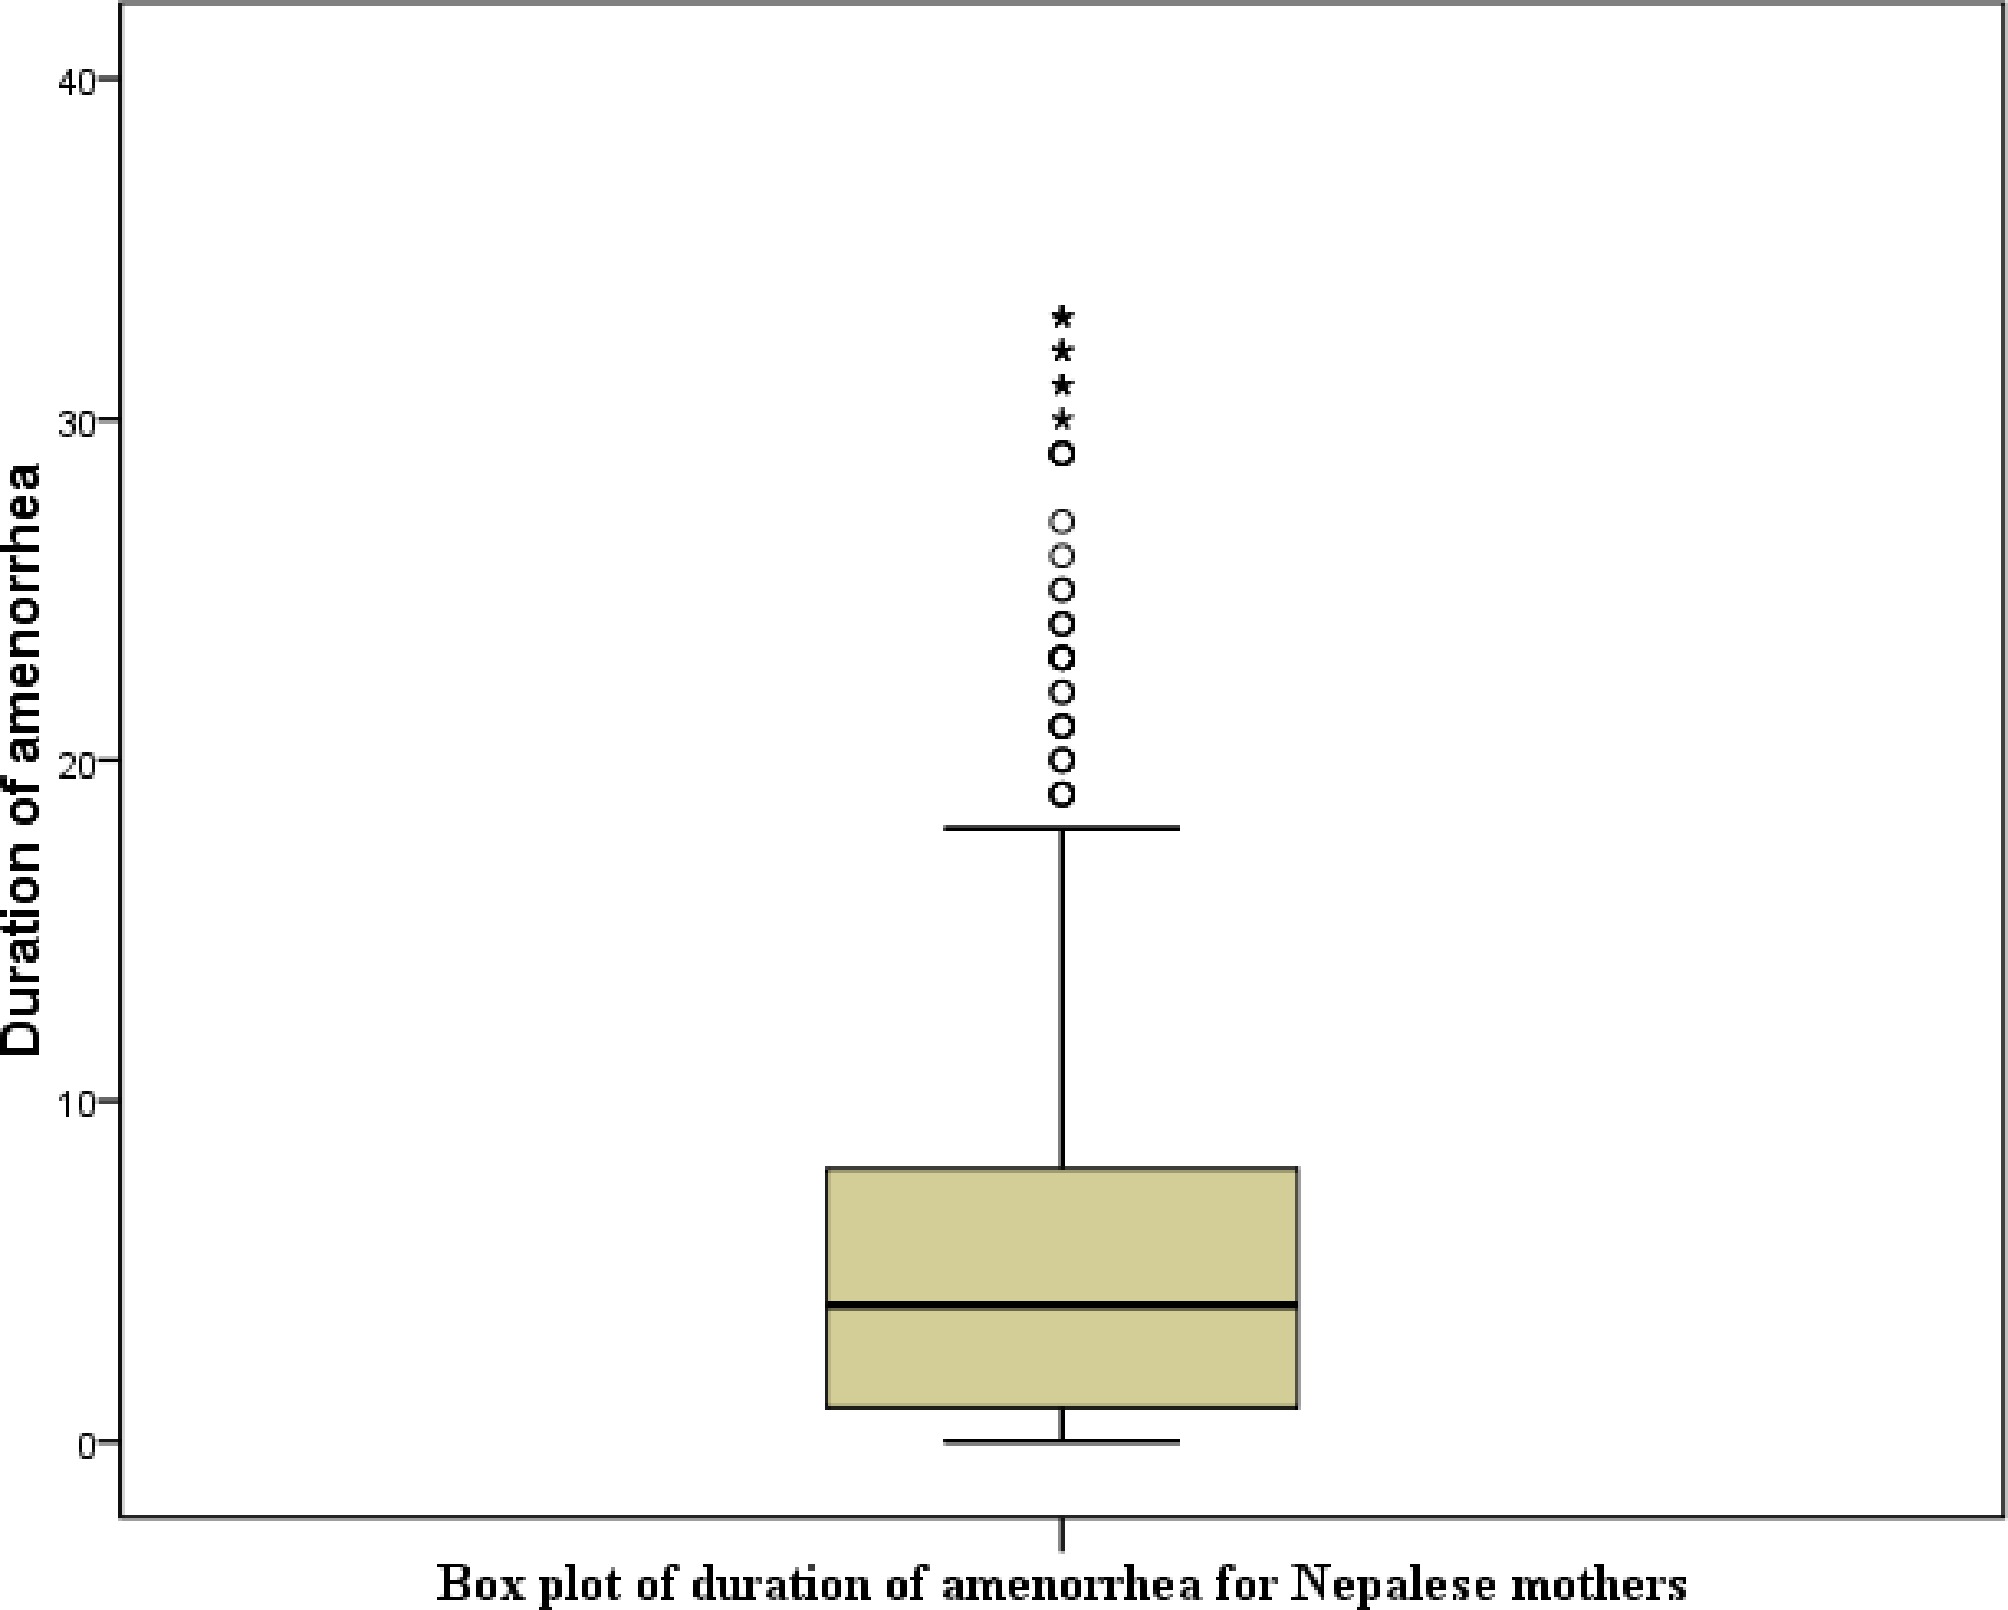
Figure 1.
Box and whisker plot of the duration of amenorrhea for Nepalese mothers.
-
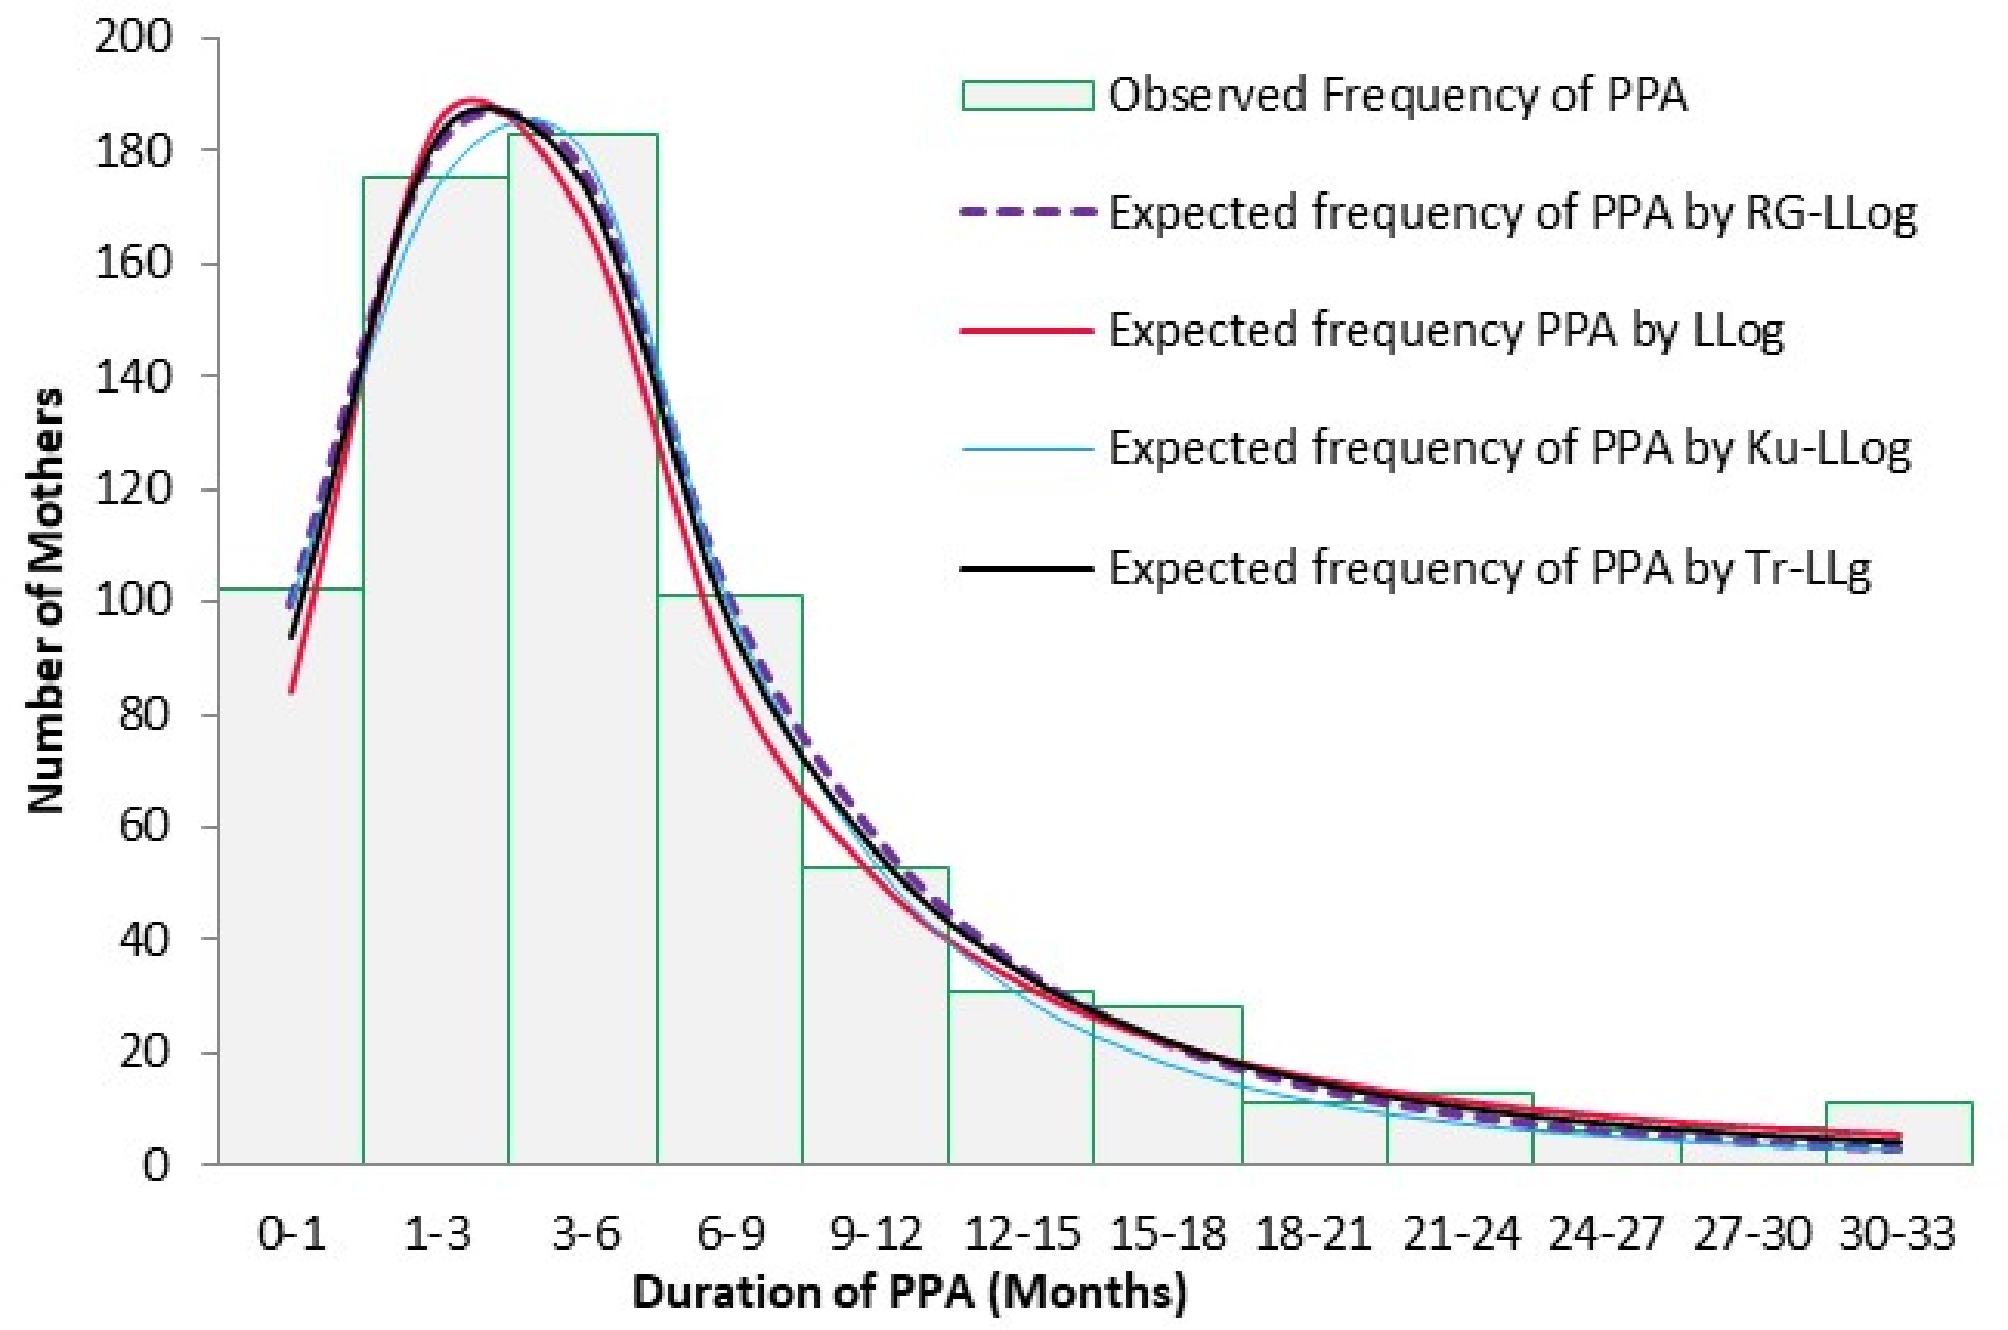
Figure 2.
Observed and expected value of the number of mothers for the duration of PPA.
-
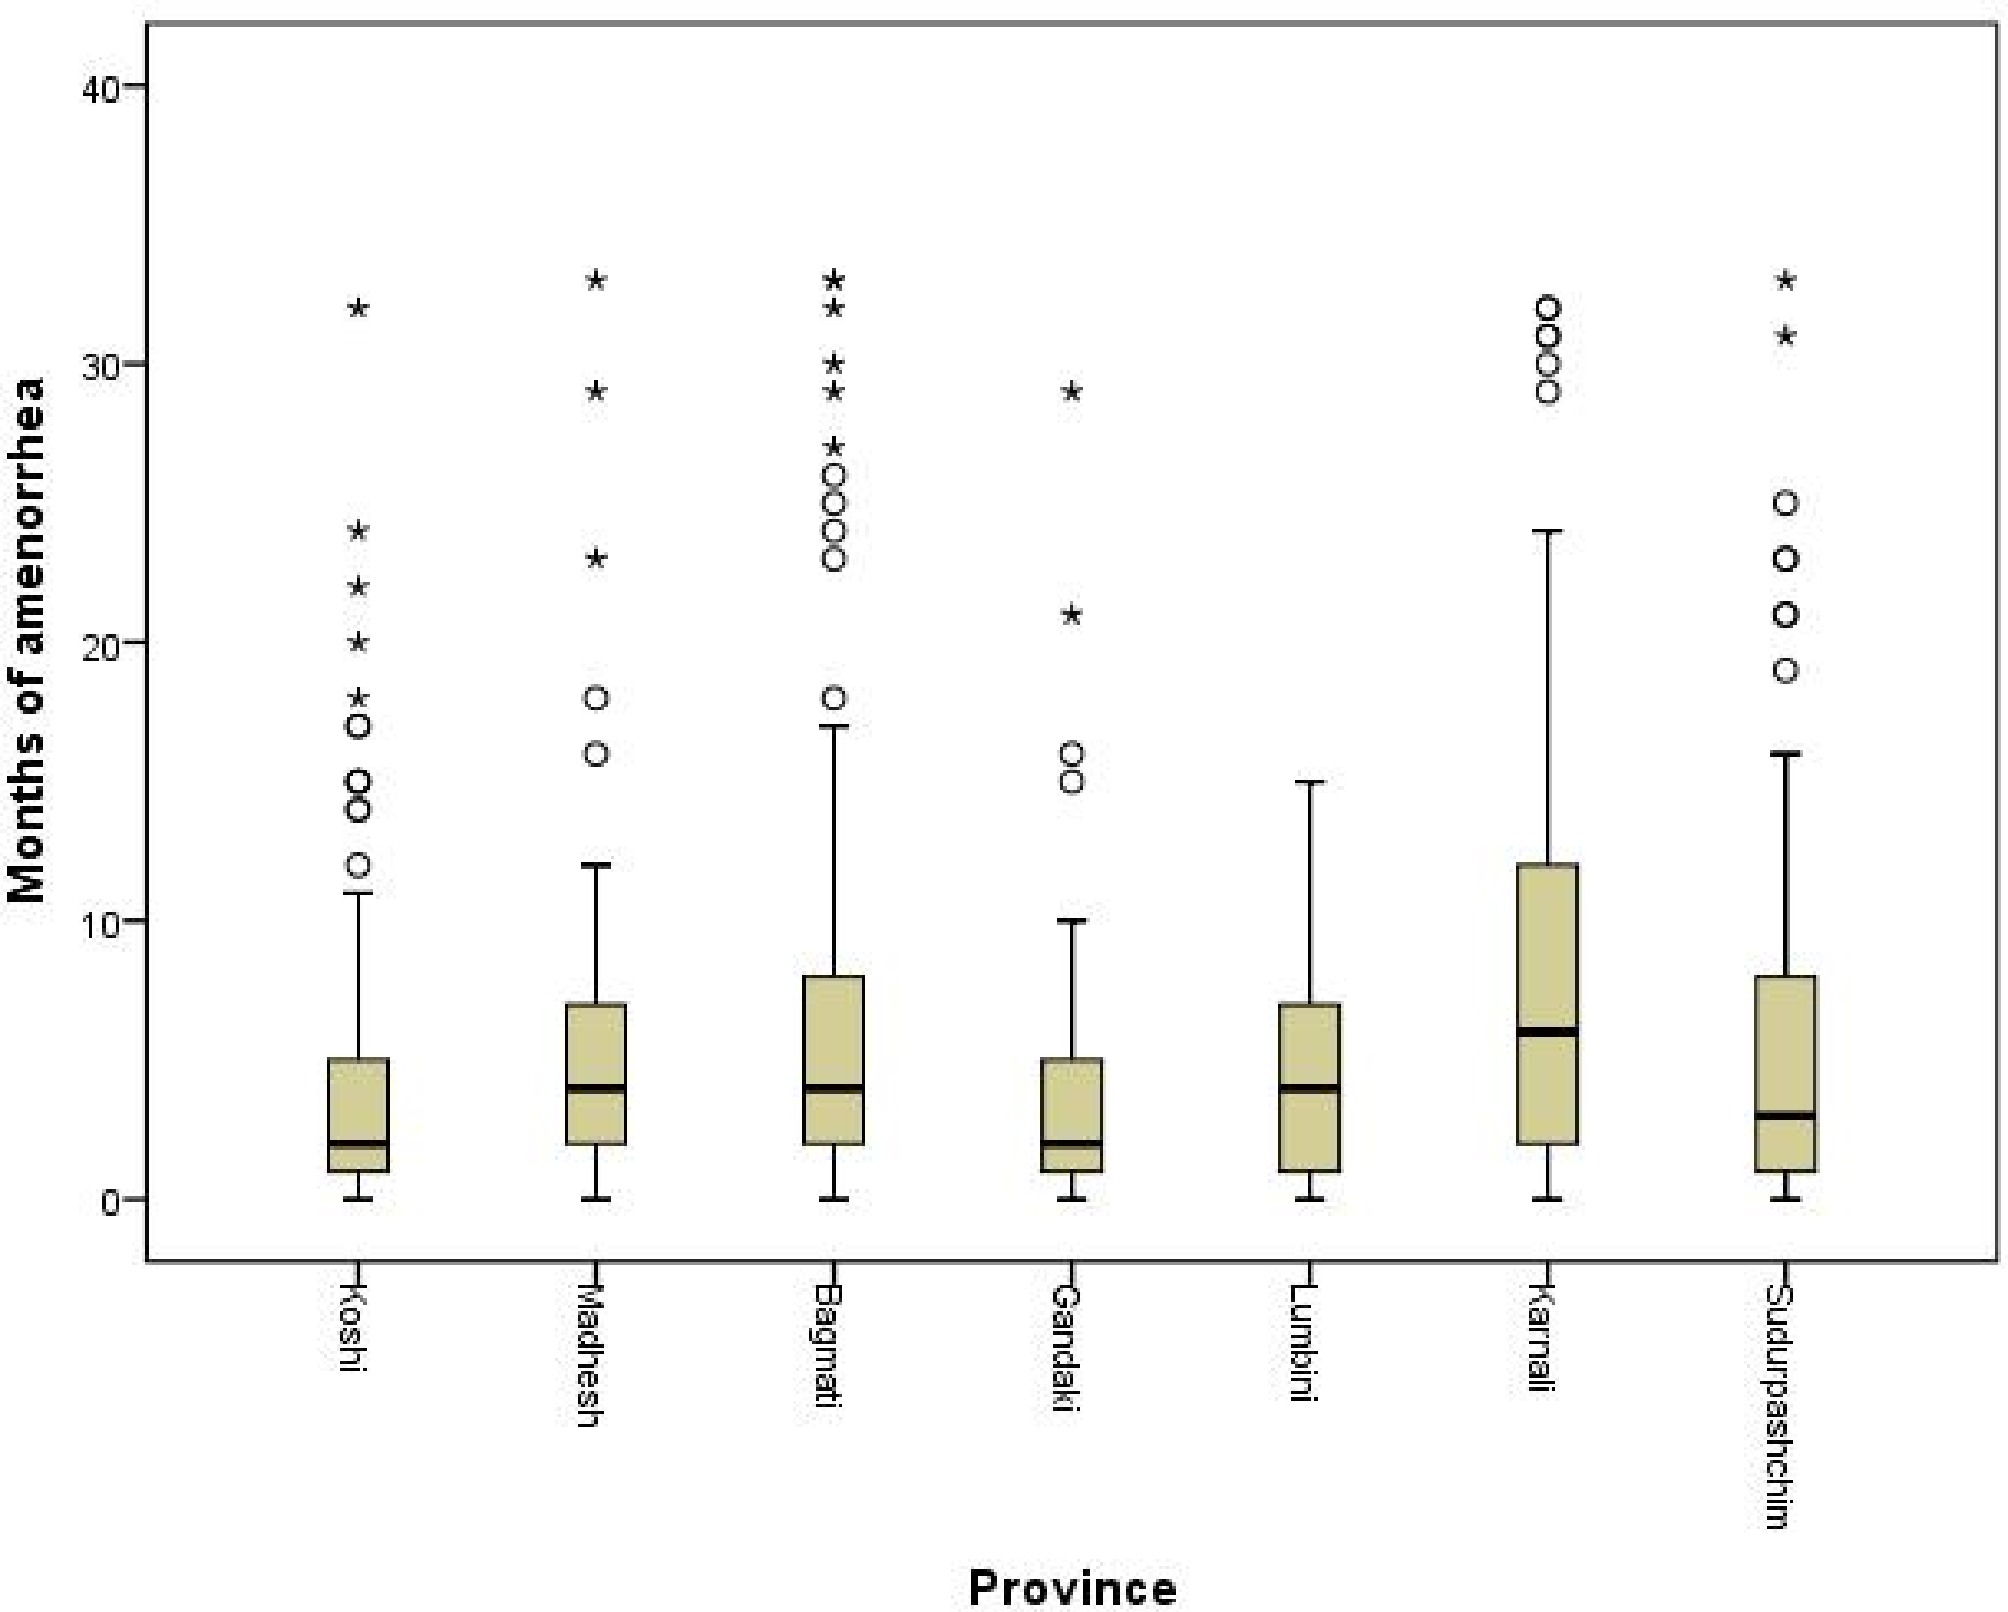
Figure 3.
Box and whisker plot of duration of PPA for different provinces in Nepal.
-
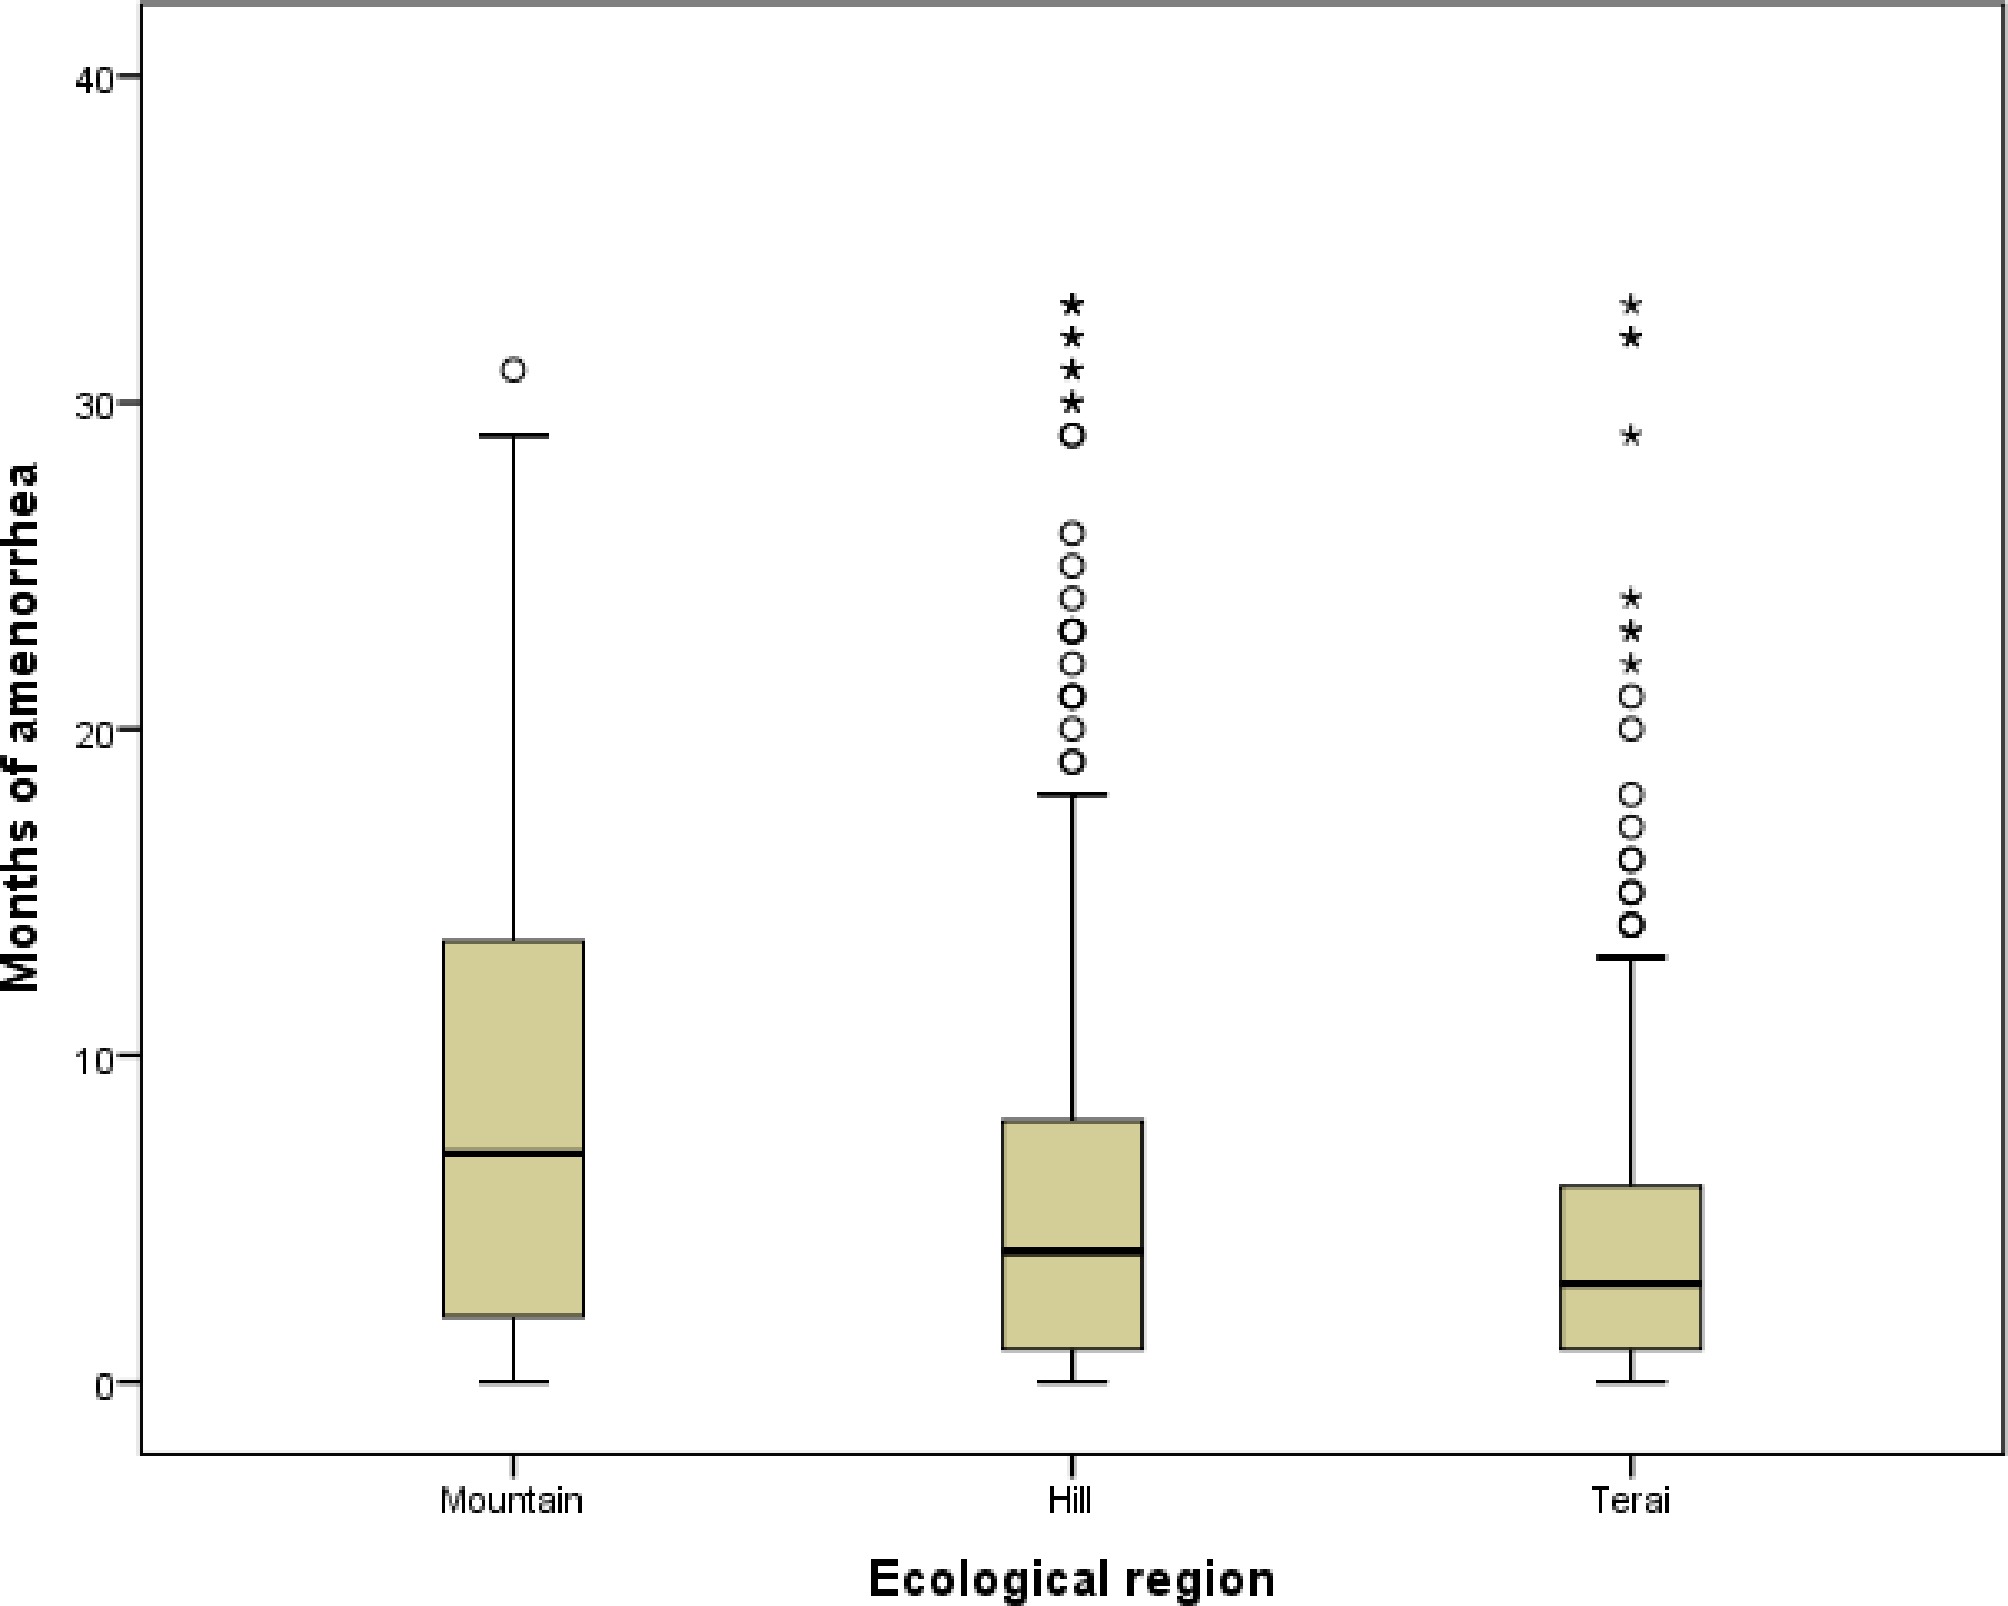
Figure 4.
Box and whisker plot of duration of PPA for Nepalese women for different ecological regions.
-
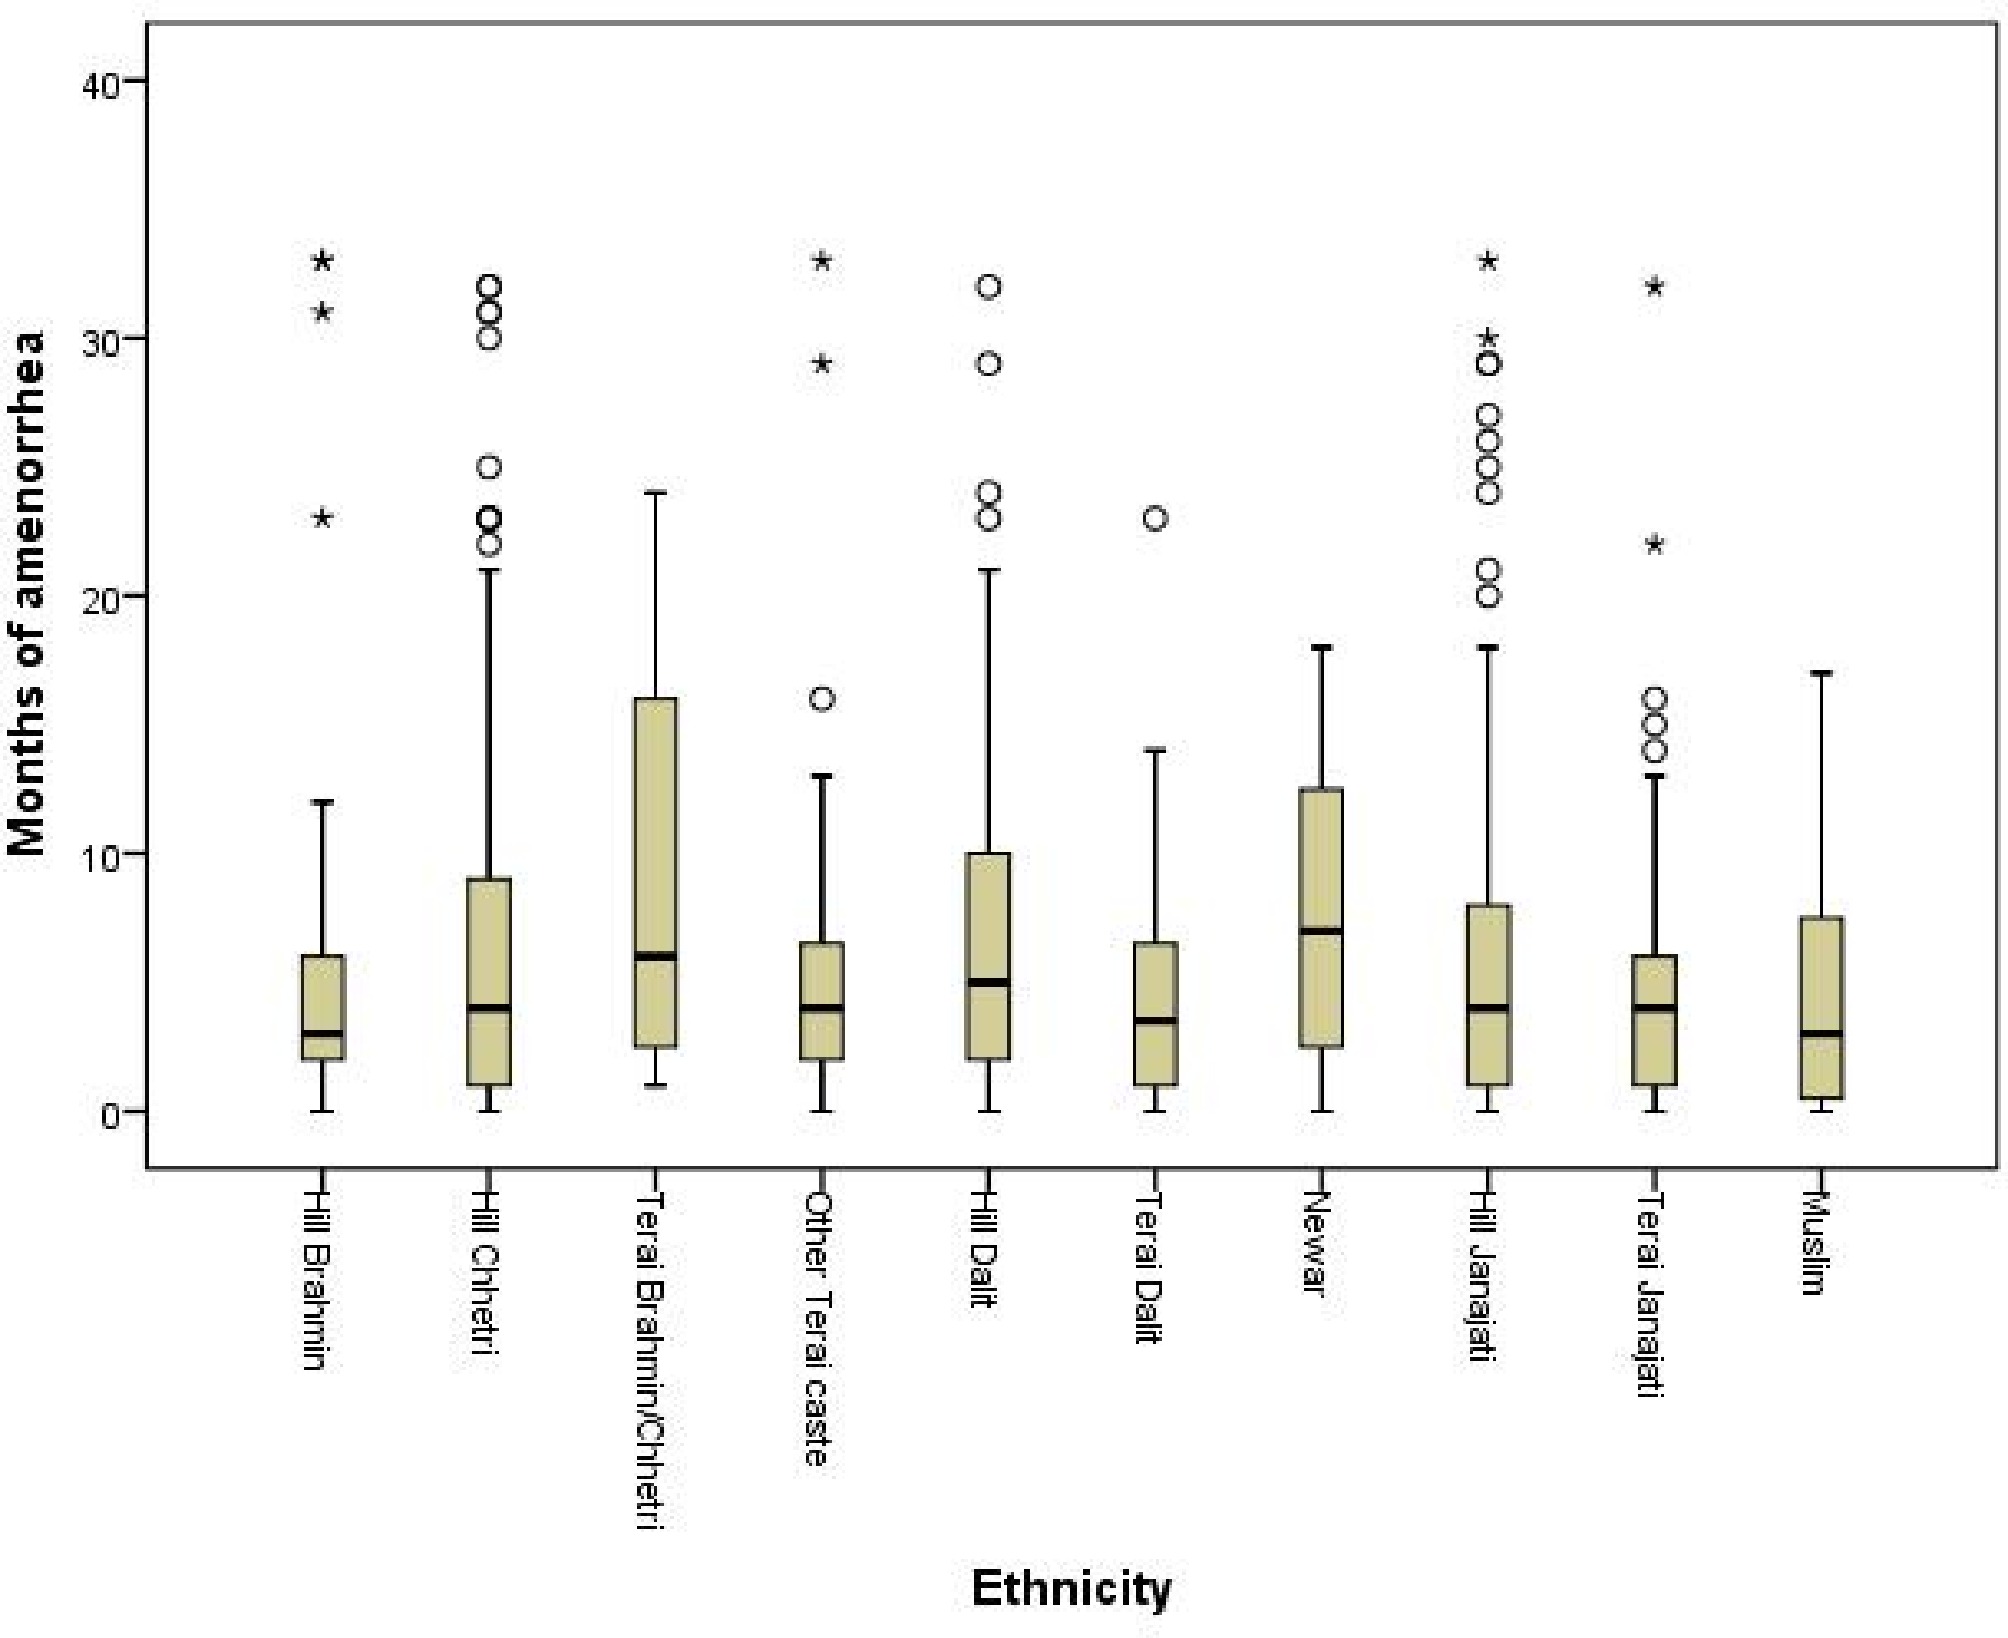
Figure 5.
The box-and-whisker plot of the duration of PPA for different ethnicities of Nepal.
-
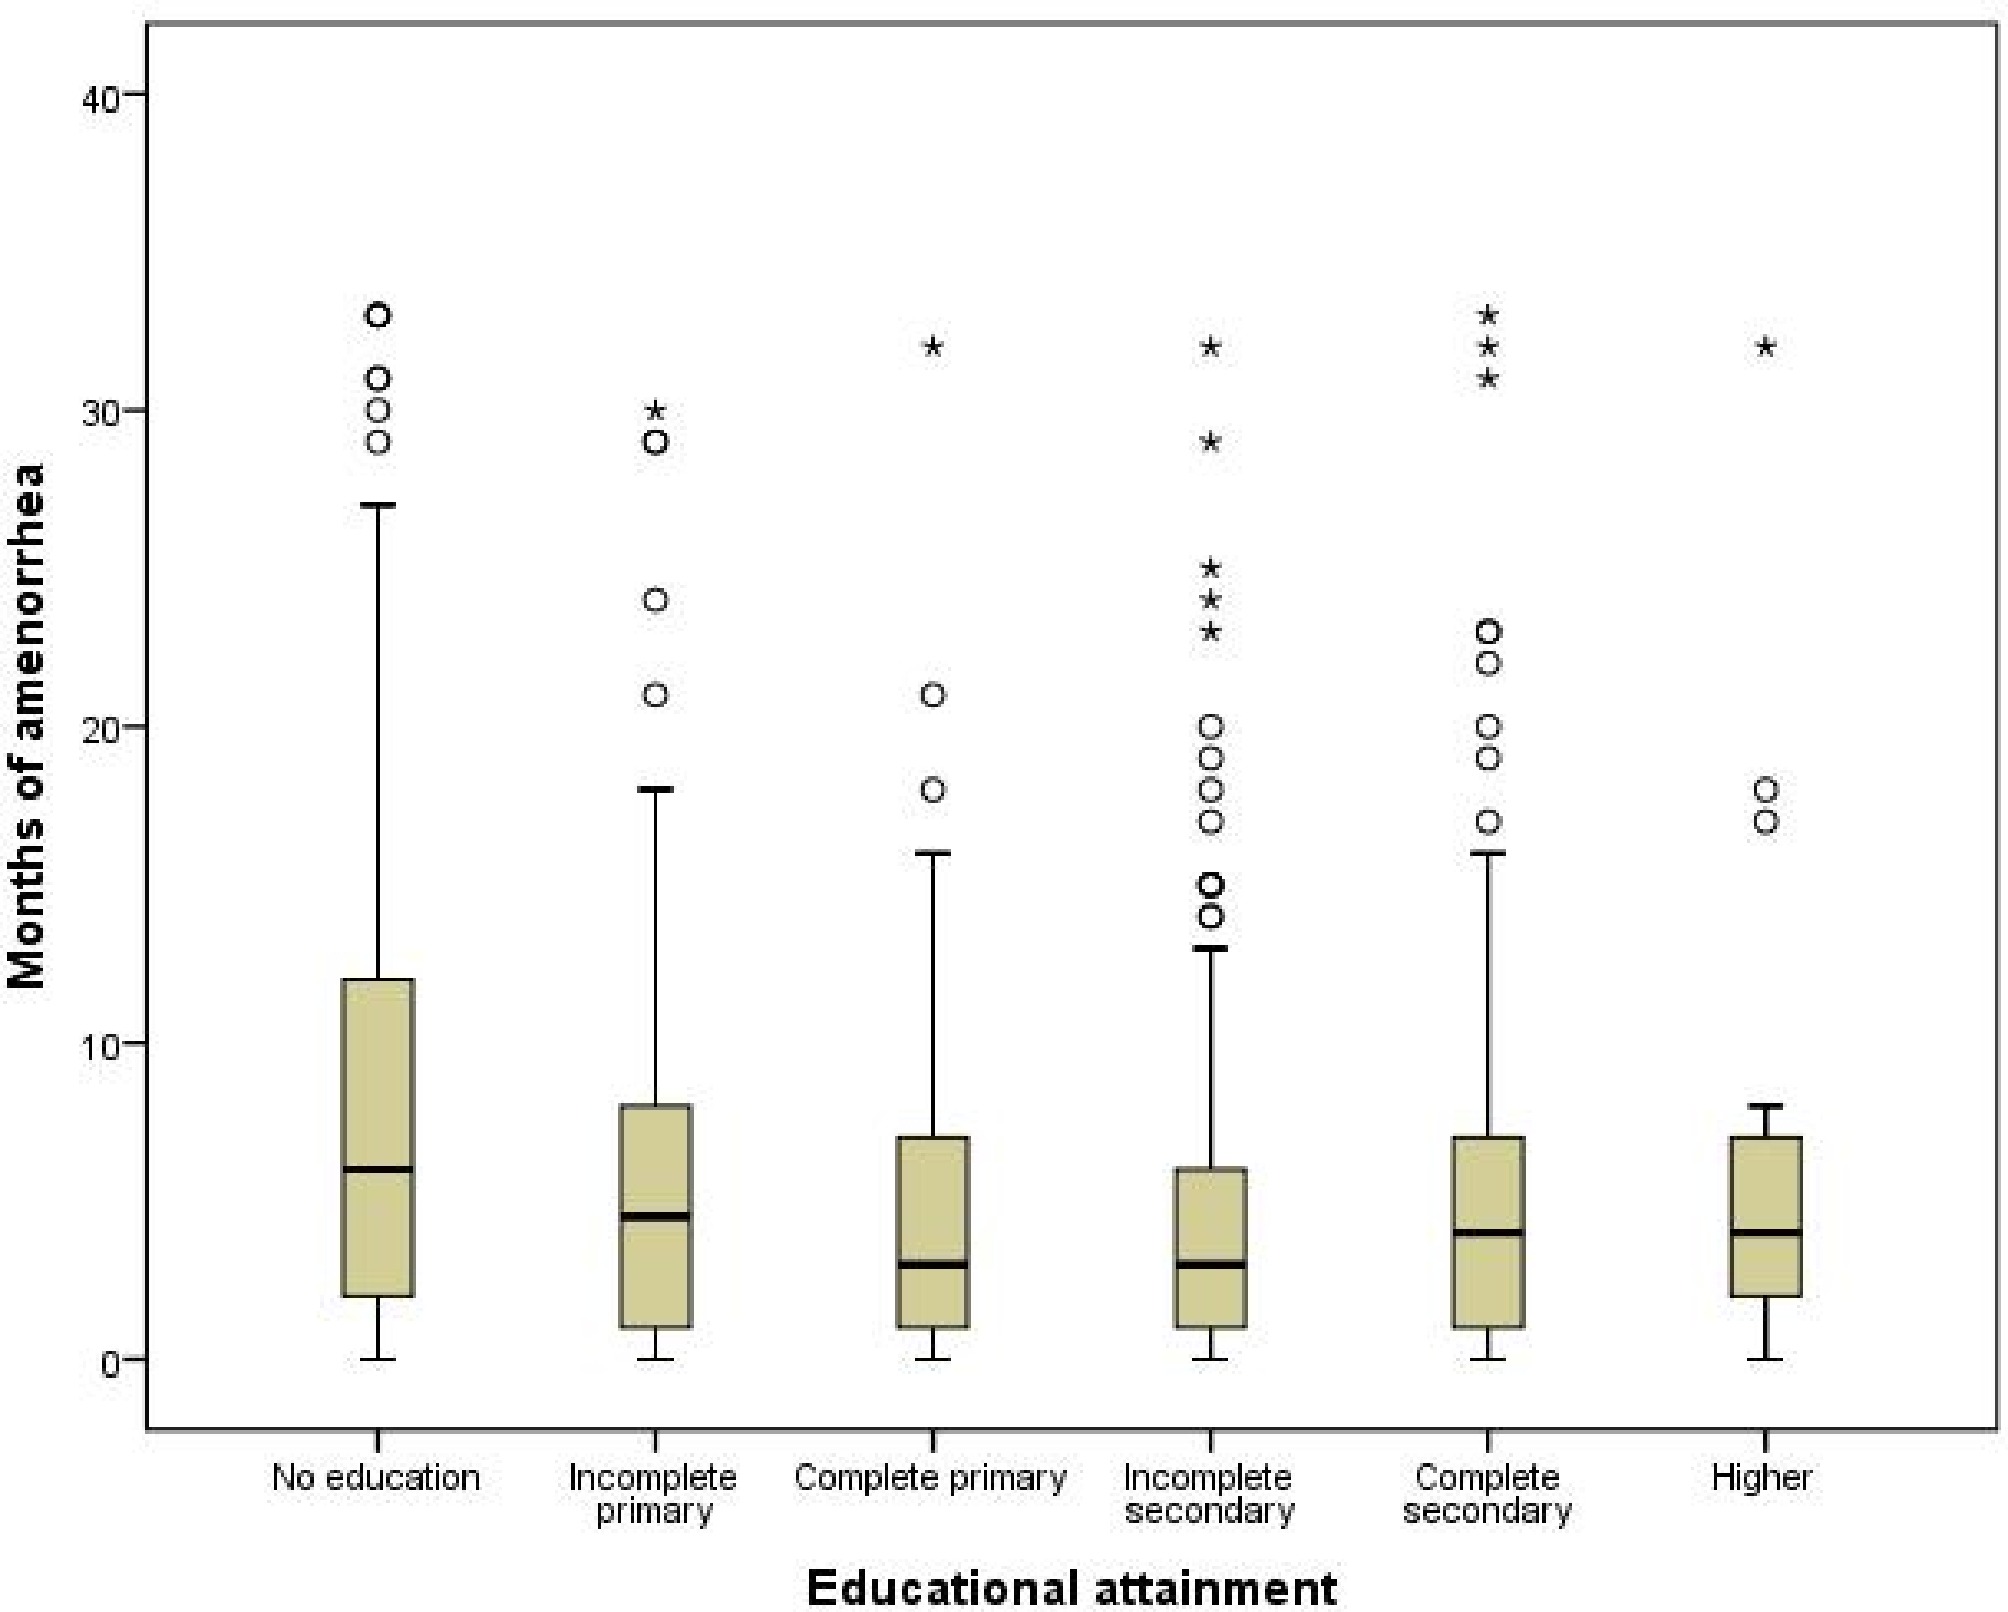
Figure 6.
Box and whisker plot of duration of PPA for different educational attainment groups of Nepalese mothers.
-
Duration of PPA Observed Expected number of women LLog SLLog Tr-LLog KuLLog RG-LLog 0−1 102 84.095 74.572106 99.611 99.391 93.792 1−3 175 184.719 190.463529 173.489 180.143 182.120 3−6 183 167.887 155.884902 179.800 176.676 174.085 6−9 101 88.191 79.859153 99.240 100.989 96.196 9−12 53 51.009 47.416113 53.422 58.688 55.688 12−15 31 32.226 31.142130 30.082 35.198 34.150 15−18 28 21.790 21.923420 17.997 21.841 22.055 18−21 11 15.518 16.226545 11.399 14.006 14.885 21−24 13 11.507 12.471816 7.585 9.261 10.424 24−27 6 8.812 9.871832 5.260 6.298 7.531 27−30 7 6.926 7.999844 3.776 4.394 5.587 30−33 11 5.562 6.608797 2.791 3.138 4.240 α 1.370 1.072 2.049 0.568 1.210 β 4.386 2.006 7.723 42.028 8.777 γ 0.000 0.000 − 0.000 0.000 θ − − 0.478 10.632 1.000 λ − − 1.071 − − χ2 17.161 30.266 12.474 21.698 12.252 R2 0.980 0.950 0.993 0.995 0.995 NLL −49.889 −49.649 −48.060 −52.046 −47.040 AIC 105.778 105.298 104.121 112.093 102.081 BIC 107.233 106.753 106.060 114.032 104.021 The values of the Chi-square test statistic, AIC, and BIC for the RGLLog distribution are found to be minimum, while the values of R2 and NLL are found to be maximum. These results are presented in boldface. Table 1.
Observed and expected number of mothers for duration of PPA by different distributions.
Figures
(6)
Tables
(1)