-
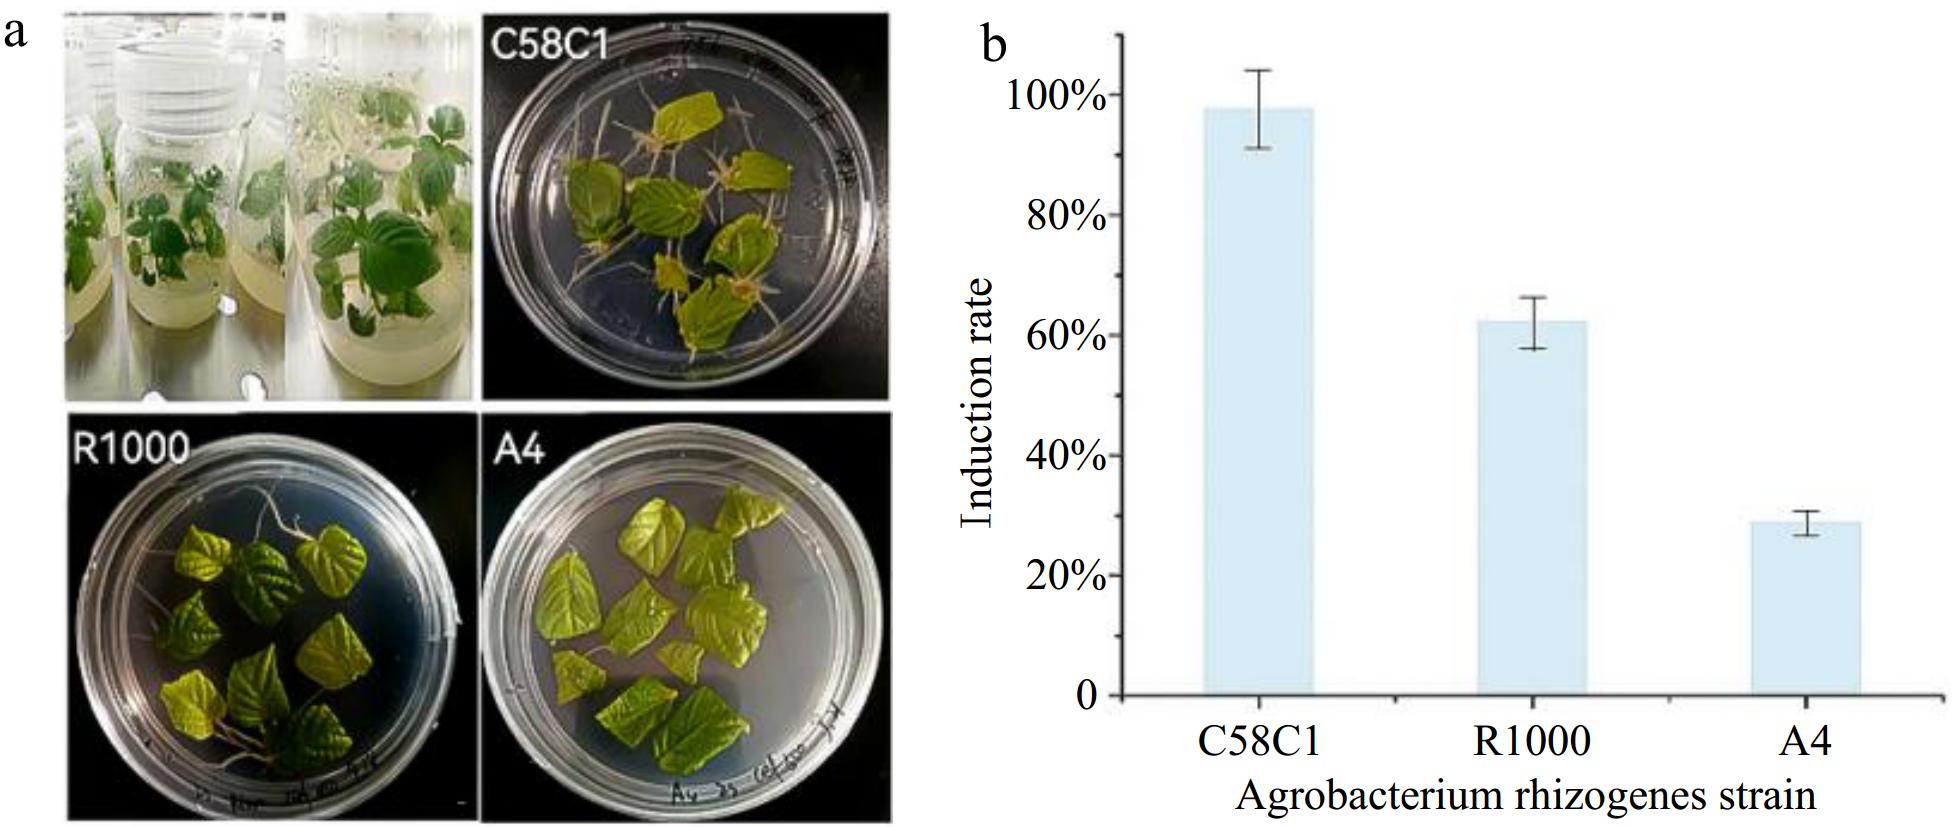
Figure 1.
Leaves of P. frutescens infected by different strains and the induction rate of hairy roots in P. frutescens. (a) Differences in the number of hairy roots on leaves of aseptic seedling cultures of P. frutescens and those infested with different strains of the fungus. (b) Induction of hairy roots in leaves infested with different strains of bacteria.
-
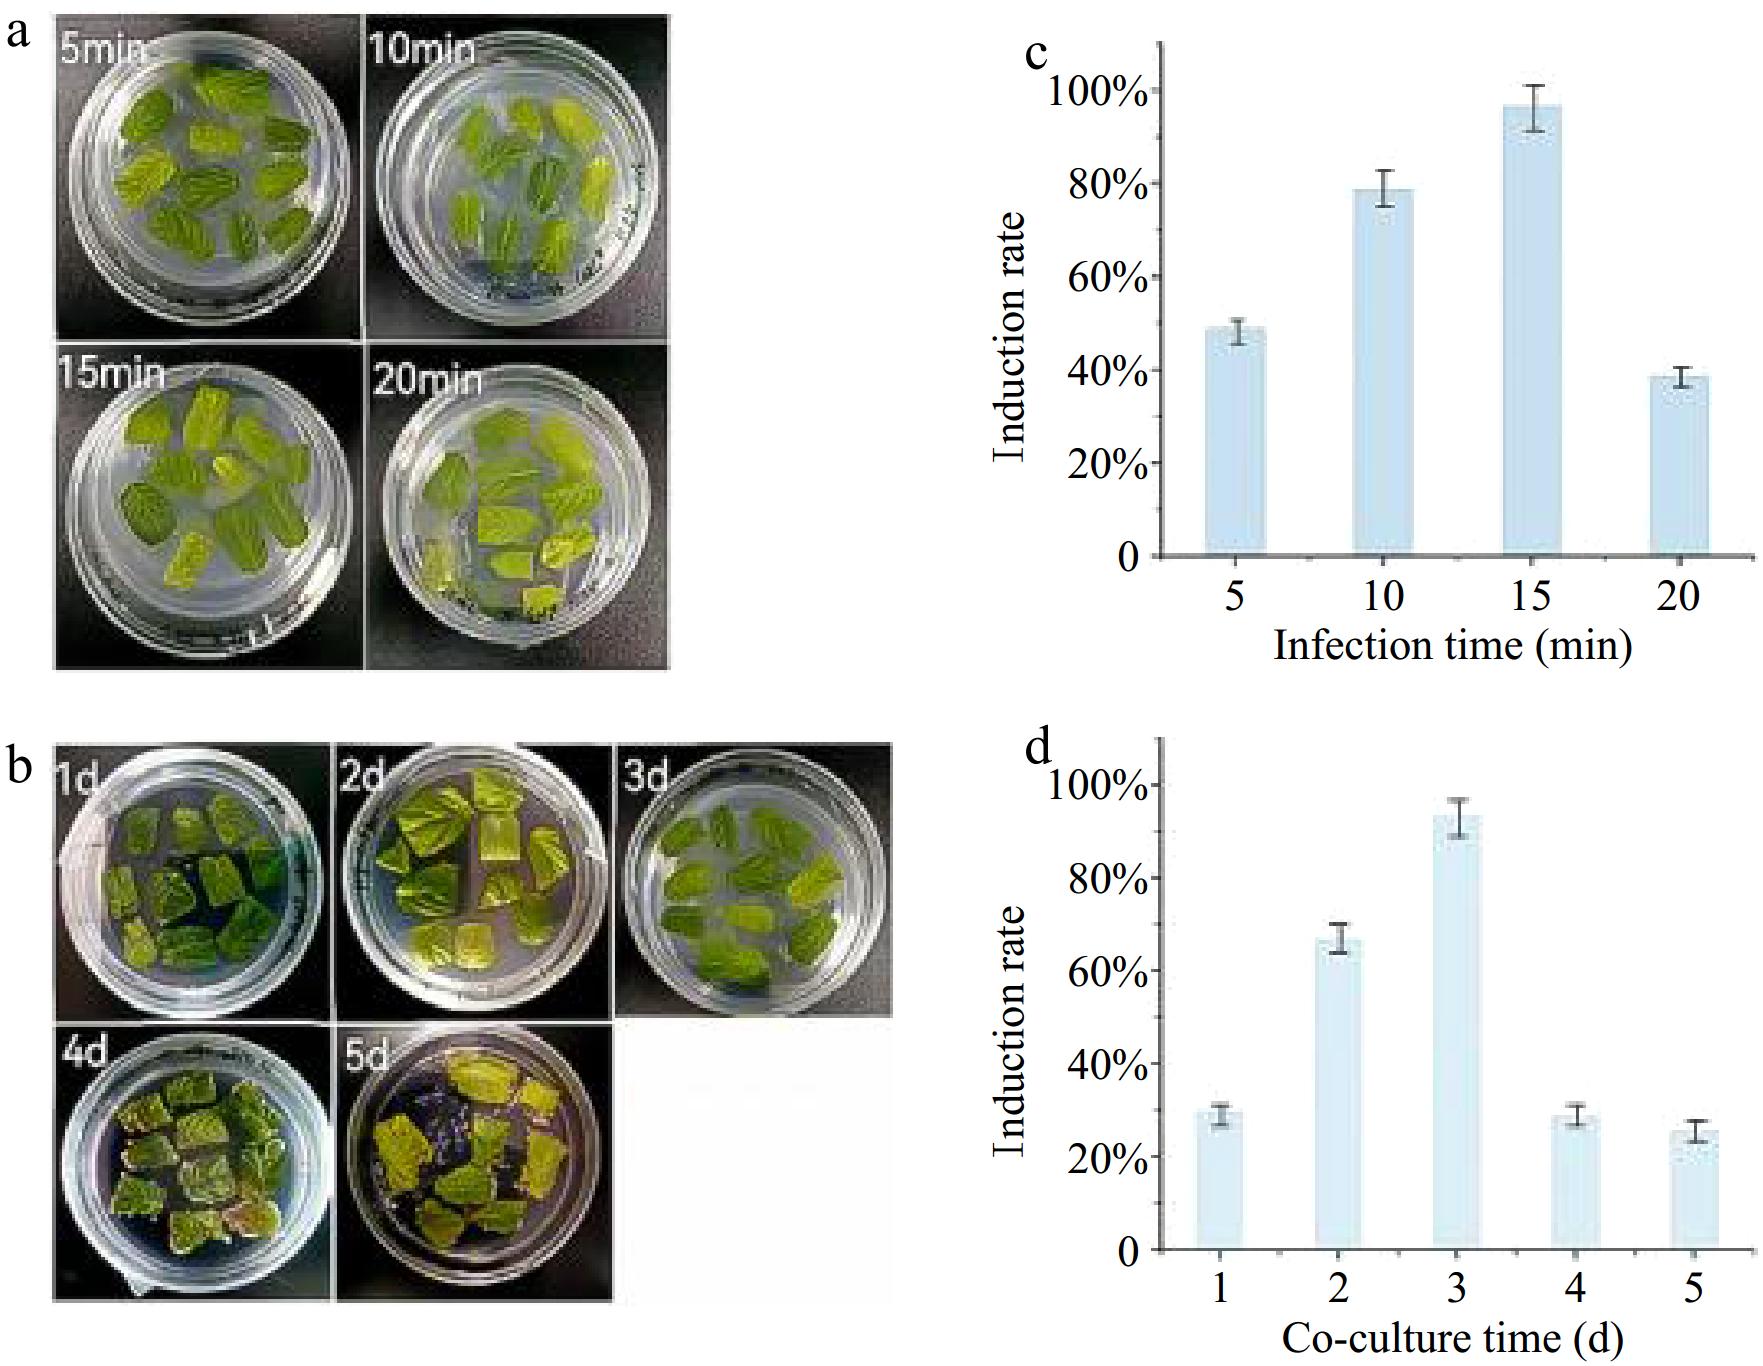
Figure 2.
Changes in leaves of P. frutescens at different time of infection and days of co-culture. (a) Changes in leaves at different infection times. (b) Changes in leaves at different co-culture times. (c) Effects of different infection times on trichome root induction rate. (d) Effects of co-culture times on trichome root induction rate.
-
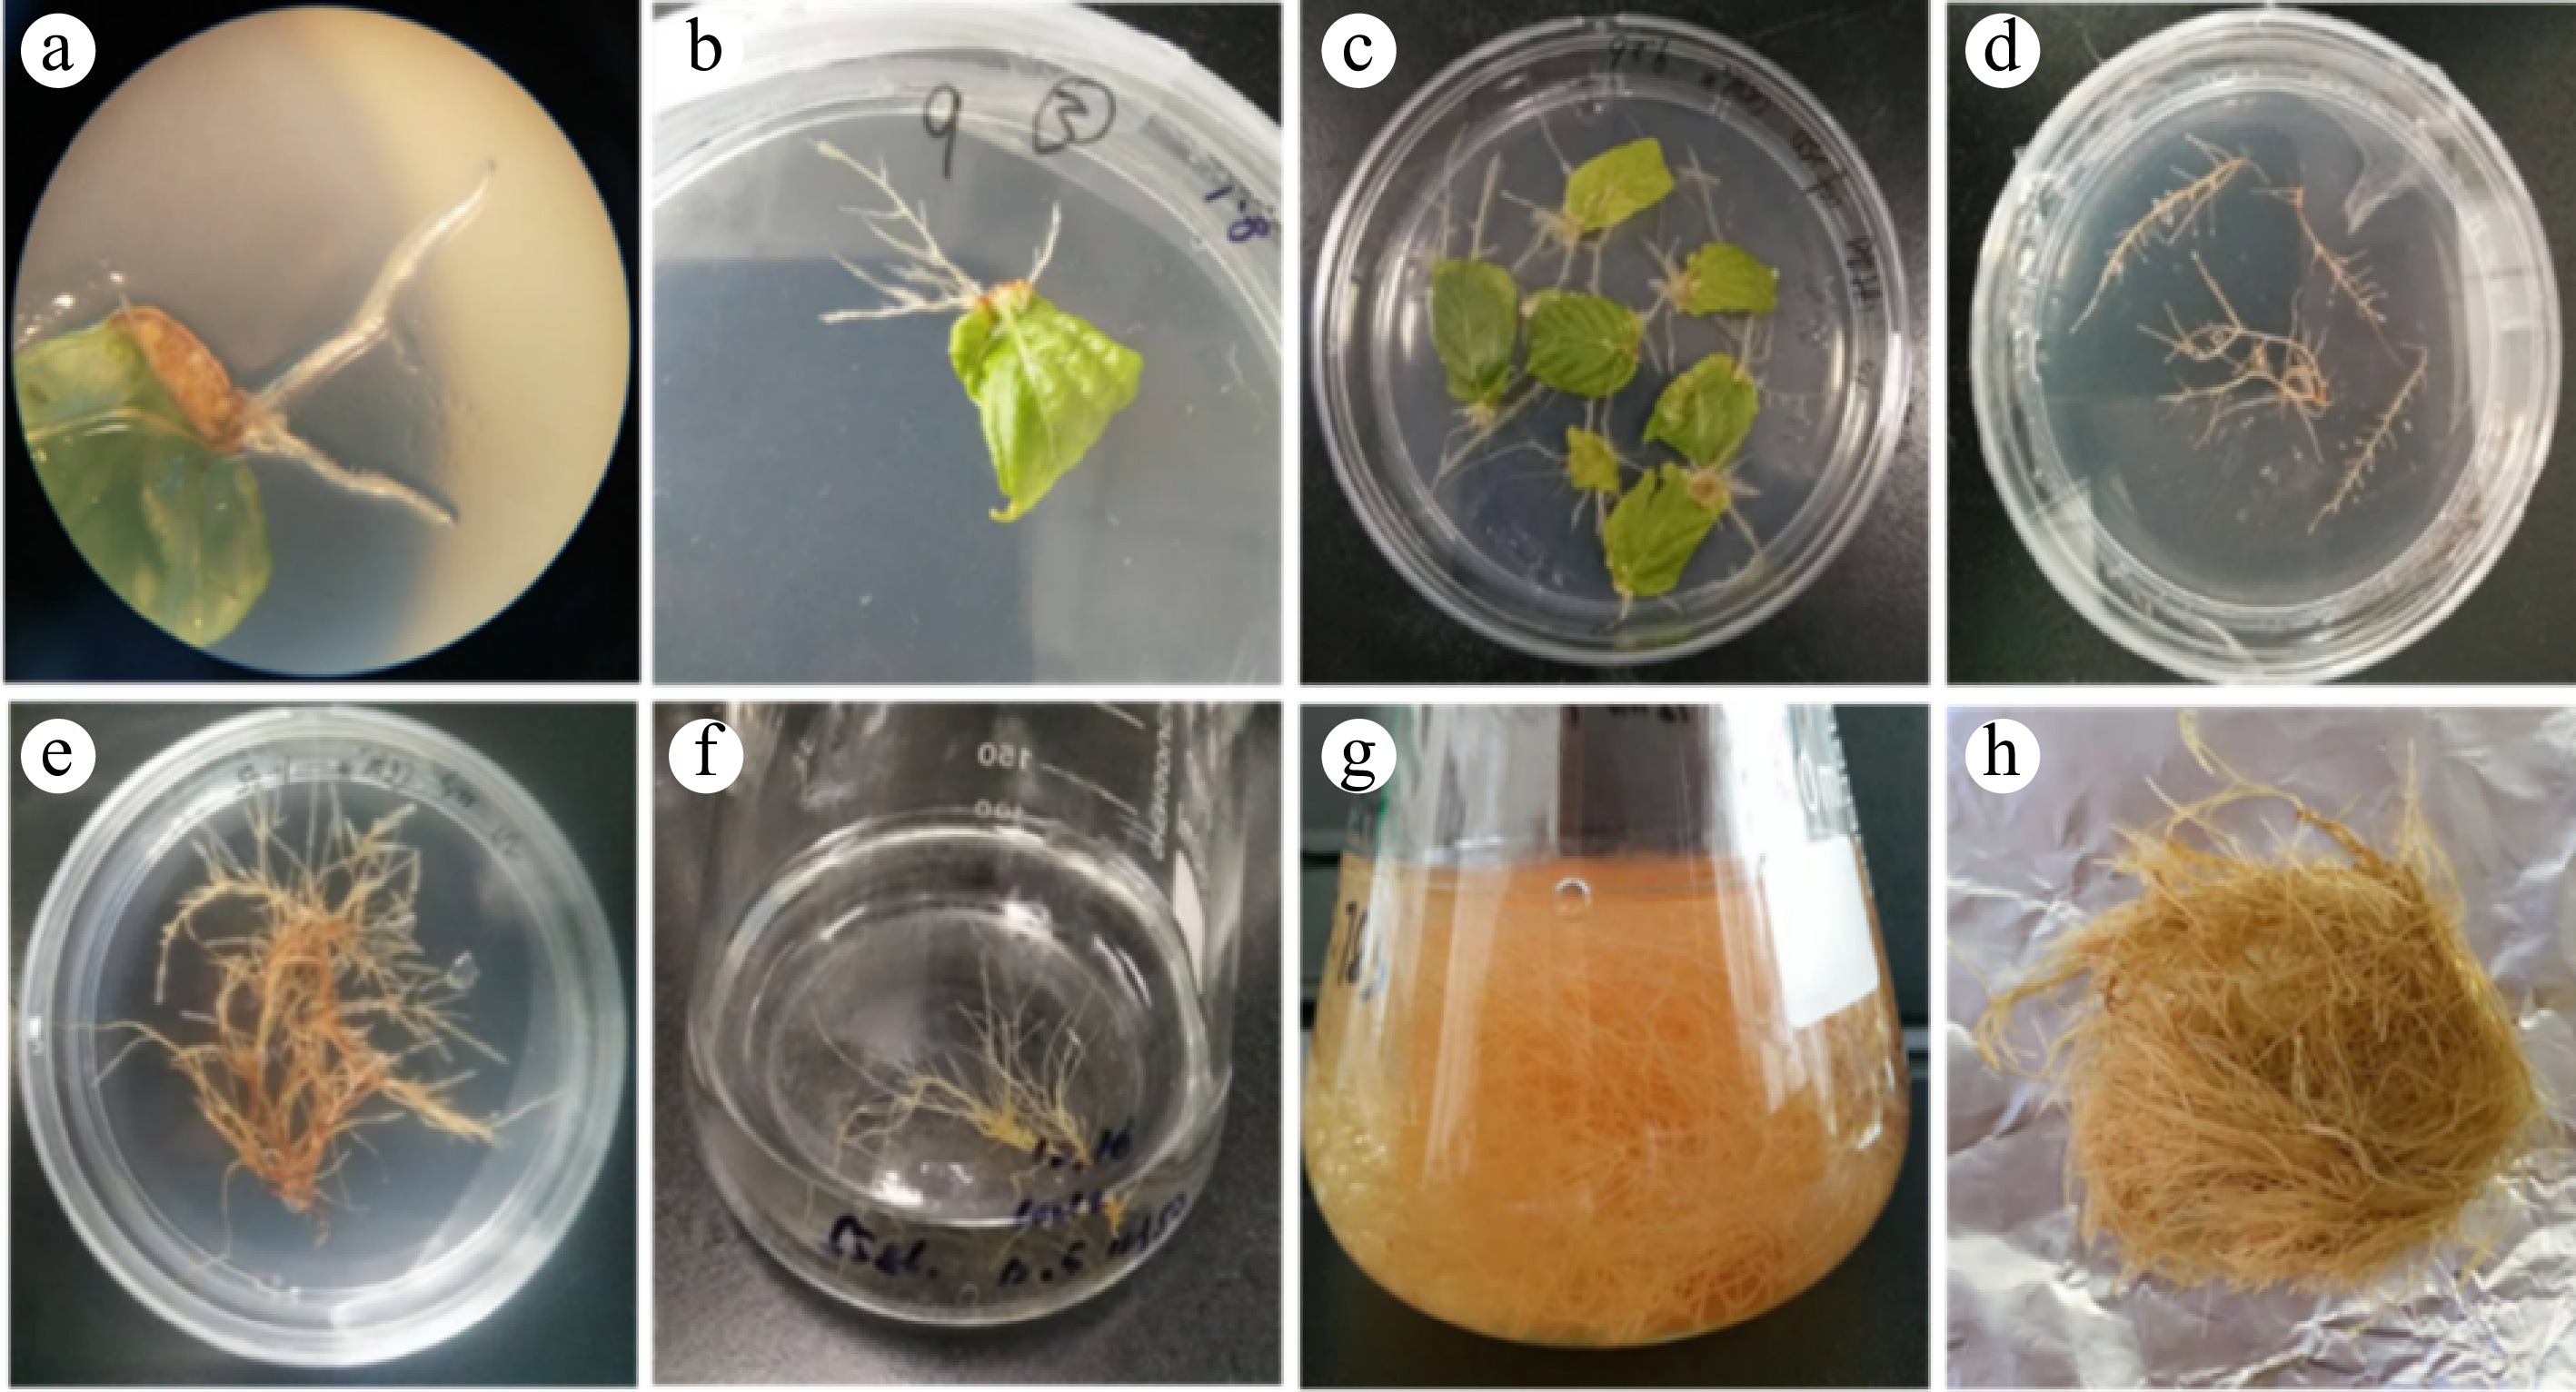
Figure 3.
Hairy root induction and culture stages of P. frutescens. (a) internode; (b) hairy root induction; (c) hairy roots growth two weeks after induction; (d) hairy roots growth three weeks reached 5 cm; (e) hairy roots growth six weeks reached 0.5 g; (f) hairy roots transferred from solid to liquid medium; (g) hairy roots growth eight weeks in the liquid medium; (h) hairy roots before drying.
-
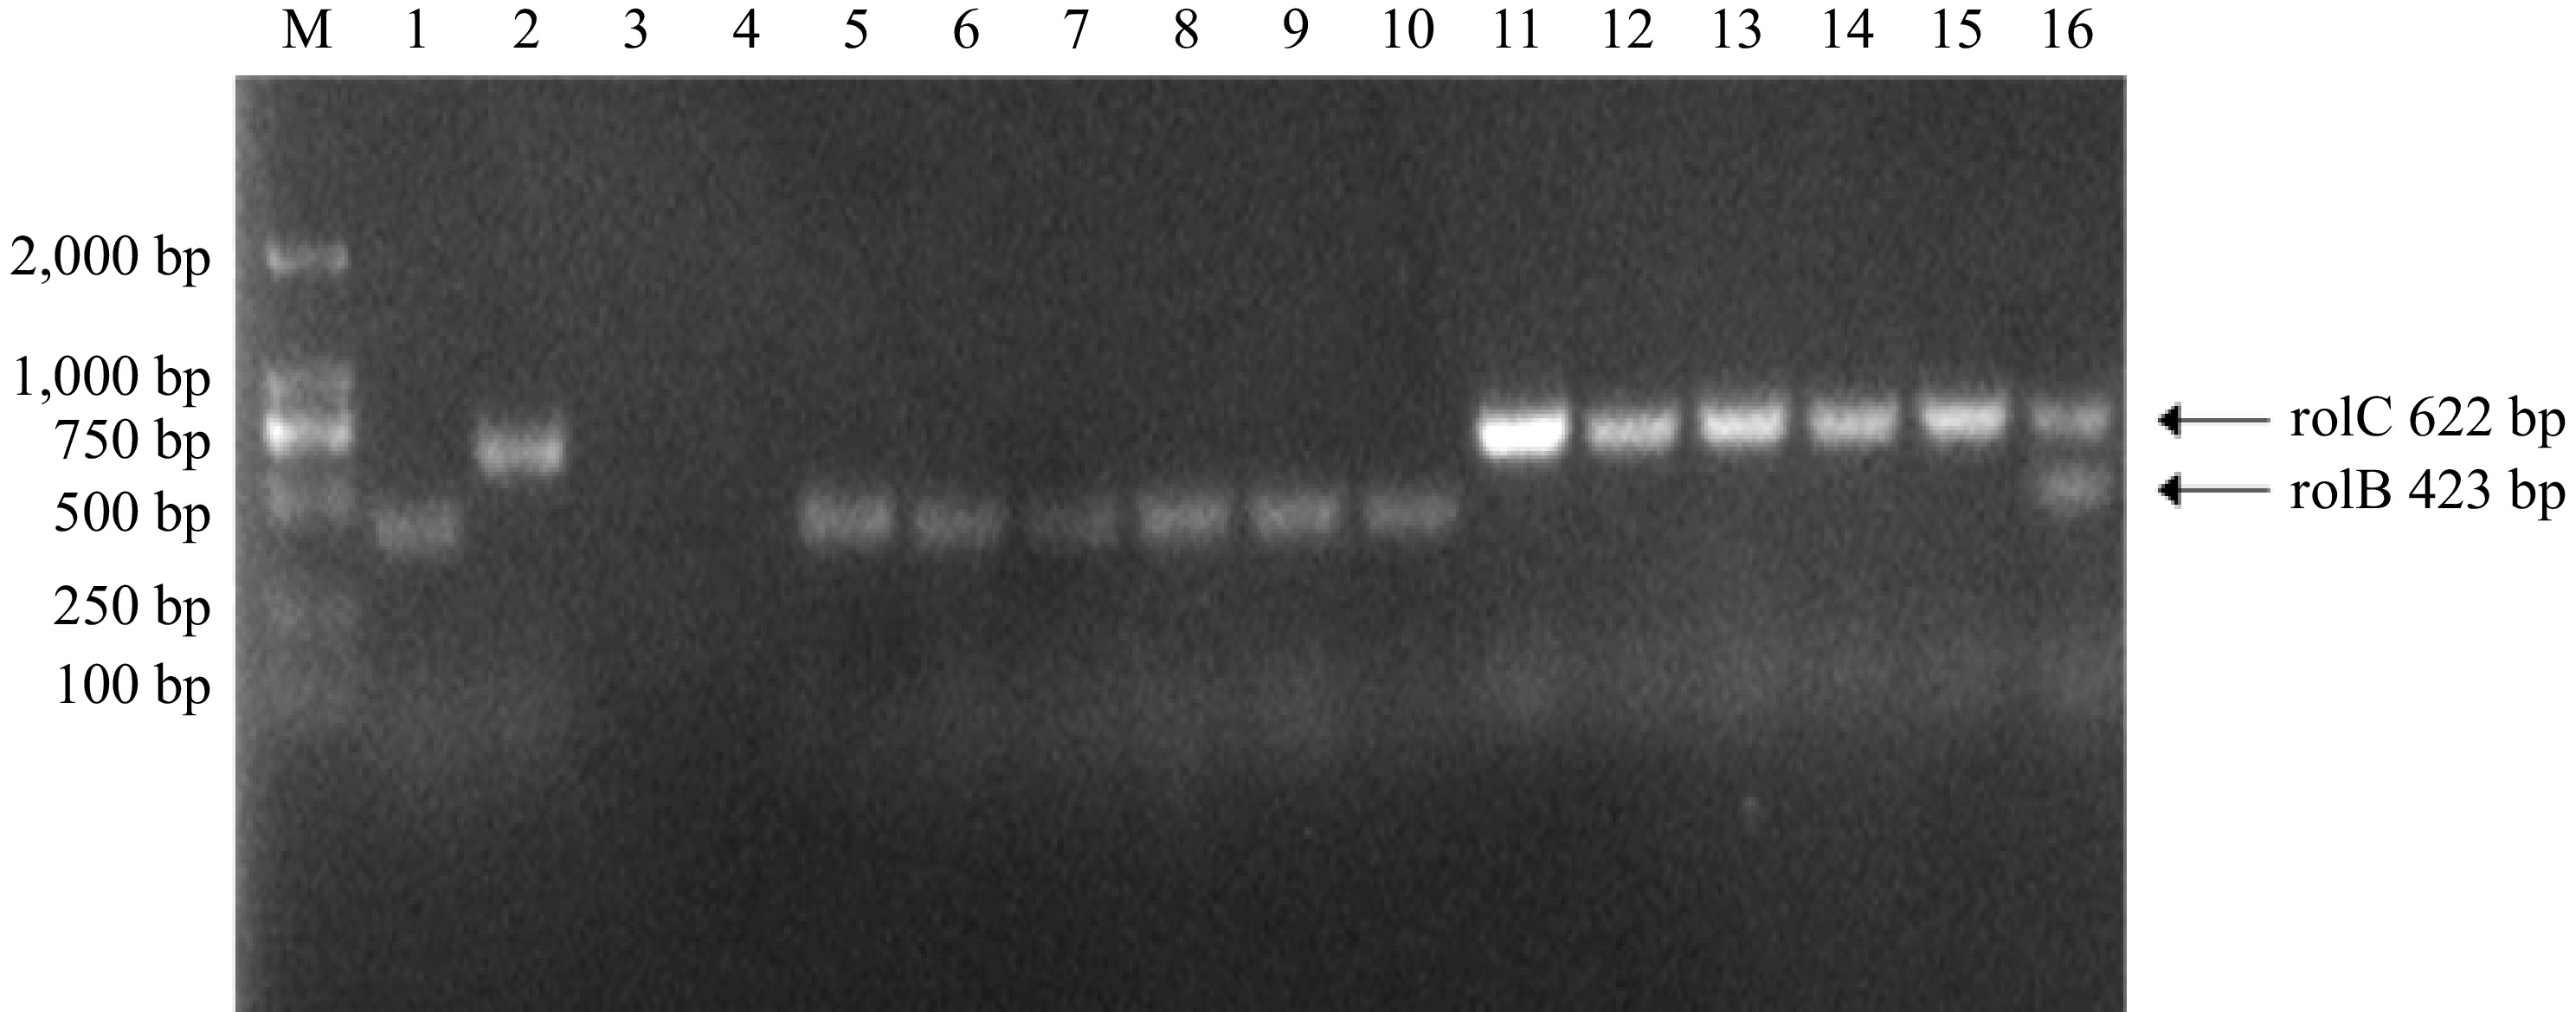
Figure 4.
PCR identification of hairy roots, M is the DL2000bp marker; lanes 1 and 2 are a positive control: C58C1 plasmid DNA; lanes 3 and 4 are the negative control: P. frutescens sterile seedling root DNA; lanes 5–16 are hairy root DNA; (lanes 5–10 are the rolB gene, and lanes 11–16 are the rolC gene).
-
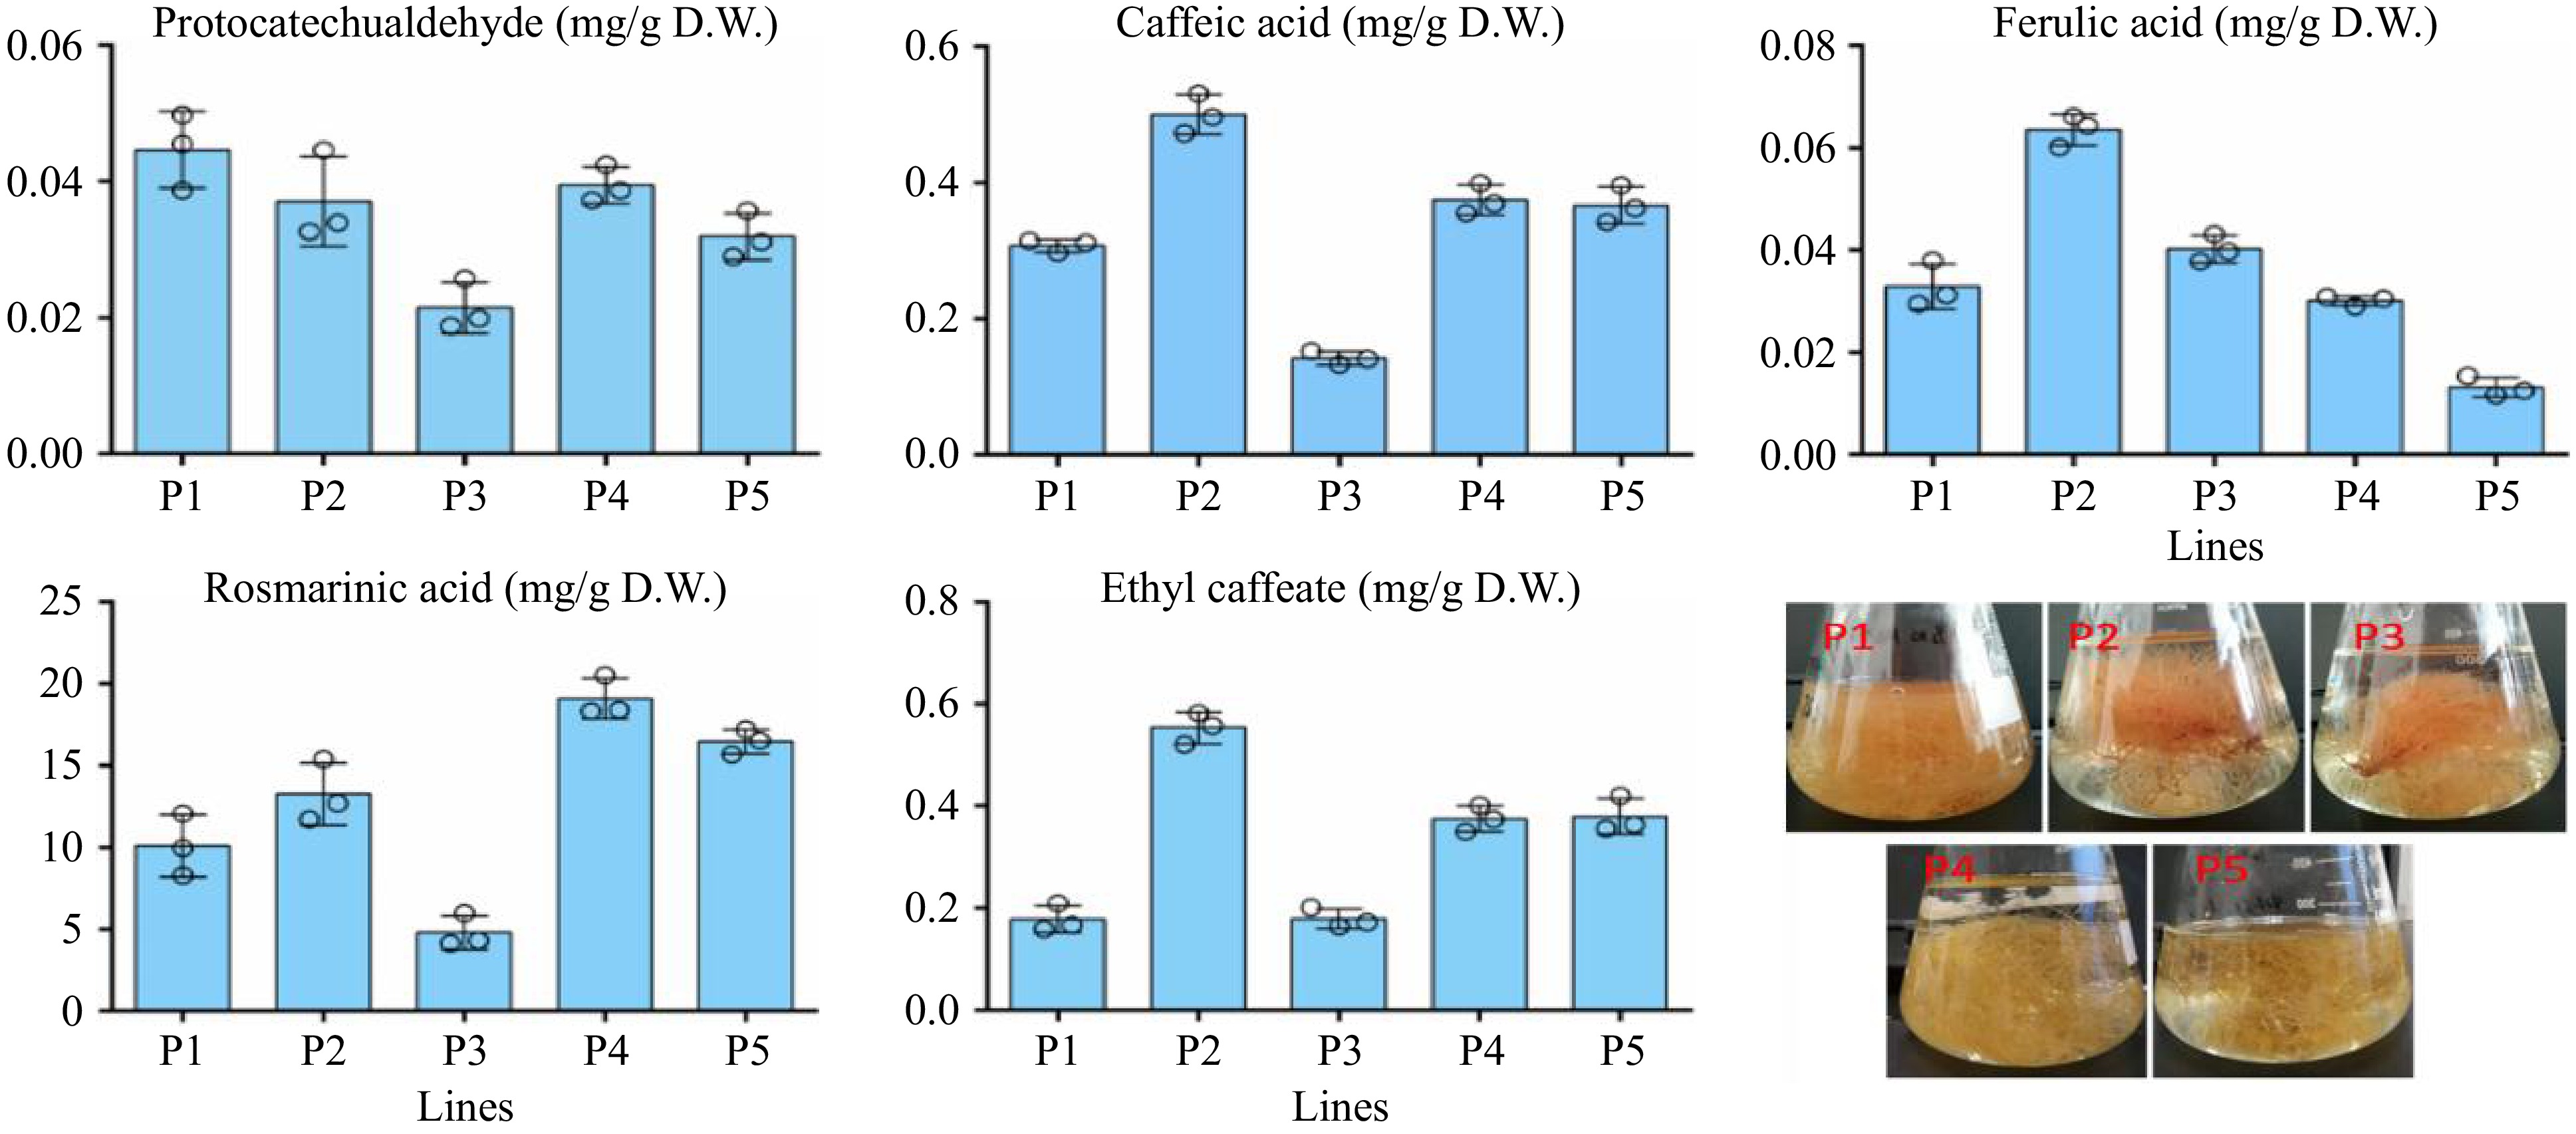
Figure 5.
The content of phenolic acids in the hairy root lines.
-
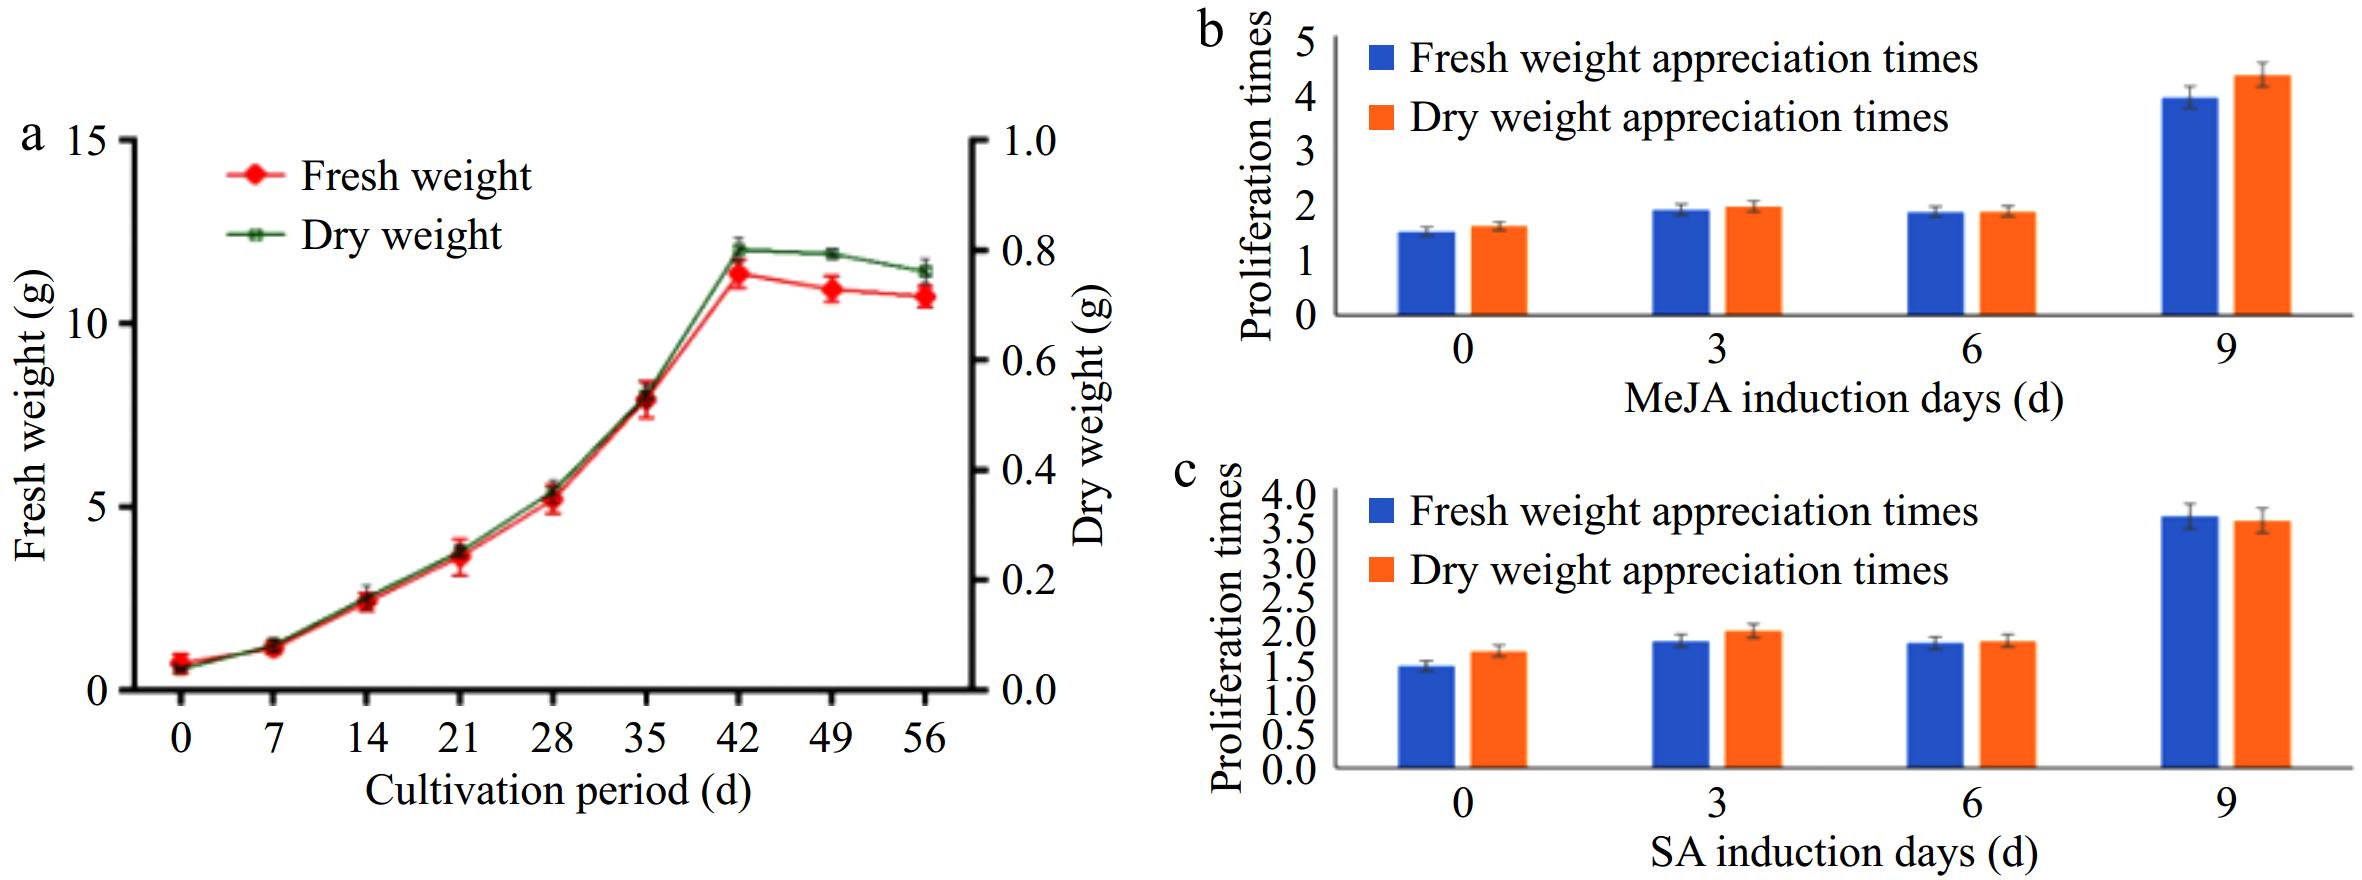
Figure 6.
Growth biomass and changes in weight after treatment.
-
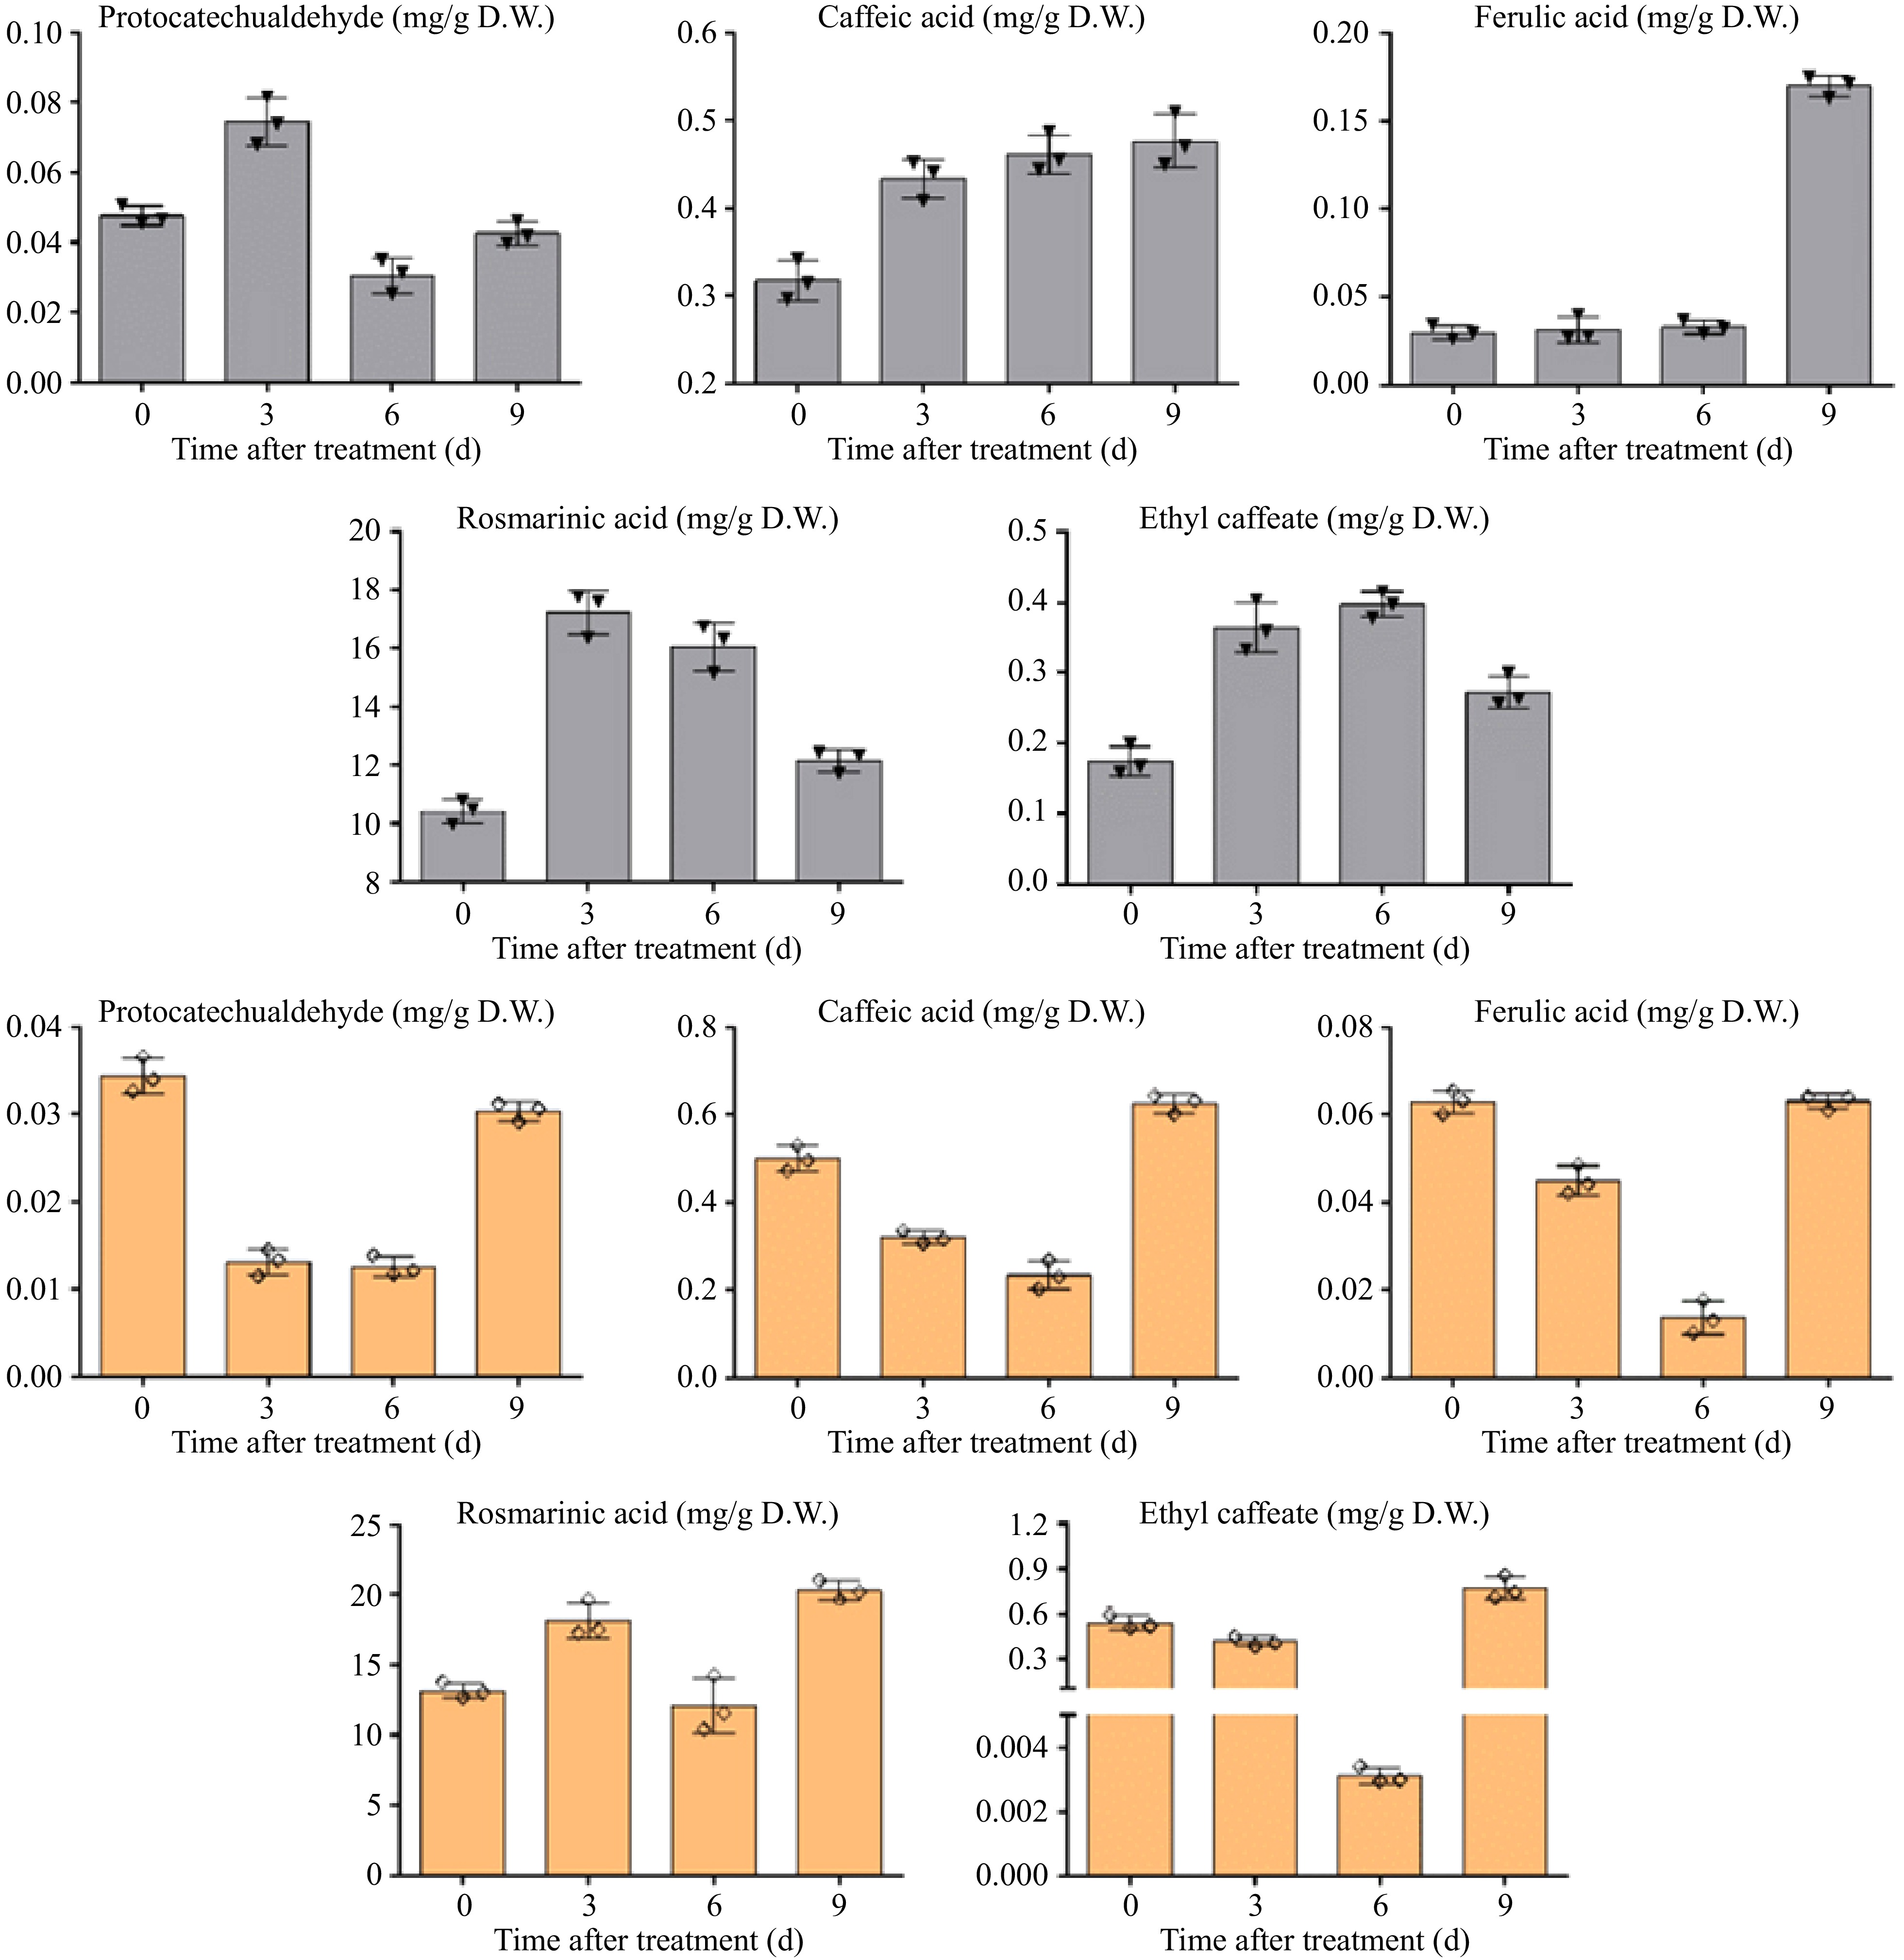
Figure 7.
Effects of MeJA on the accumulation of phenolic acids in P. frutescens hairy root and effects of SA on the accumulation of phenolic acids in Perilla hairy root.
-
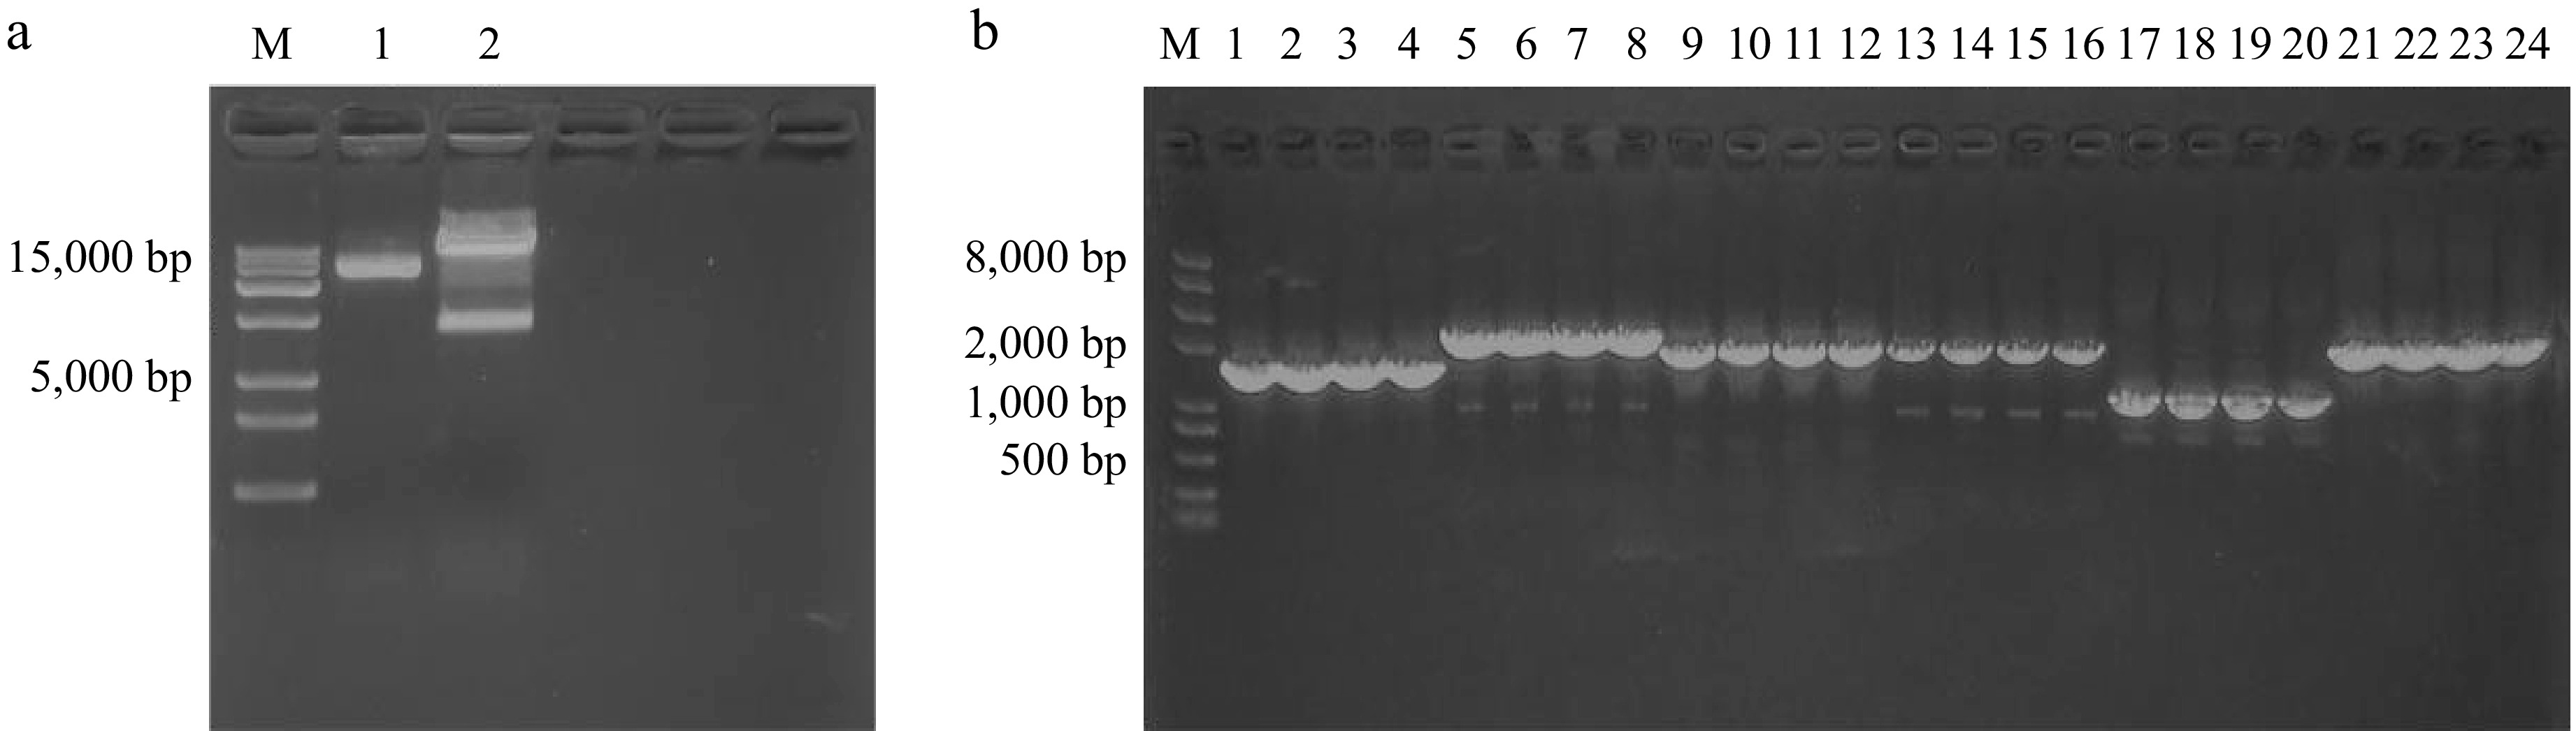
Figure 8.
Restriction digestion and bacterial identification electrophoresis gel of pCAMBIA1304. (a) Lanes 1 and 2 represent the 1,304 plasmid and the 1304 restriction enzyme digestion products, respectively. (b) Lanes 1–4 show the bacterial identification results for PfbHLH88; Lanes 5–8 show the bacterial identification results for PfbHLH13; Lanes 9–12 show the bacterial identification results for PfbHLH46; Lanes 13–16 show the bacterial identification results for PfbHLH66; Lanes 17–20 show the bacterial identification results for PfbHLH45; Lanes 21–24 show the bacterial identification results for PfbHLH5.
-
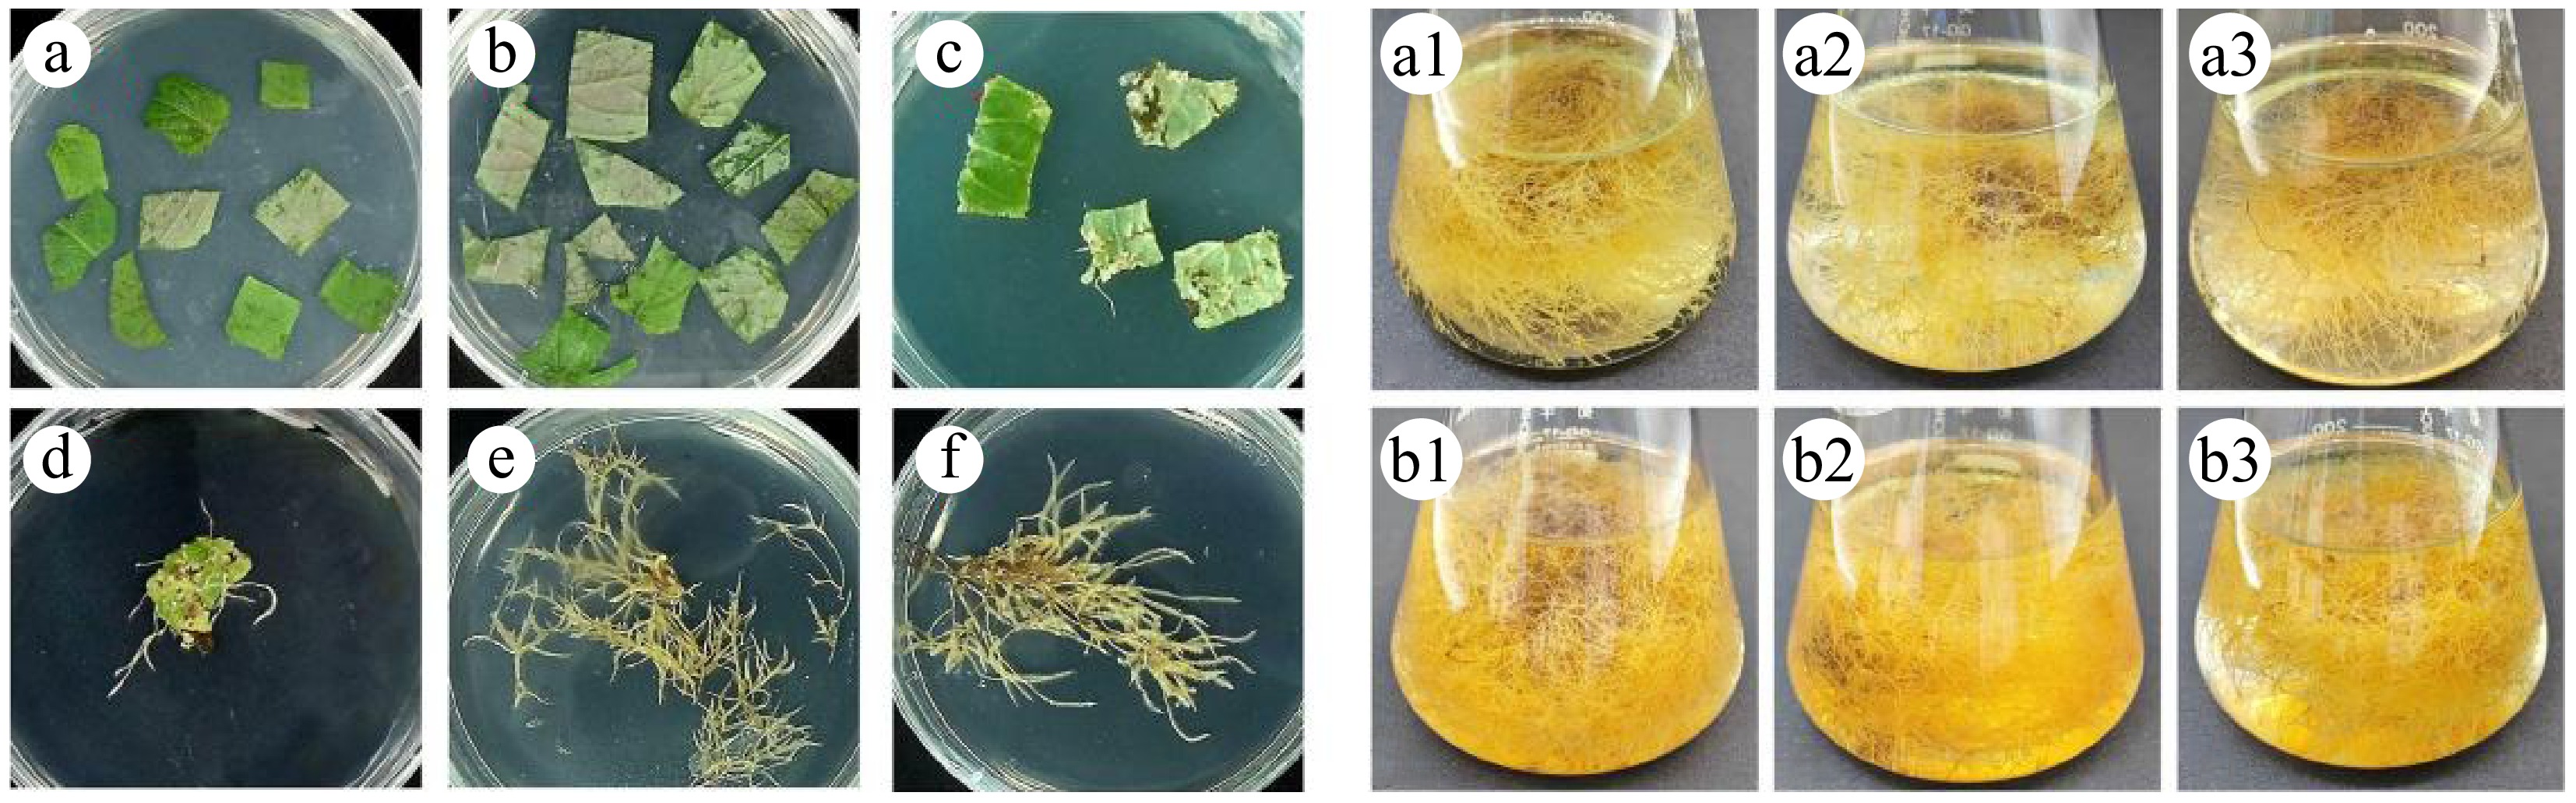
Figure 9.
Growth status of transgenic hairy roots. (a), (b) Perilla leaves during co-cultivation. (c), (d) Perilla leaves at the end of co-cultivation. (e), (f) Transgenic hairy roots. (a1)–(a3) Three PfbHLH13-3/5/9 transgenic hairy root lines. (b1)–(b3) Three PfbHLH66-2/4/8 transgenic hairy root lines.
-
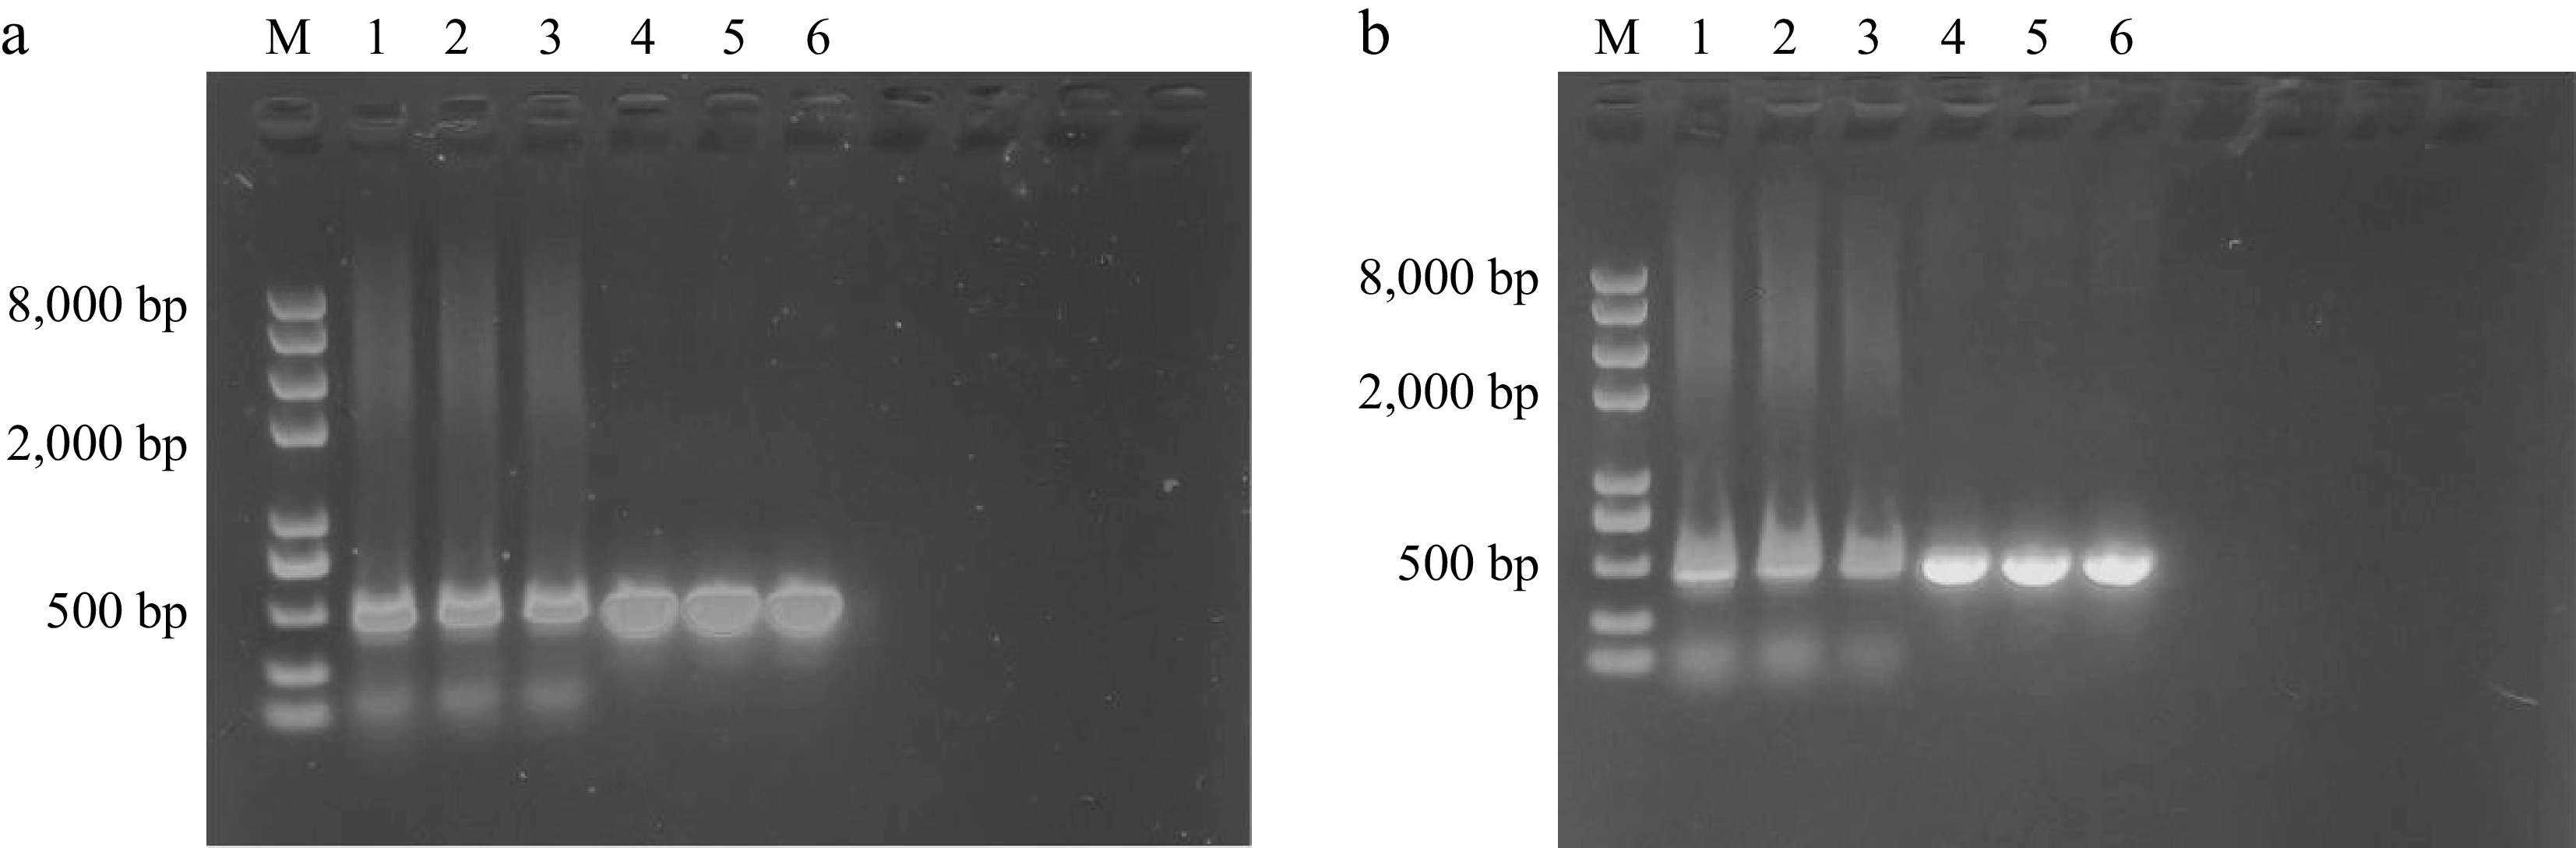
Figure 10.
PCR identification of transgenic hairy roots. (a) Lanes 1-3 show the PCR results of the rolB gene (405 bp) for three PfbHLH13-3/5/9 transgenic lines; lanes 4–6 show the PCR results of the Hyg gene (535 bp) for the same transgenic lines. (b) Lanes 1–3 show the PCR results of the rolB gene for three PfbHLH66-2/4/8 transgenic lines; lanes 4–6 show the PCR results of the Hyg gene for the same transgenic lines.
-
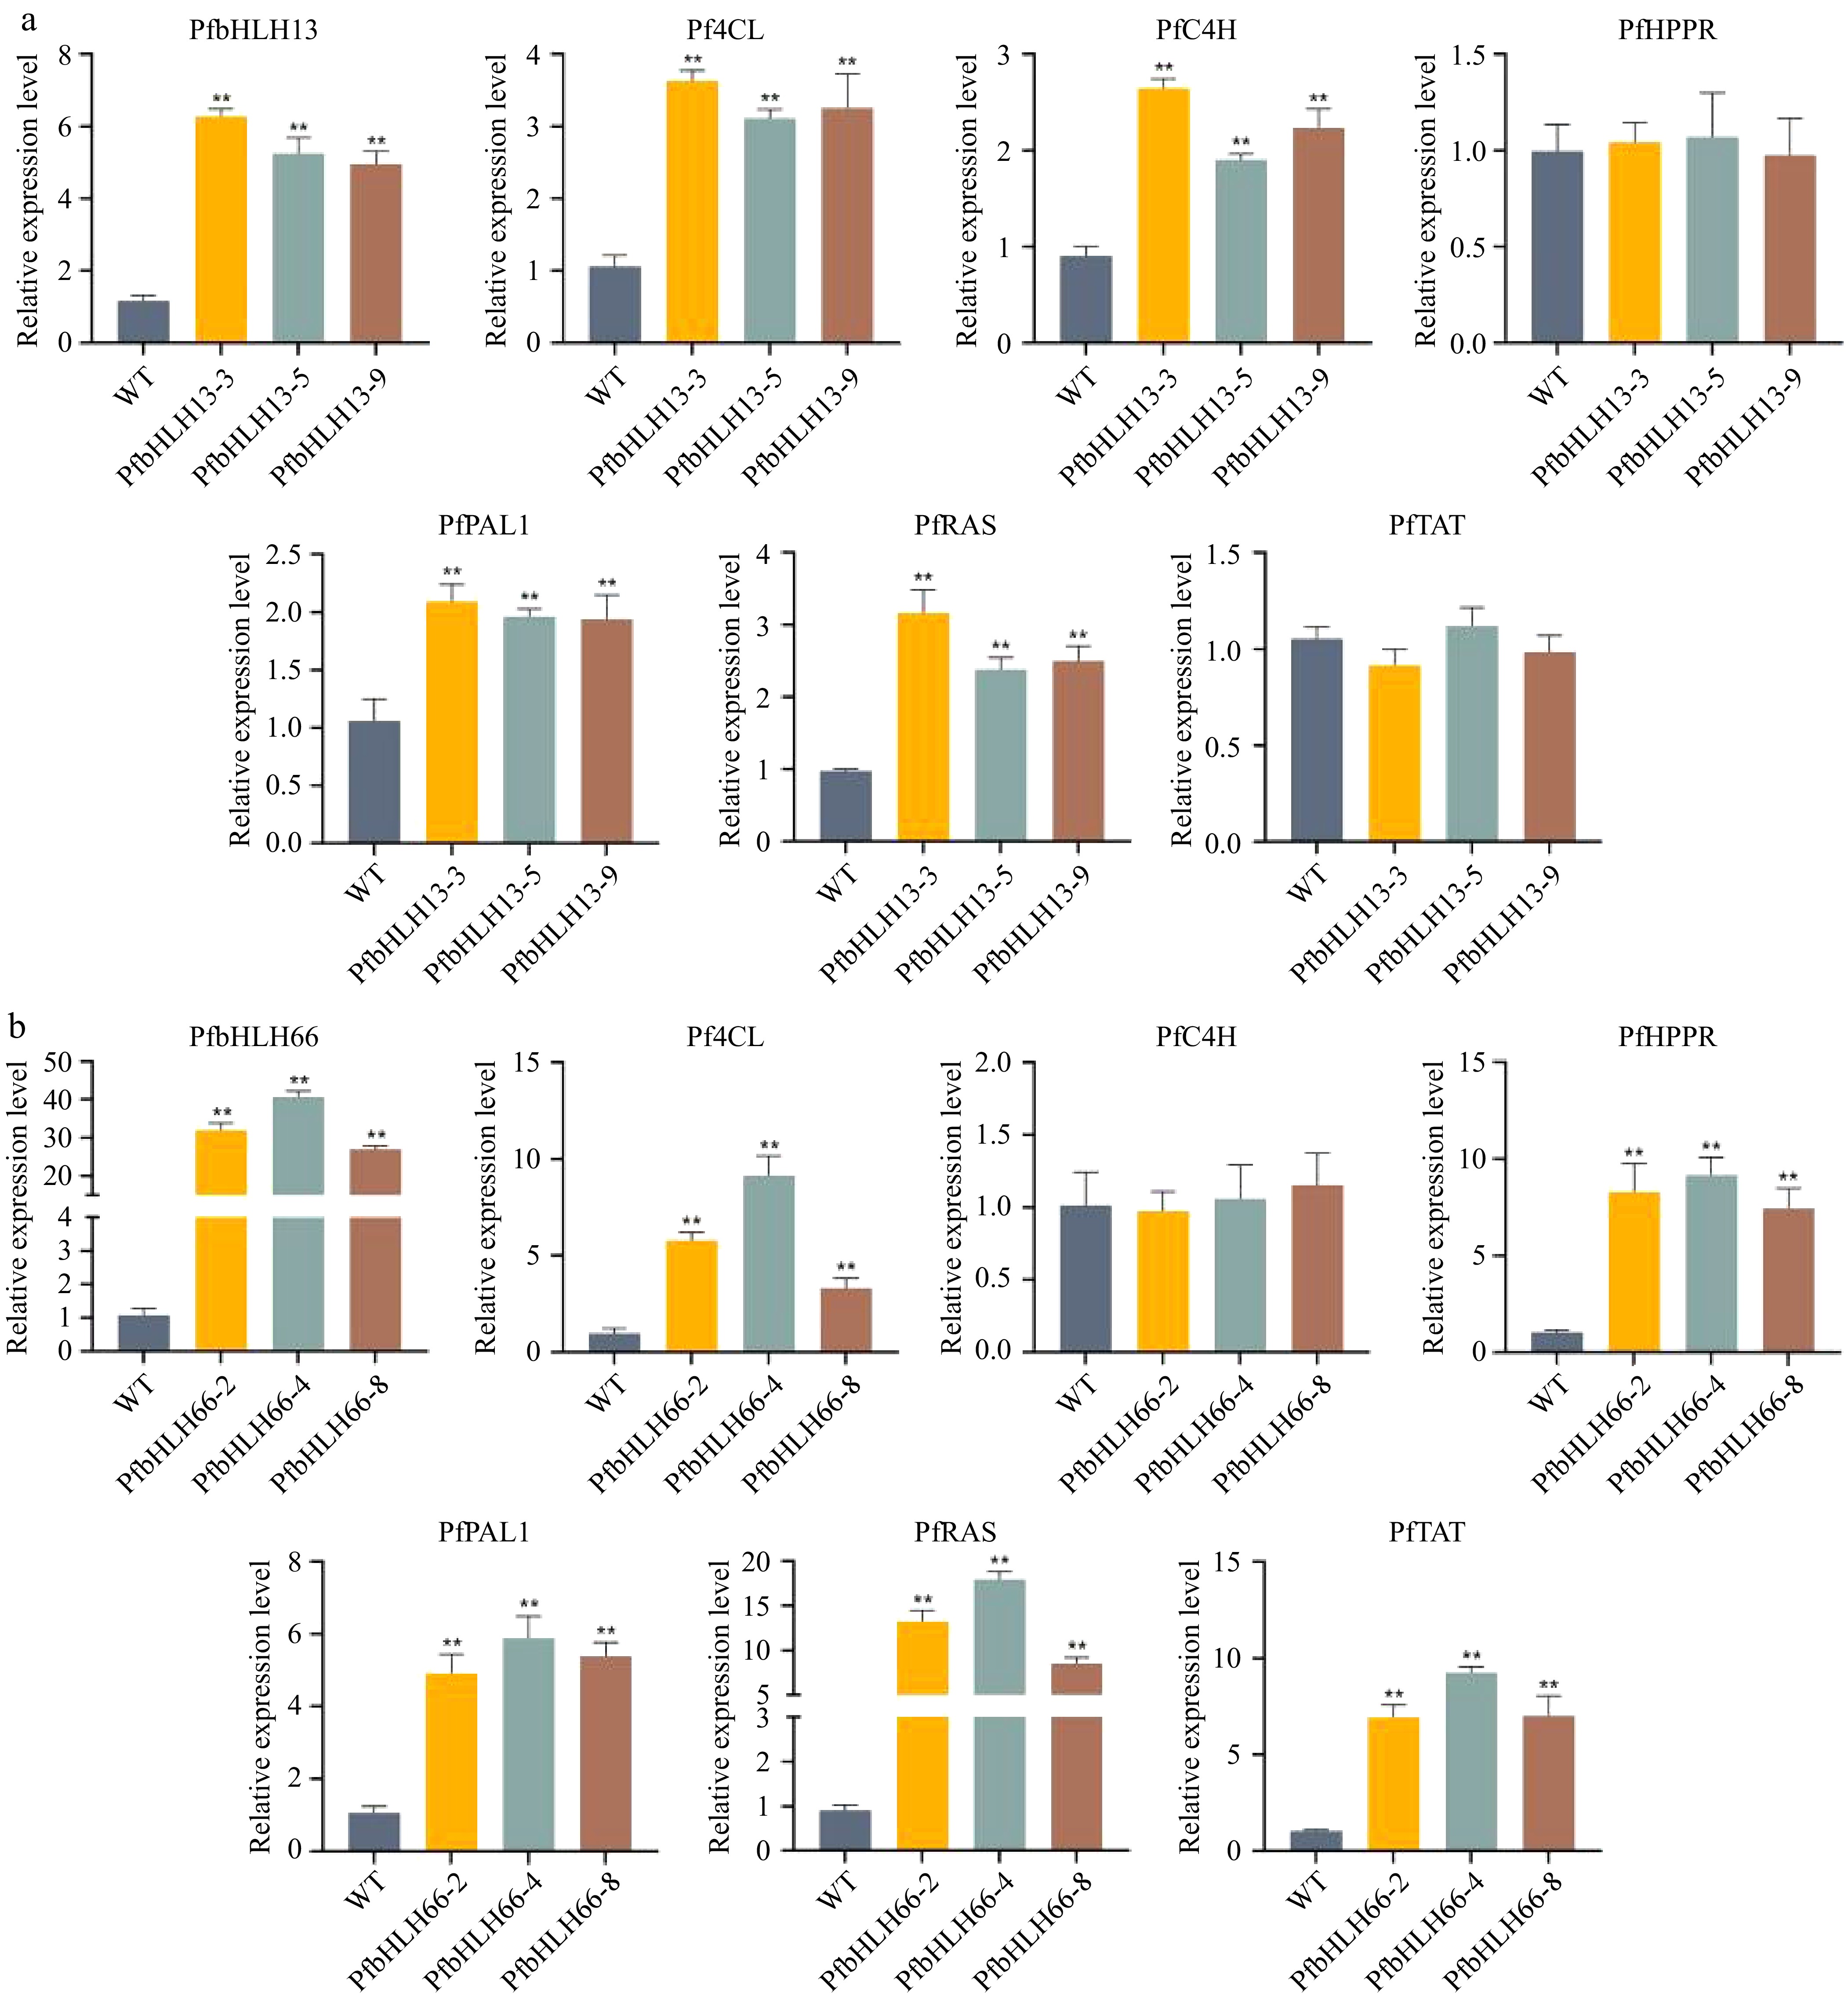
Figure 11.
Gene expression analysis in transgenic hairy roots. (a) Gene expression analysis in three PfbHLH13-3/5/9 transgenic hairy root lines and WT. (b) Gene expression analysis in three PfbHLH66-2/4/8 transgenic hairy root lines and WT. * p < 0.5, ** p < 0.01.
-
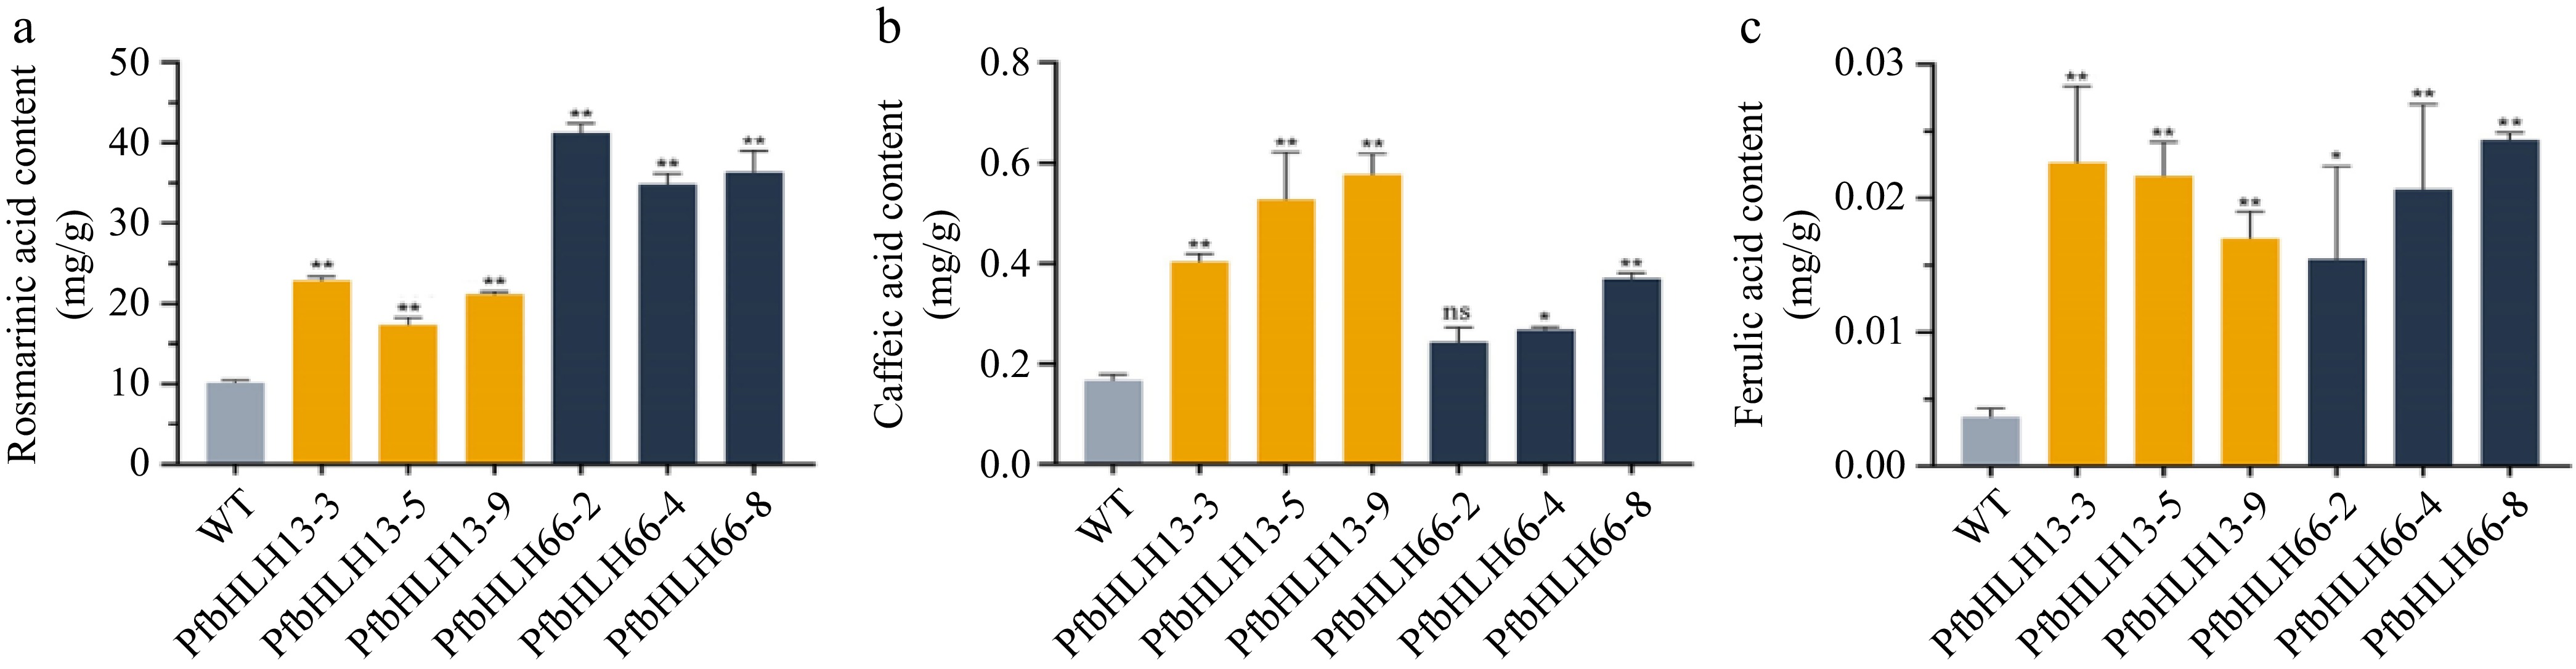
Figure 12.
Quantification of three phenolic acid components in transgenic hairy roots. (a) Rosmarinic acid content in WT and two transgenic systems. (b) Caffeic acid content in WT and two transgenic systems. (c) Ferulic acid content in WT and two transgenic systems. WT: Wild-type; PfbHLH13-3/5/9, PfbHLH66-2/4/8 represent the three transgenic lines of PfbHLH13 and PfbHLH66, respectively; ns, no significance; *, p < 0.05; **, p < 0.01.
-
Chemical compound Regression equation Linear range (peak area) Regression coefficient Rosmarinic acid y = –4.02E-4 + 3.29E-11x 1.35186E7 ~ 3.64516E9 0.9999 Caffeic acid y = –4.52E-05 + 2.15E-11x 3986496 ~ 1.7685E8 0.9951 Ferulic acid y = –3.07E-06 + 2.07E-11x 354779 ~ 1.03305E7 0.9995 Table 1.
Linear relationship of phenolic acid compounds.
Figures
(12)
Tables
(1)