-
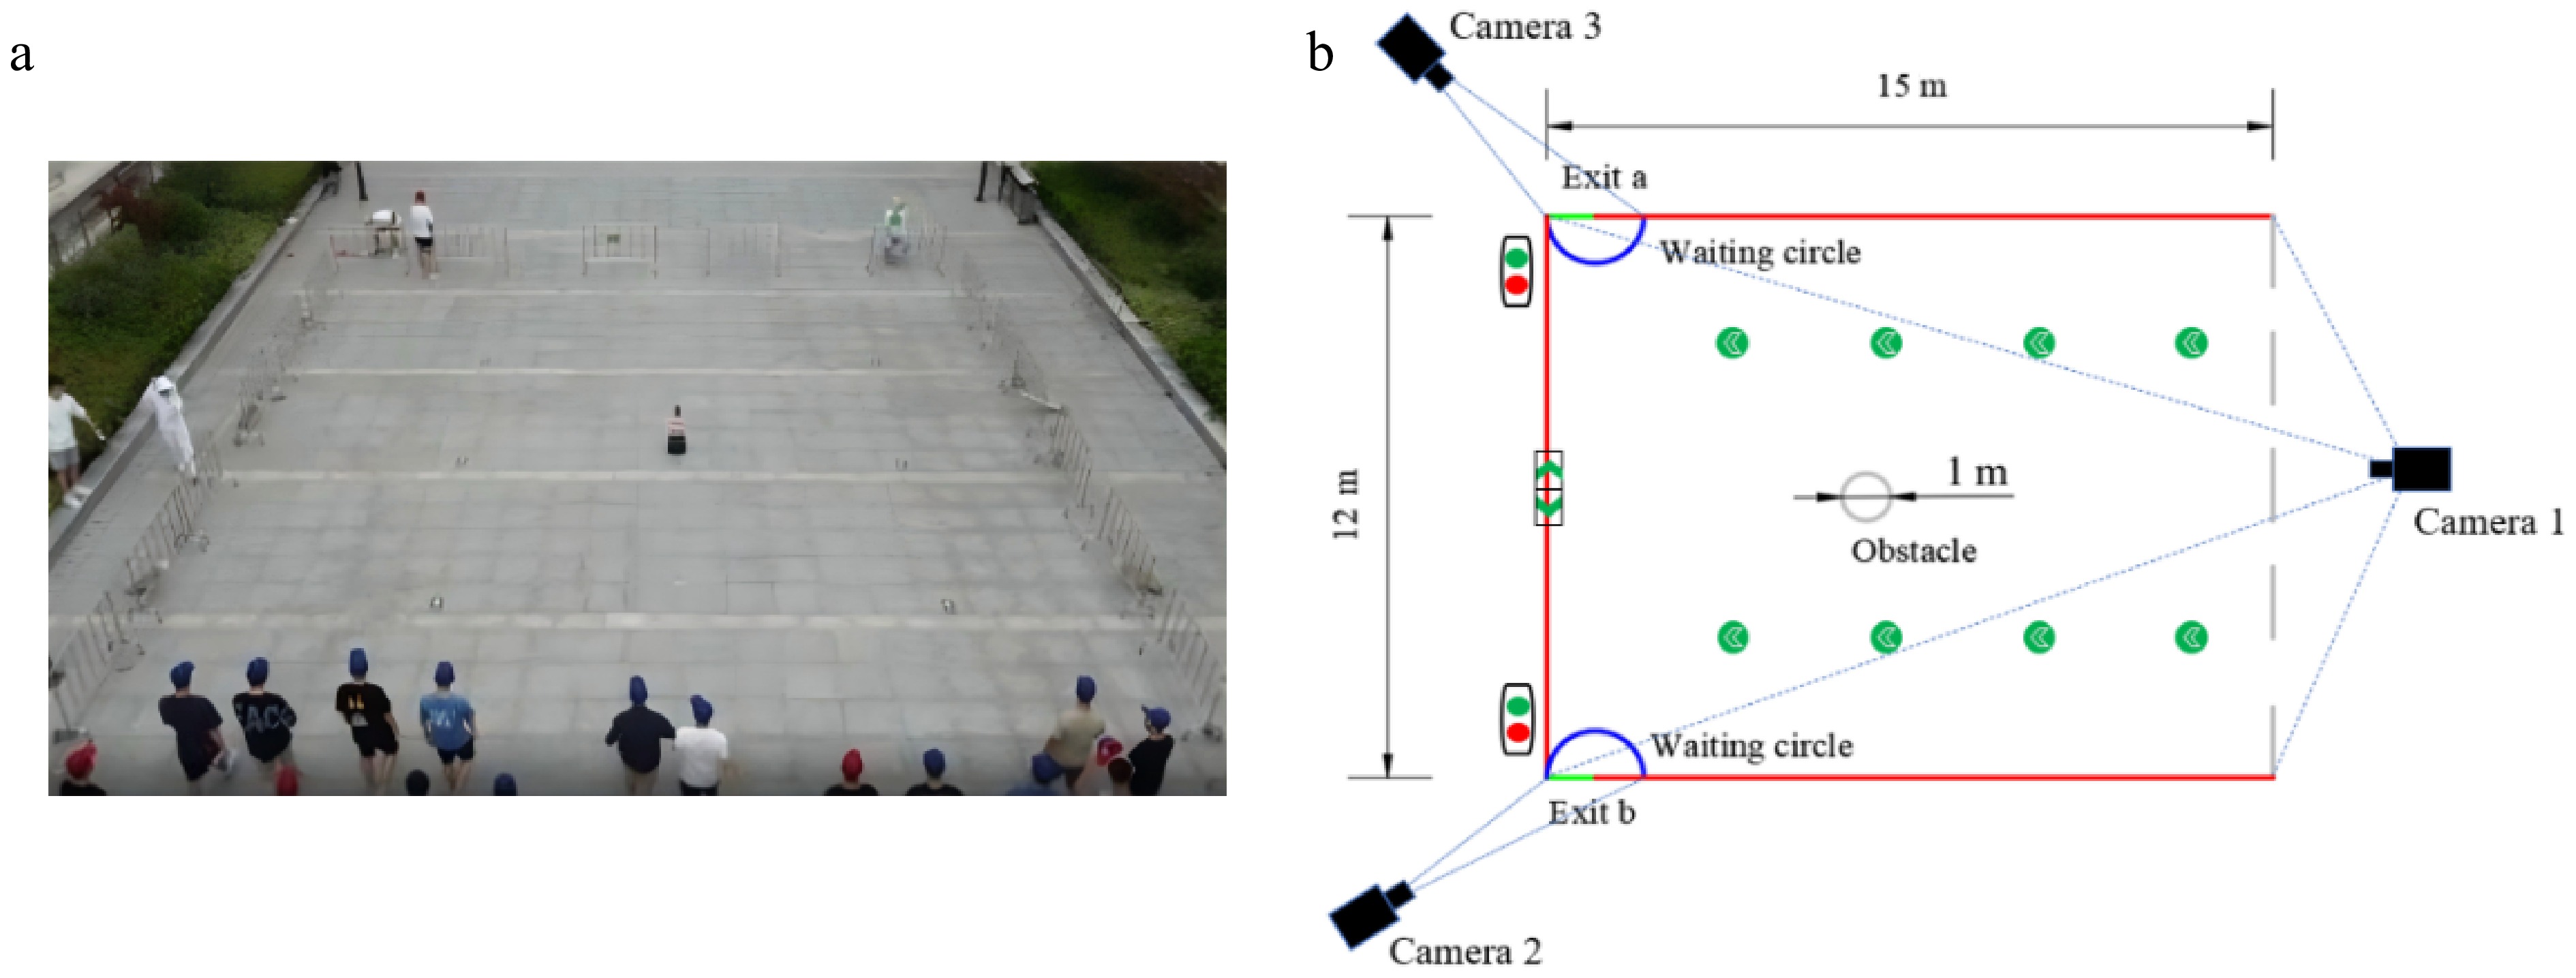
Figure 1.
Experimental scene: (a) real view, (b) schematic diagram.
-
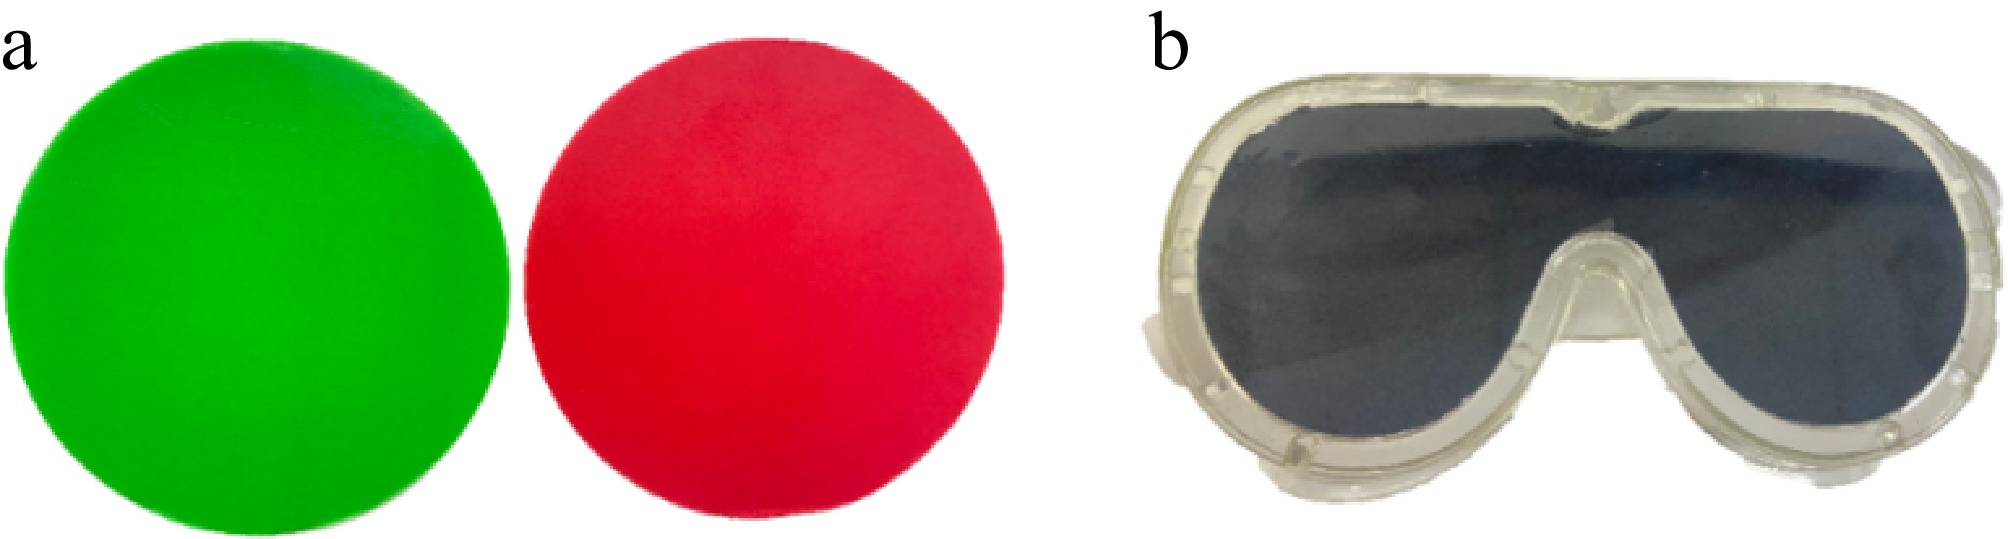
Figure 2.
Experimental equipment: (a) lighted guidance signs, (b) 50% opacity glasses.
-
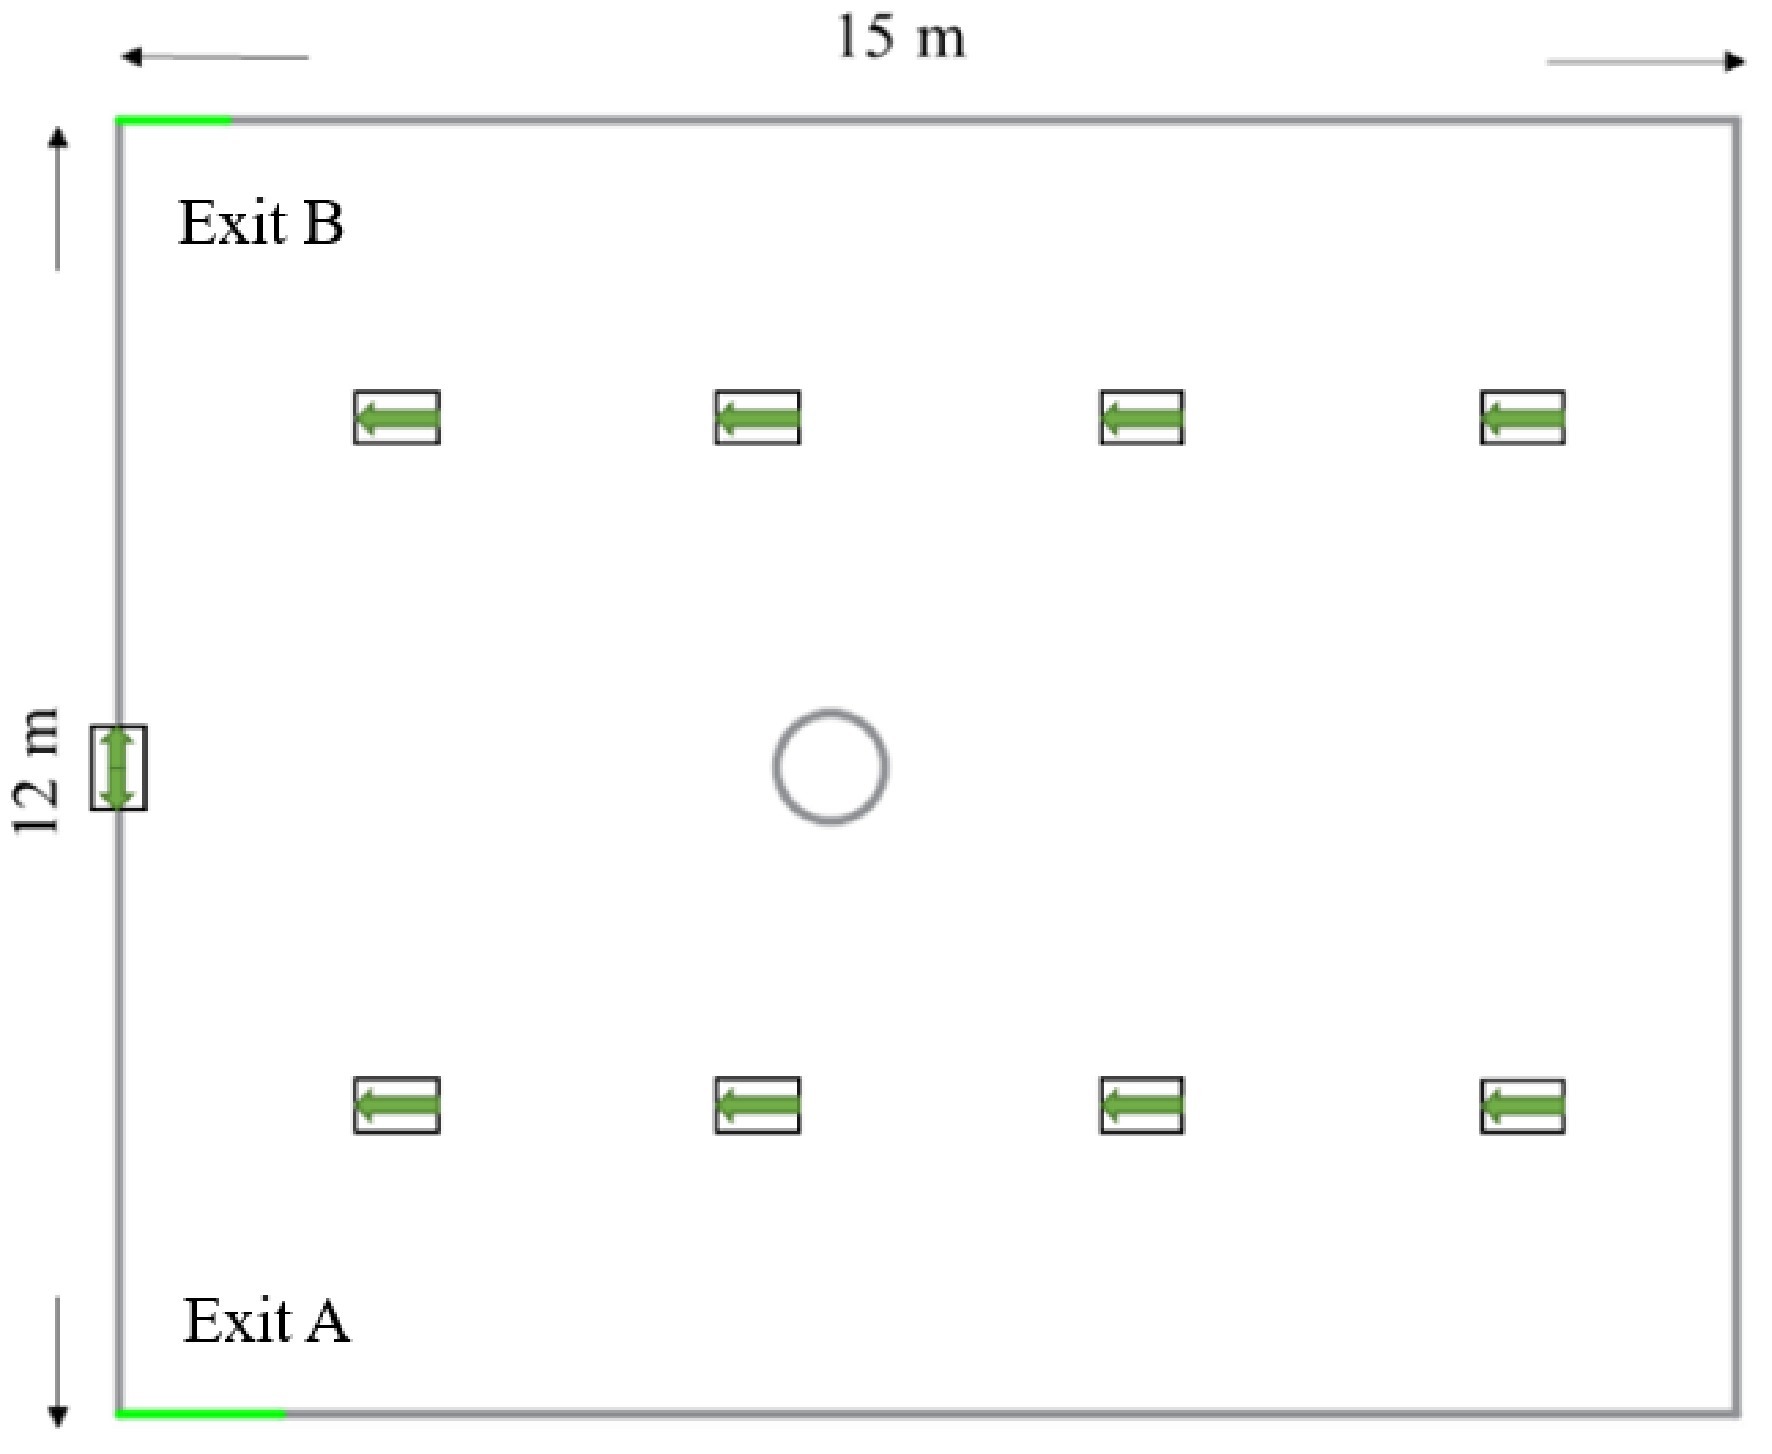
Figure 3.
Multi-exit simulation scenario.
-
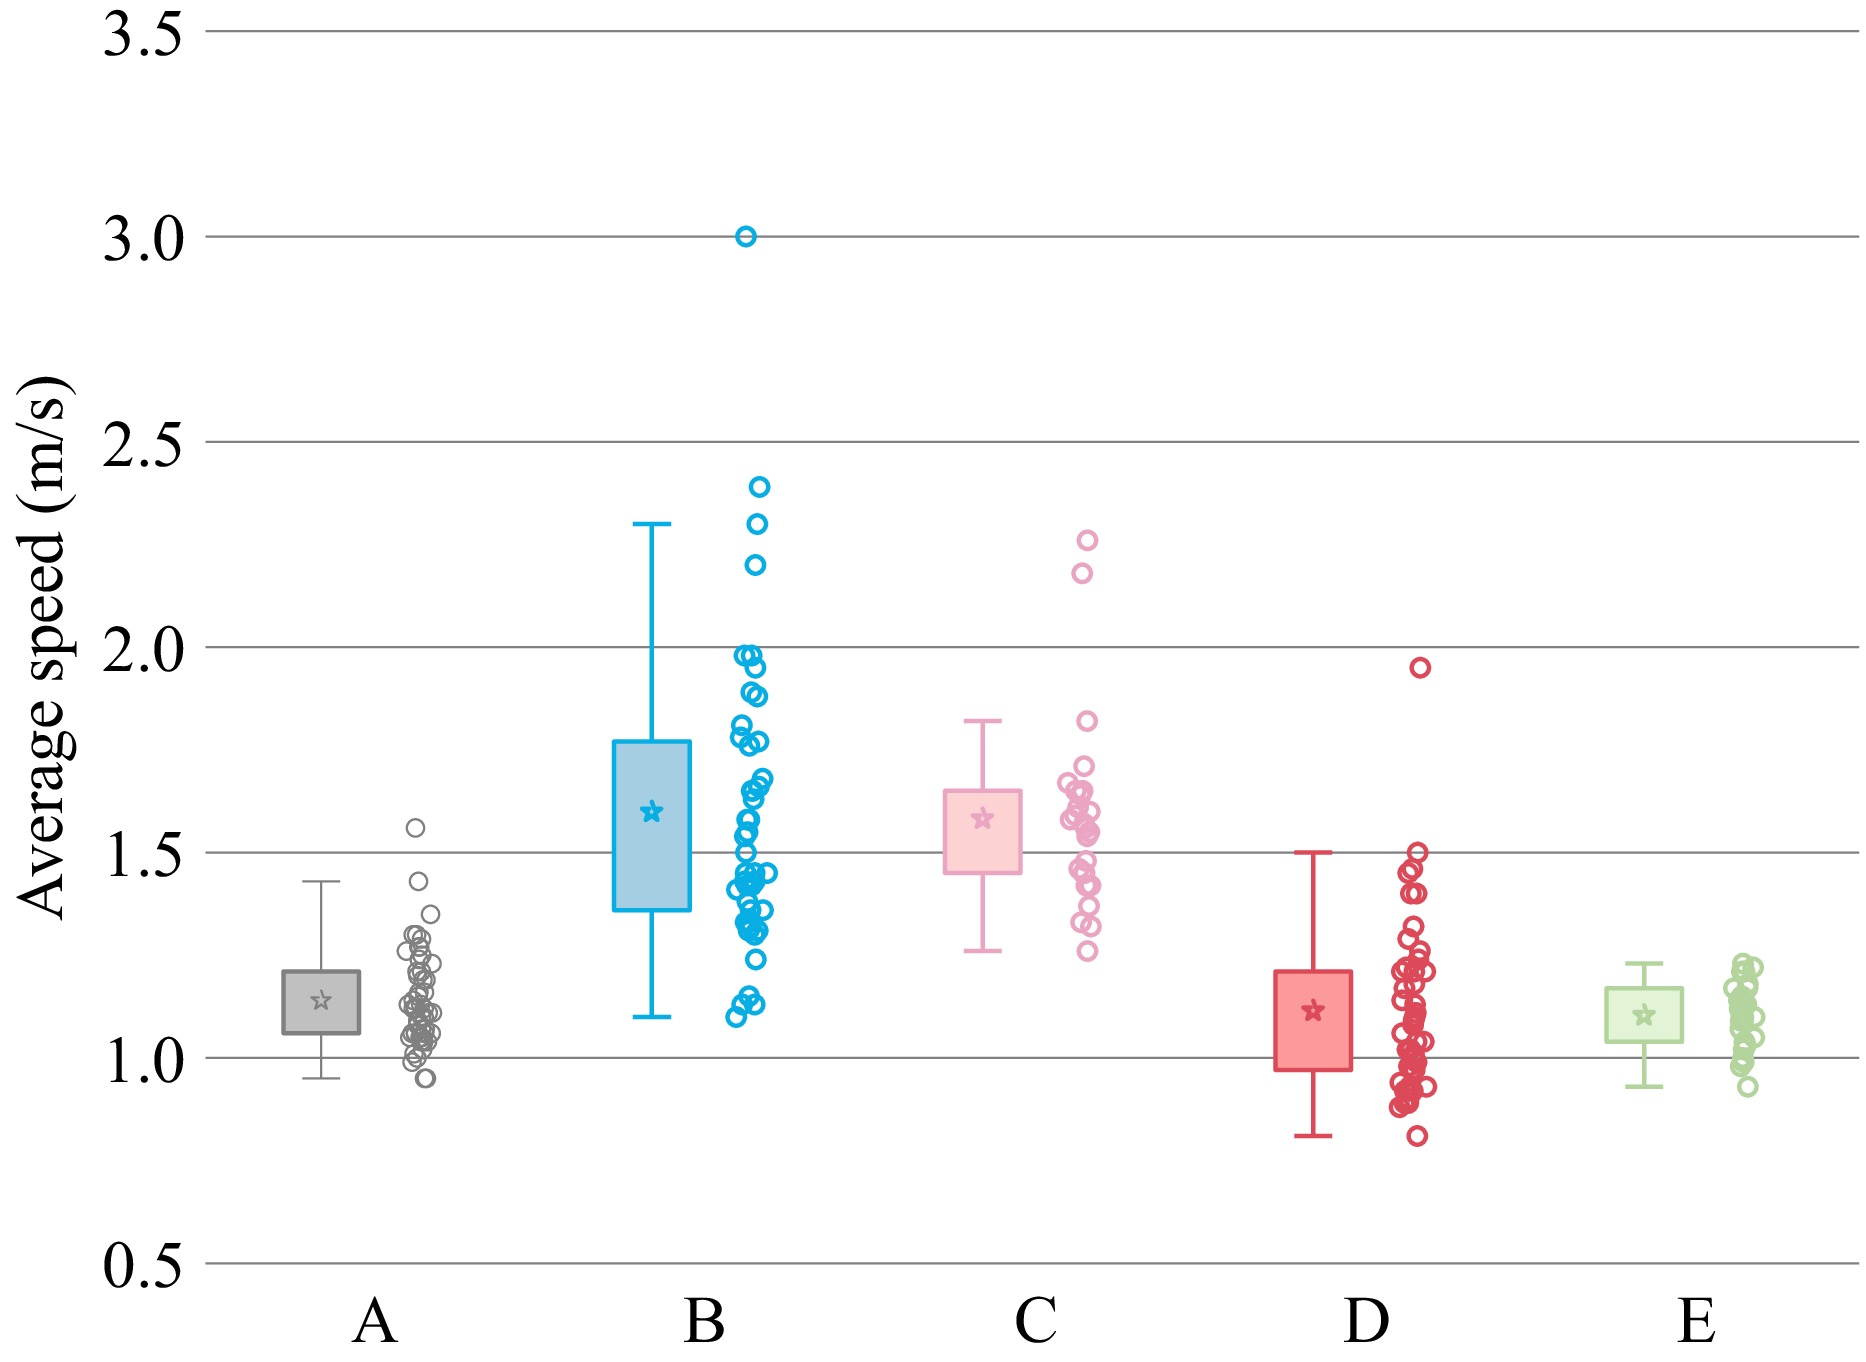
Figure 4.
Box diagram of average pedestrian speed, ☆ represents the average value, the upper part of the whisker line represents an abnormal value.
-
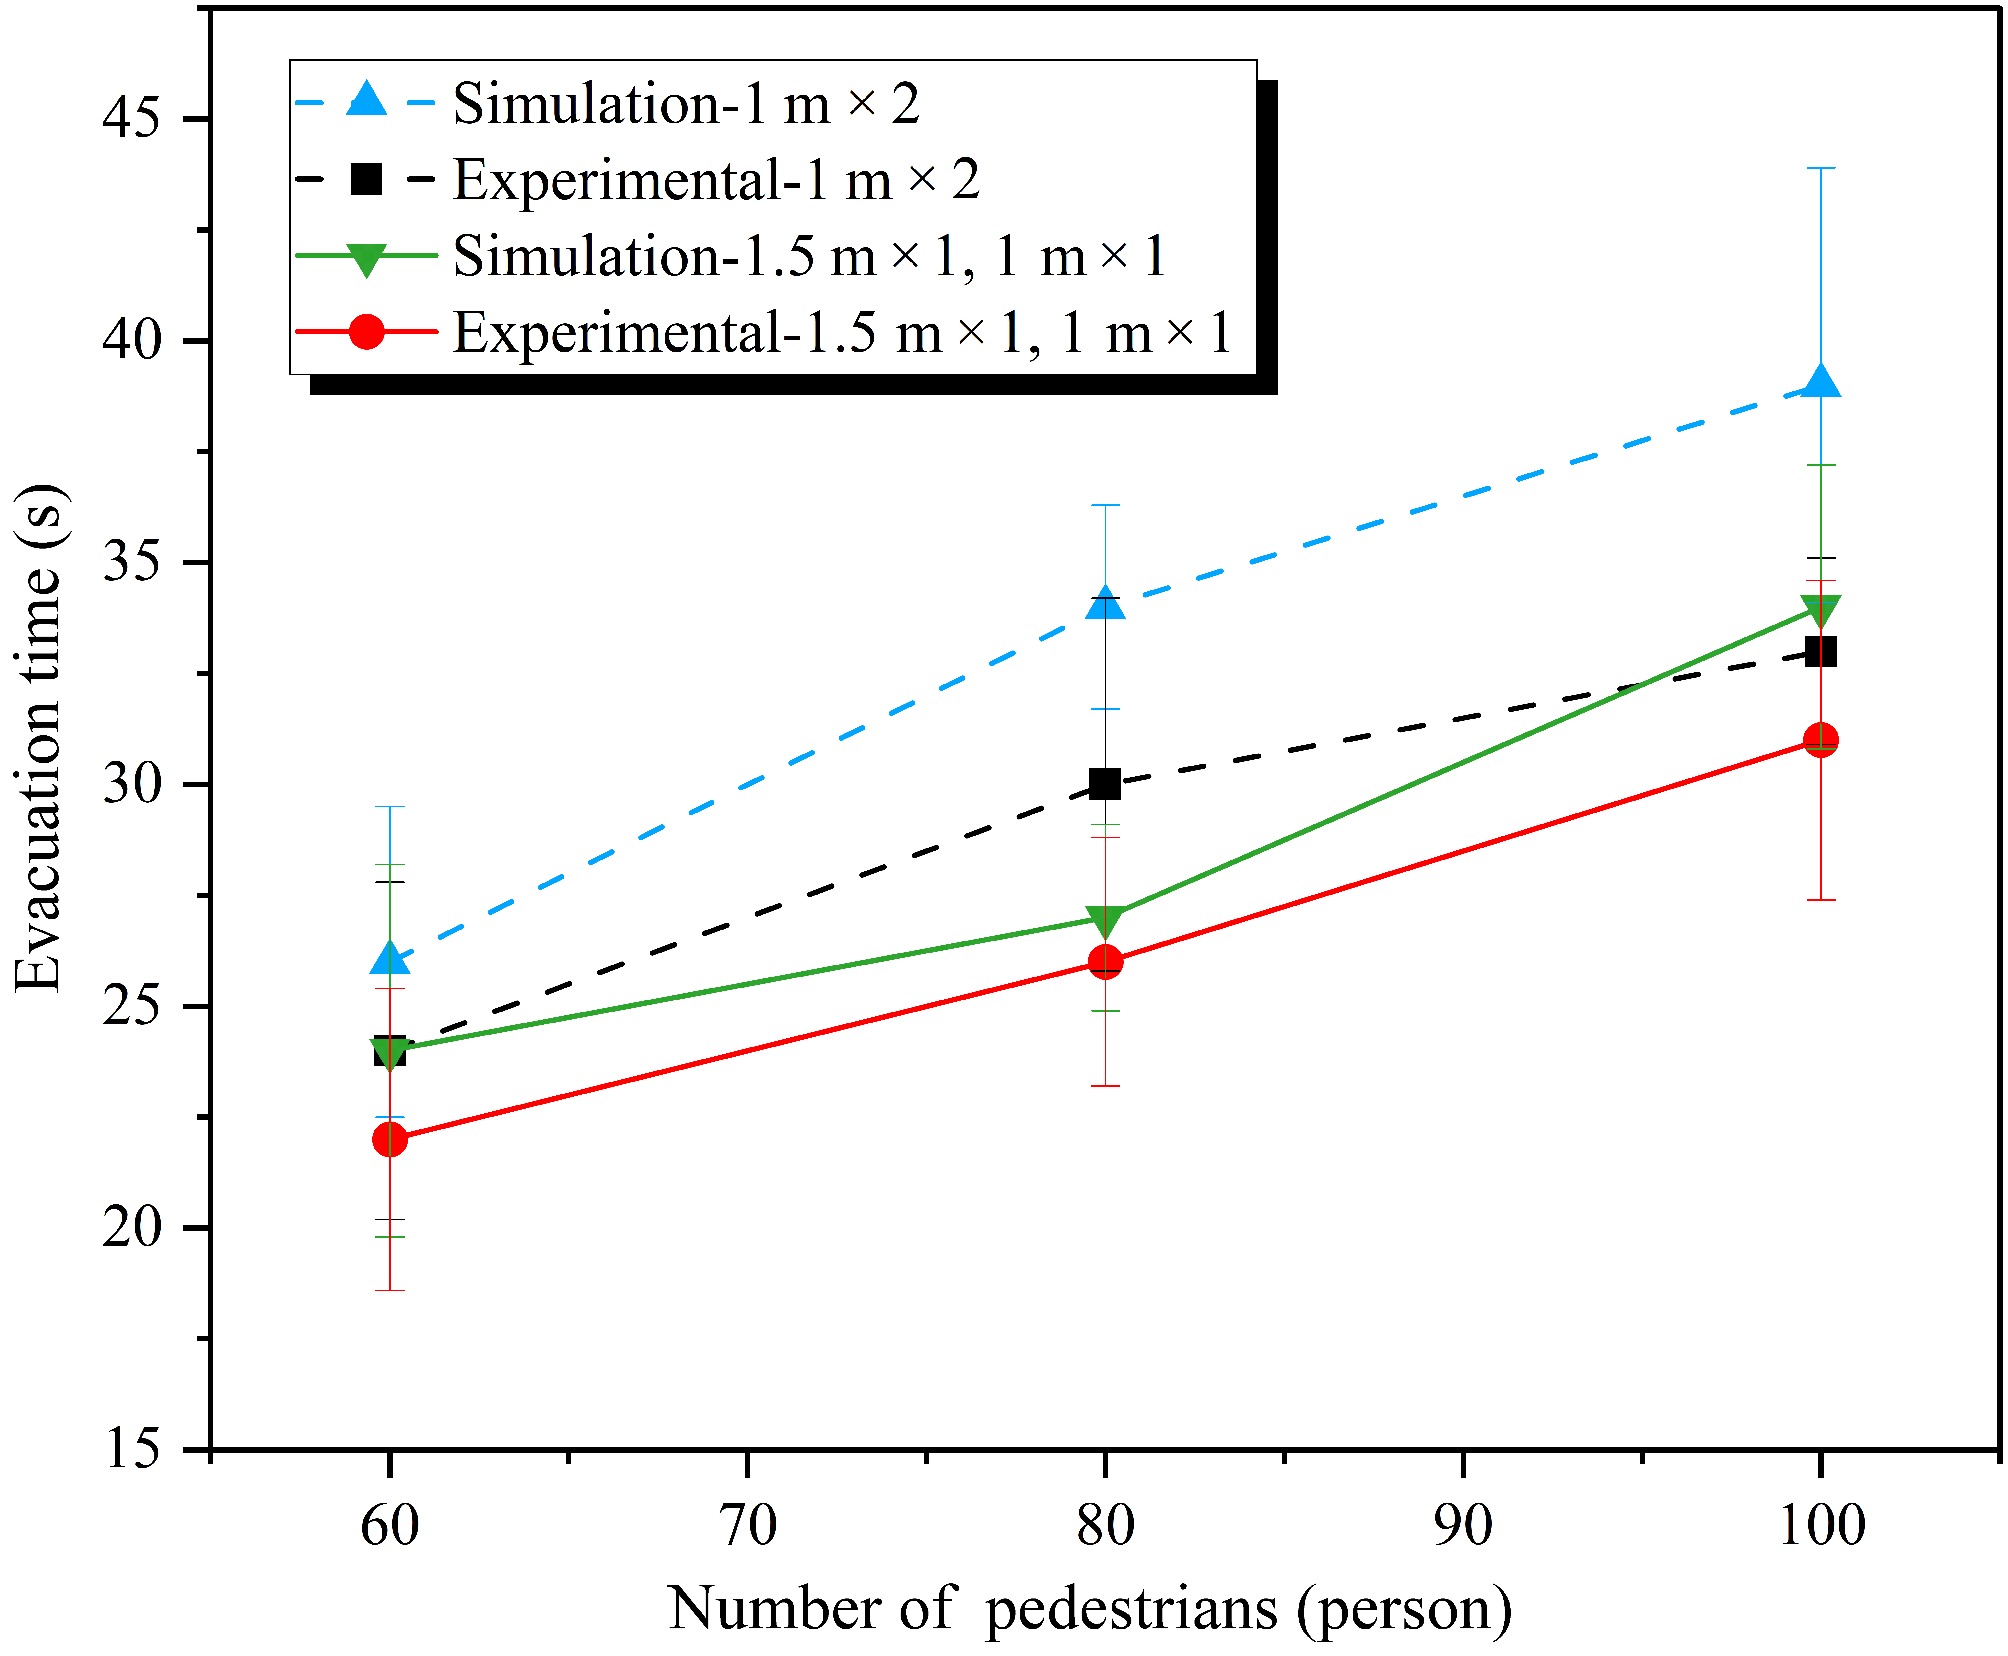
Figure 5.
Scenario 1 simulation results.
-
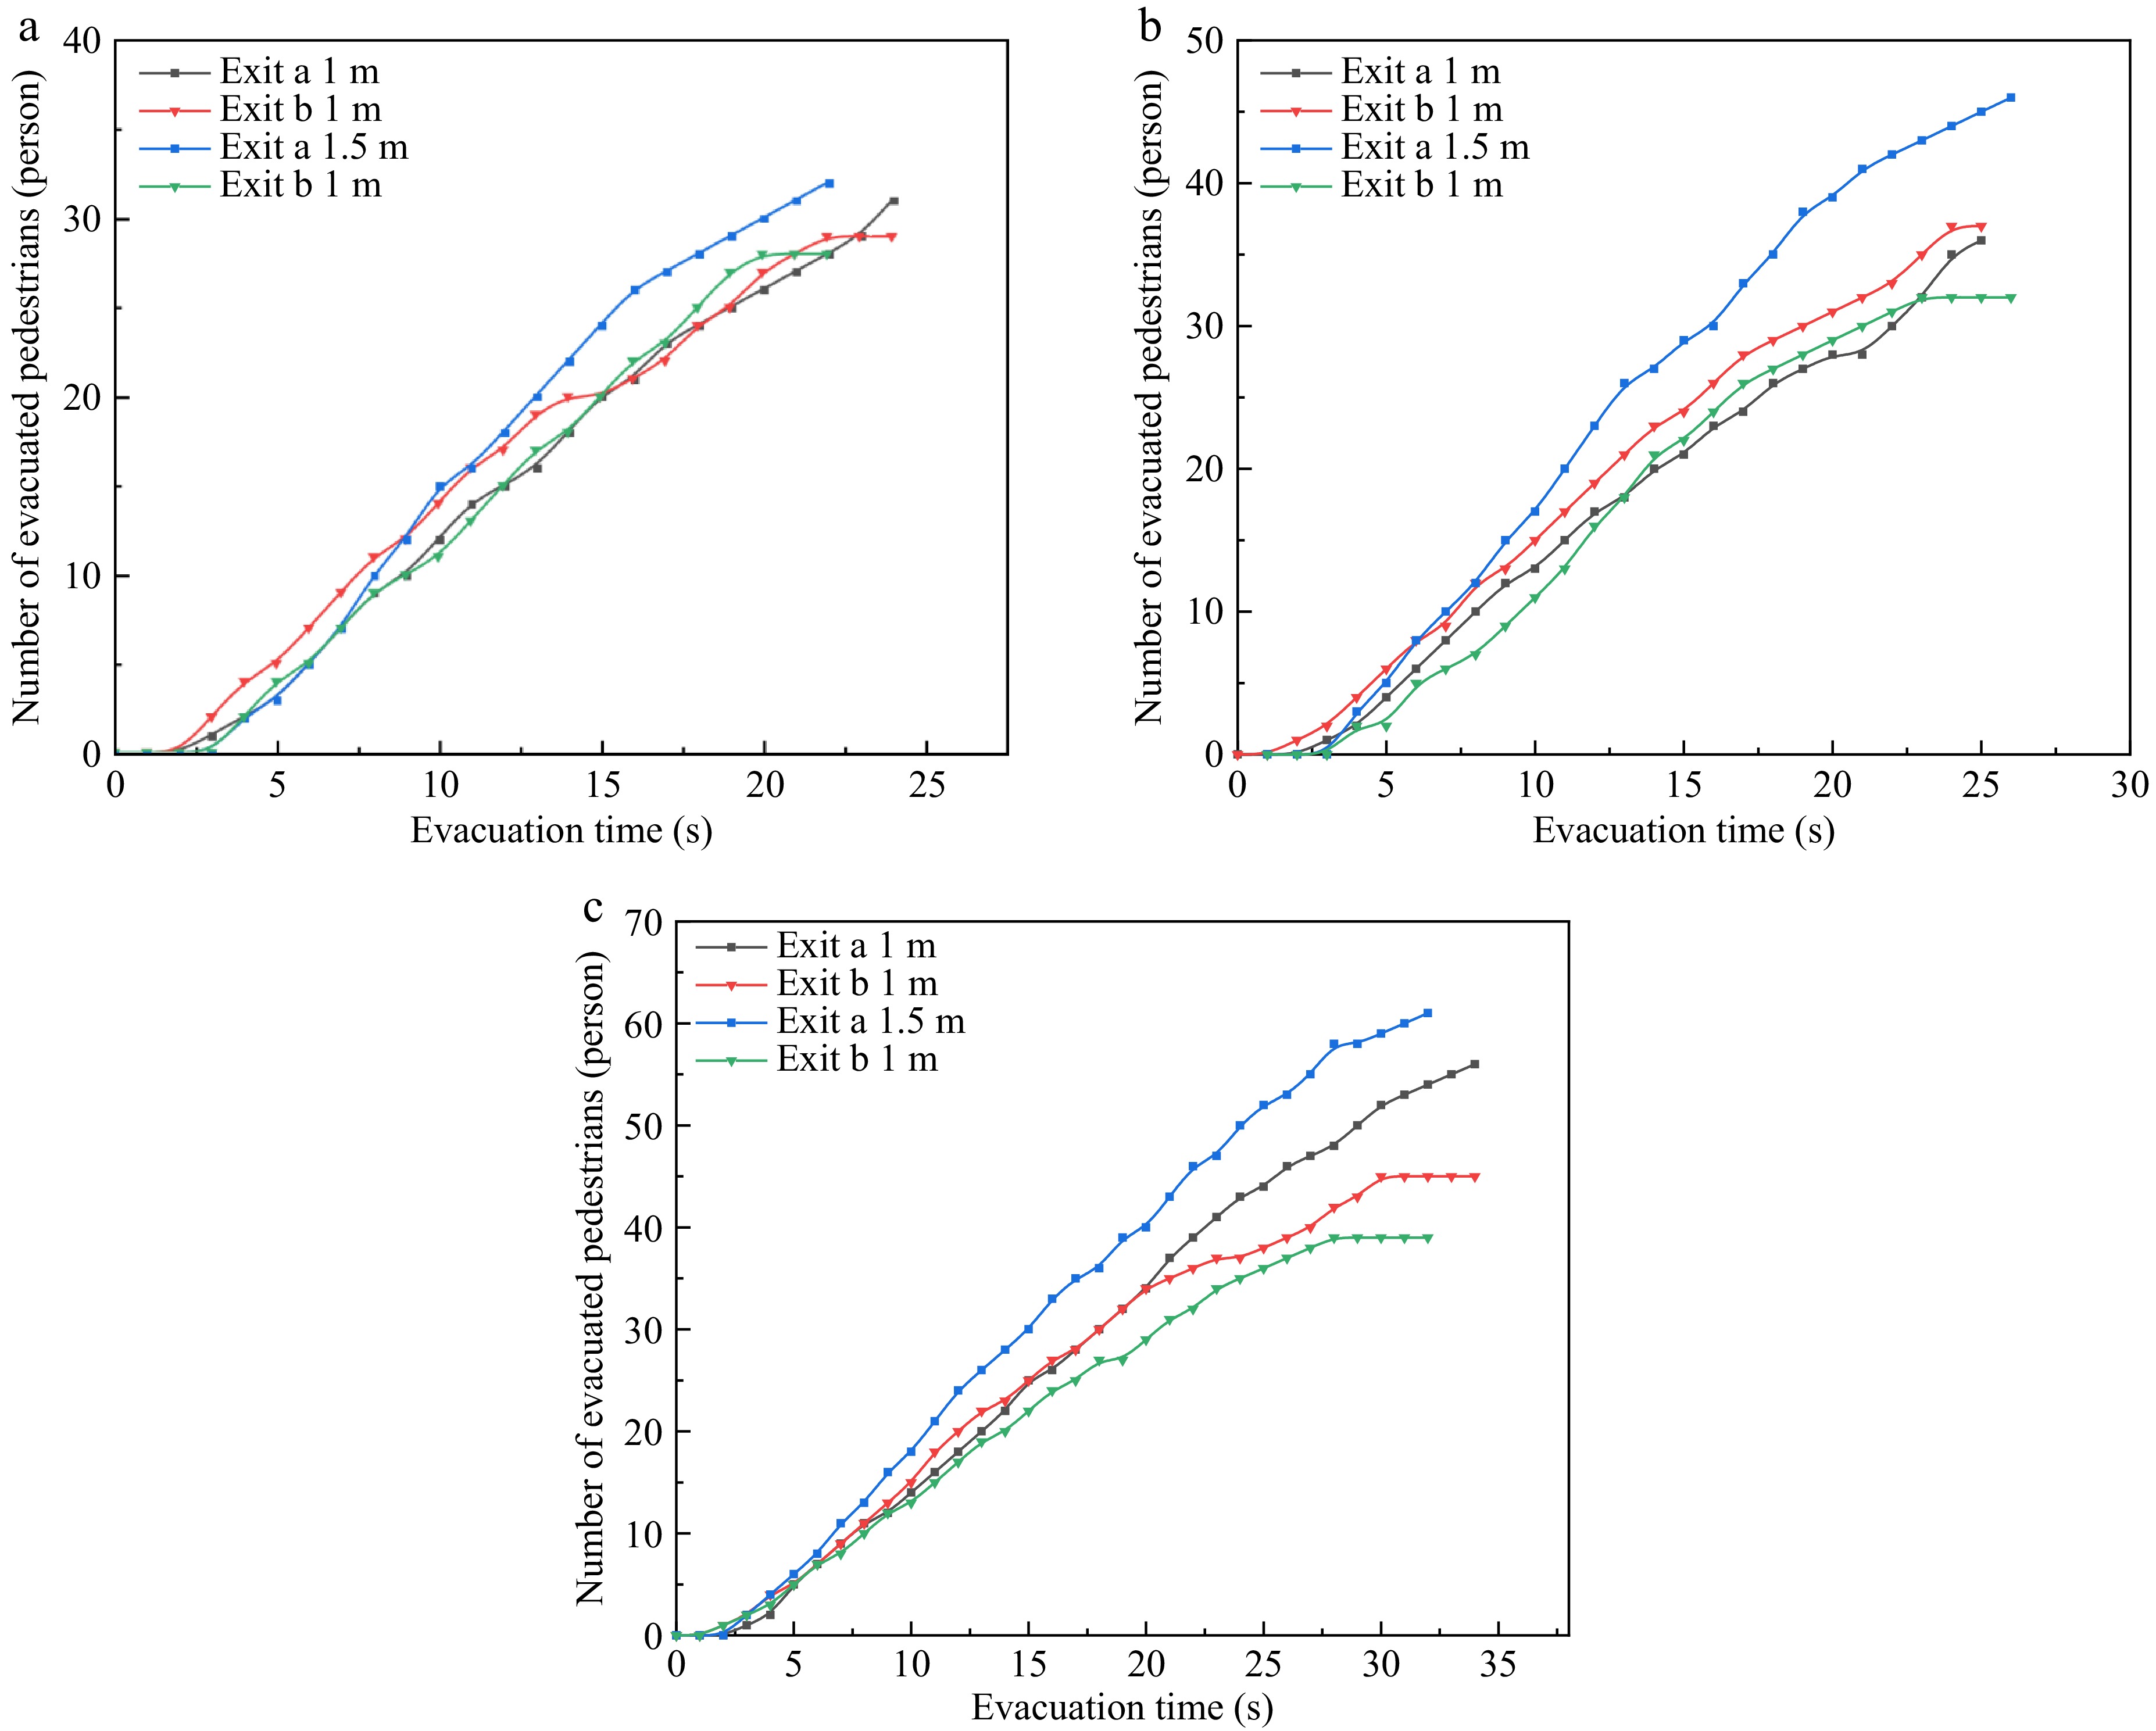
Figure 6.
Number of pedestrians ((a) 60, (b) 80, (c) 100) evacuated with varying numbers of pedestrians at two exits under Scenario 1.
-
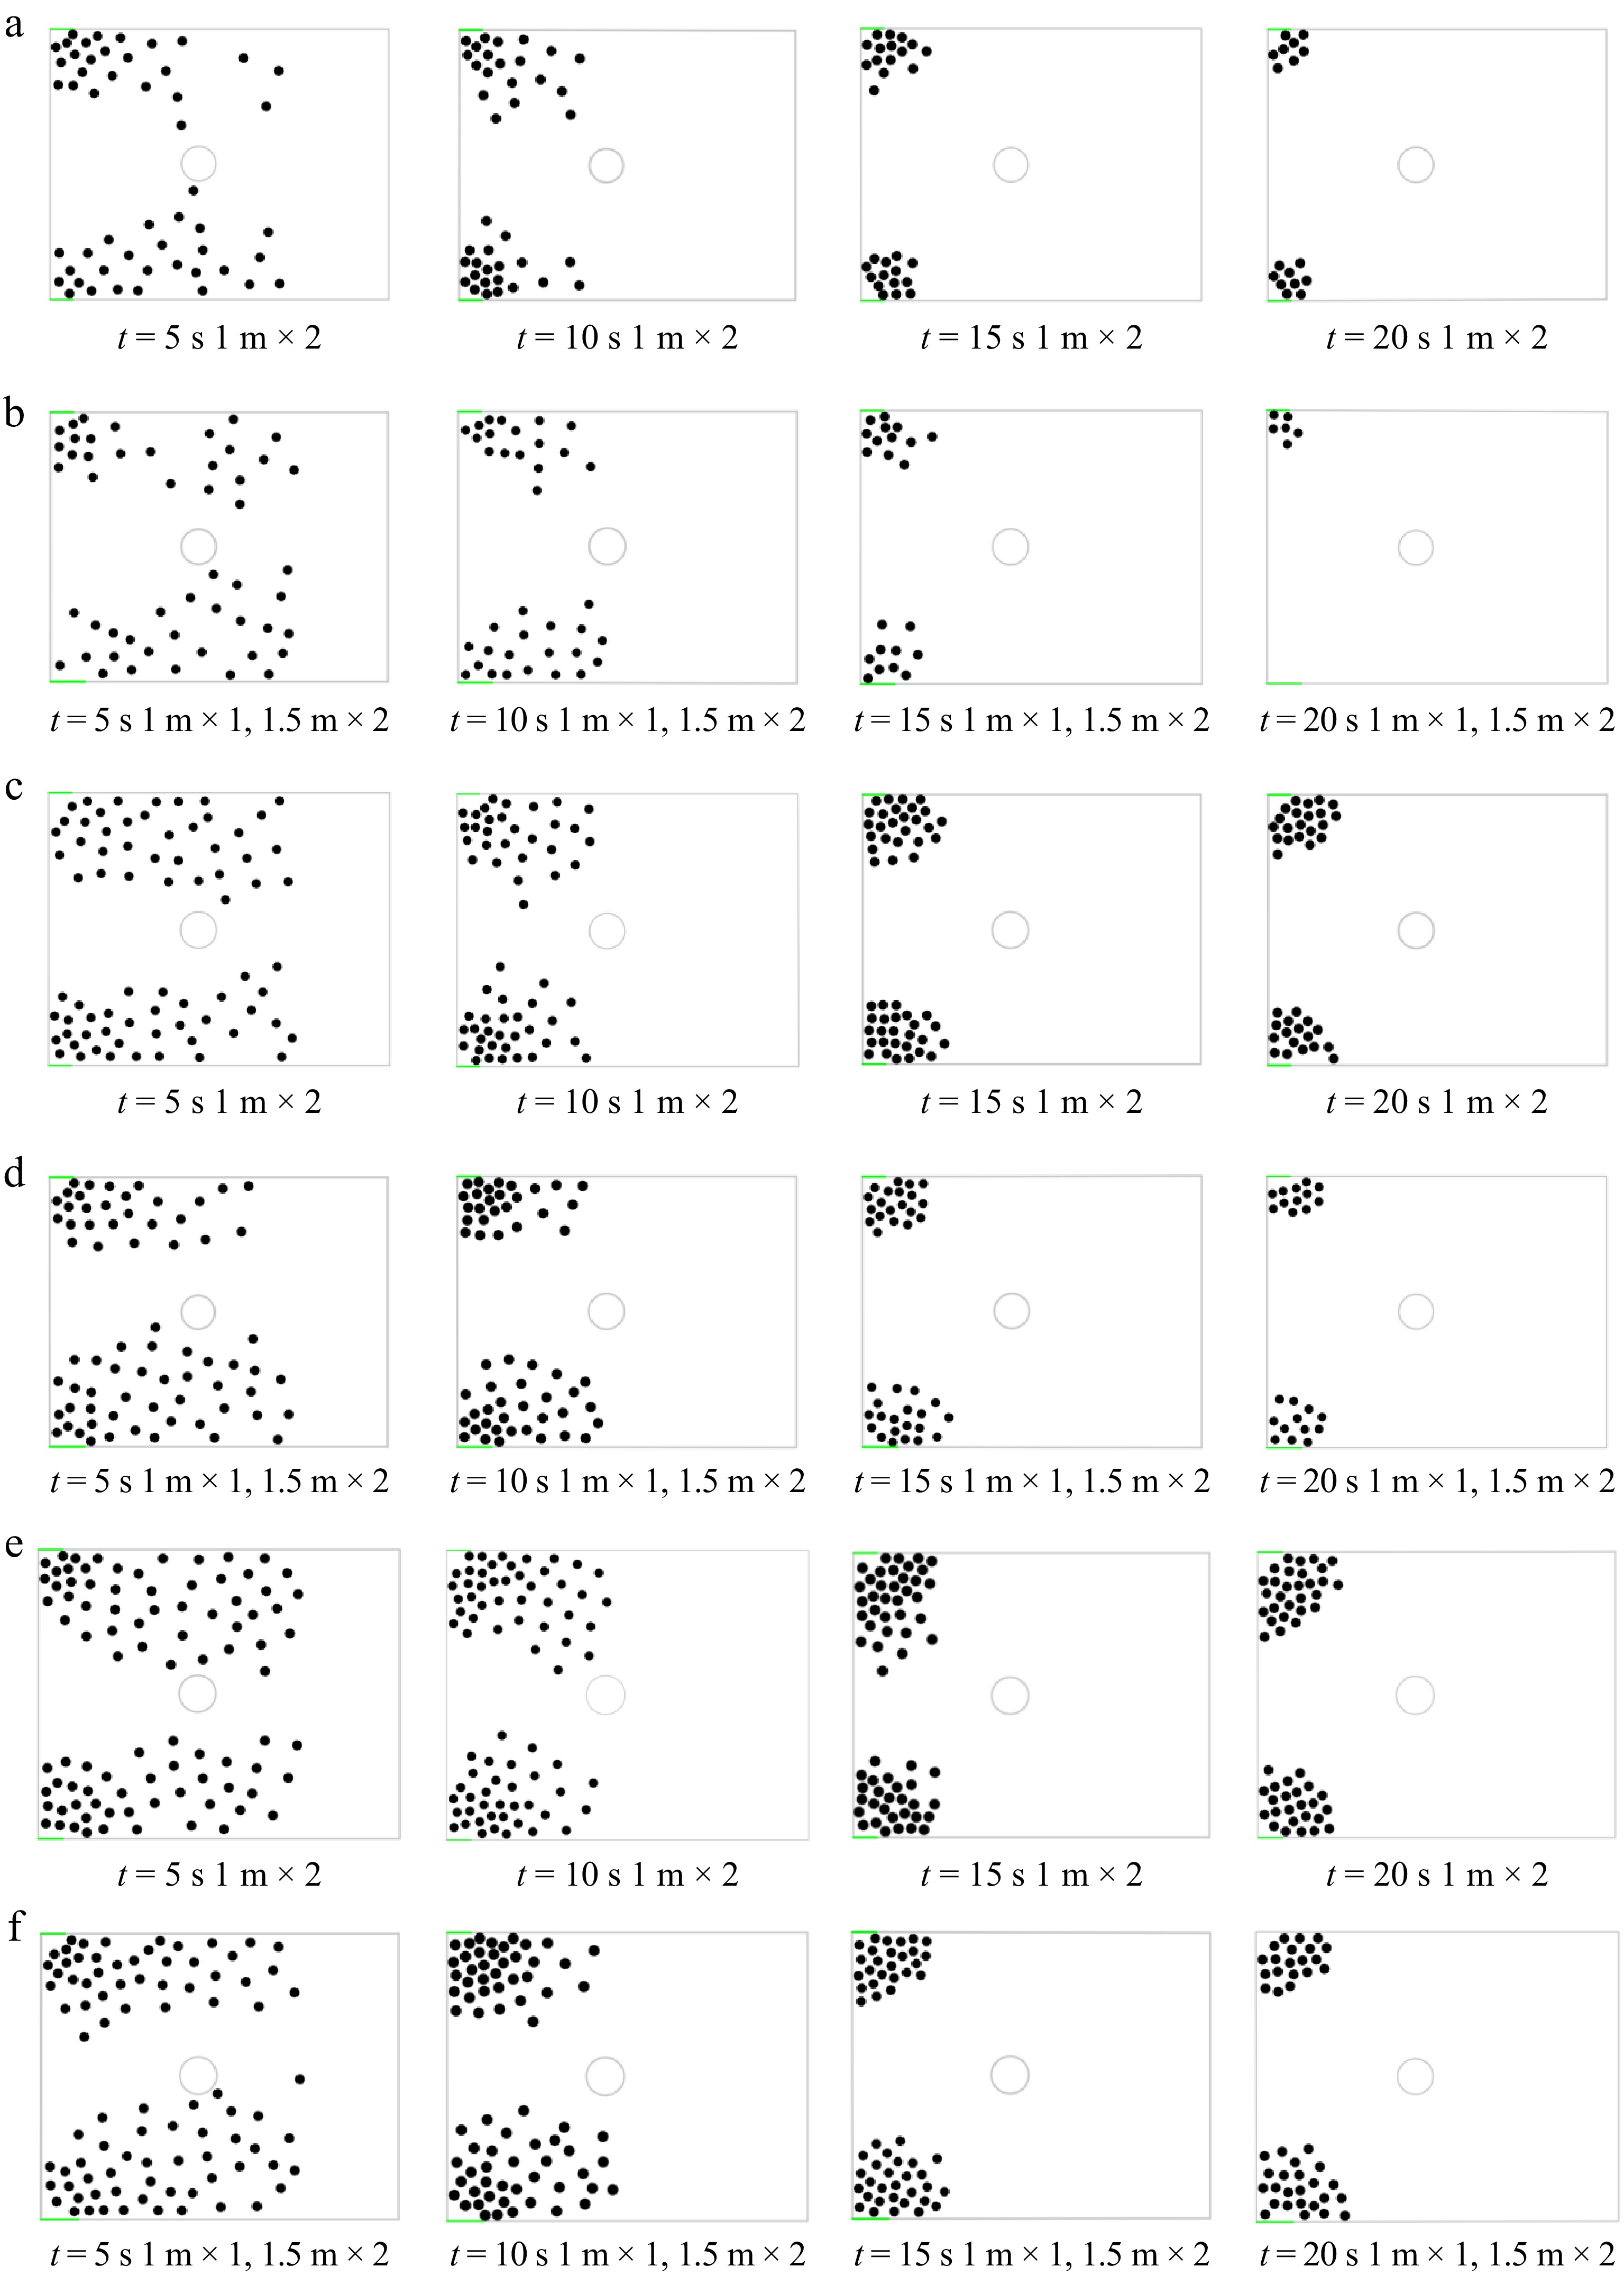
Figure 7.
Screenshot of pedestrian dynamic evacuation with varying numbers of pedestrians ((a, b) 60; (c, d) 80; (e, f) 100) at four time nodes.
-
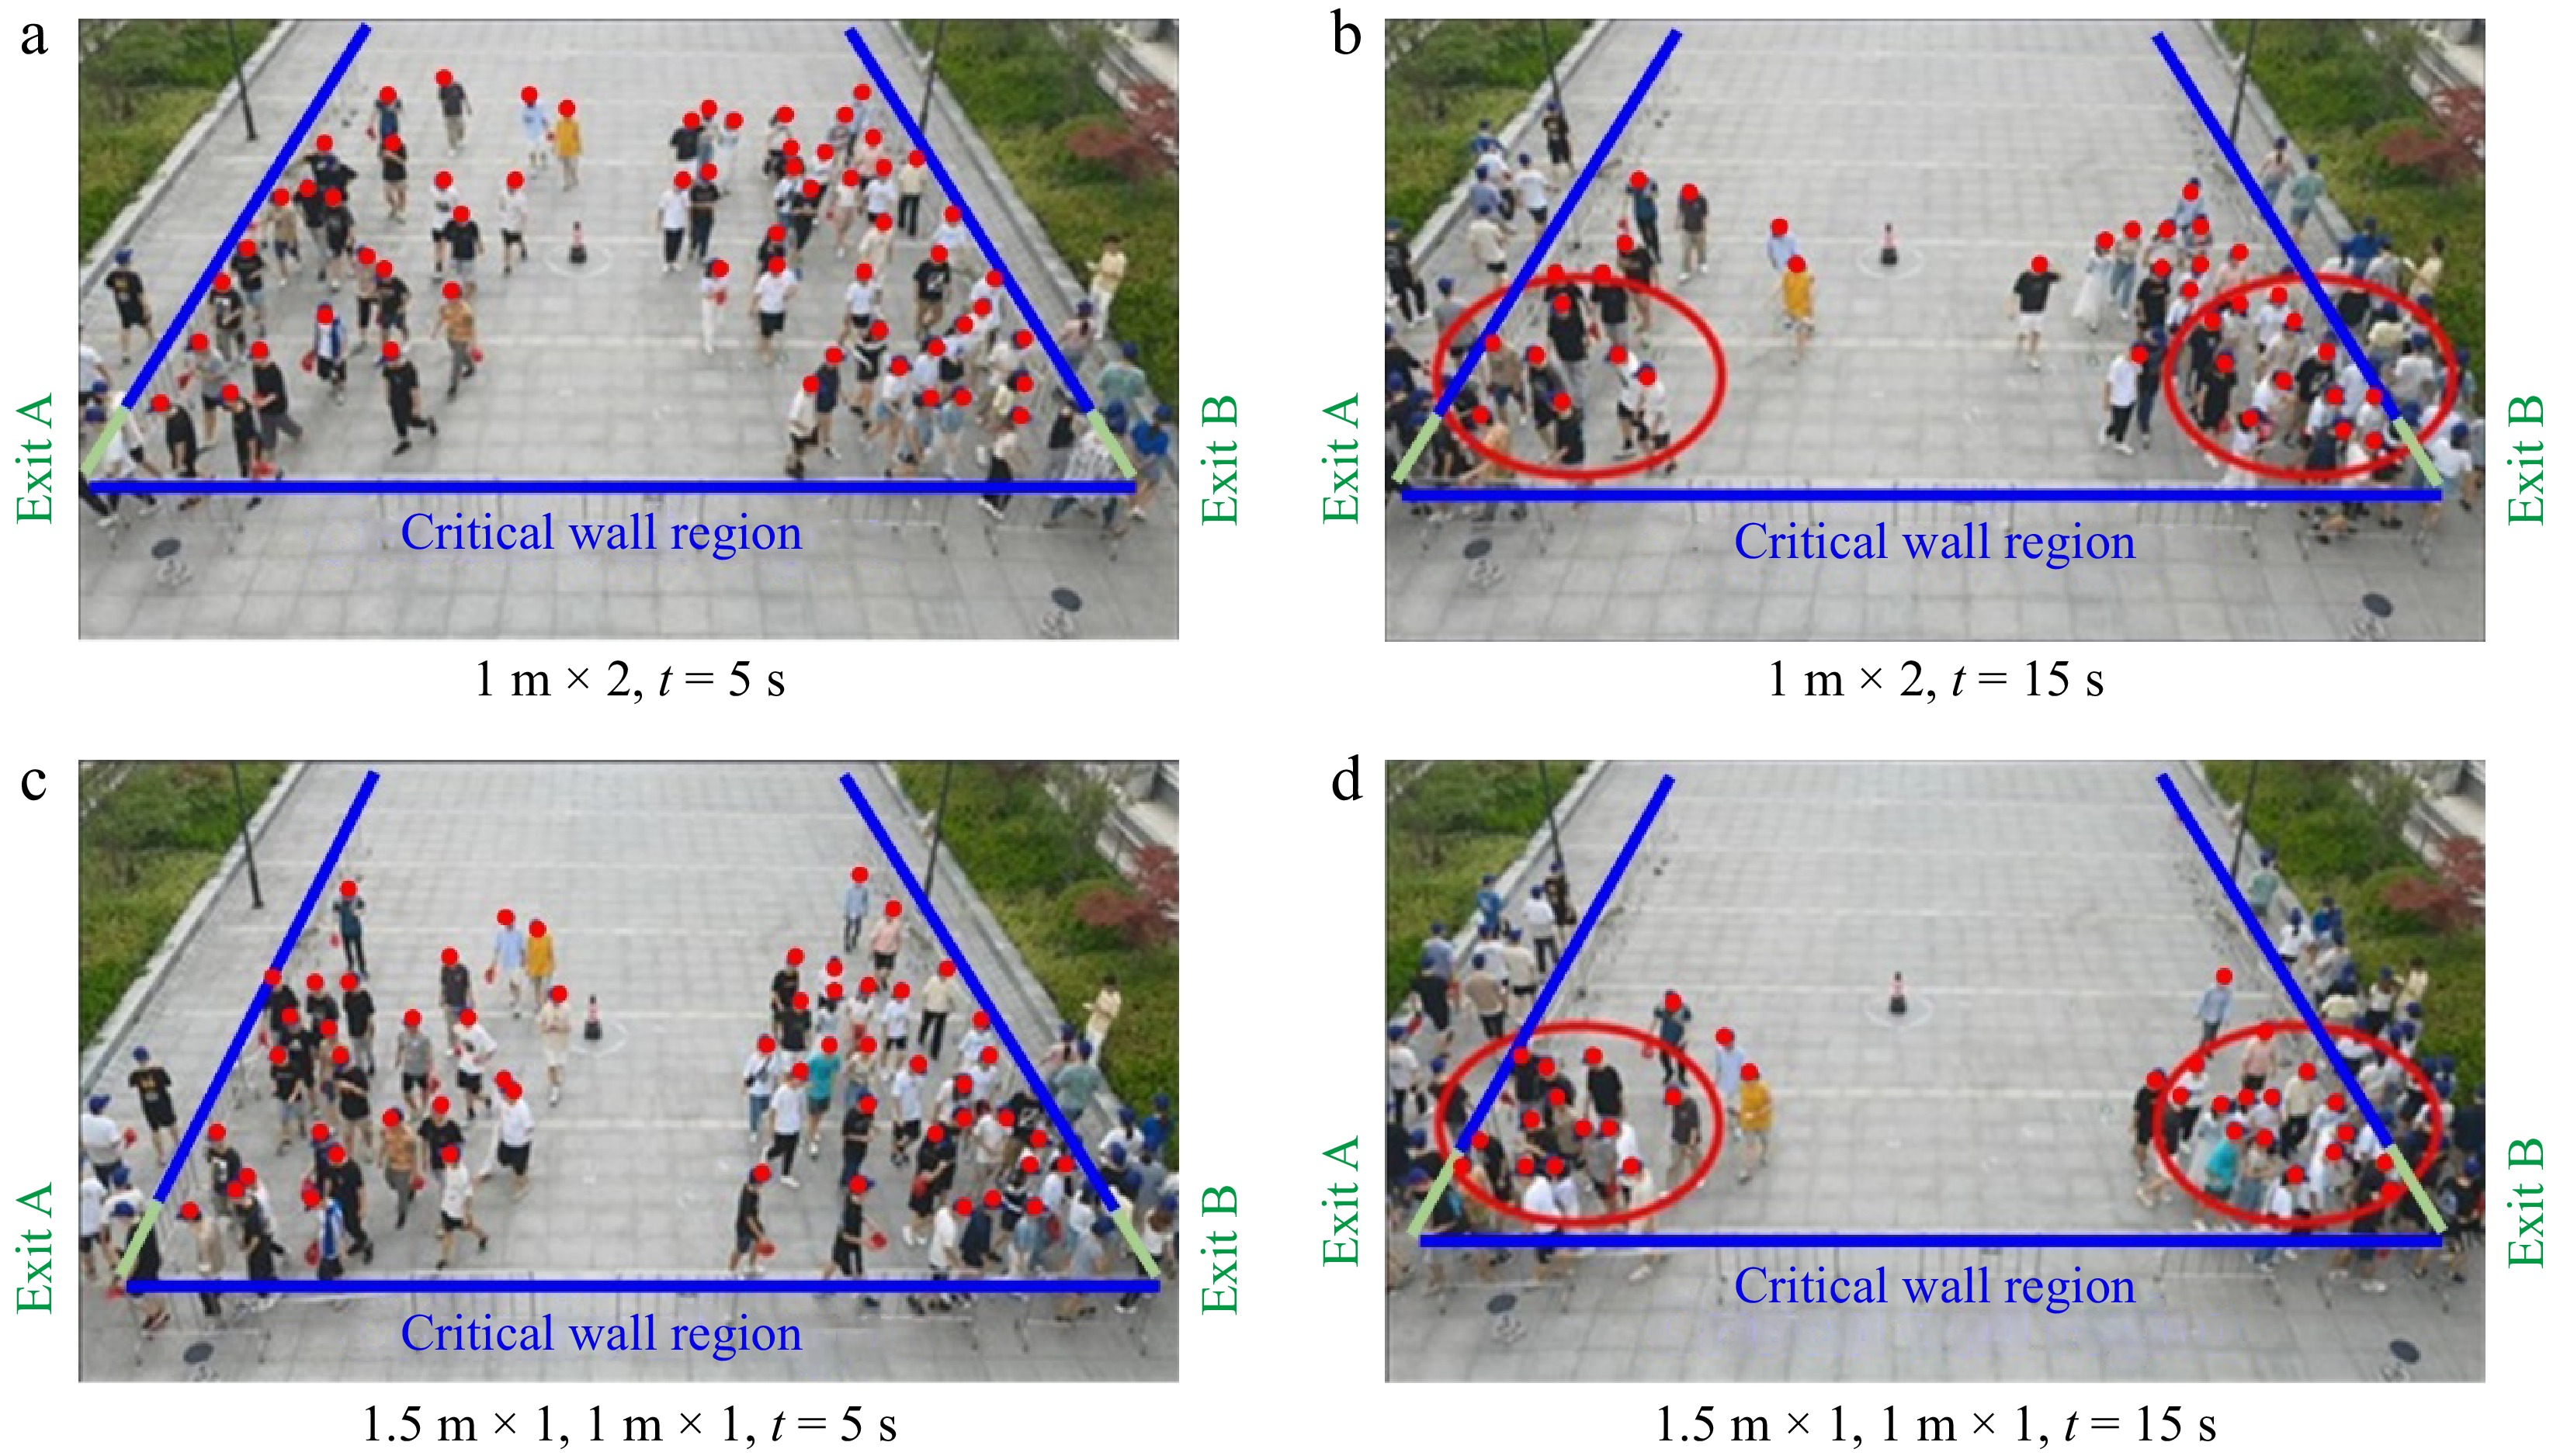
Figure 8.
Picture of the experimental site in motion (with 80 pedestrians, 5 and 15 s screenshots), the critical wall regions, exits, and non-evacuated personnel are indicated by solid blue lines, solid green lines, and red dots, respectively.
-
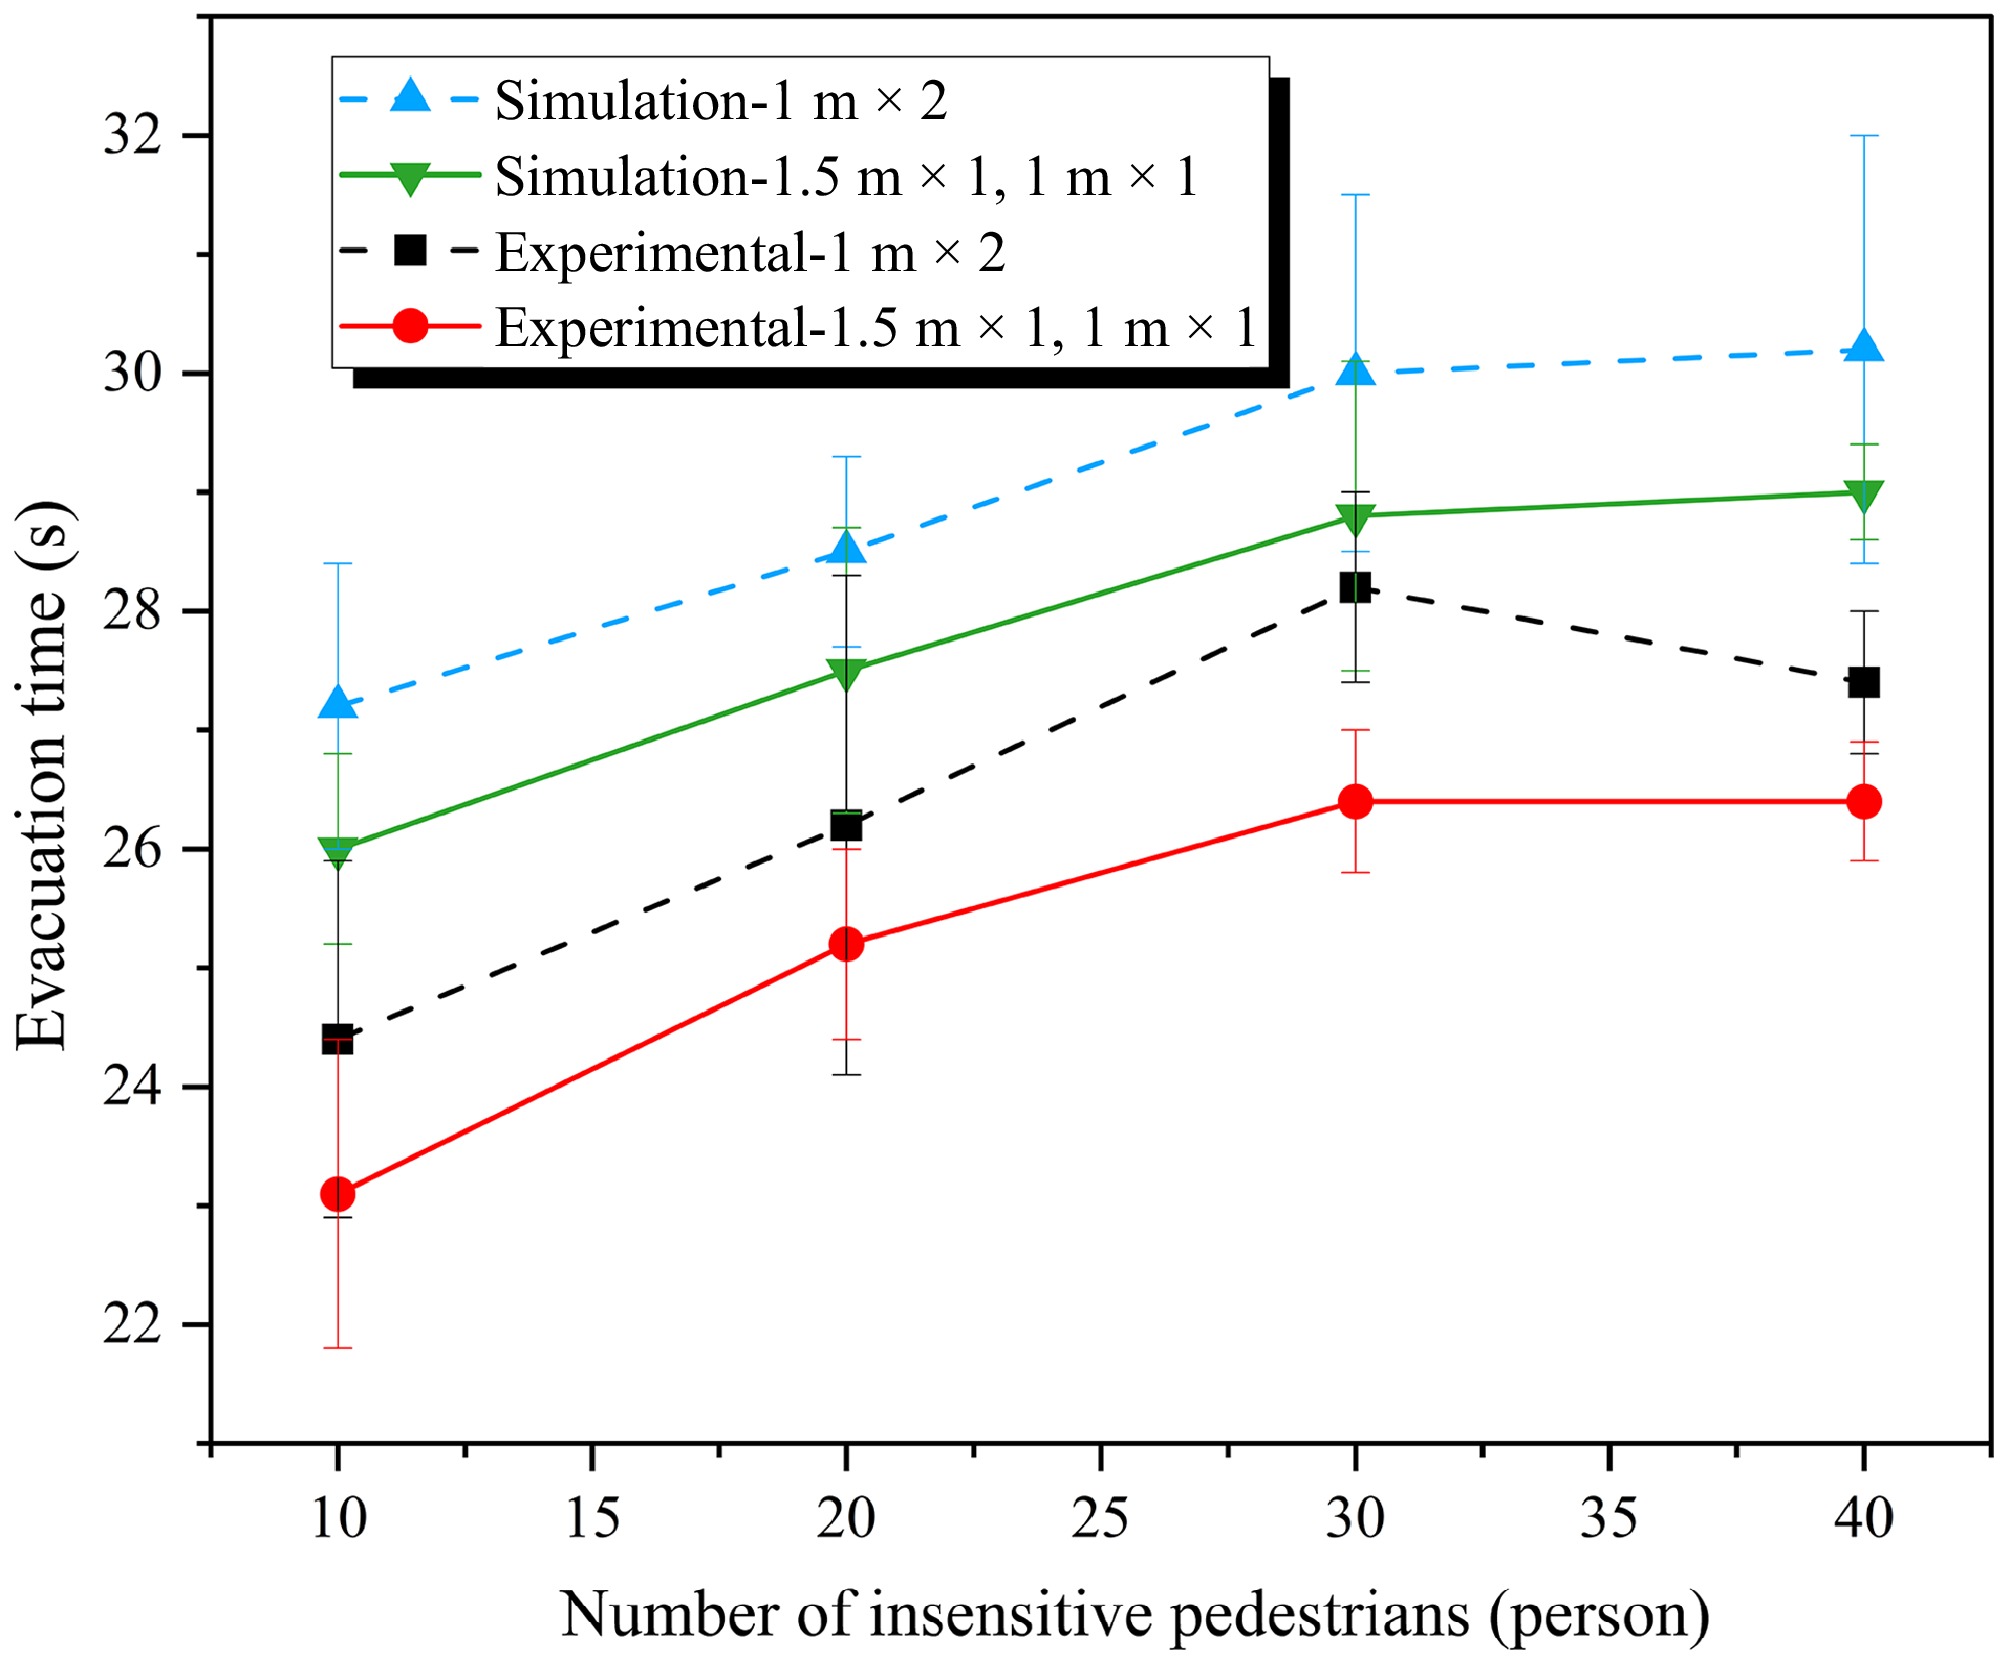
Figure 9.
Scenario 2 experimental and simulation results.
-
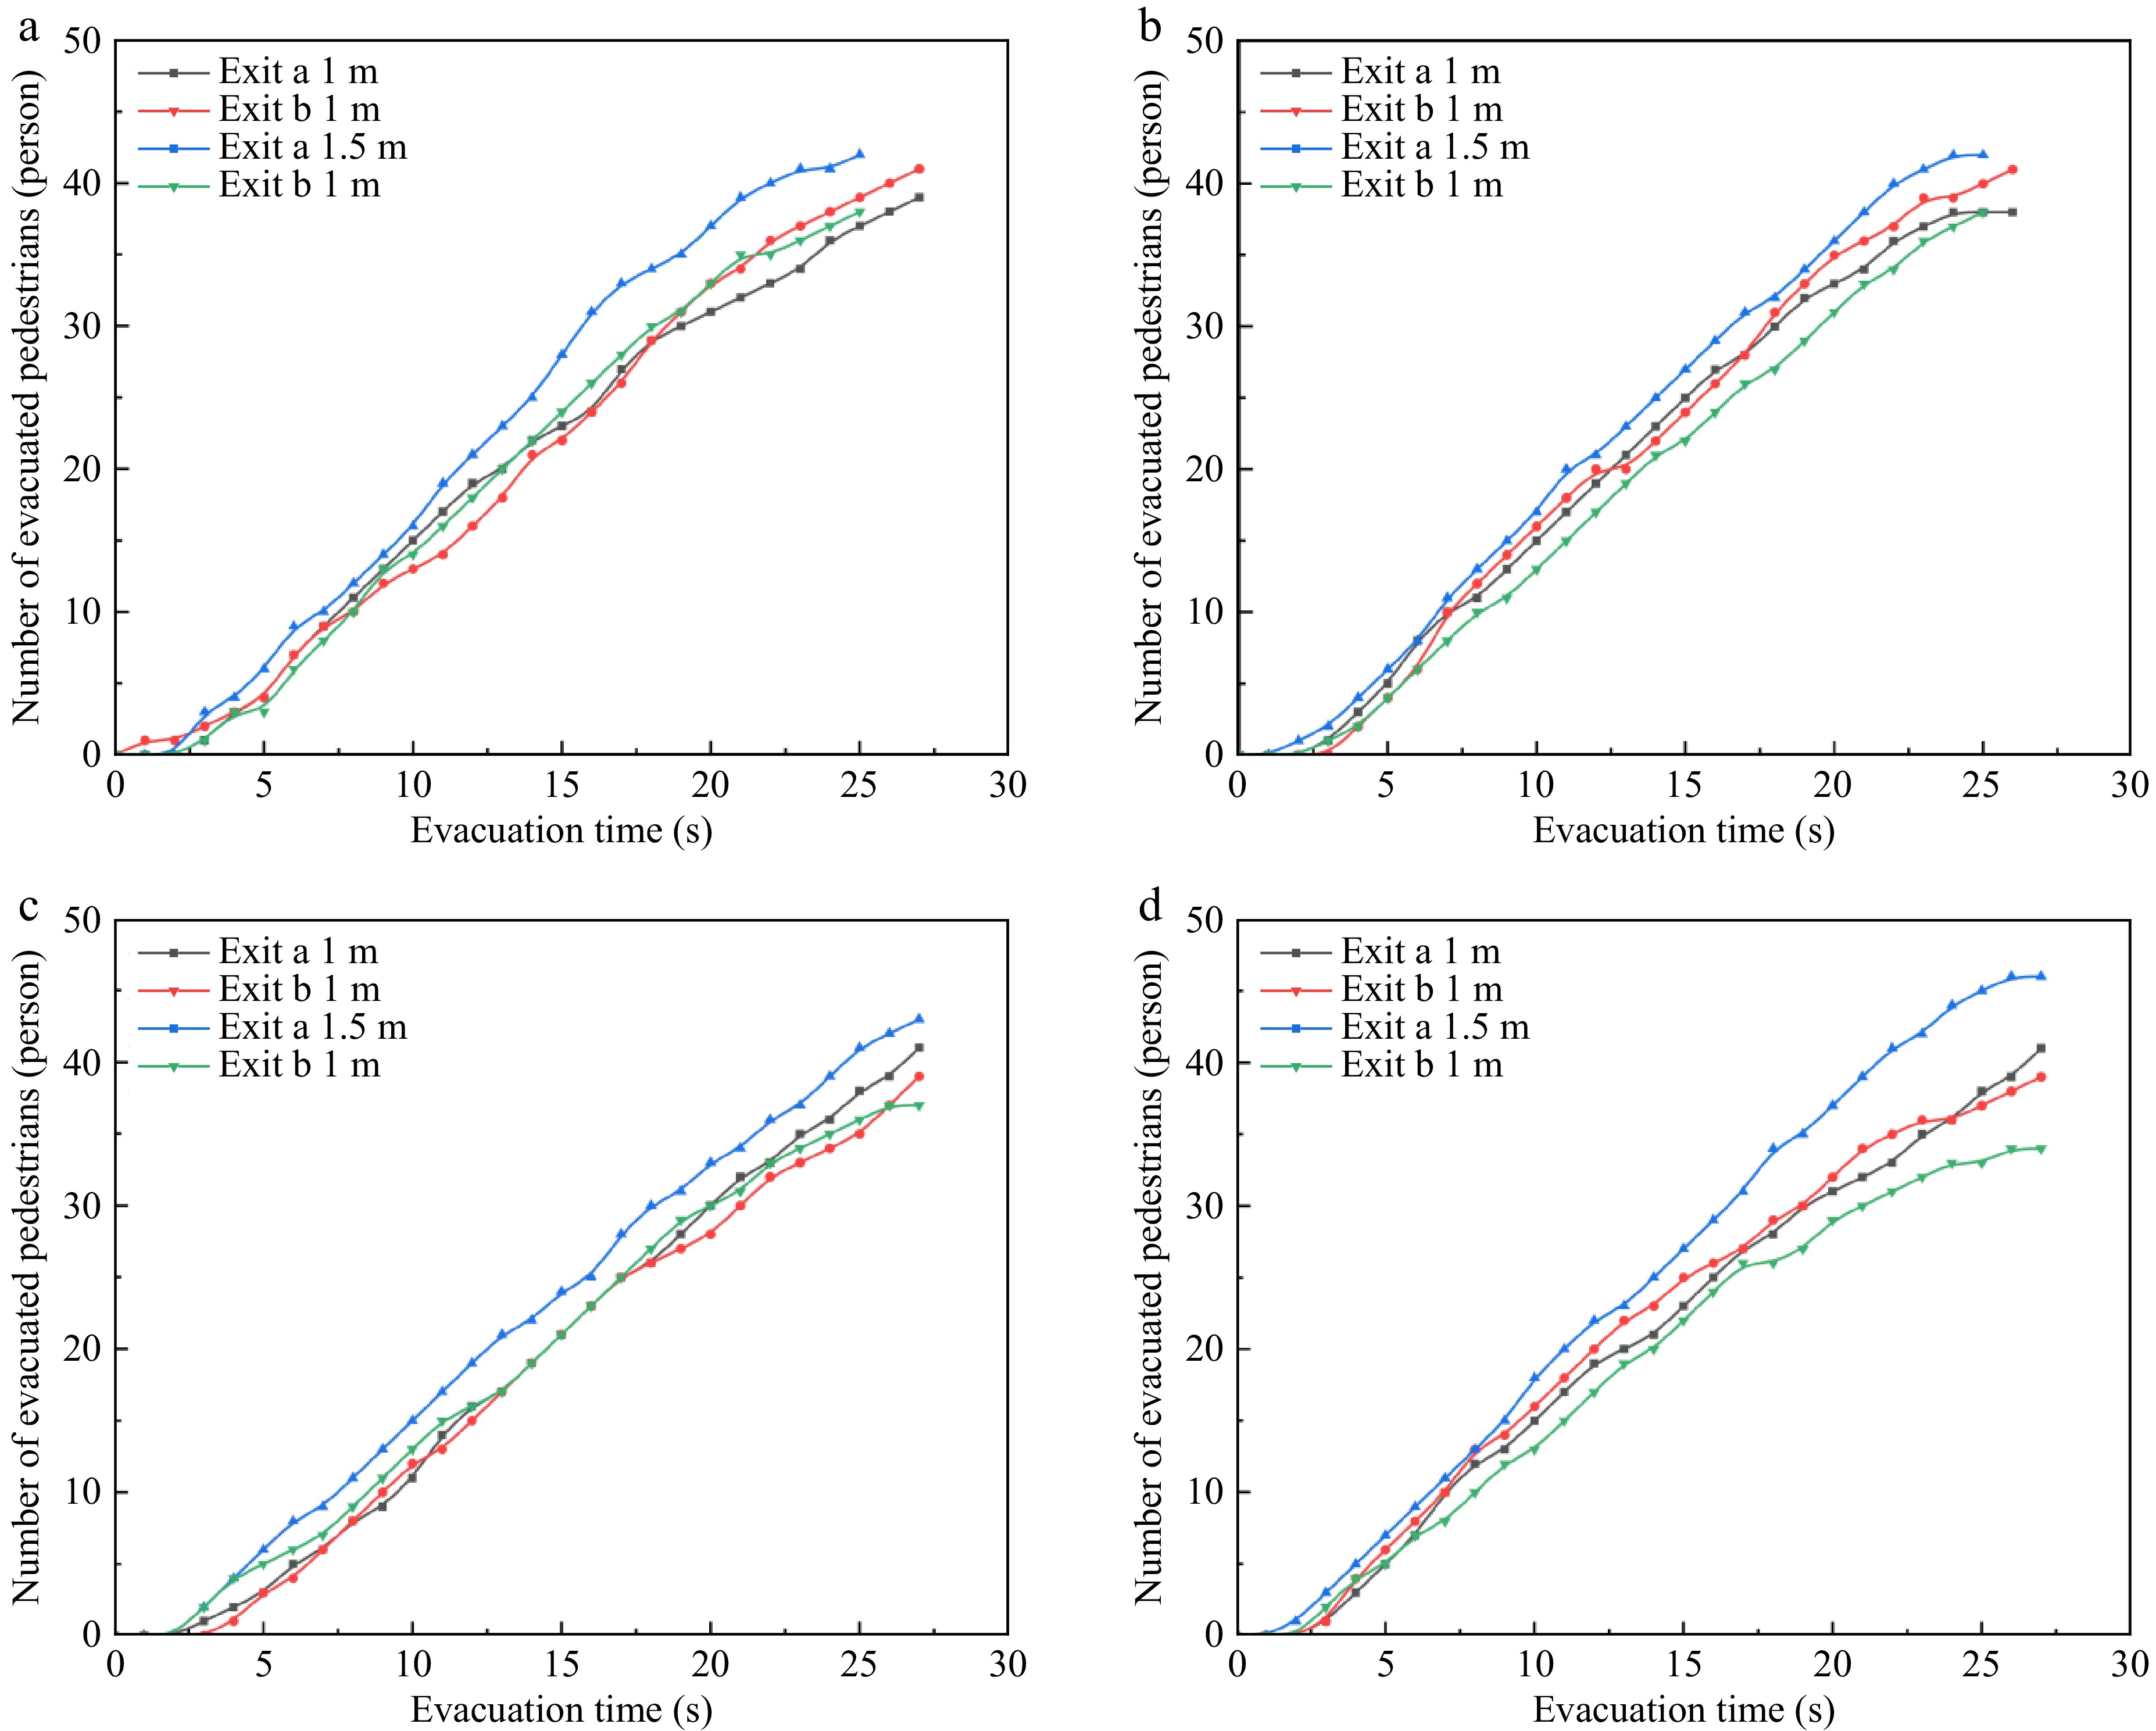
Figure 10.
Number of pedestrians evacuated with varying numbers of insensitive pedestrians ((a) 10, (b) 20, (c) 30, (d) 40) at two exits under Scenario 2.
-
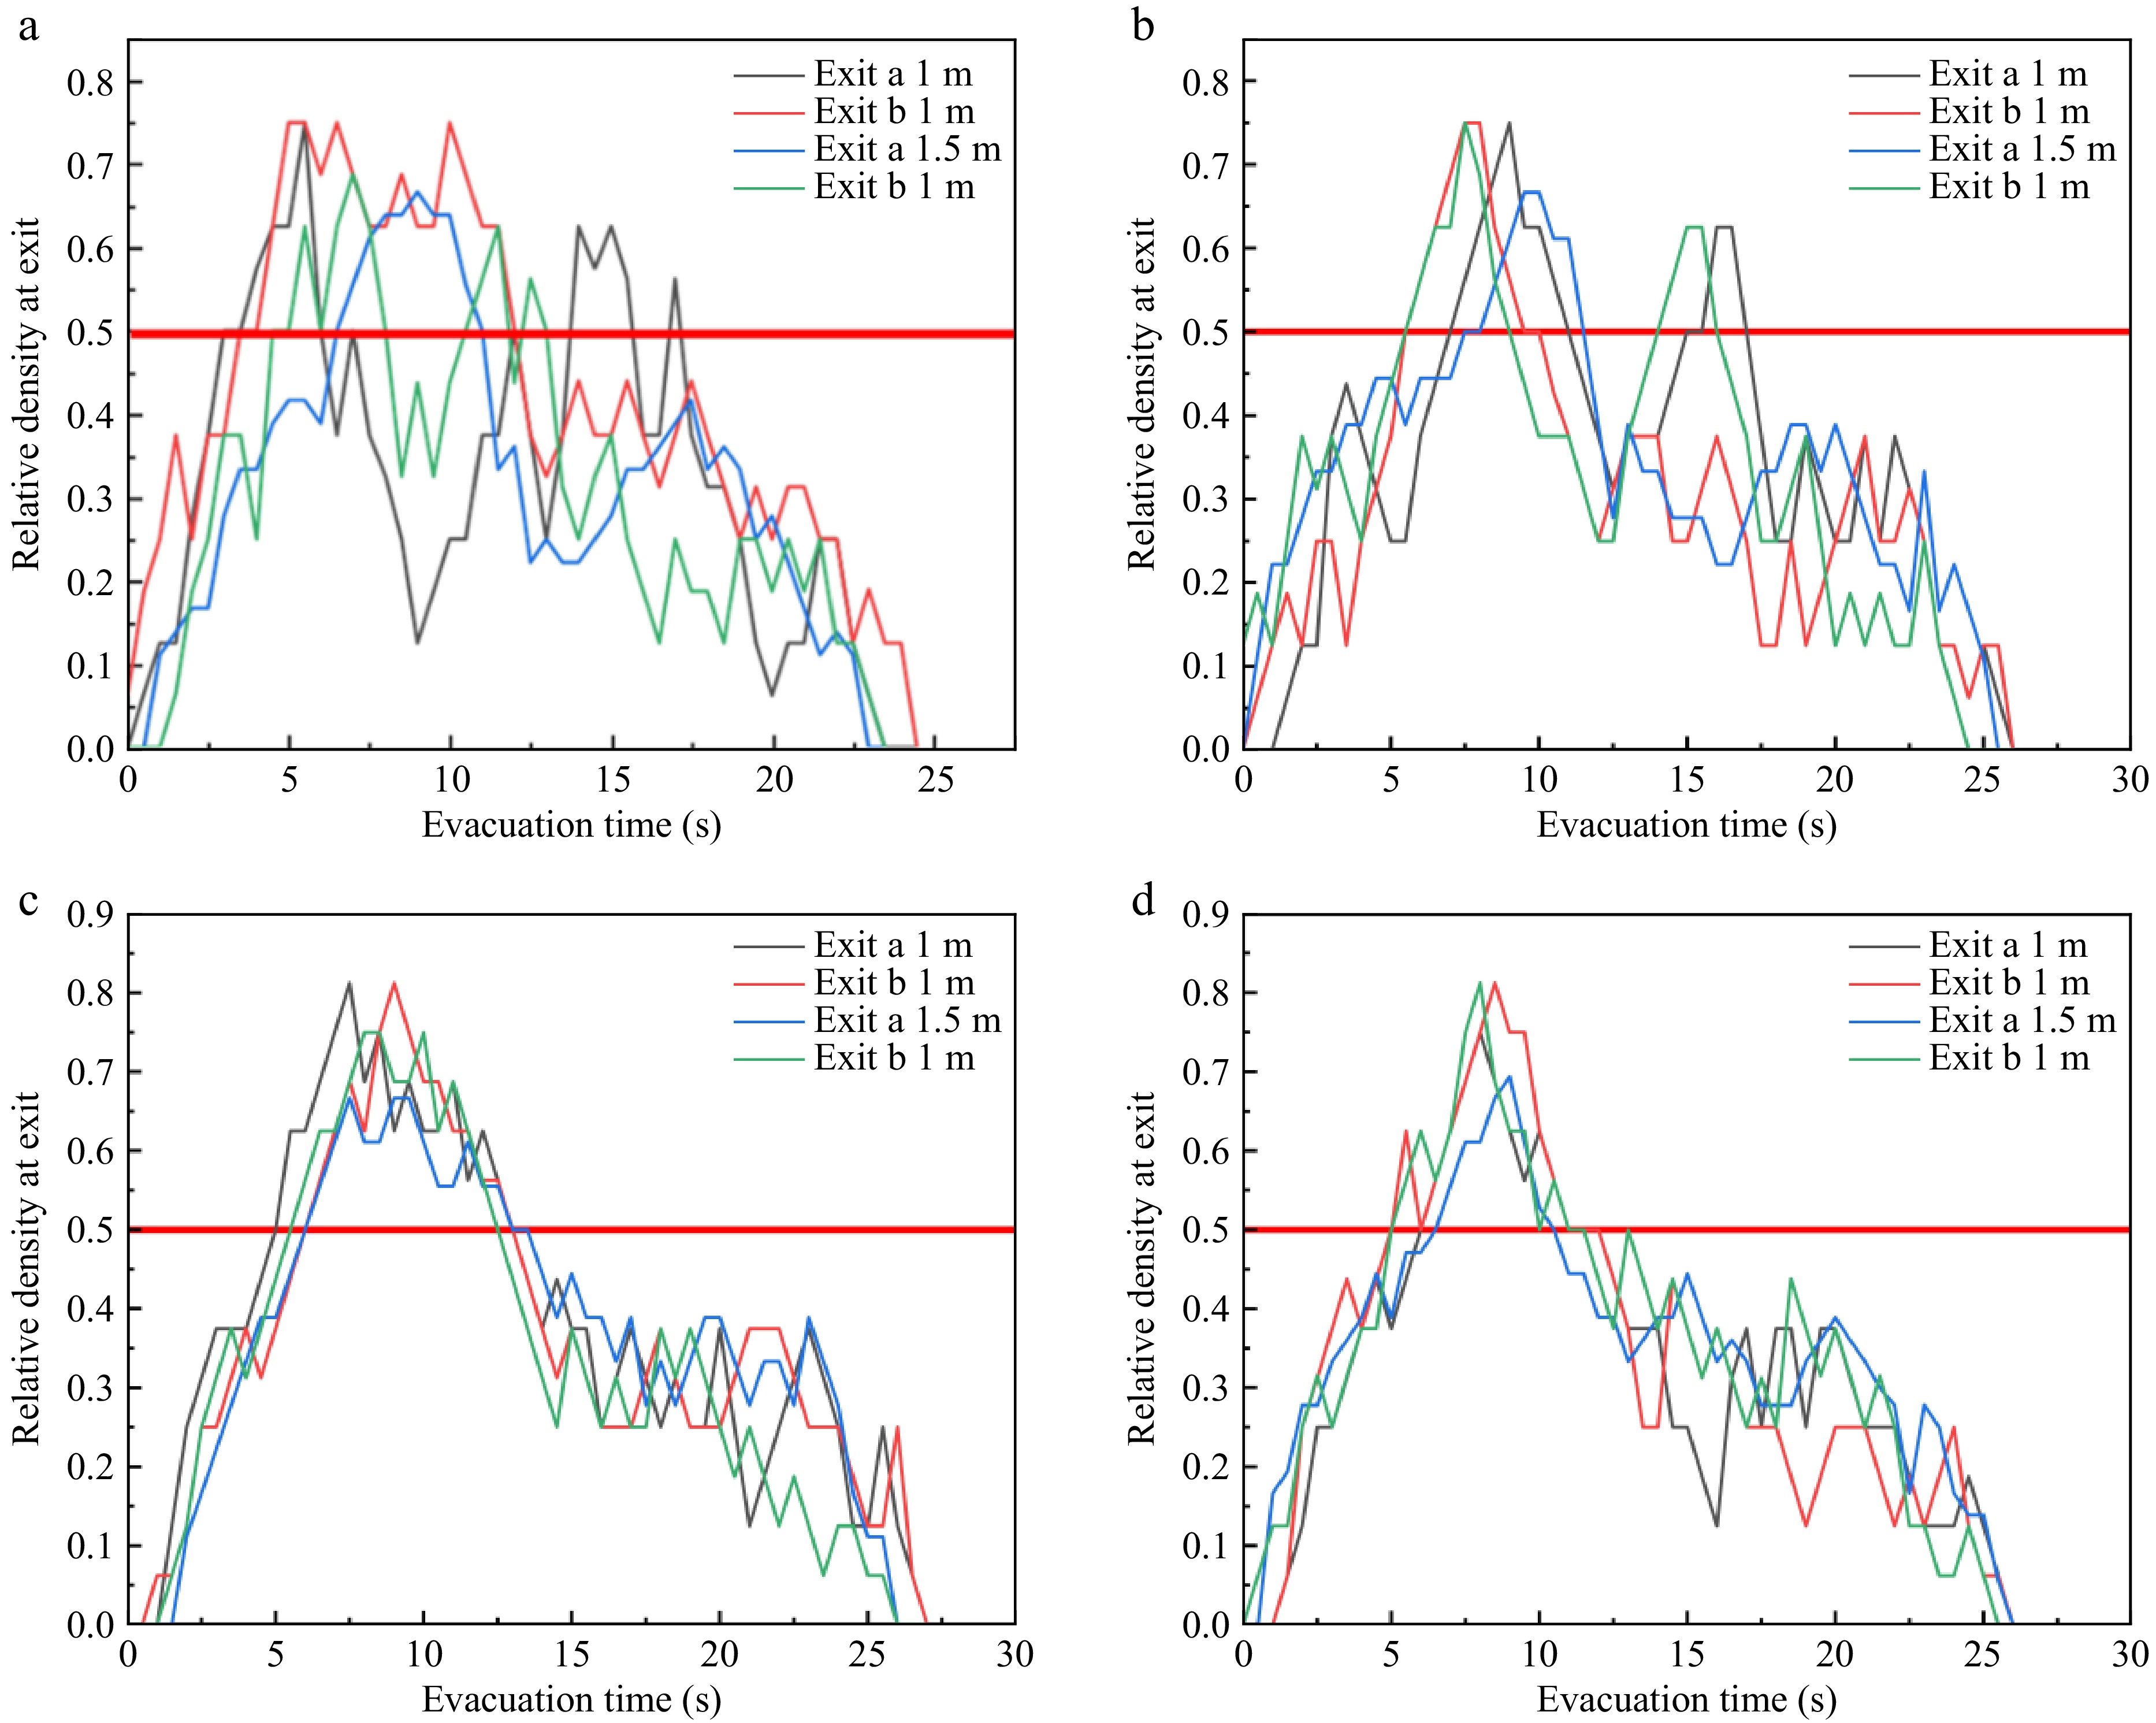
Figure 11.
Relative pedestrian density with varying numbers of insensitive pedestrians ((a) 10, (b) 20, (c) 30, (d) 40) at two exits under Scenario 2.
-
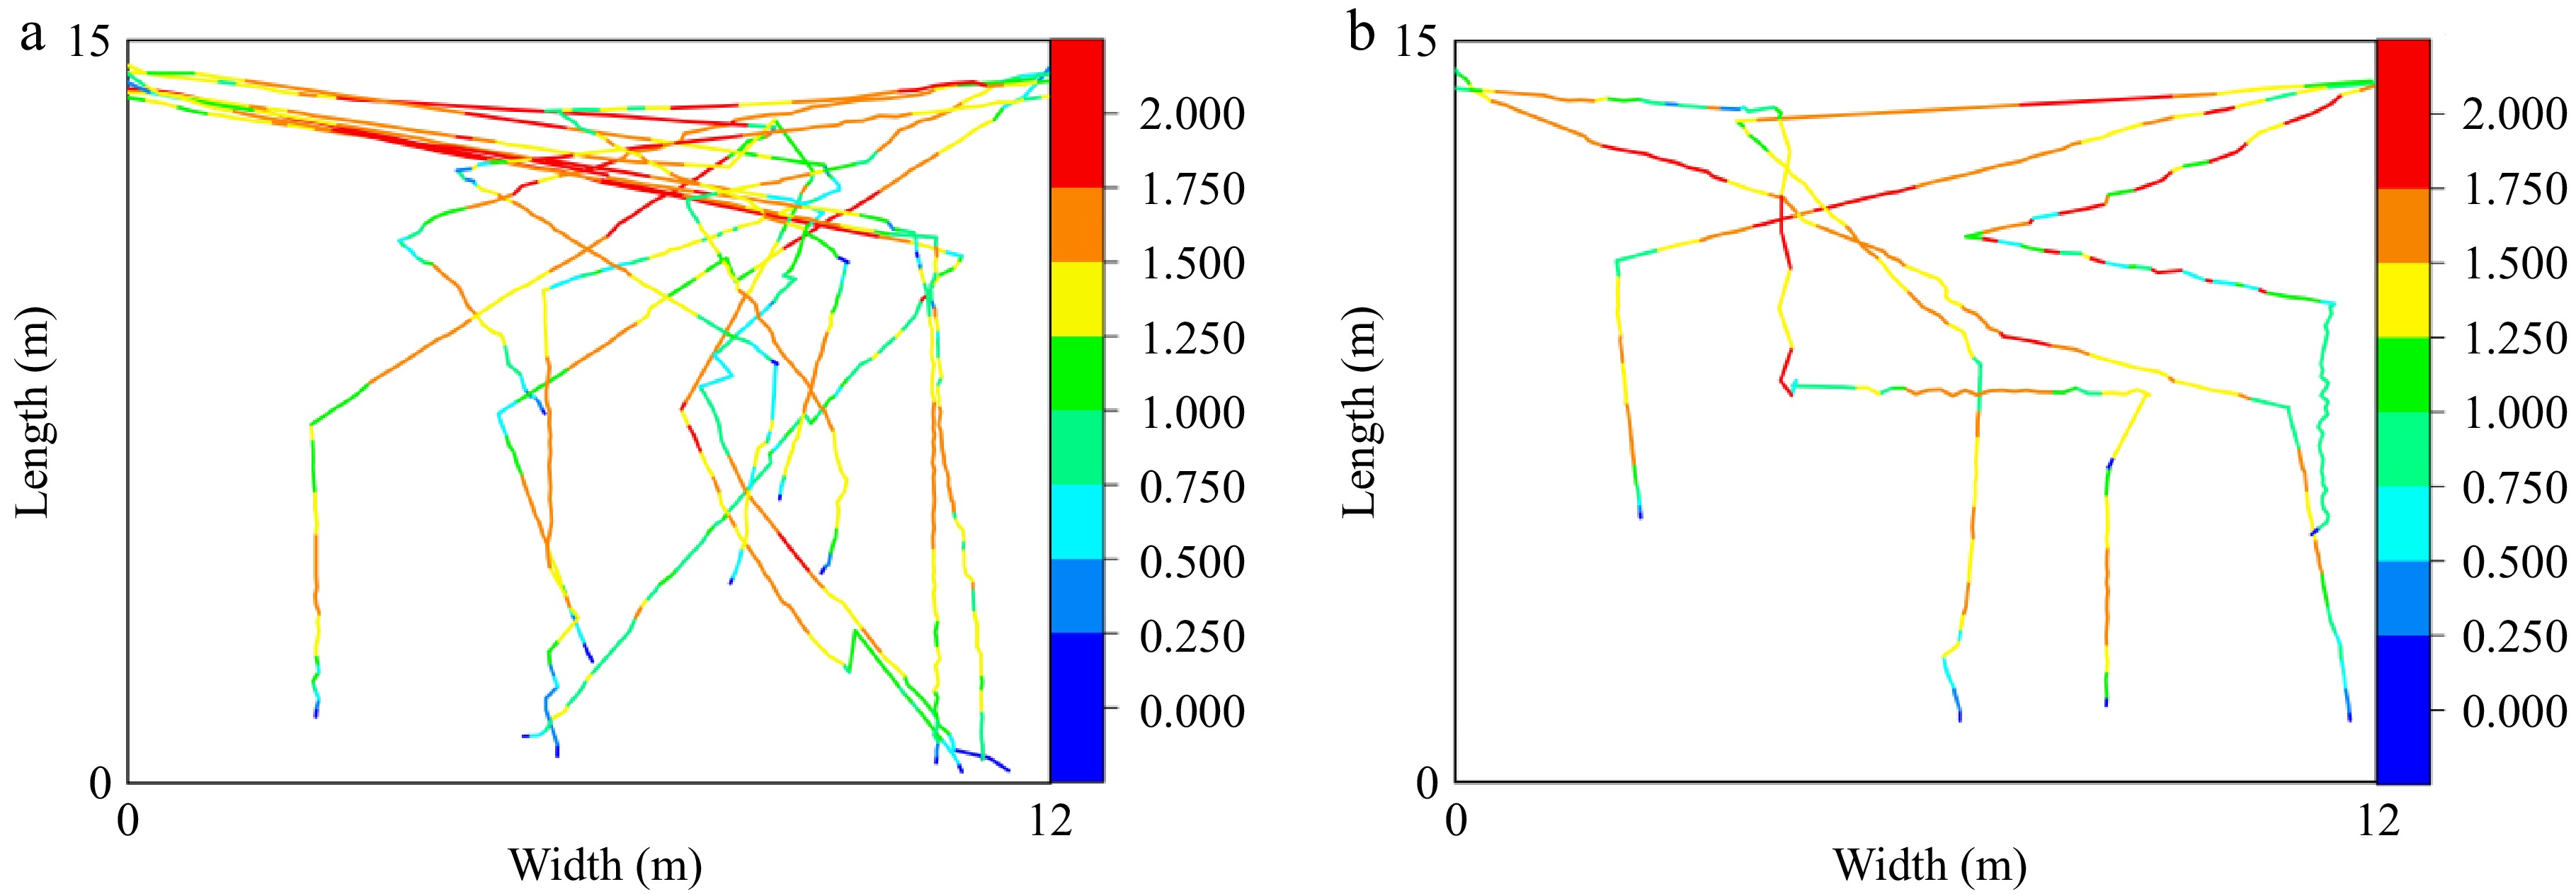
Figure 12.
The trajectory map of the exit re-selection for sensitive pedestrians under varying numbers of insensitive pedestrians ((a) 20, (b) 40) at two exits under Scenario 2.
-
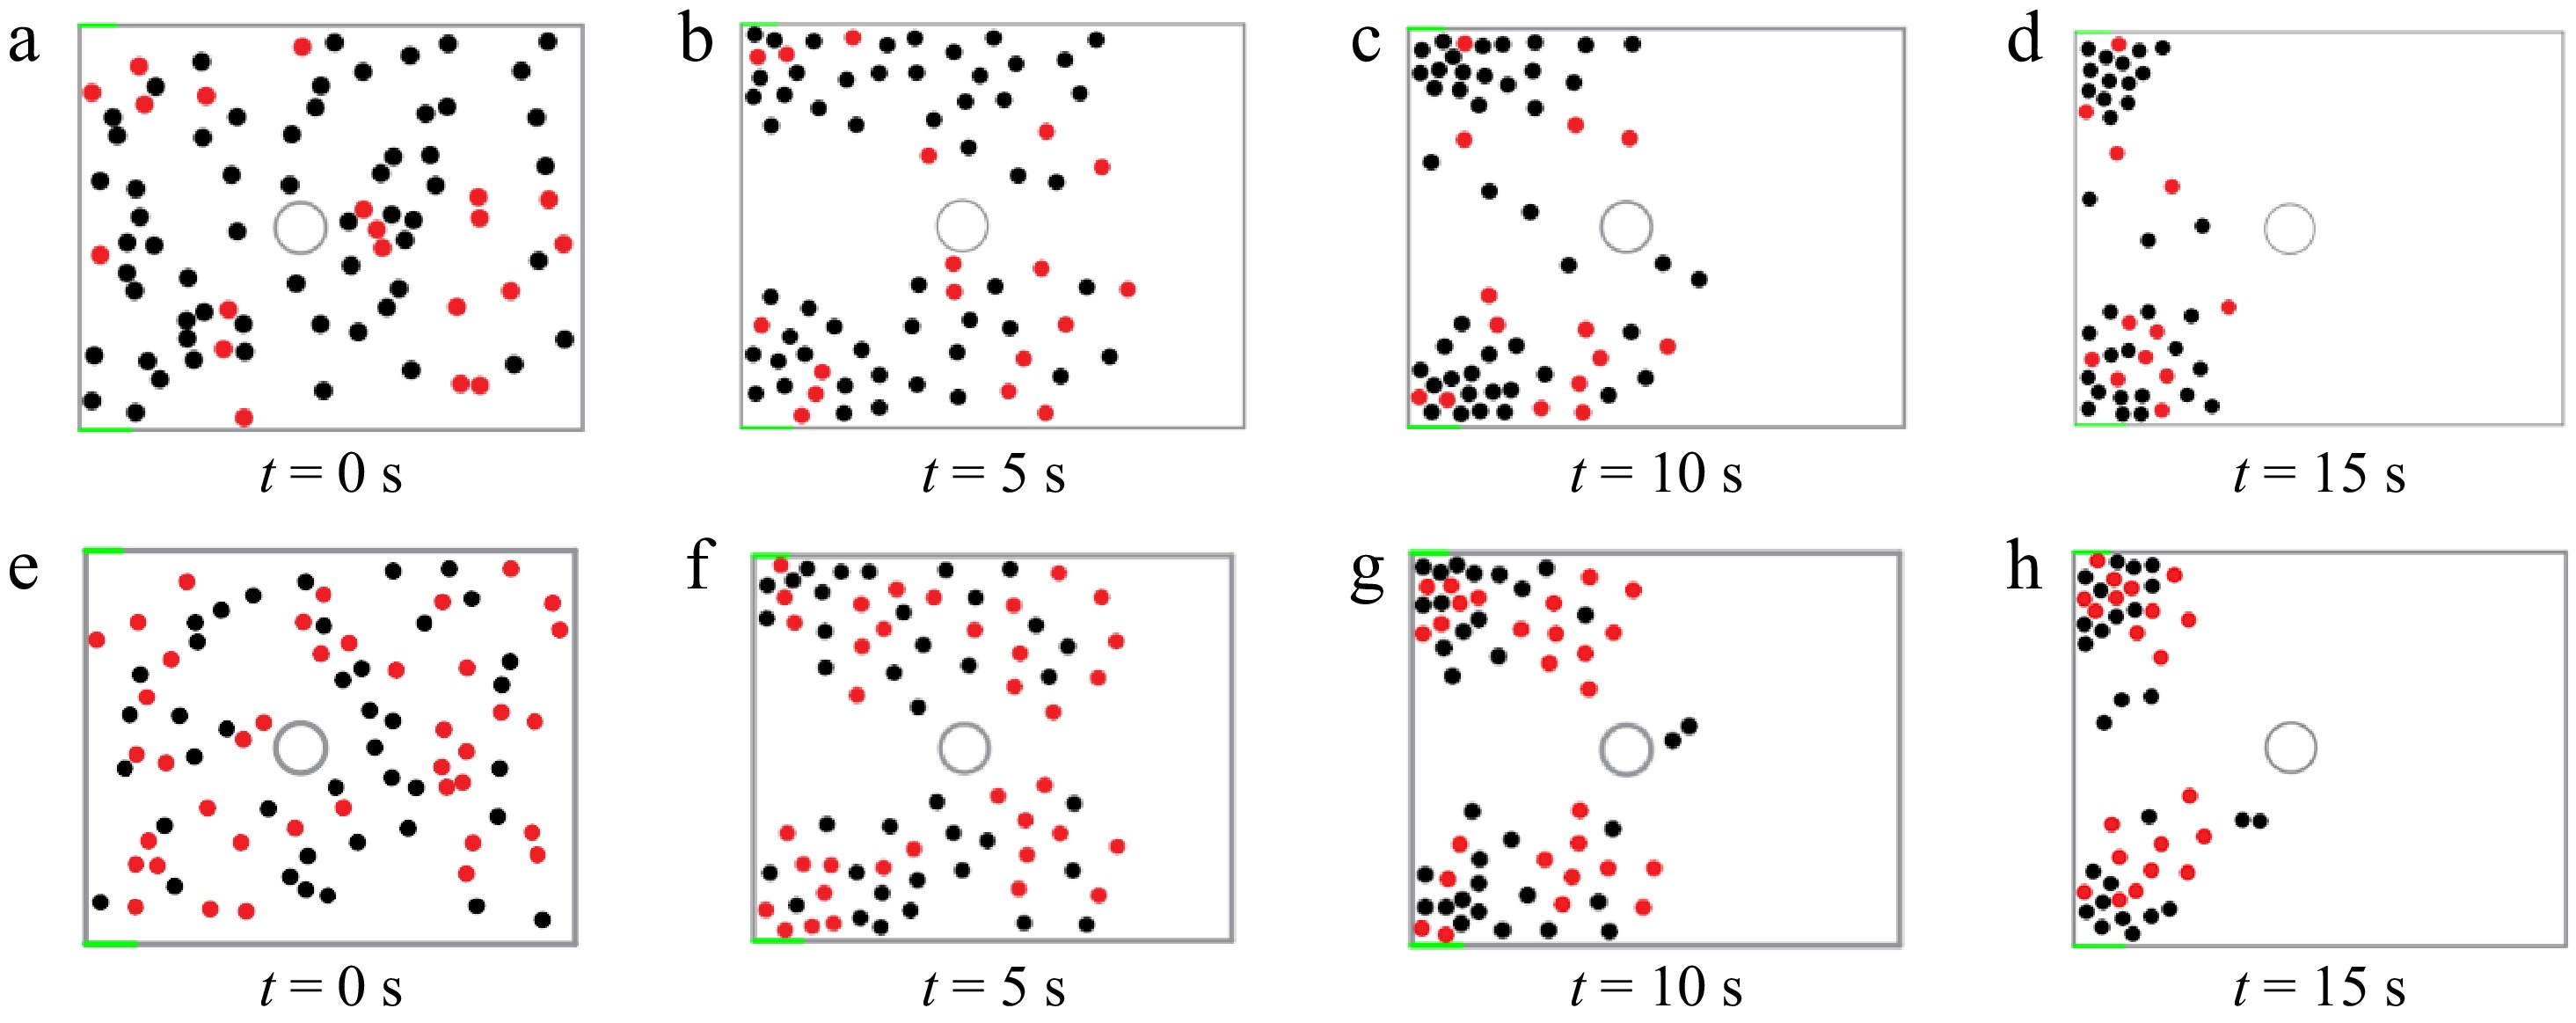
Figure 13.
Simulation diagram of pedestrian dynamic distribution at different time points, with sensitive and insensitive pedestrians are represented in black and red, respectively.
-
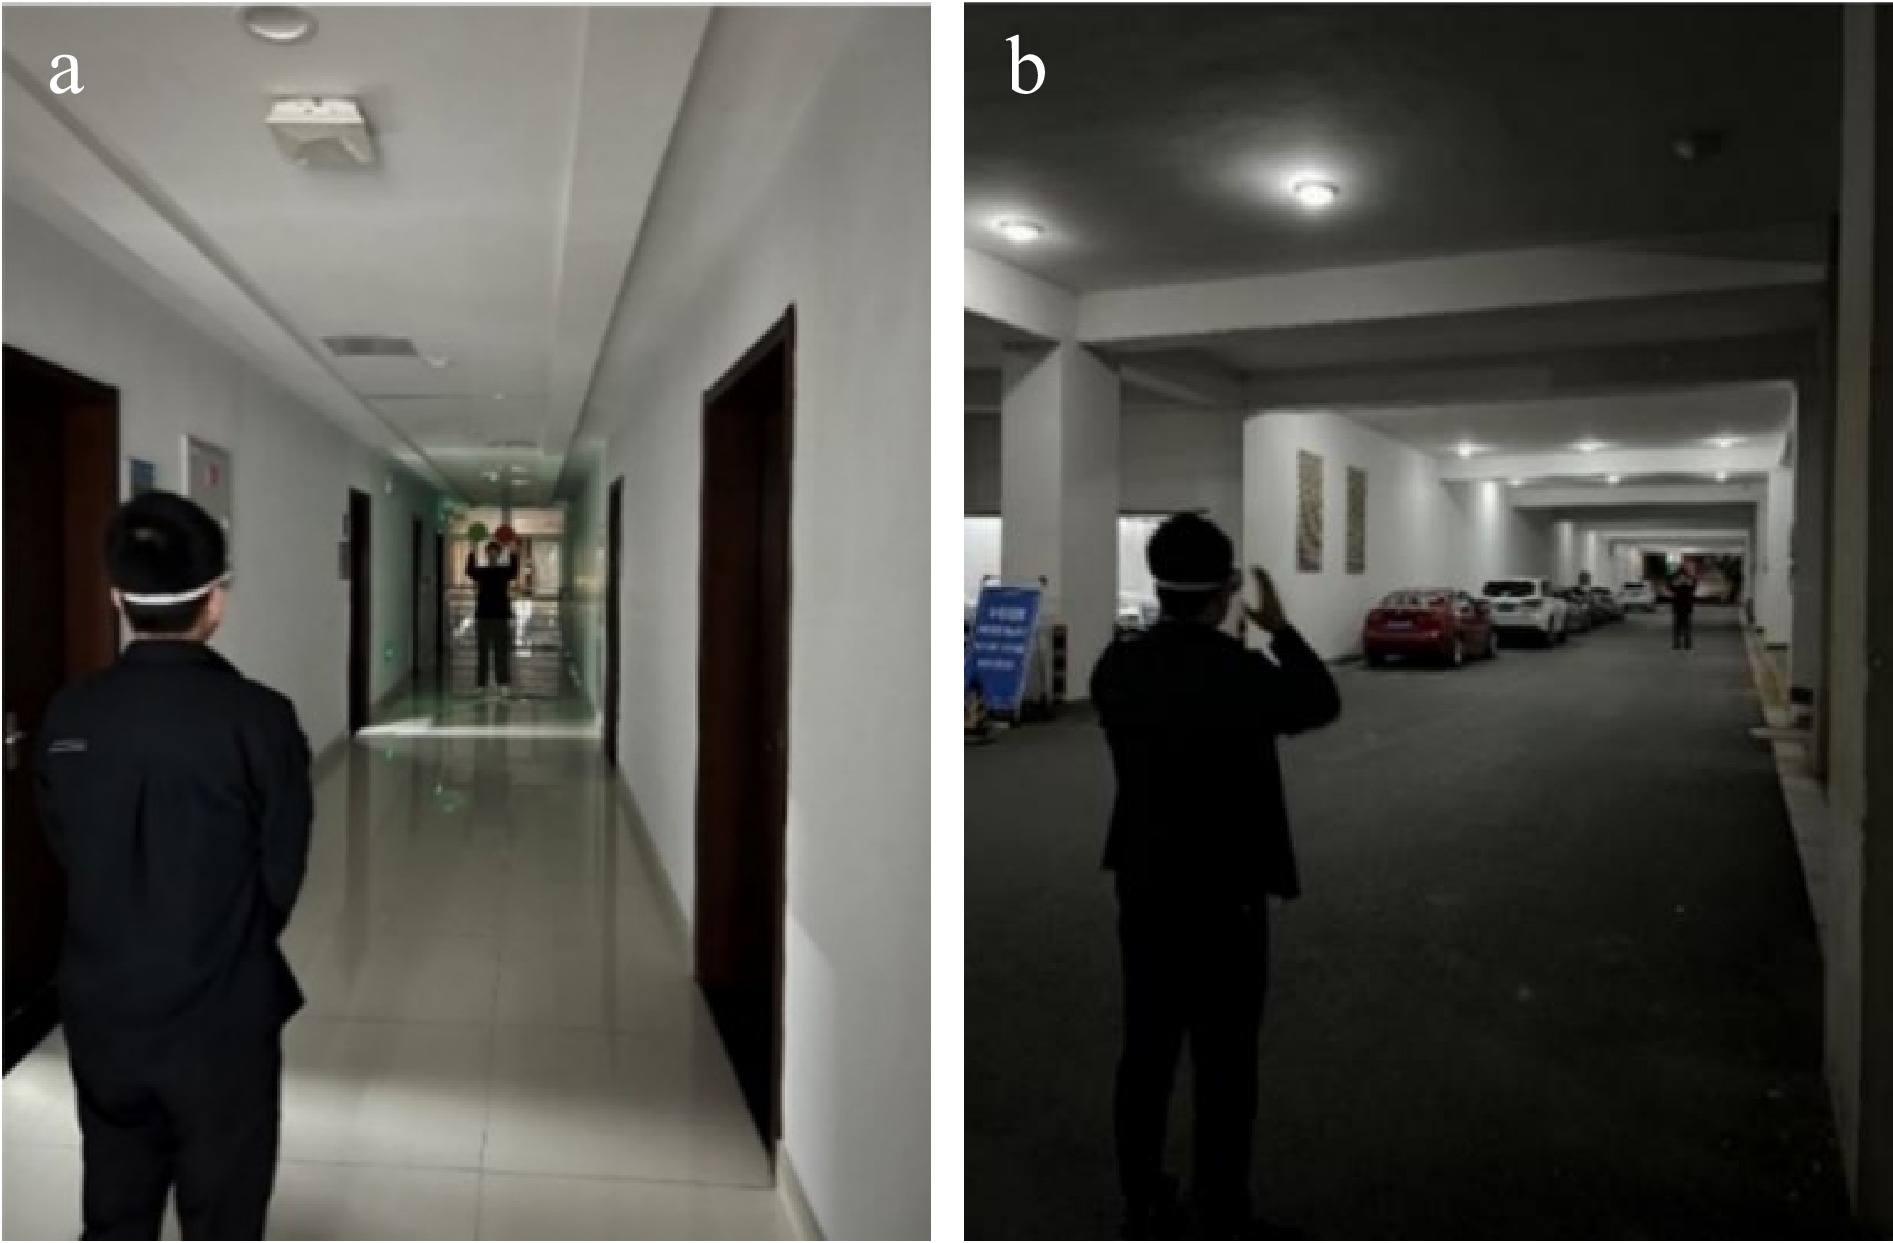
Figure 14.
Limit distance test with 50% opacity glasses: (a) hallway, (b) parking.
-
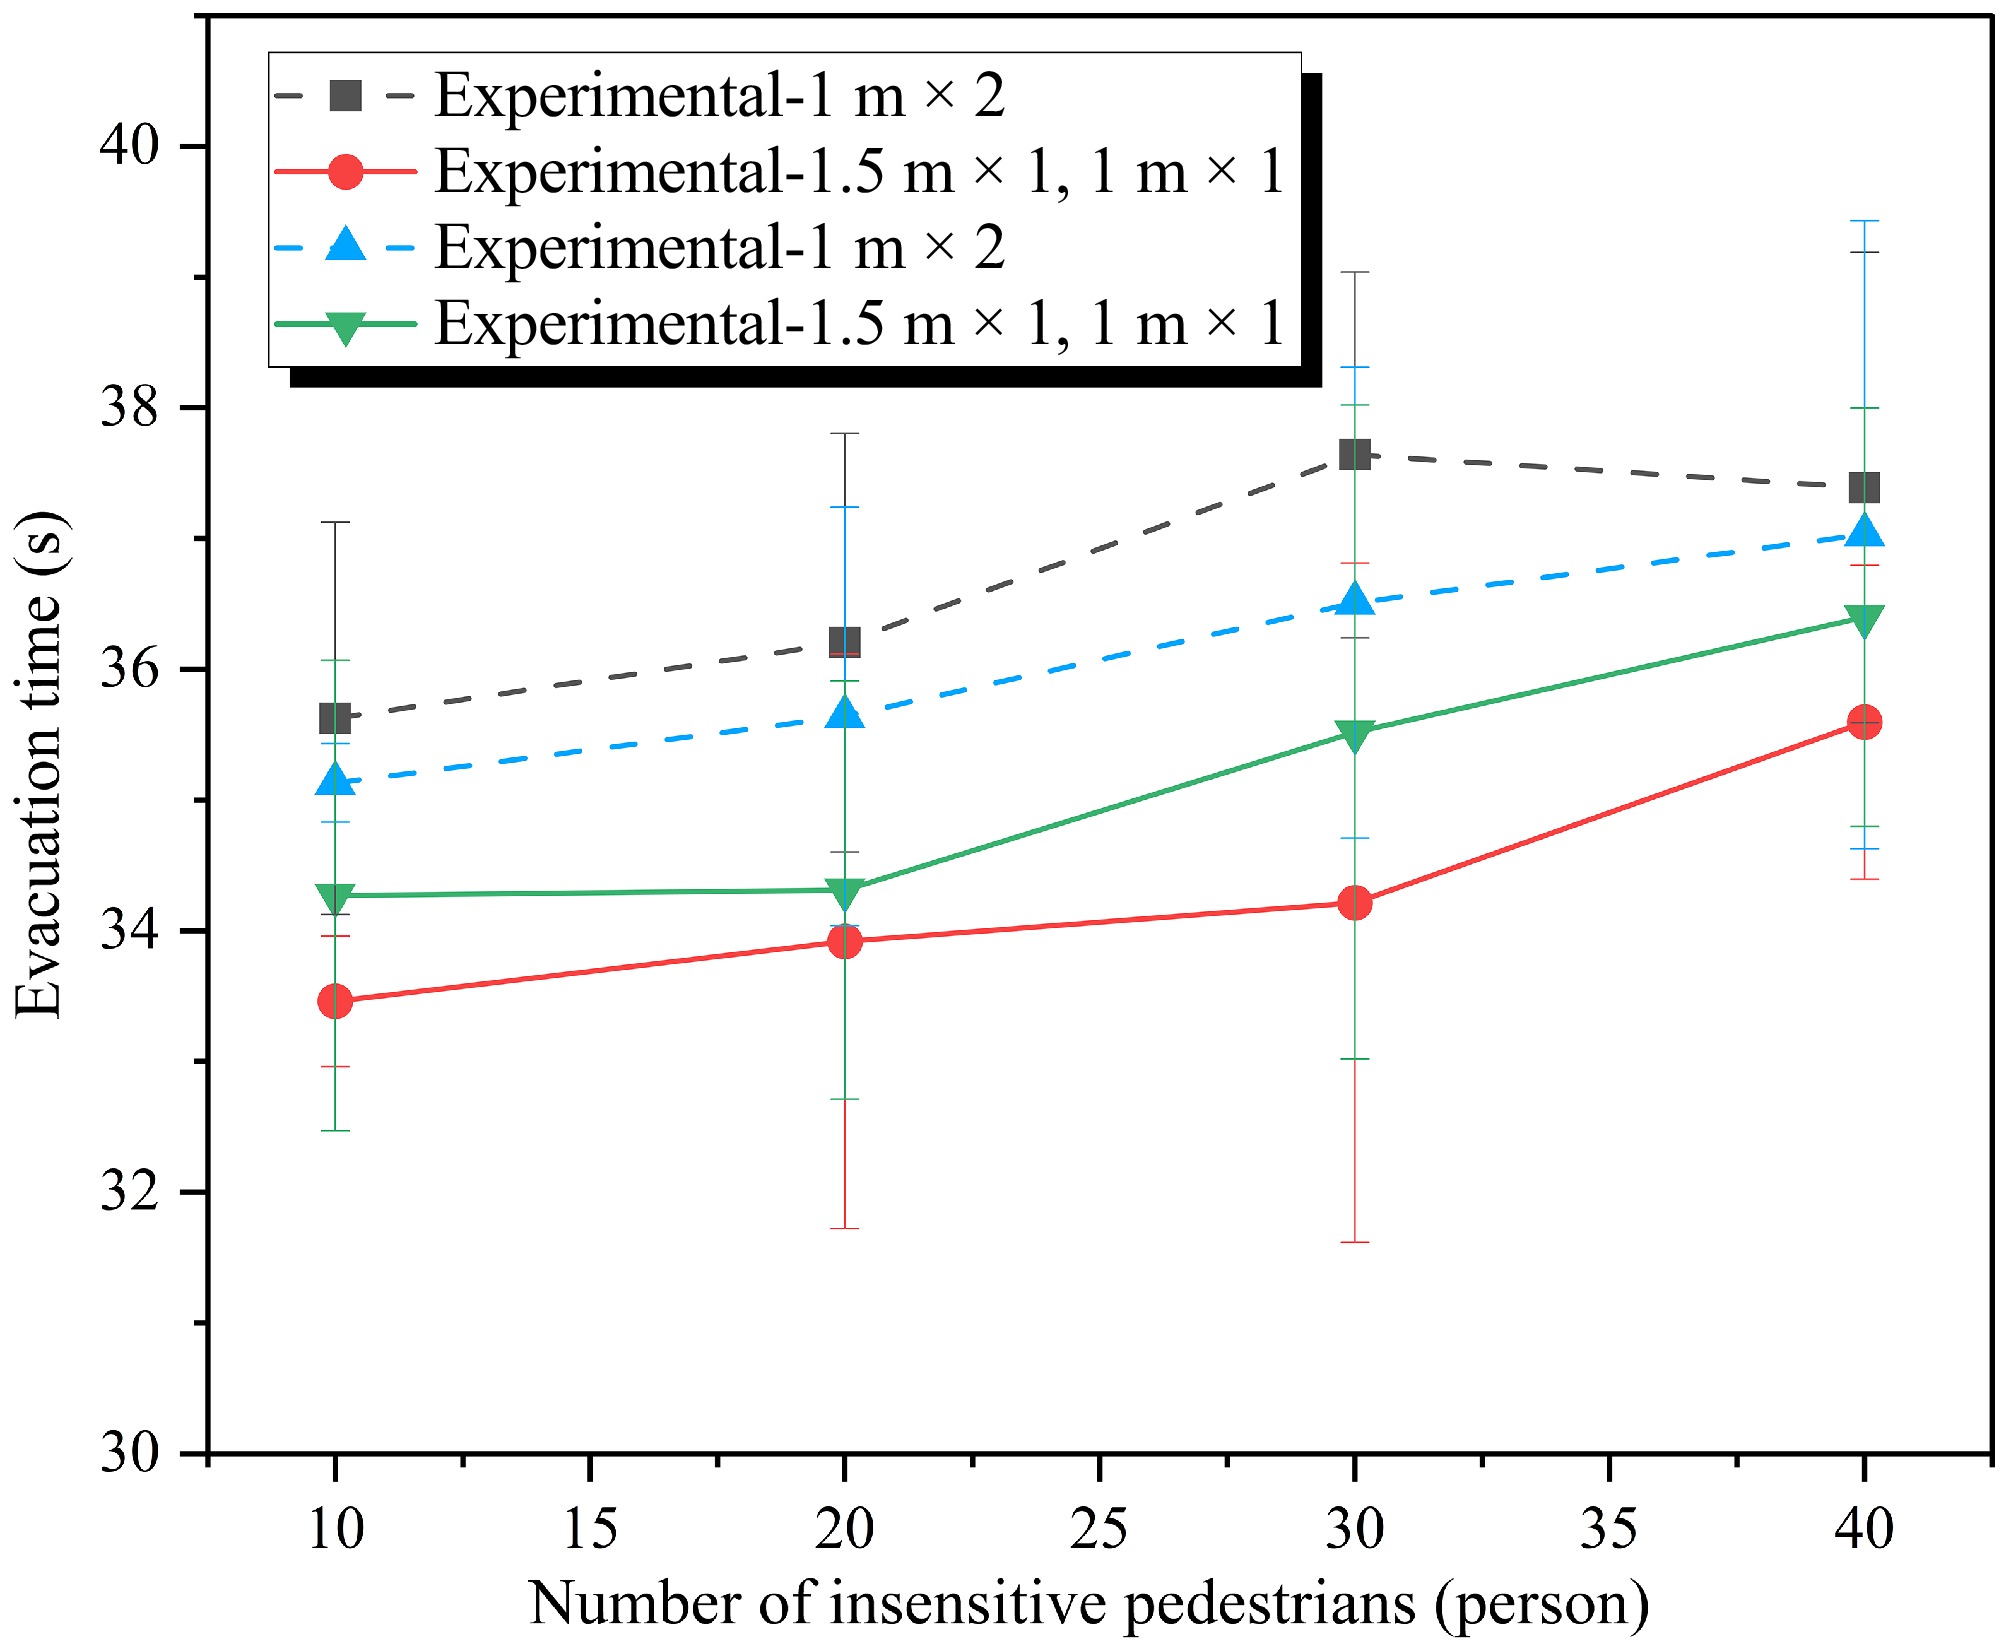
Figure 15.
Scenario 3 experimental and simulation results.
-
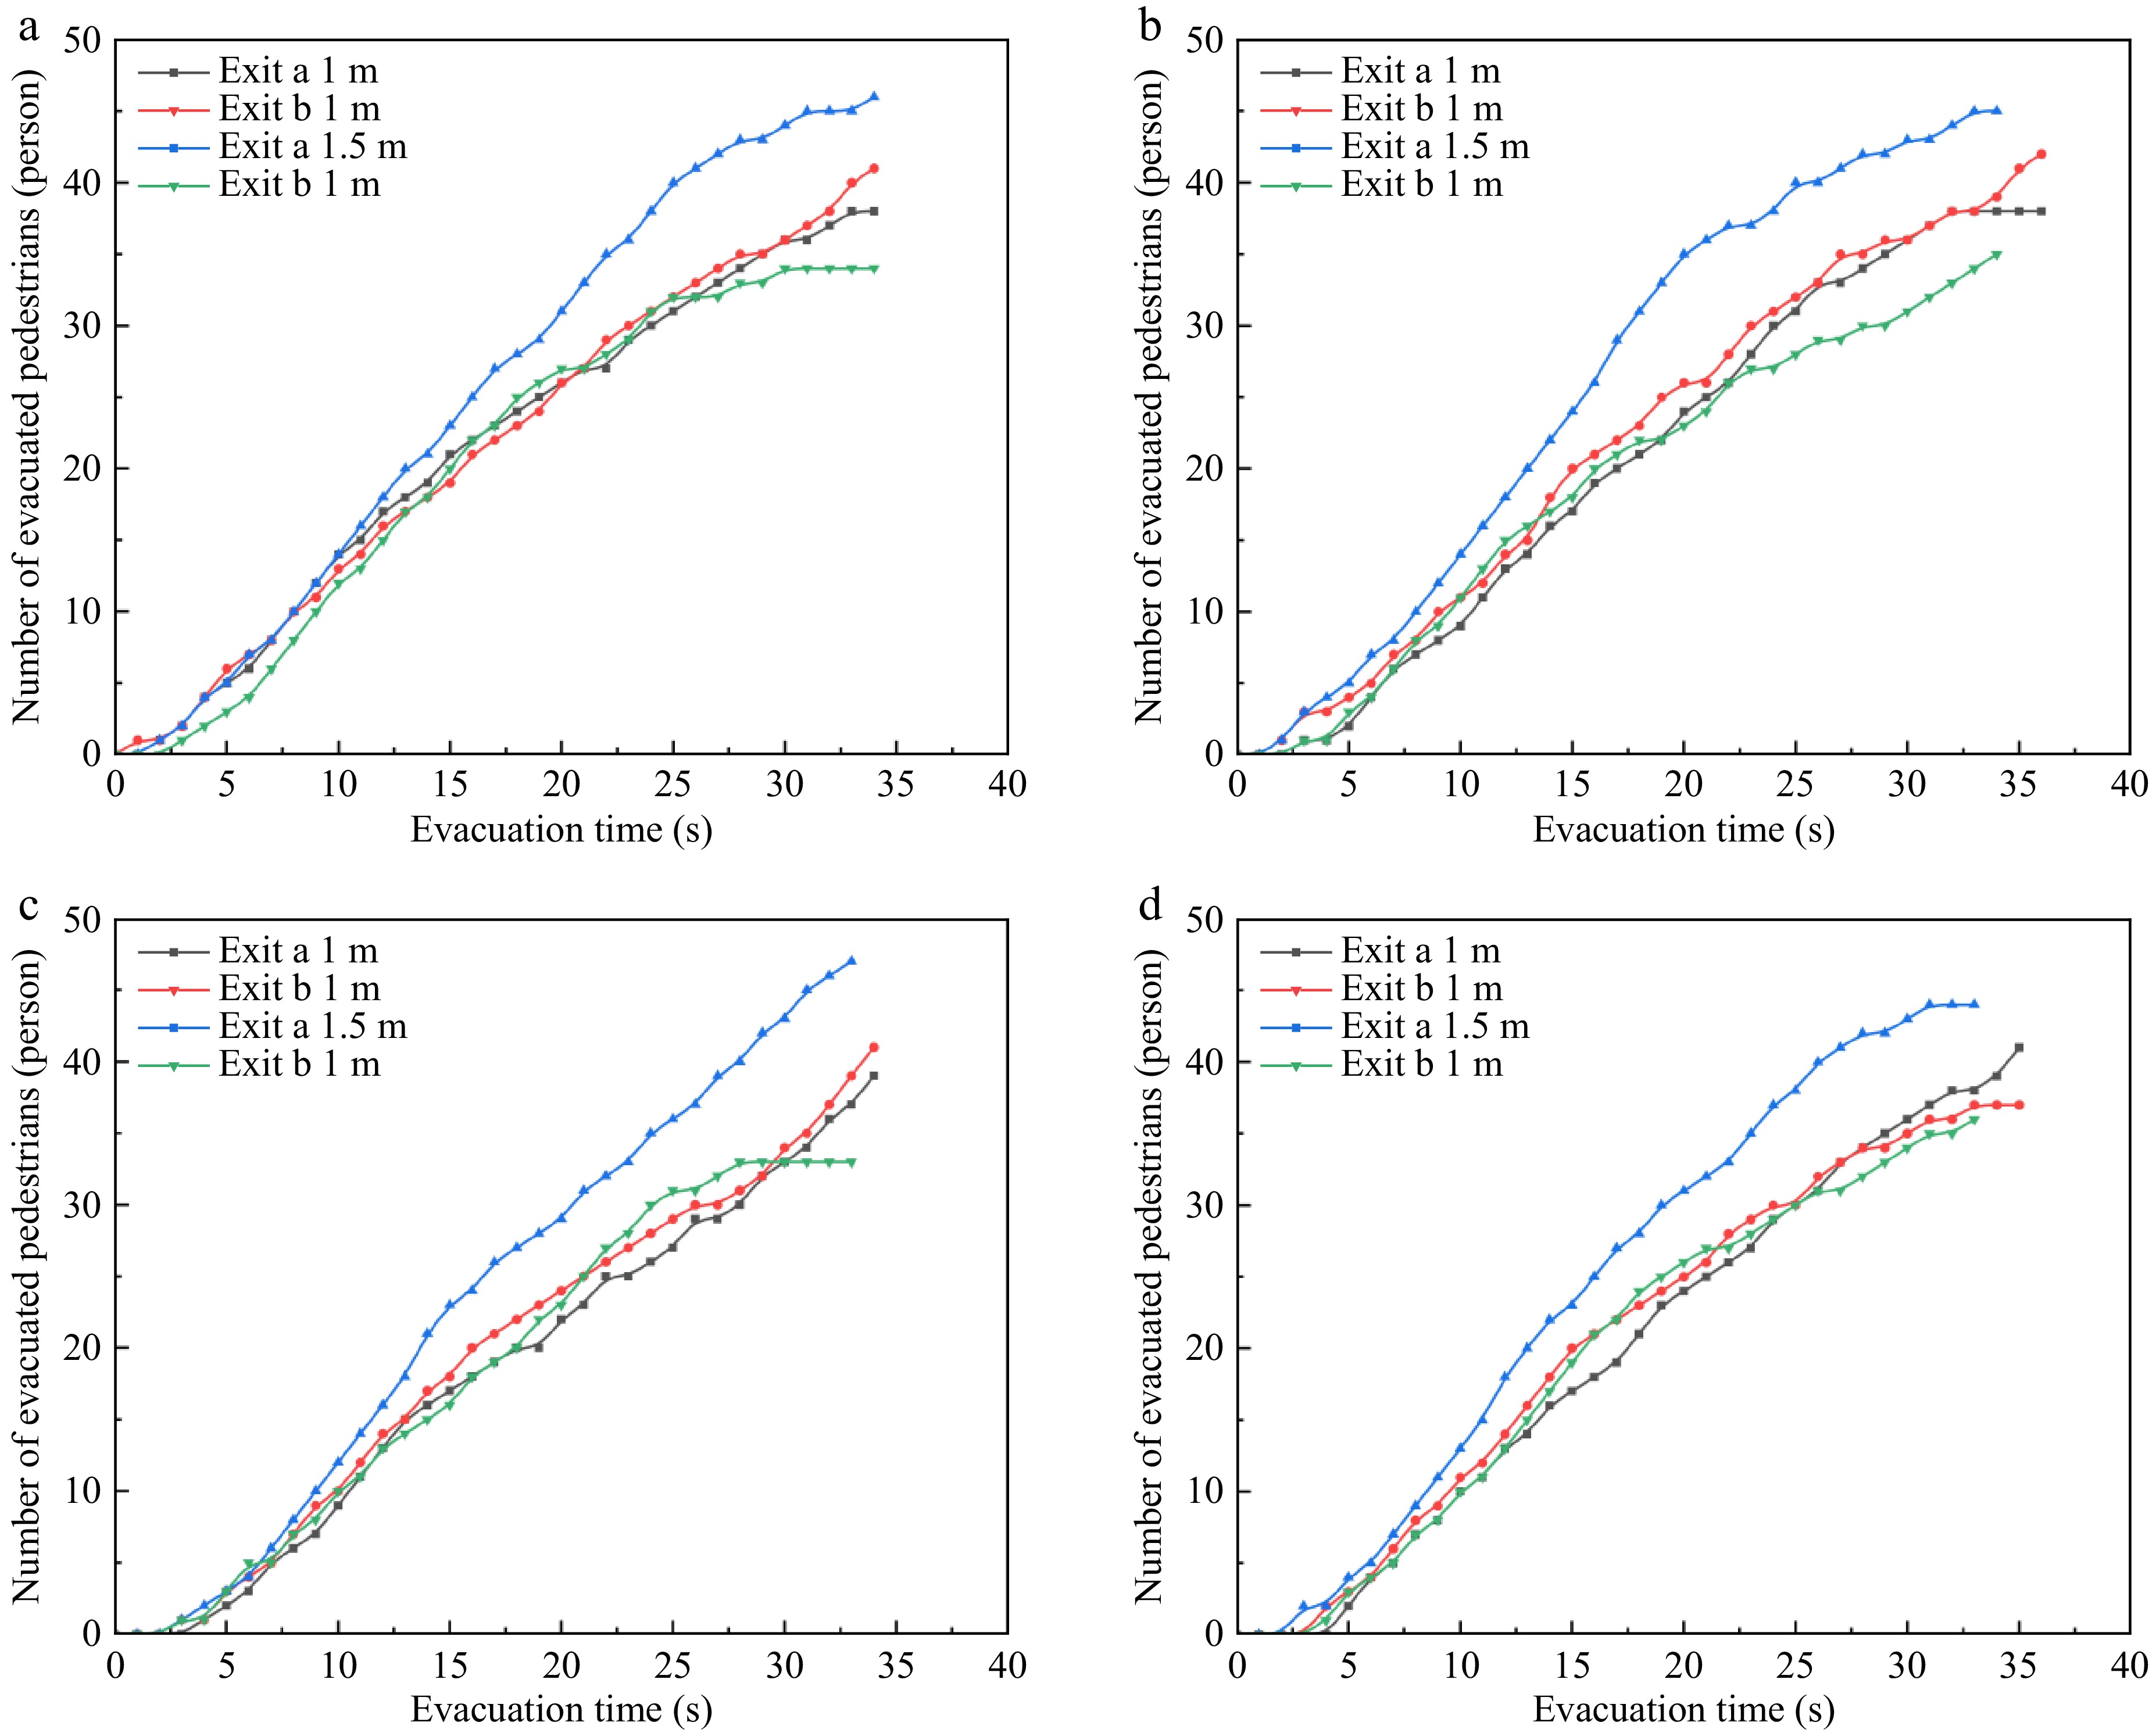
Figure 16.
Number of pedestrians evacuated with varying numbers of insensitive pedestrians ((a) 10, (b) 20, (c) 30, (d) 40) at two exits under Scenario 3.
-
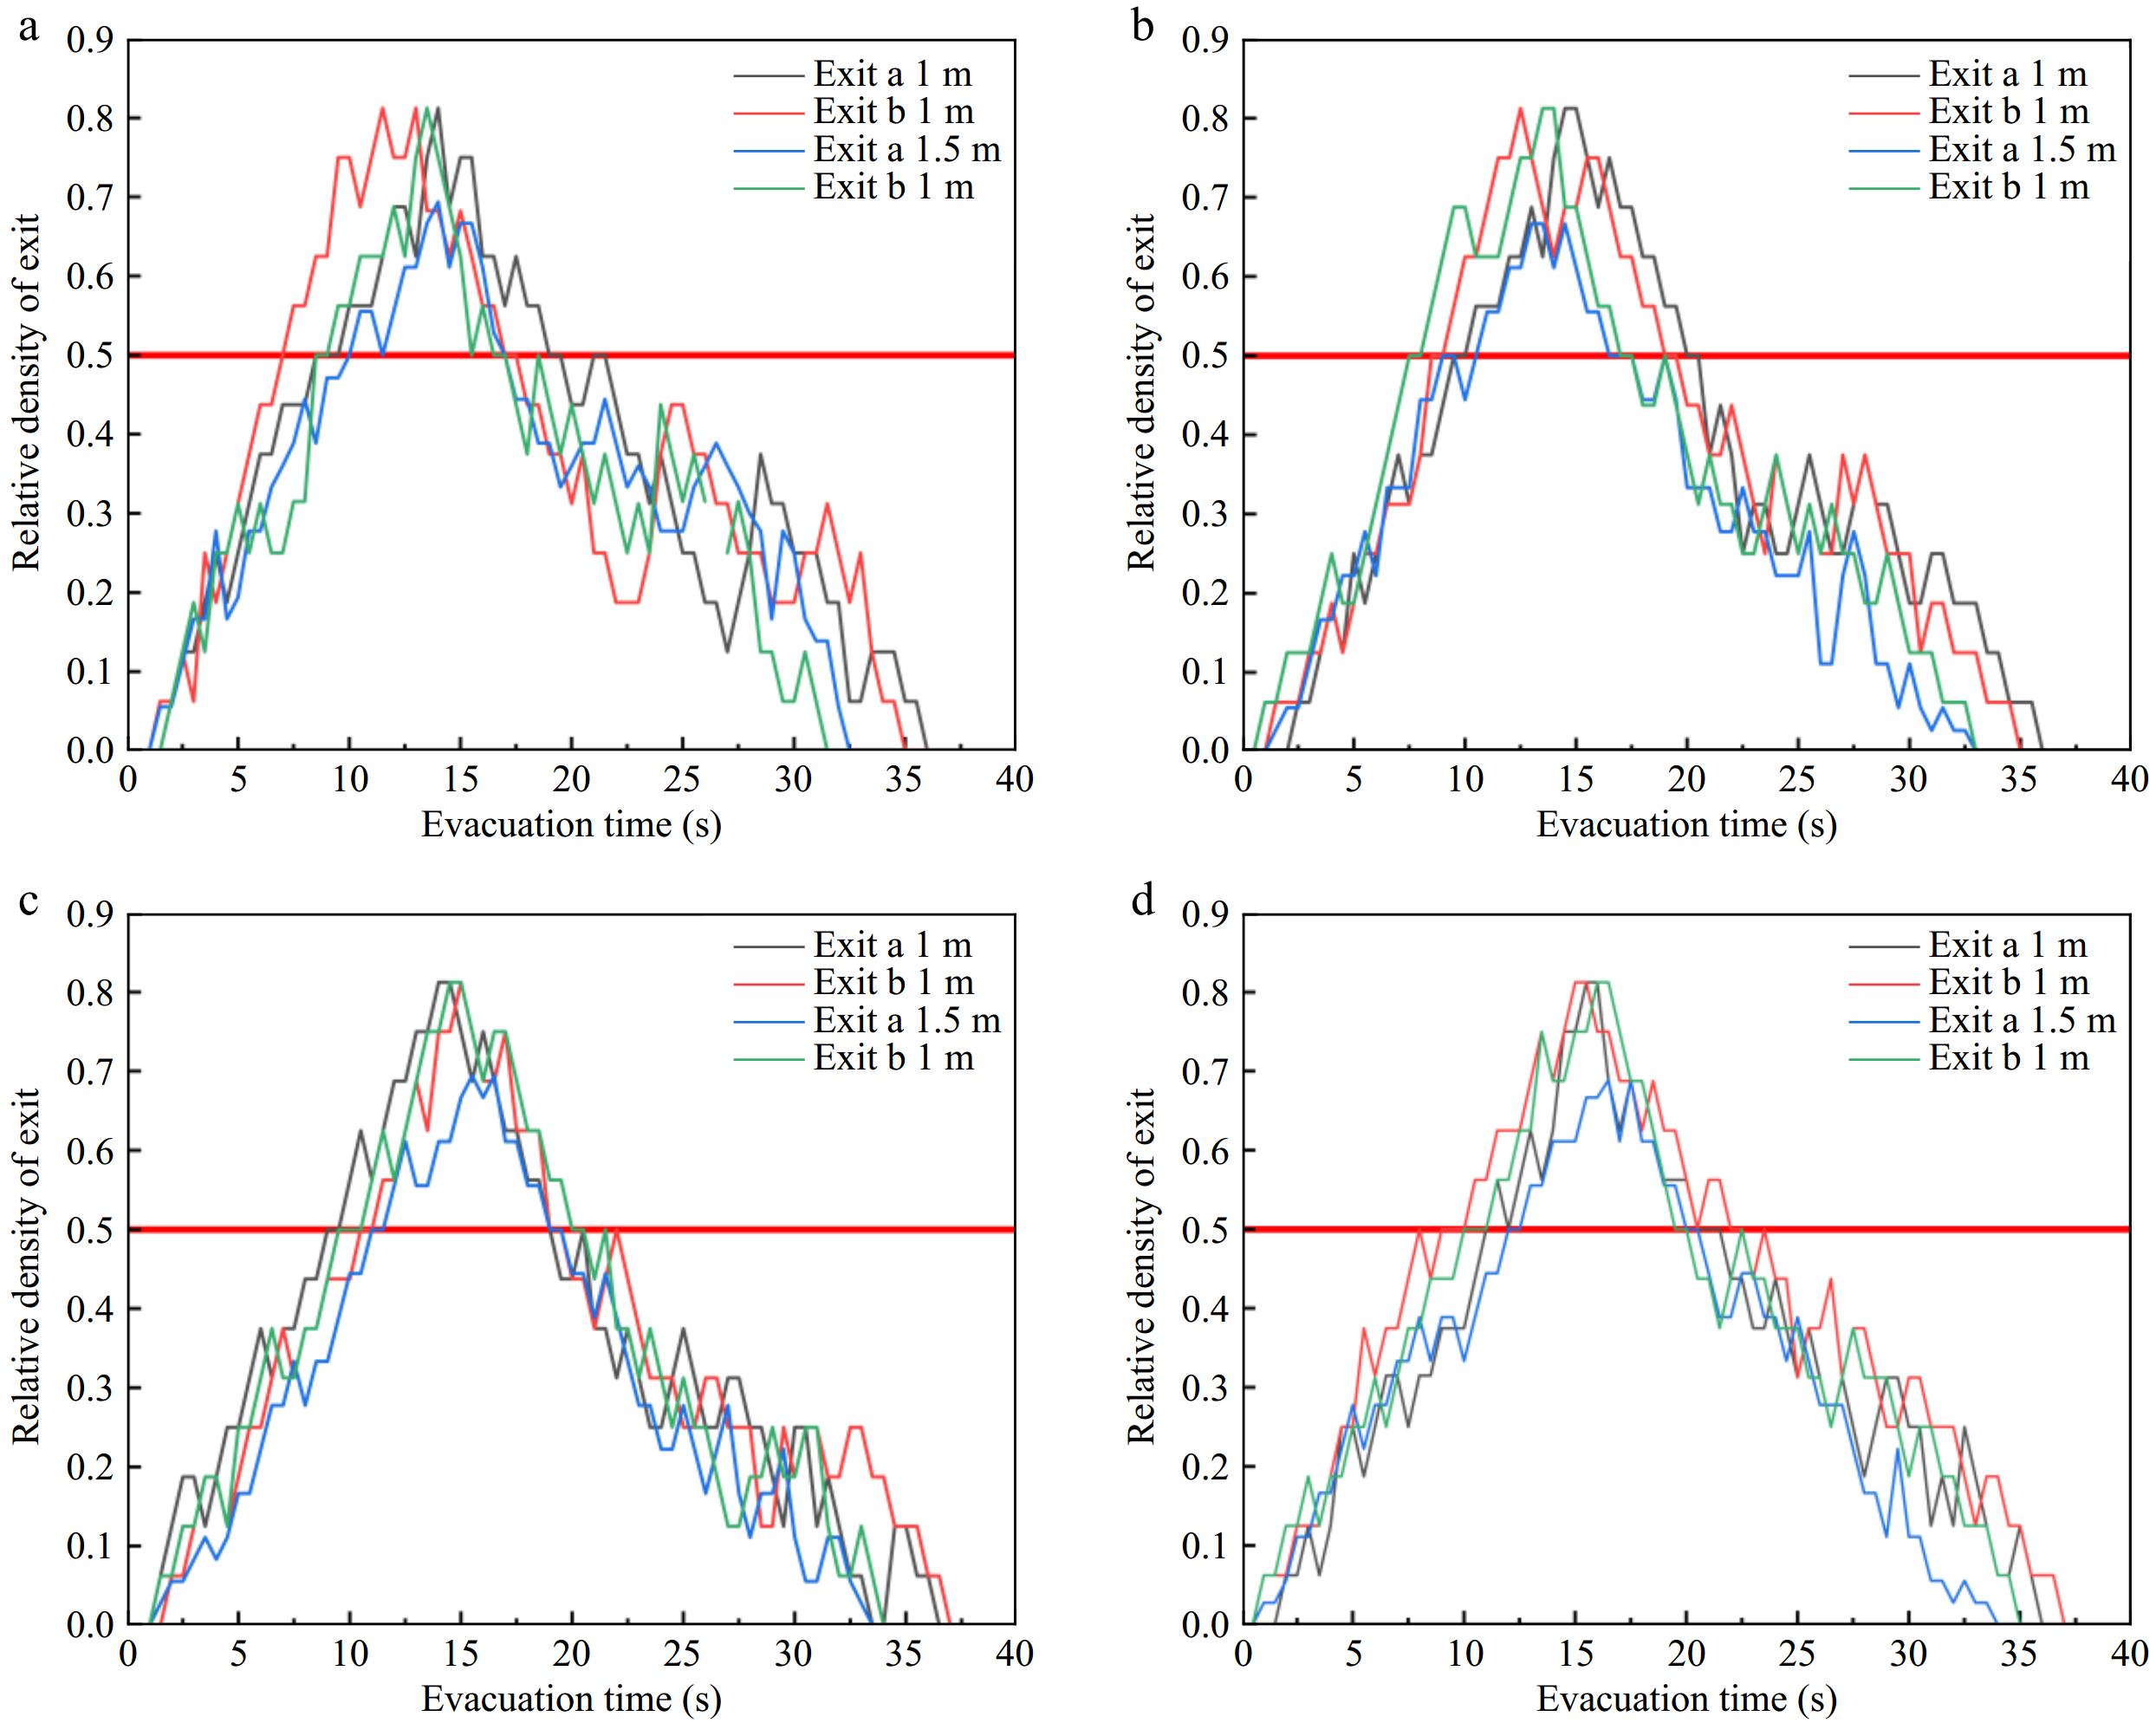
Figure 17.
Relative pedestrian density with varying numbers of insensitive pedestrians ((a) 10, (b) 20, (c) 30, (d) 40) at two exits under Scenario 3.
-
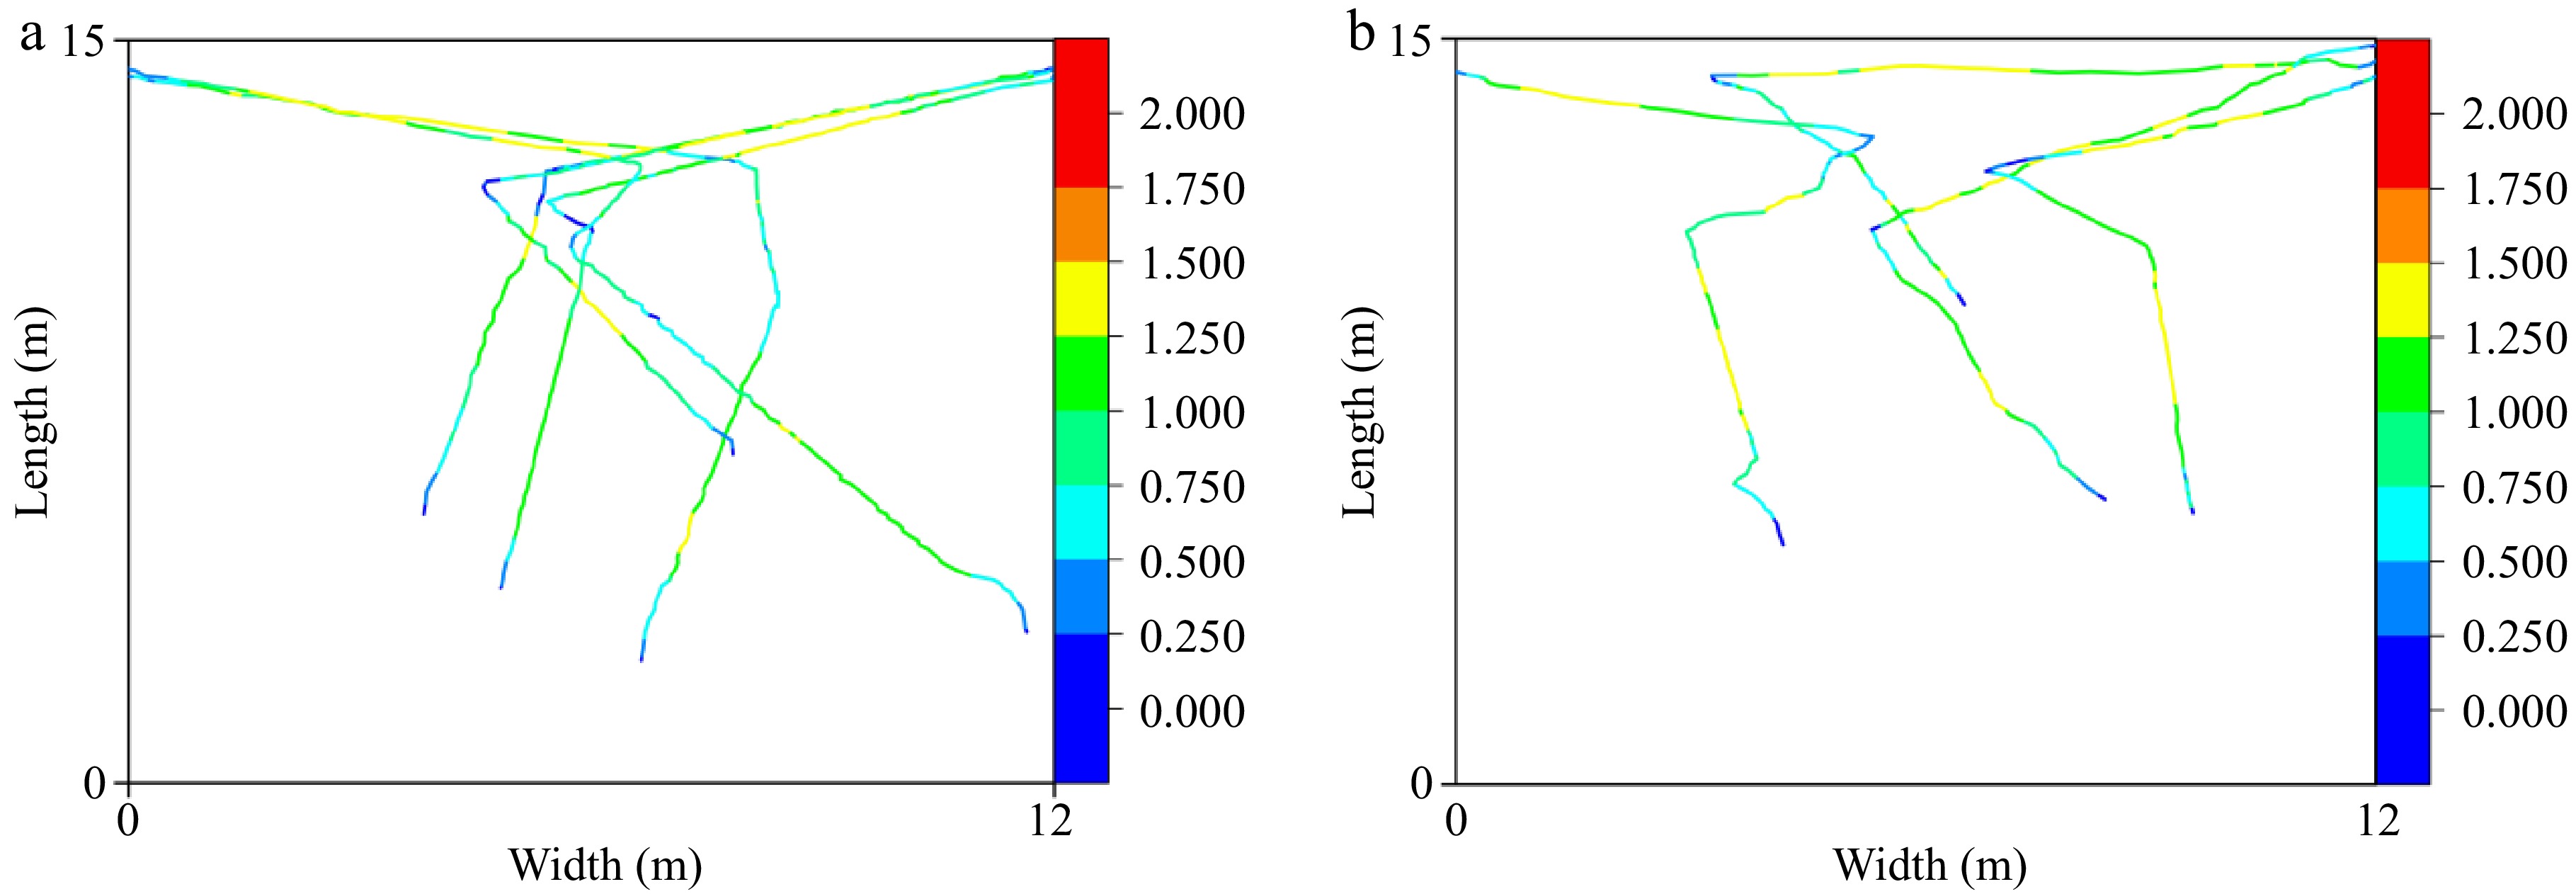
Figure 18.
The trajectory map of the exit re-selection for sensitive pedestrians under varying numbers of insensitive pedestrians ((a) 20 , (b) 40) at two exits under Scenario 3.
-
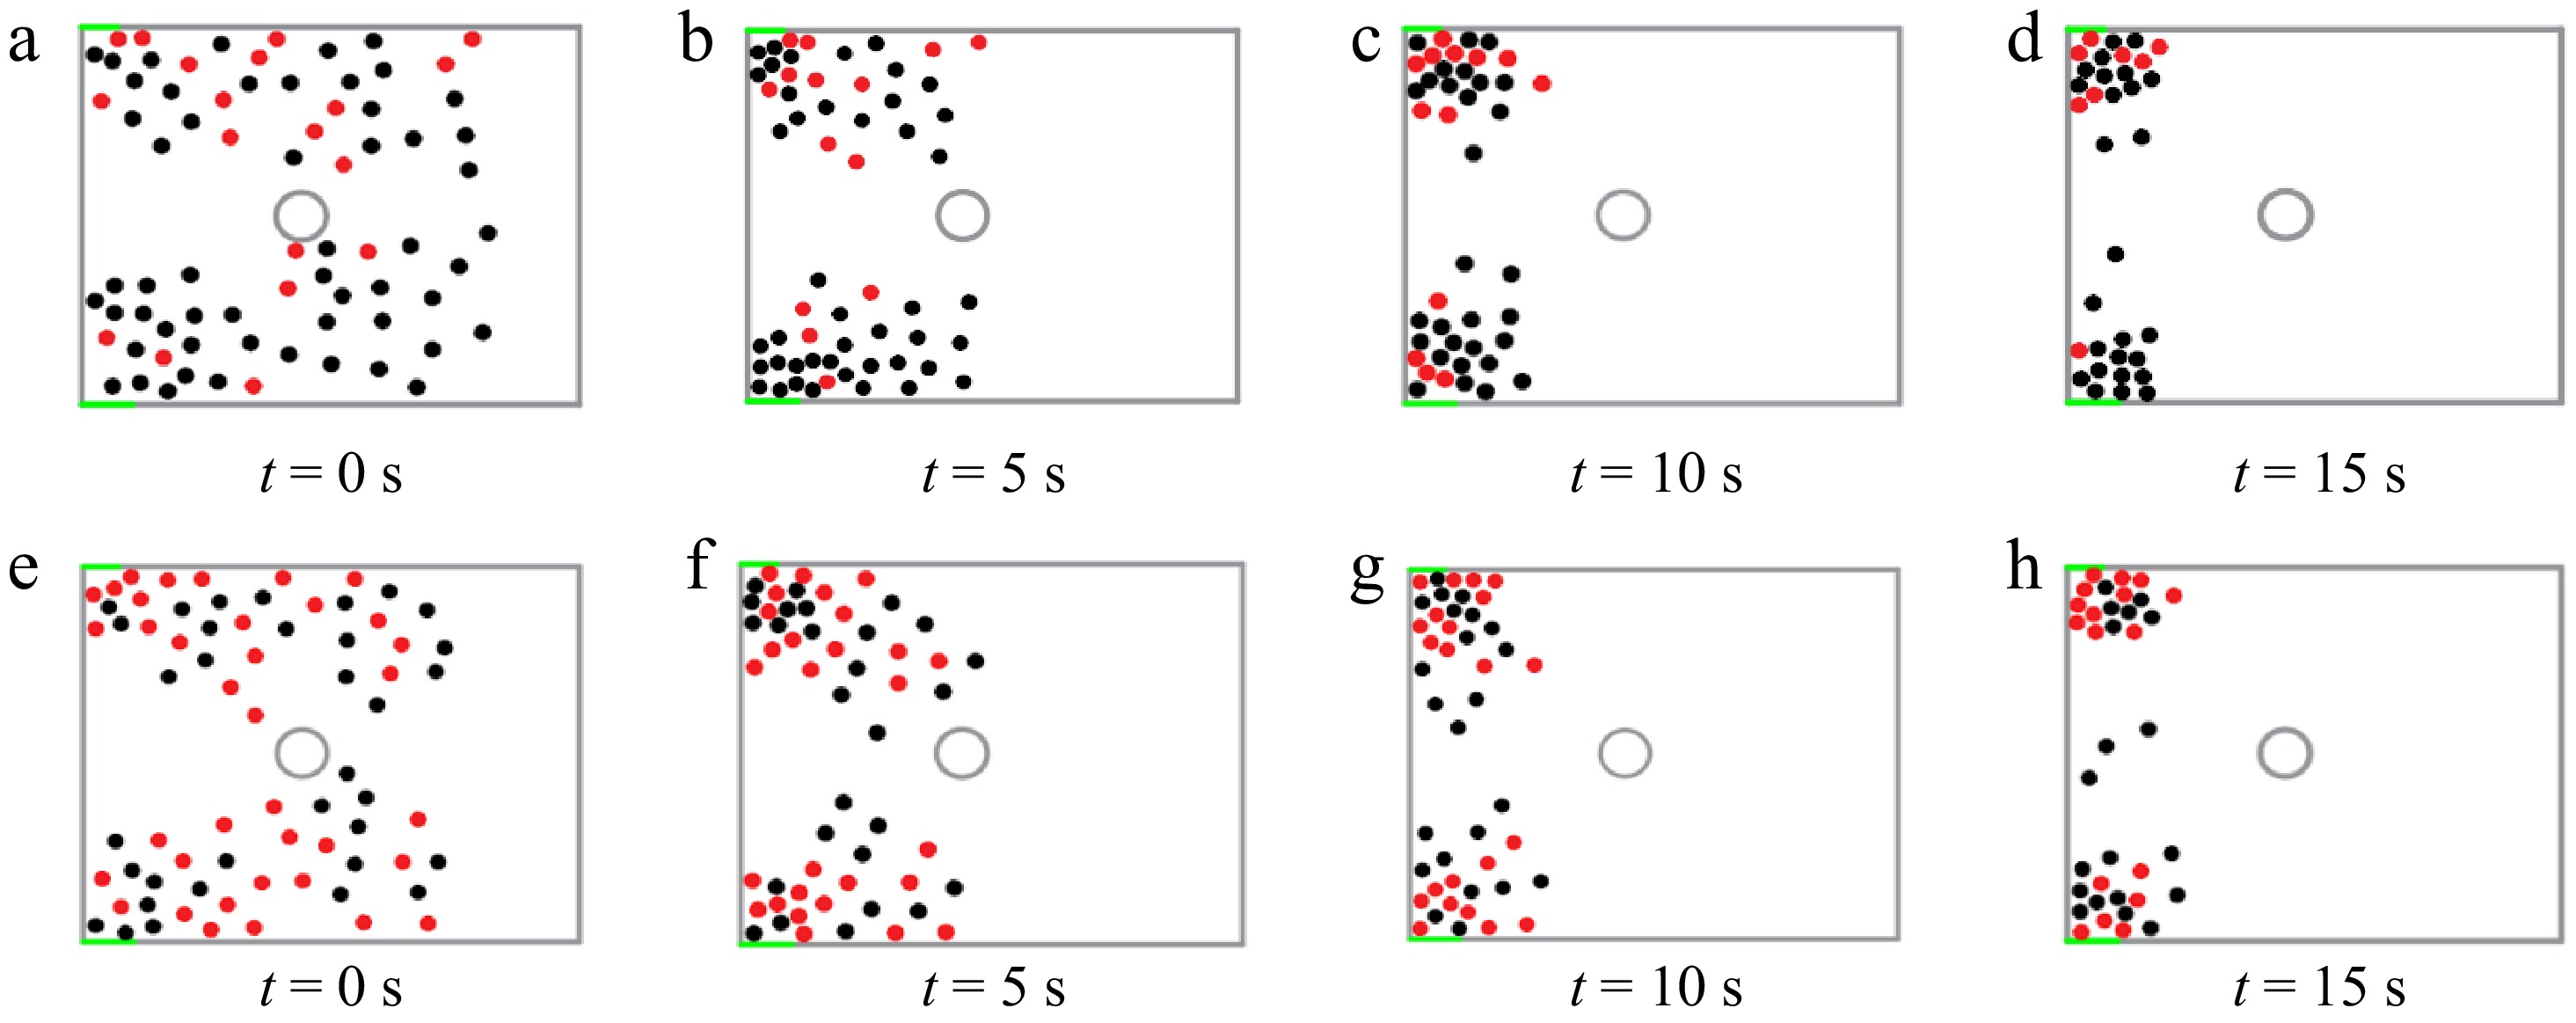
Figure 19.
Simulation diagram of pedestrian dynamic distribution at different time points, with sensitive and insensitive pedestrians are represented in black and red, respectively.
-
Number of pedestrians Exit width 60 a: 1 m, b: 1 m 60 a: 1.5 m, b: 1 m 80 a: 1 m, b: 1 m 80 a: 1.5 m, b: 1 m 100 a: 1 m, b: 1 m 100 a: 1.5 m, b: 1 m Table 1.
Scenario 1 experimental conditions.
-
Number of sensitive pedestrians Number of insensitive pedestrians Exit width 70 10 a: 1 m, b: 1 m 70 10 a: 1.5 m, b: 1 m 60 20 a: 1 m, b: 1 m 60 20 a: 1.5 m, b: 1 m 50 30 a: 1 m, b: 1 m 50 30 a: 1.5 m, b: 1 m 40 40 a: 1 m, b: 1 m 40 40 a: 1.5 m, b: 1 m Table 2.
Scenario 2/3 experimental conditions.
-
λ denmax ks kw kde kα kβ kγ 1 0.5 1 1 1 1 1 1 Table 3.
Parameters' value of multi-exit selection model.
-
Meaning A Average speed of pedestrians without lighted guidance signs B Average speed of sensitive pedestrians under lighted guidance signs C Average speed of insensitive pedestrians under lighted guidance signs D Average speed of sensitive pedestrians under lighted guidance signs in the low view E Average speed of insensitive pedestrians under lighted guidance signs in the low view Table 4.
Definition of ABCDE in Fig. 4.
Figures
(19)
Tables
(4)