-
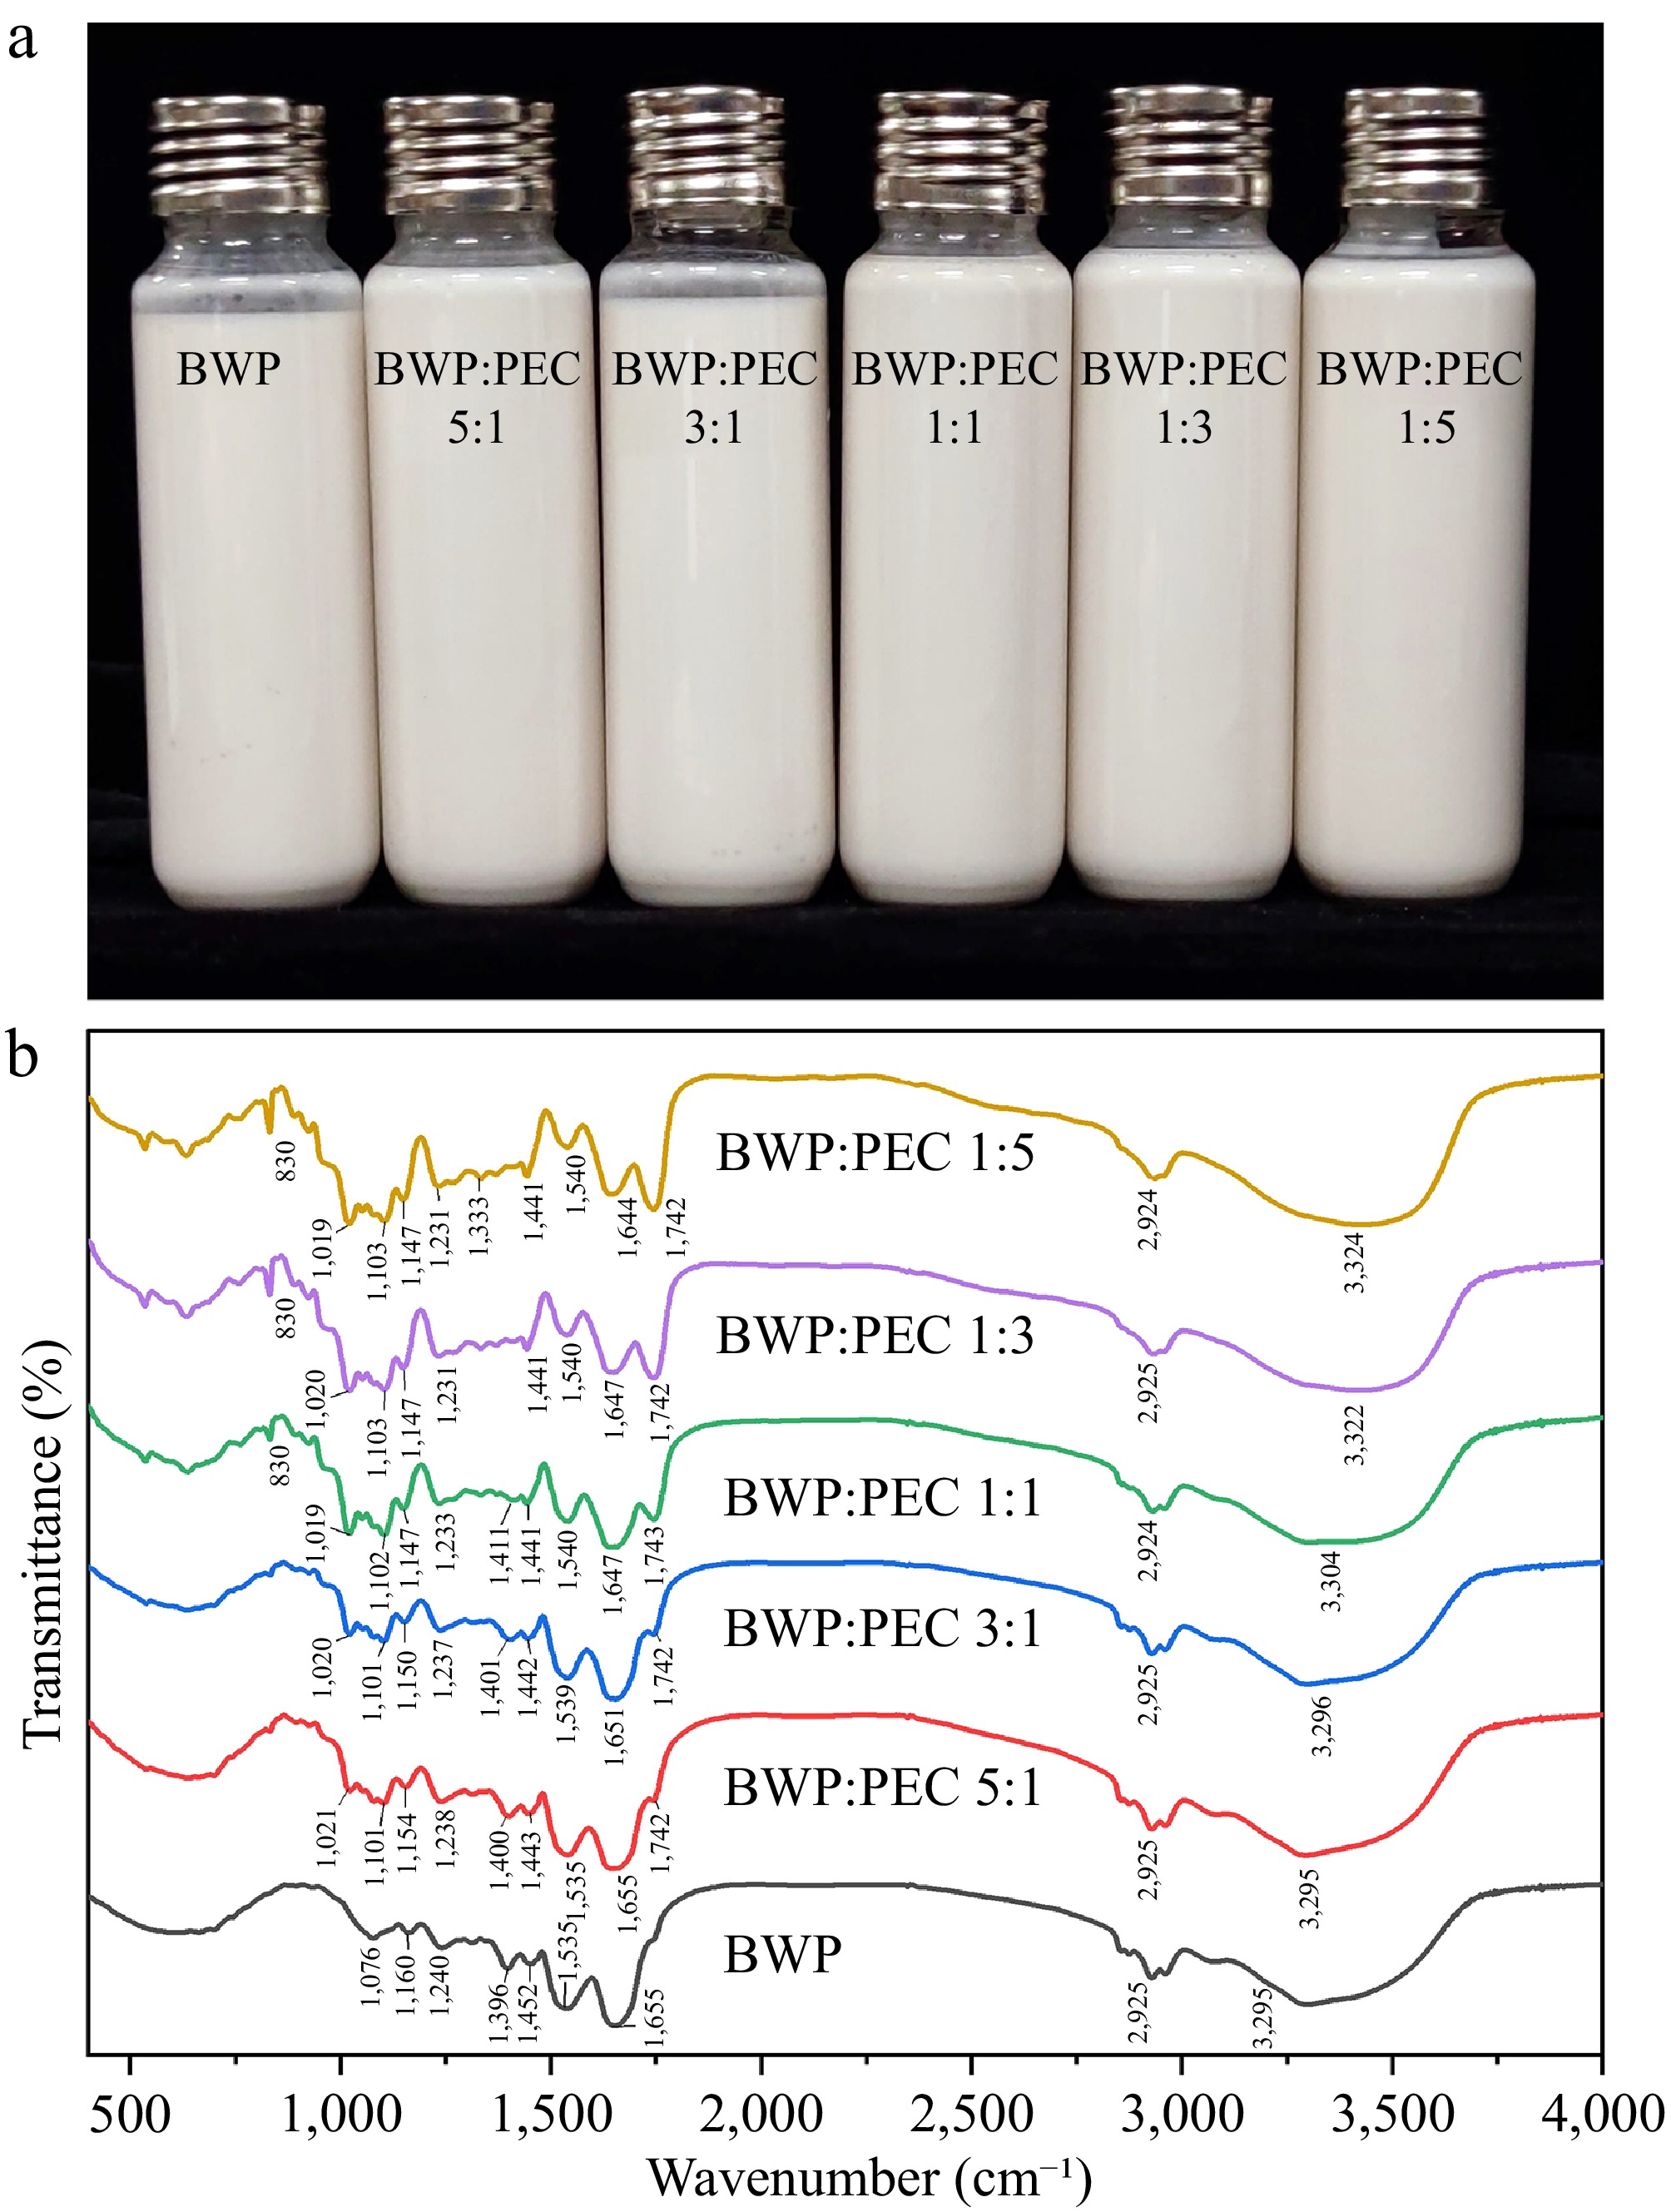
Figure 1.
Visual appearance of W/O/W emulsion at day 0 and the corresponding FTIR spectra of BWP and BWP-PEC complexes.
-
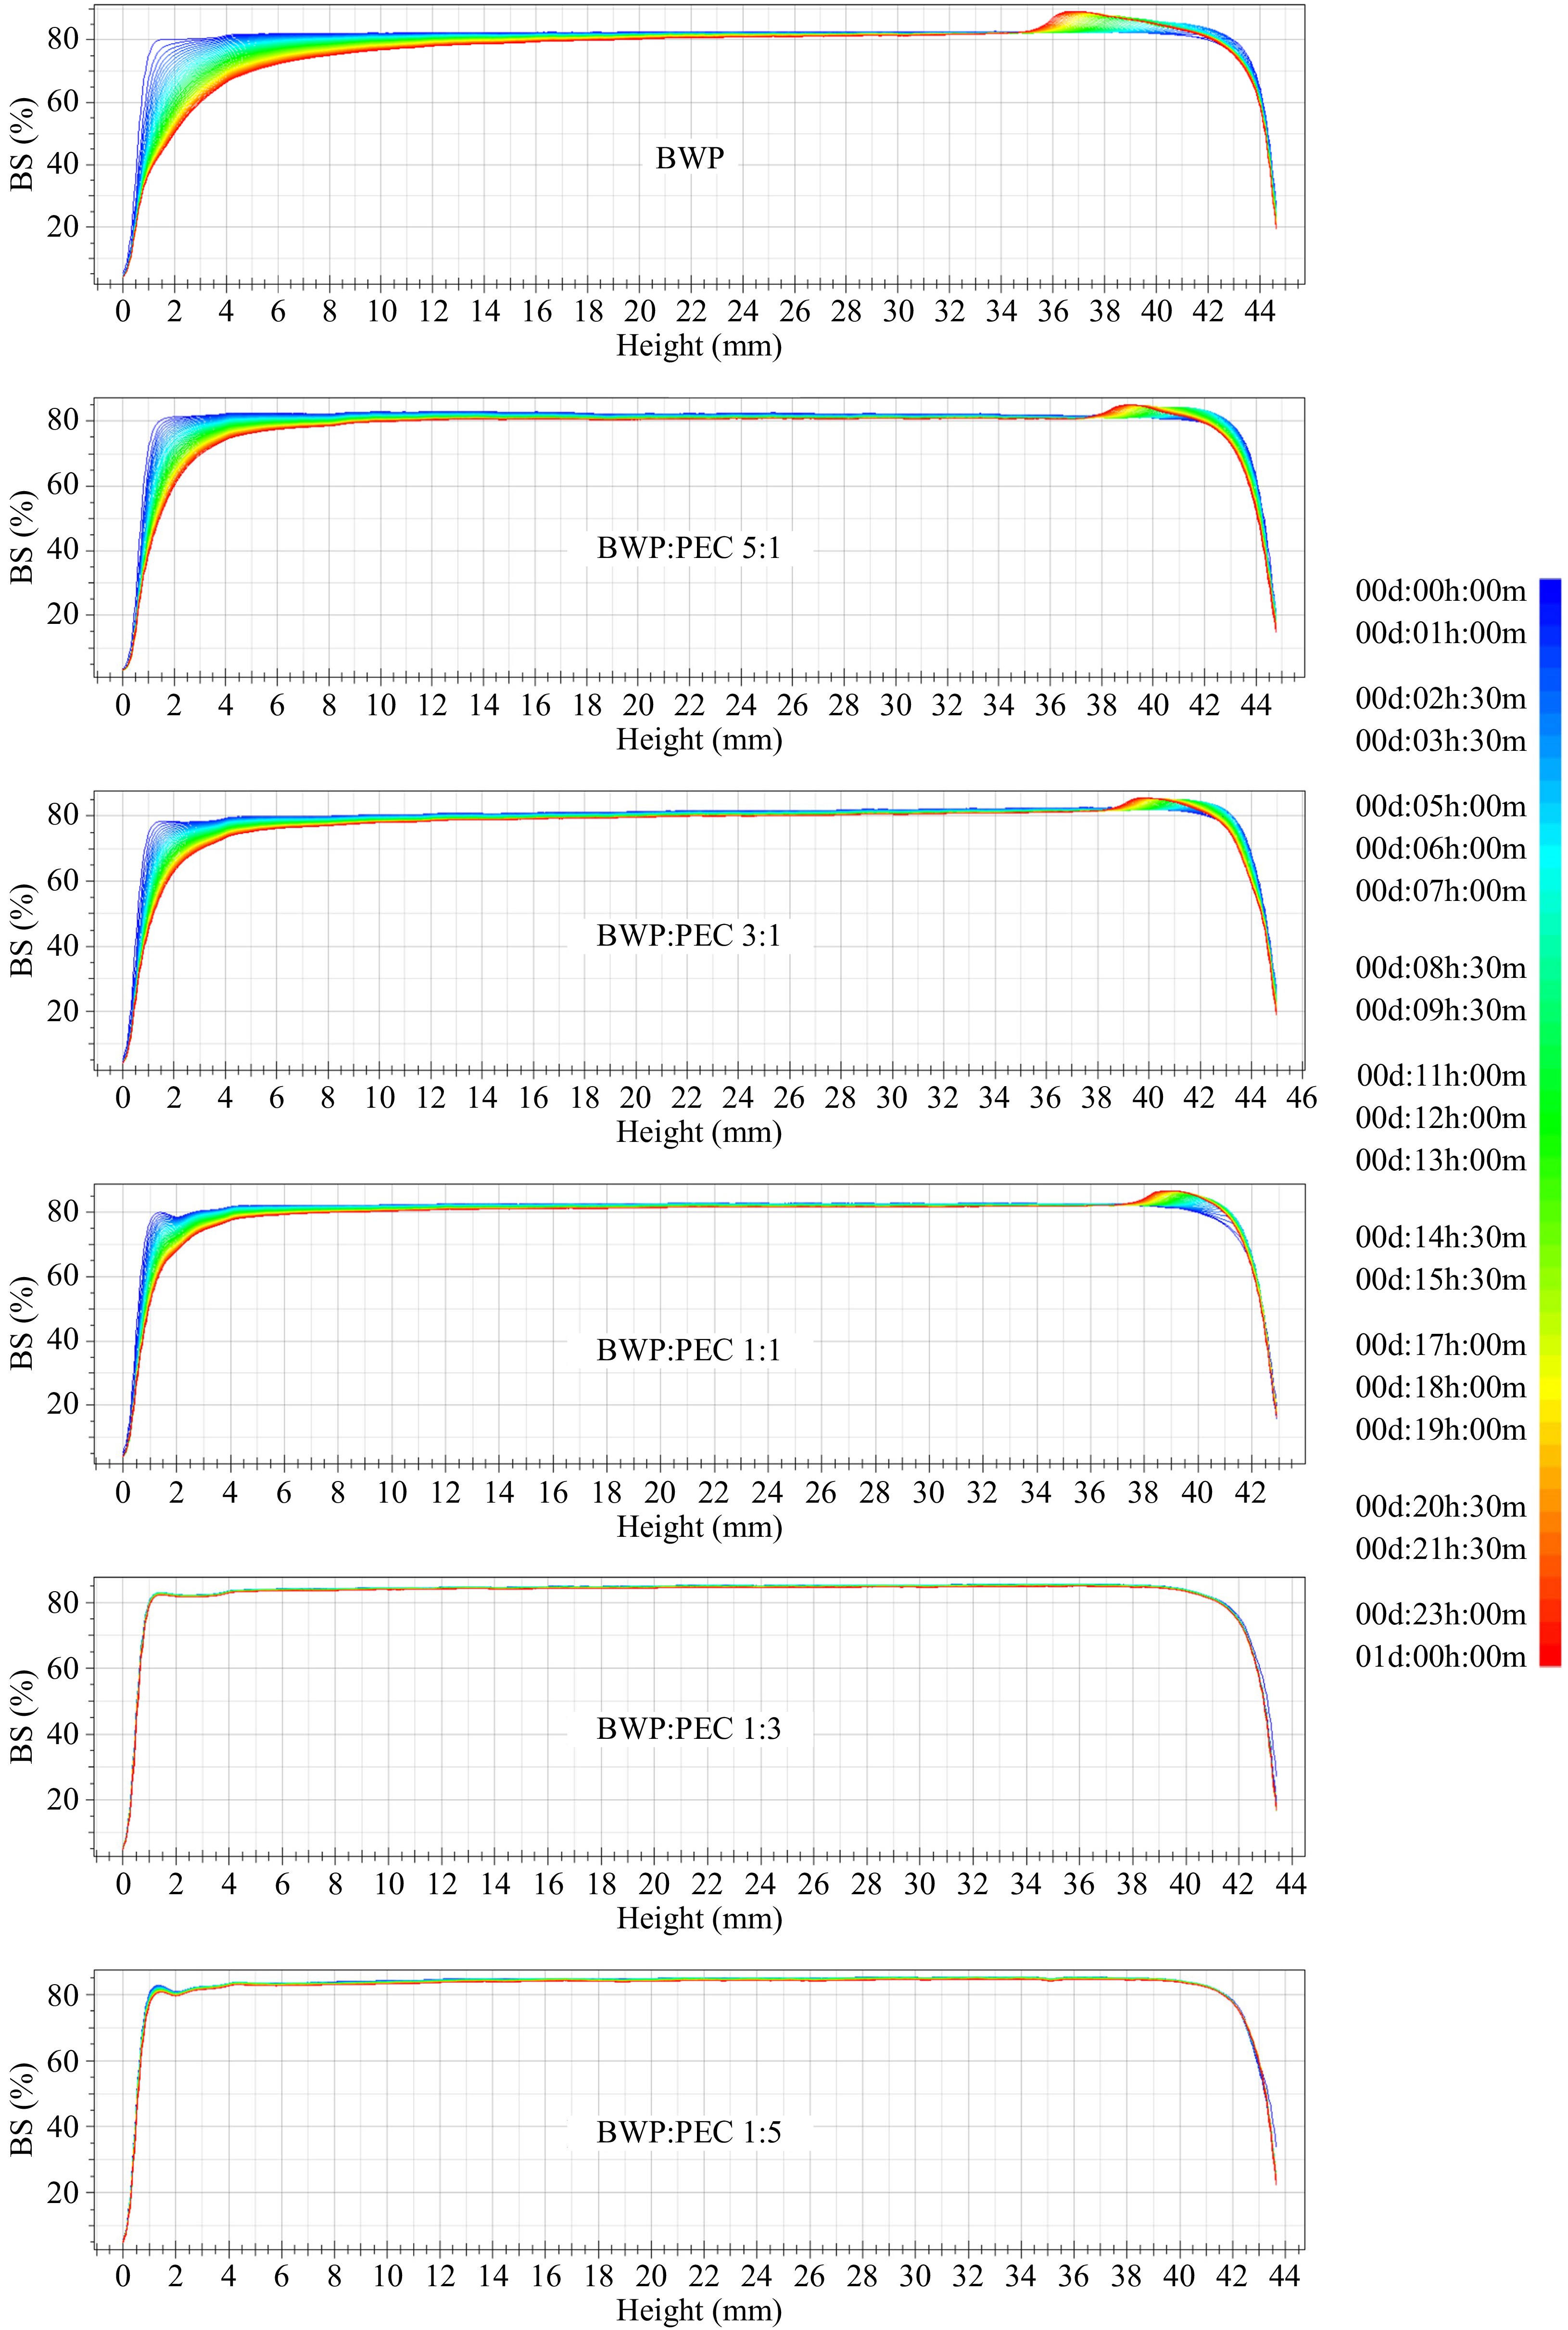
Figure 2.
Backscattering of W/O/W emulsion coated with BWP and BWP-PEC over 24 h.
-
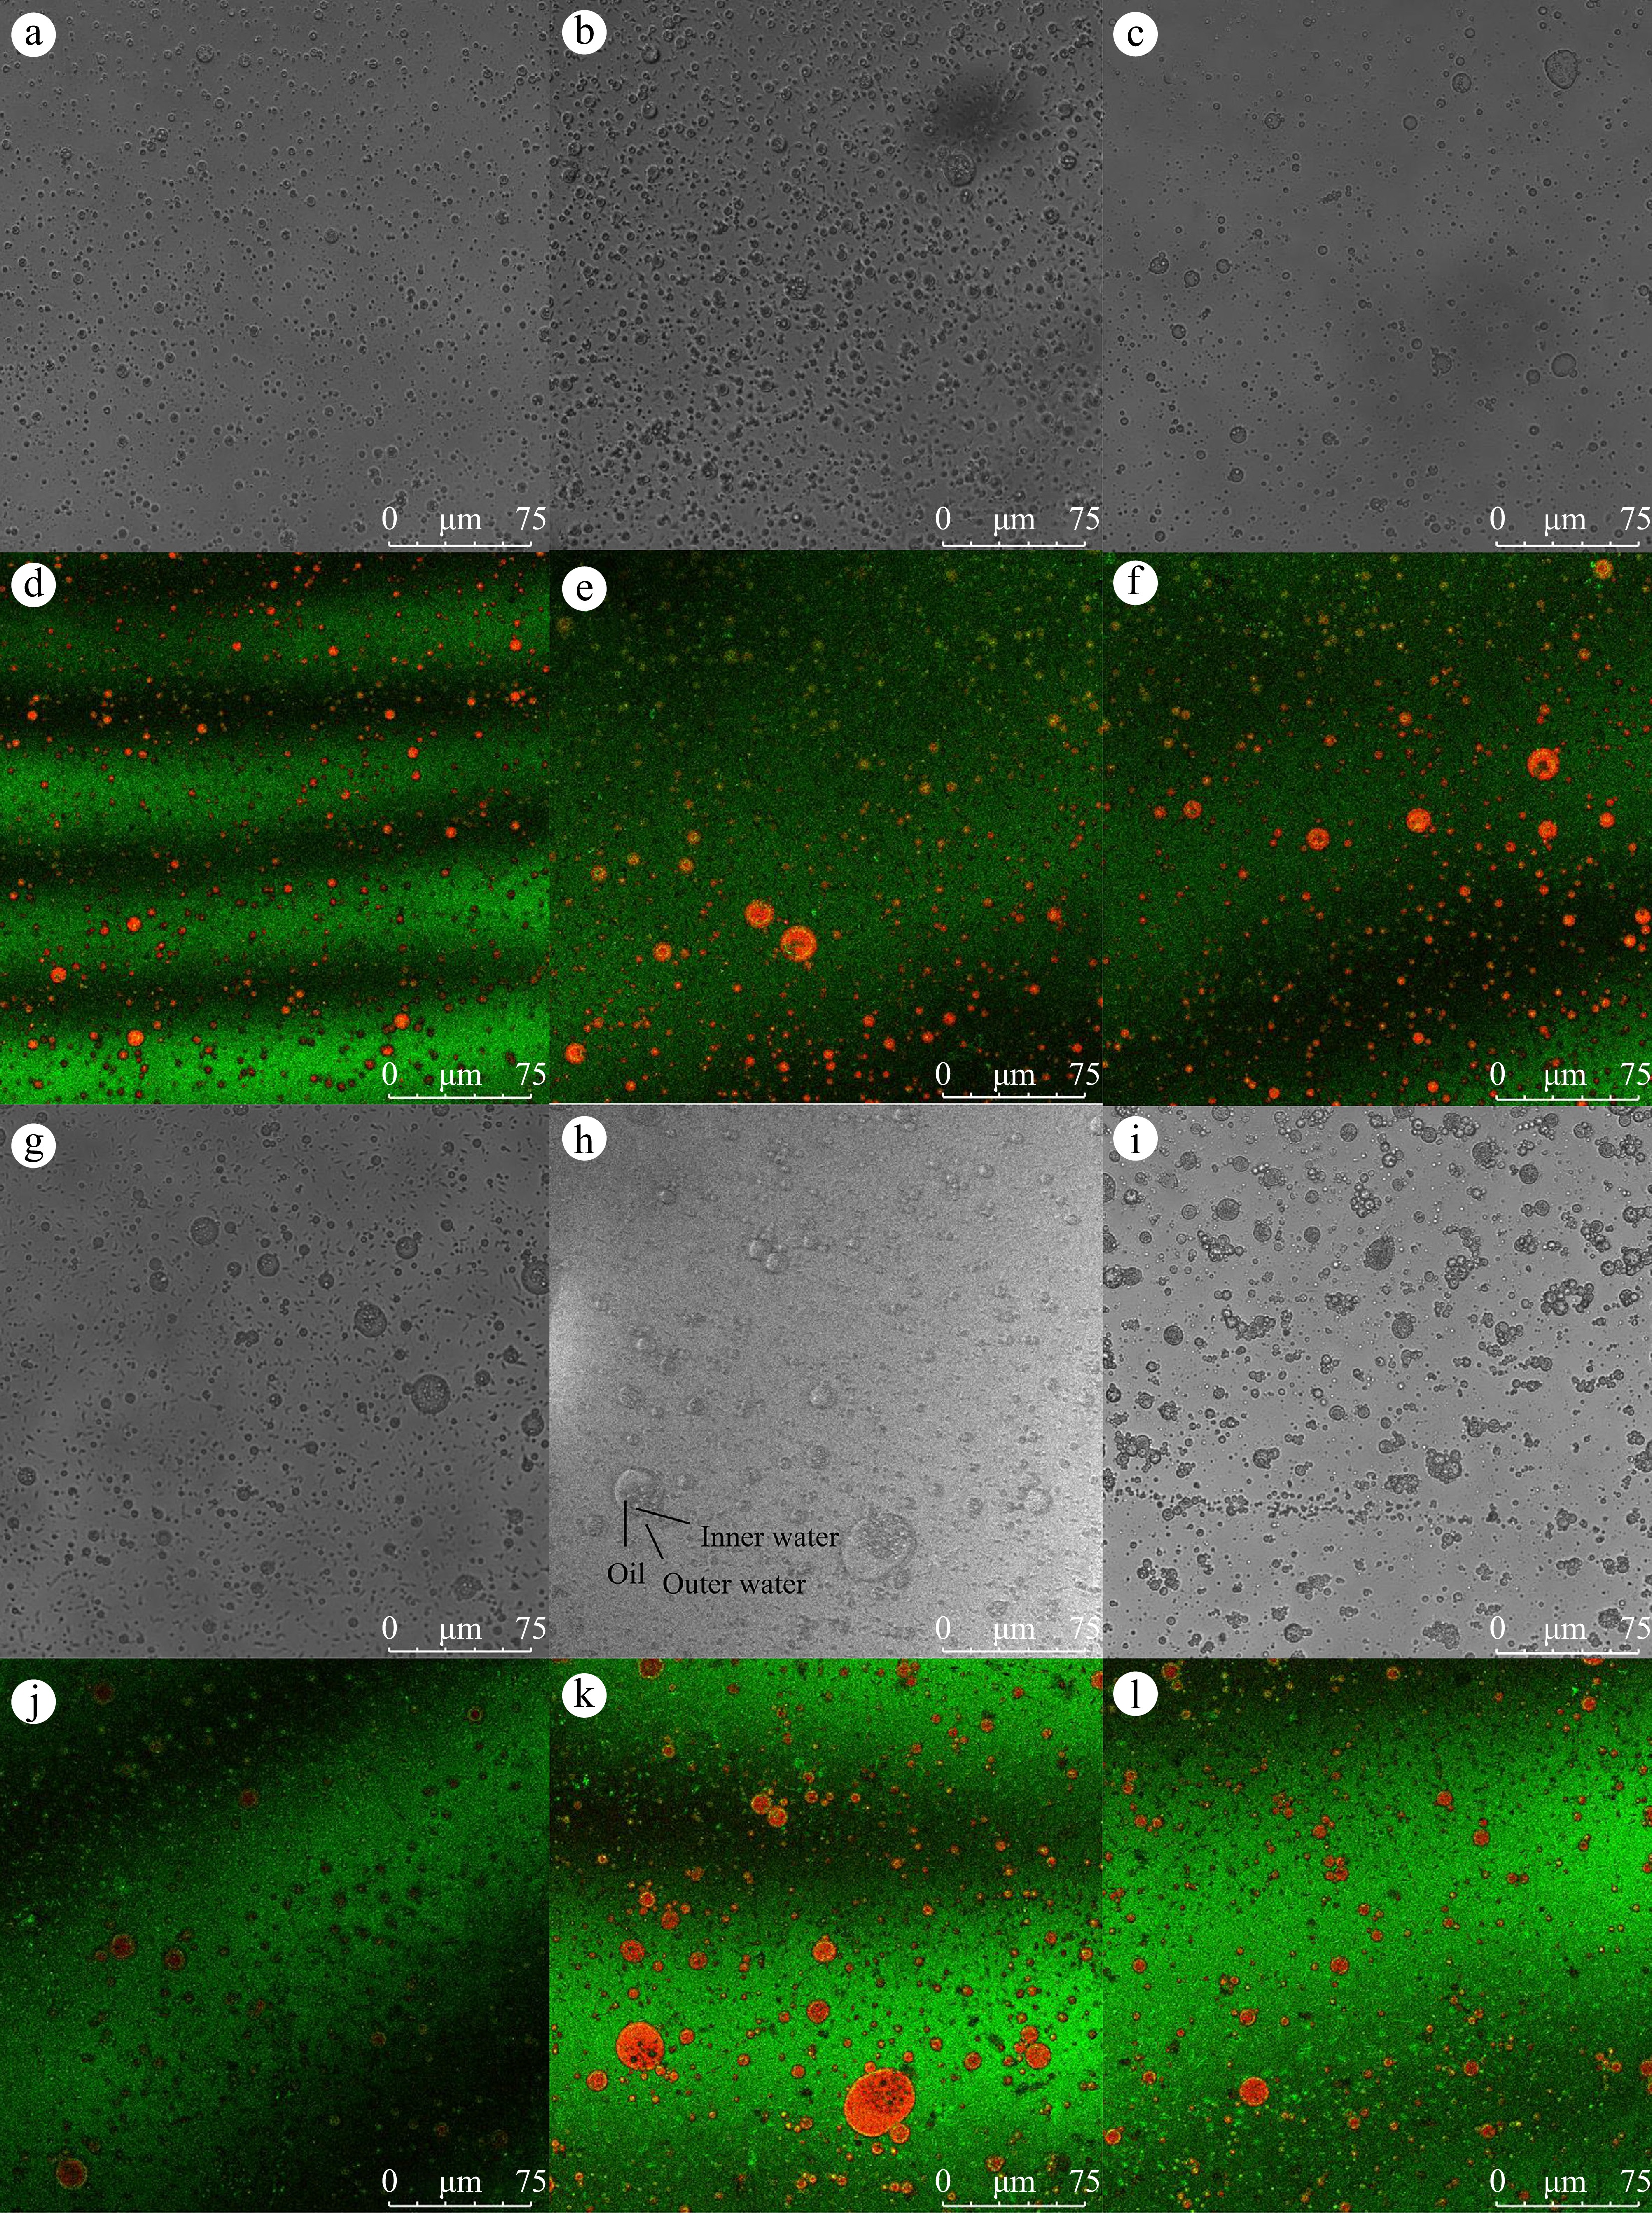
Figure 3.
Optical microscopy of W/O/W emulsion coated with (a) BWP, (b) BWP:PEC = 5:1, (c) BWP:PEC = 3:1, (g) BWP:PEC = 1:1, (h) BWP:PEC = 1:3, (i) BWP:PEC = 1:5. (d)−(f), (j)−(l) represent the corresponding (a)−(c), (g)−(i) confocal laser scanning microscopy.
-
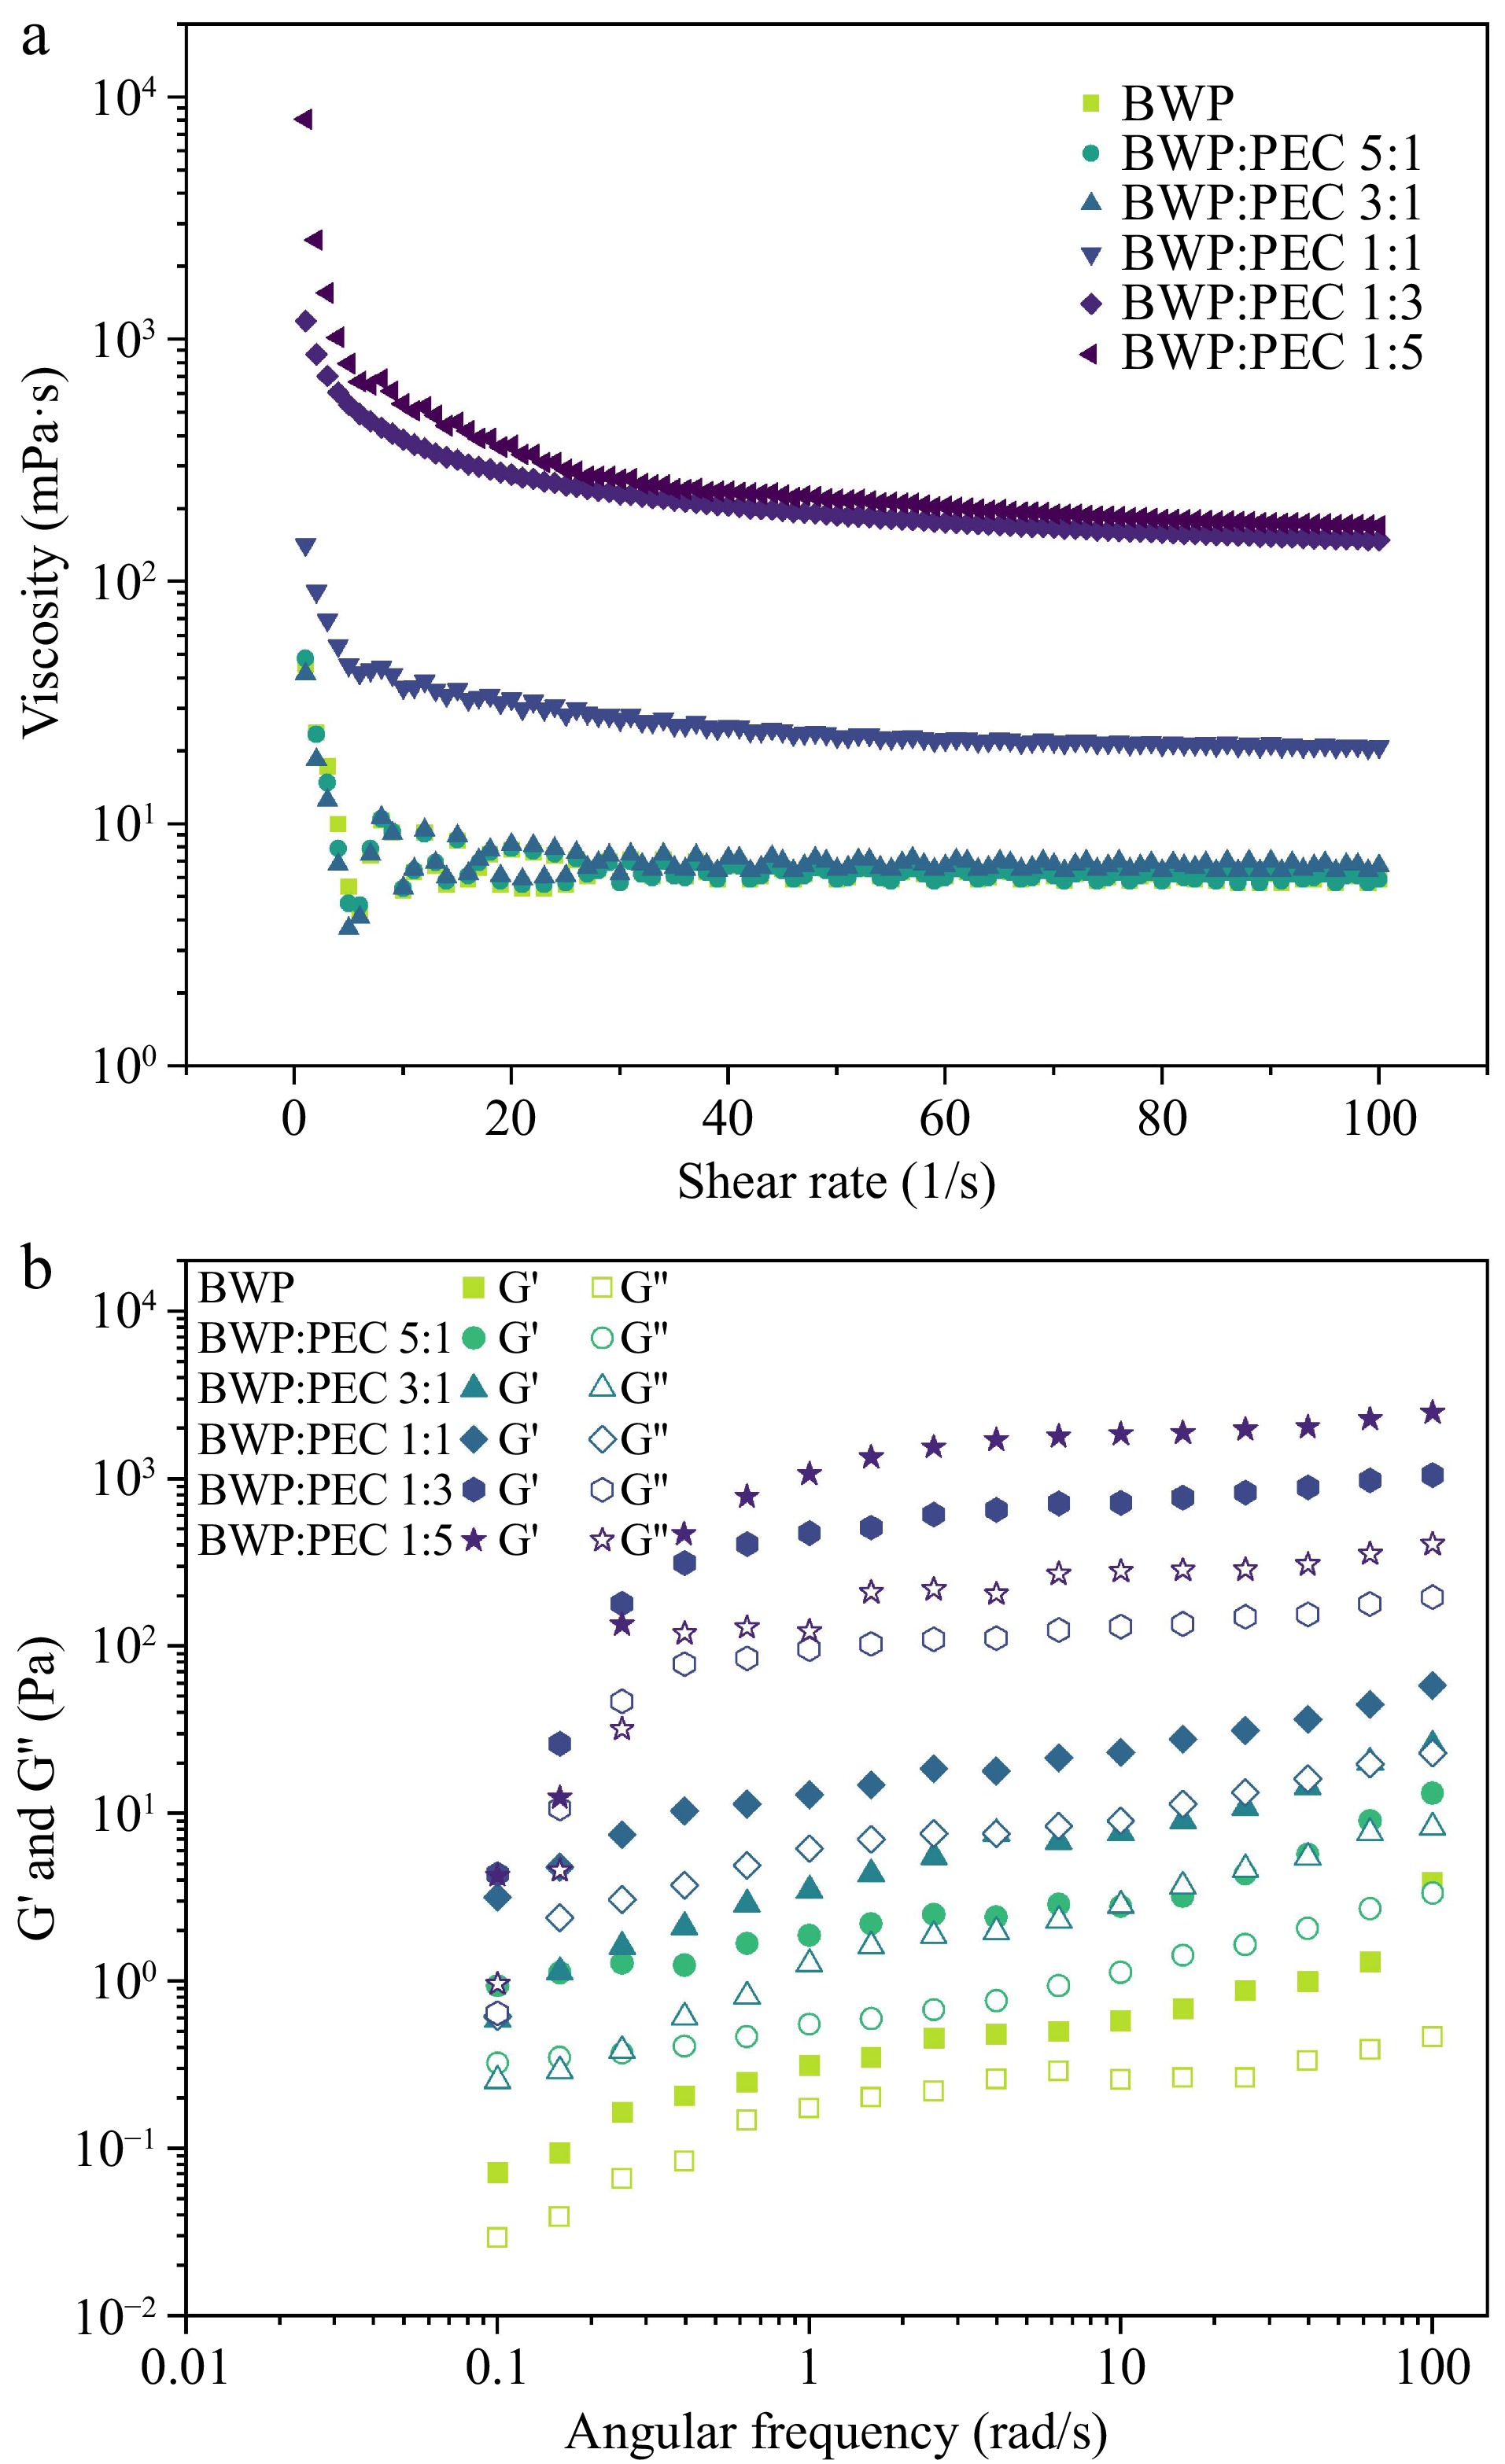
Figure 4.
(a0 Viscosity vs shear rate from 0 to 100 1/s of W/O/W emulsions coated with BWP and BWP-PEC complexes. (b) Frequency sweeps curves (G', storage modulus; G'', loss modulus) with angular frequency from 0.1 to 100 rad/s of W/O/W emulsions coated with BWP and BWP-PEC complexes.
-
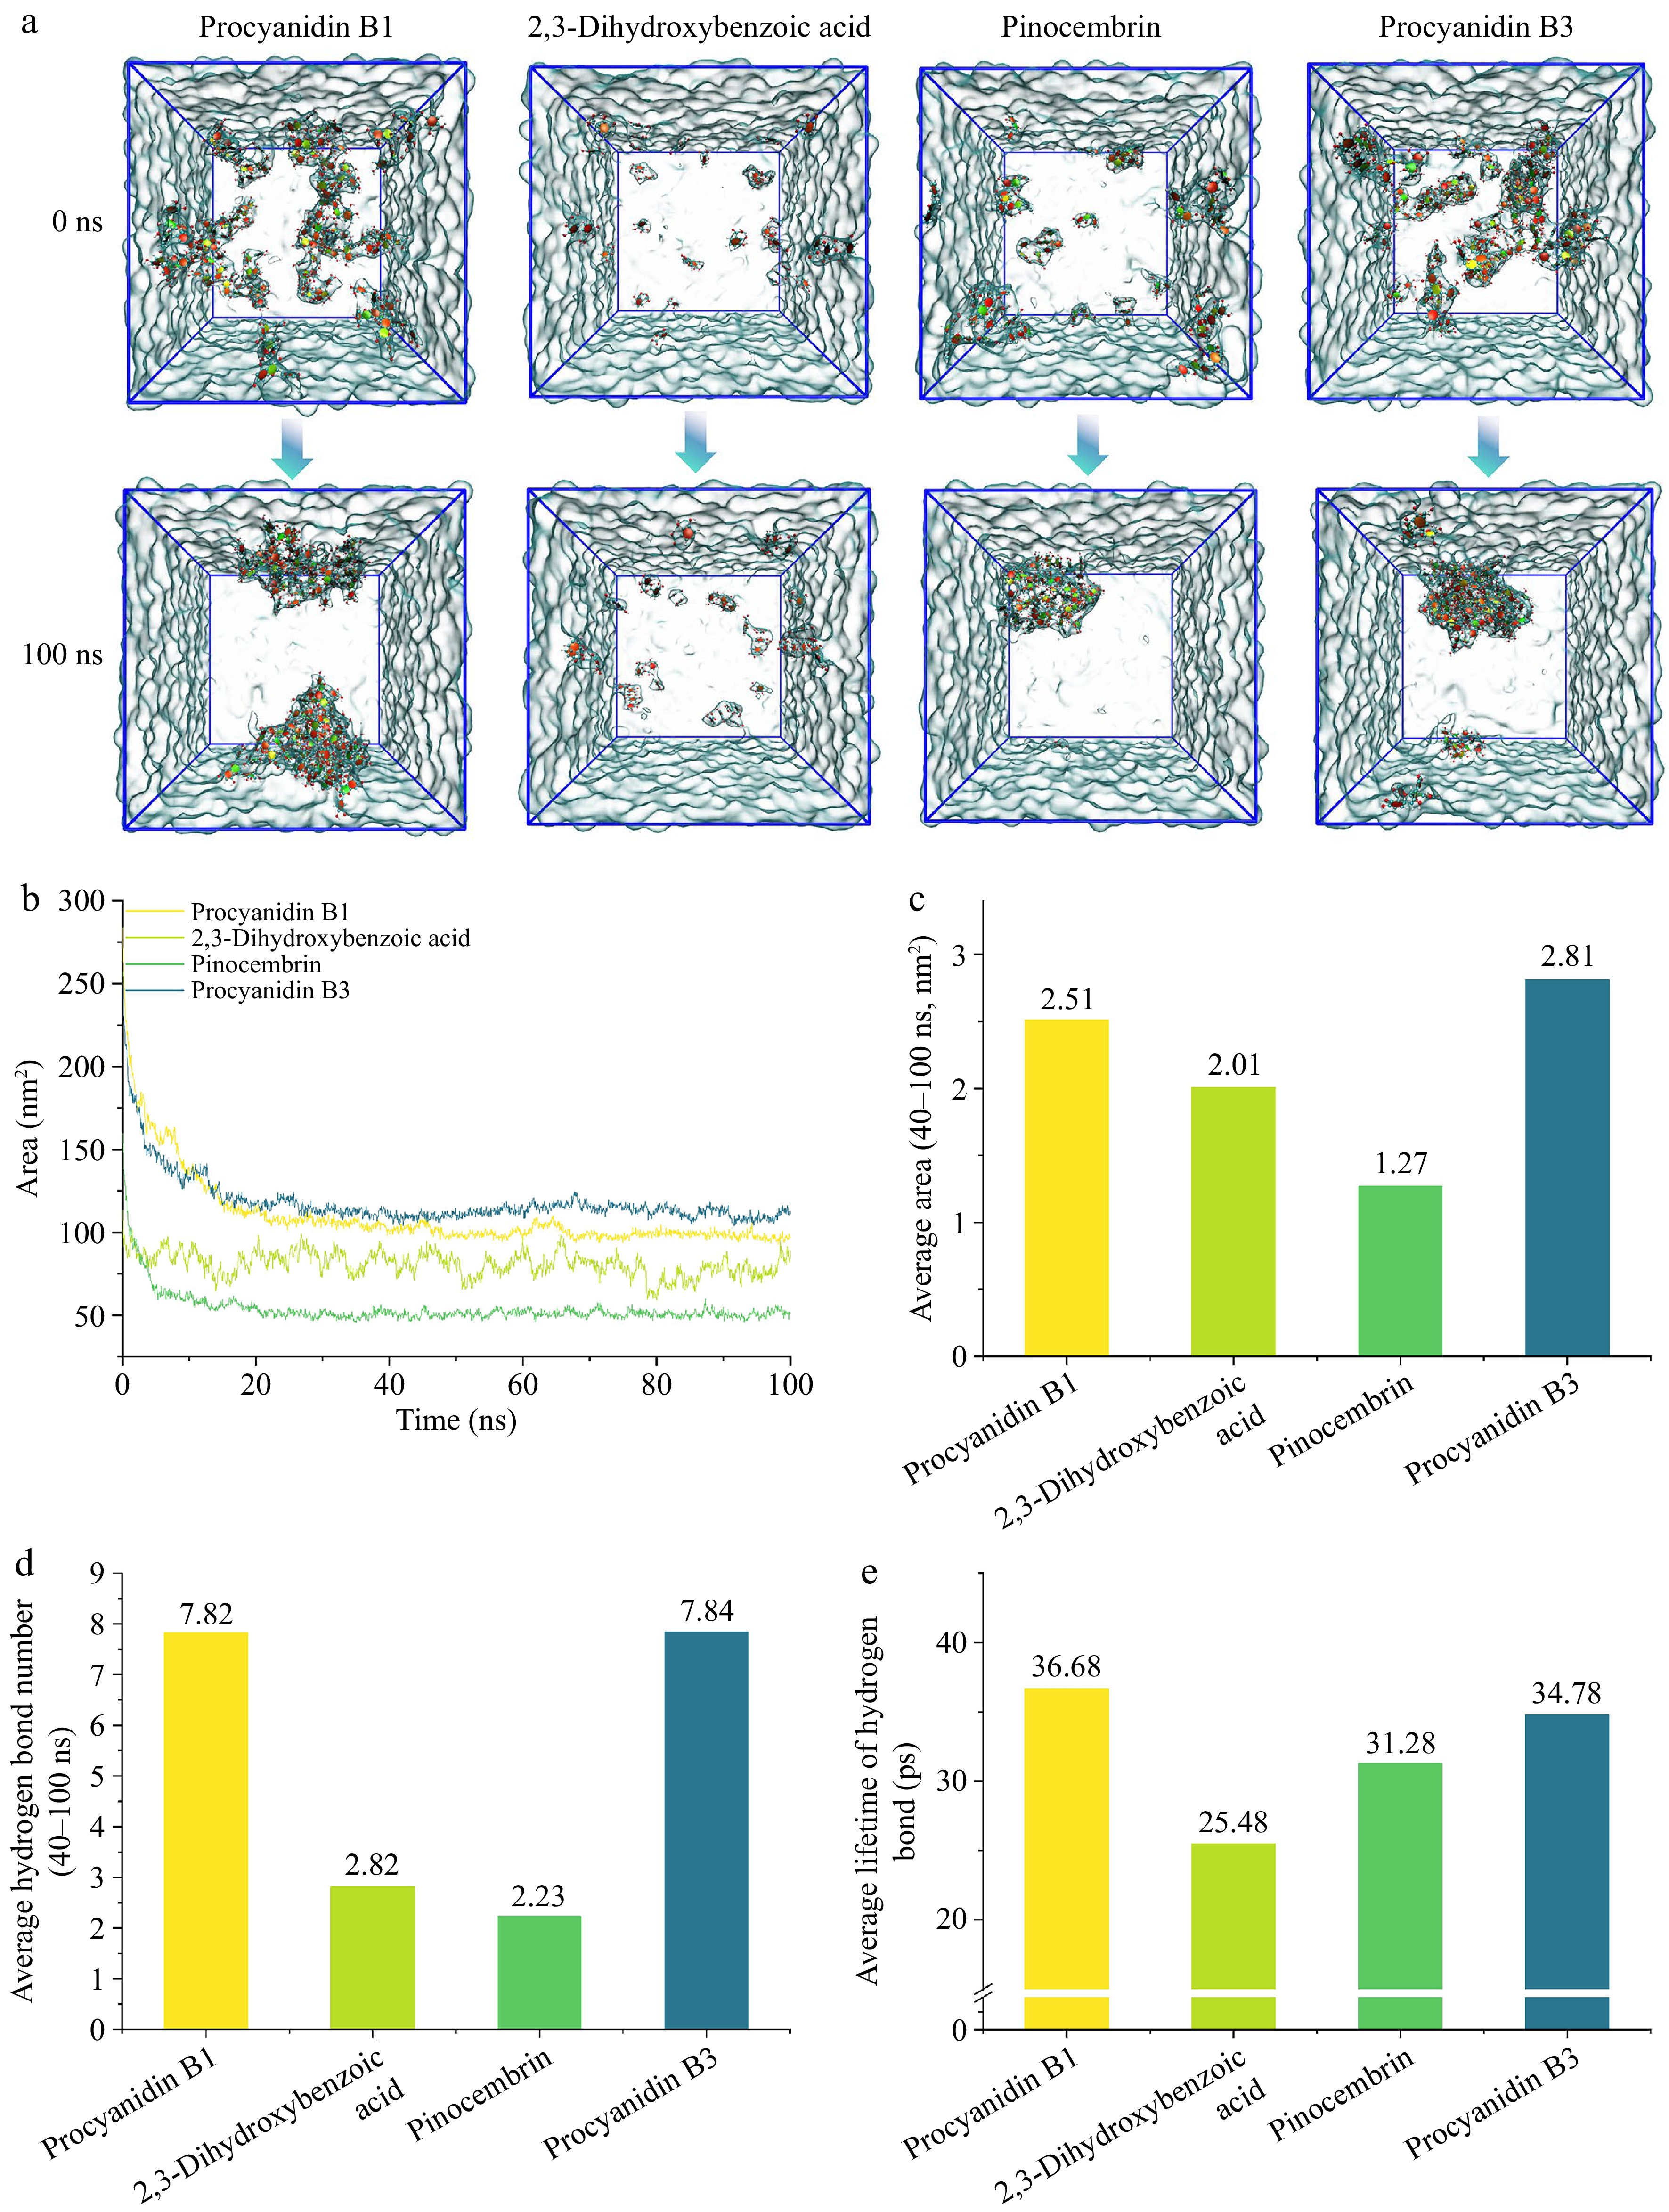
Figure 5.
Molecular dynamic simulation analysis. (a) Snapshots of procyanidin B1, 2,3-dihydroxybenzoic acid, pinocembrin, and procyanidin B3 in the water system at 0 and 100 ns, respectively. (b), (c) Solvent accessible surface area (SASA) of four of the above-mentioned phenolics in water varied from 0 to 100 ns and corresponding average SASA (per phenolic molecule) calculated from 40 to 100 ns. (d) Average hydrogen bond number (per phenolic molecule) from 40 to 100 ns. (e) Average lifetime of hydrogen bonds between the four above-mentioned phenolics and water.
-
Emulsion Particle size (nm) Zeta potential (mV) Day 0 Day 16 Day 0 Day 16 BWP 740.76 ± 22.53cB 904.40 ± 26.24cA −55.03 ± 0.59dB −22.30 ± 0.46aA BWP:PEC 5:1 739.13 ±
24.06cB1016.20 ±
24.74cA−41.90 ±
0.82cB−28.27 ±
0.29bABWP:PEC 3:1 798.86 ±
26.58cB967.07 ±
87.65cA−42.73 ±
1.32cB−32.20 ±
0.26cABWP:PEC 1:1 1016.30 ±
43.35bB1176.00 ±
68.11bA−38.50 ±
0.96bB−34.70 ±
0.46dABWP:PEC 1:3 1074.67 ±
28.57bA1153.33 ±
40.87bA−37.90 ±
0.35bA−36.37 ±
1.38eABWP:PEC 1:5 1357.00 ±
23.43aB1524.00 ±
97.02aA−35.40 ±
0.17aB−33.33 ±
0.12cAValues are shown as mean ± standard error (n = 3); different lowercase letters in the same column represent significant difference in the column direction (p < 0.05); different capital letters in the same row within 'particle size' or 'zeta potential' group represent significant difference between the corresponding data of Day 0 and Day 16 (p < 0.05). Table 1.
Particle size and zeta potential of W/O/W emulsion at day 0 and 16.
Figures
(5)
Tables
(1)