-
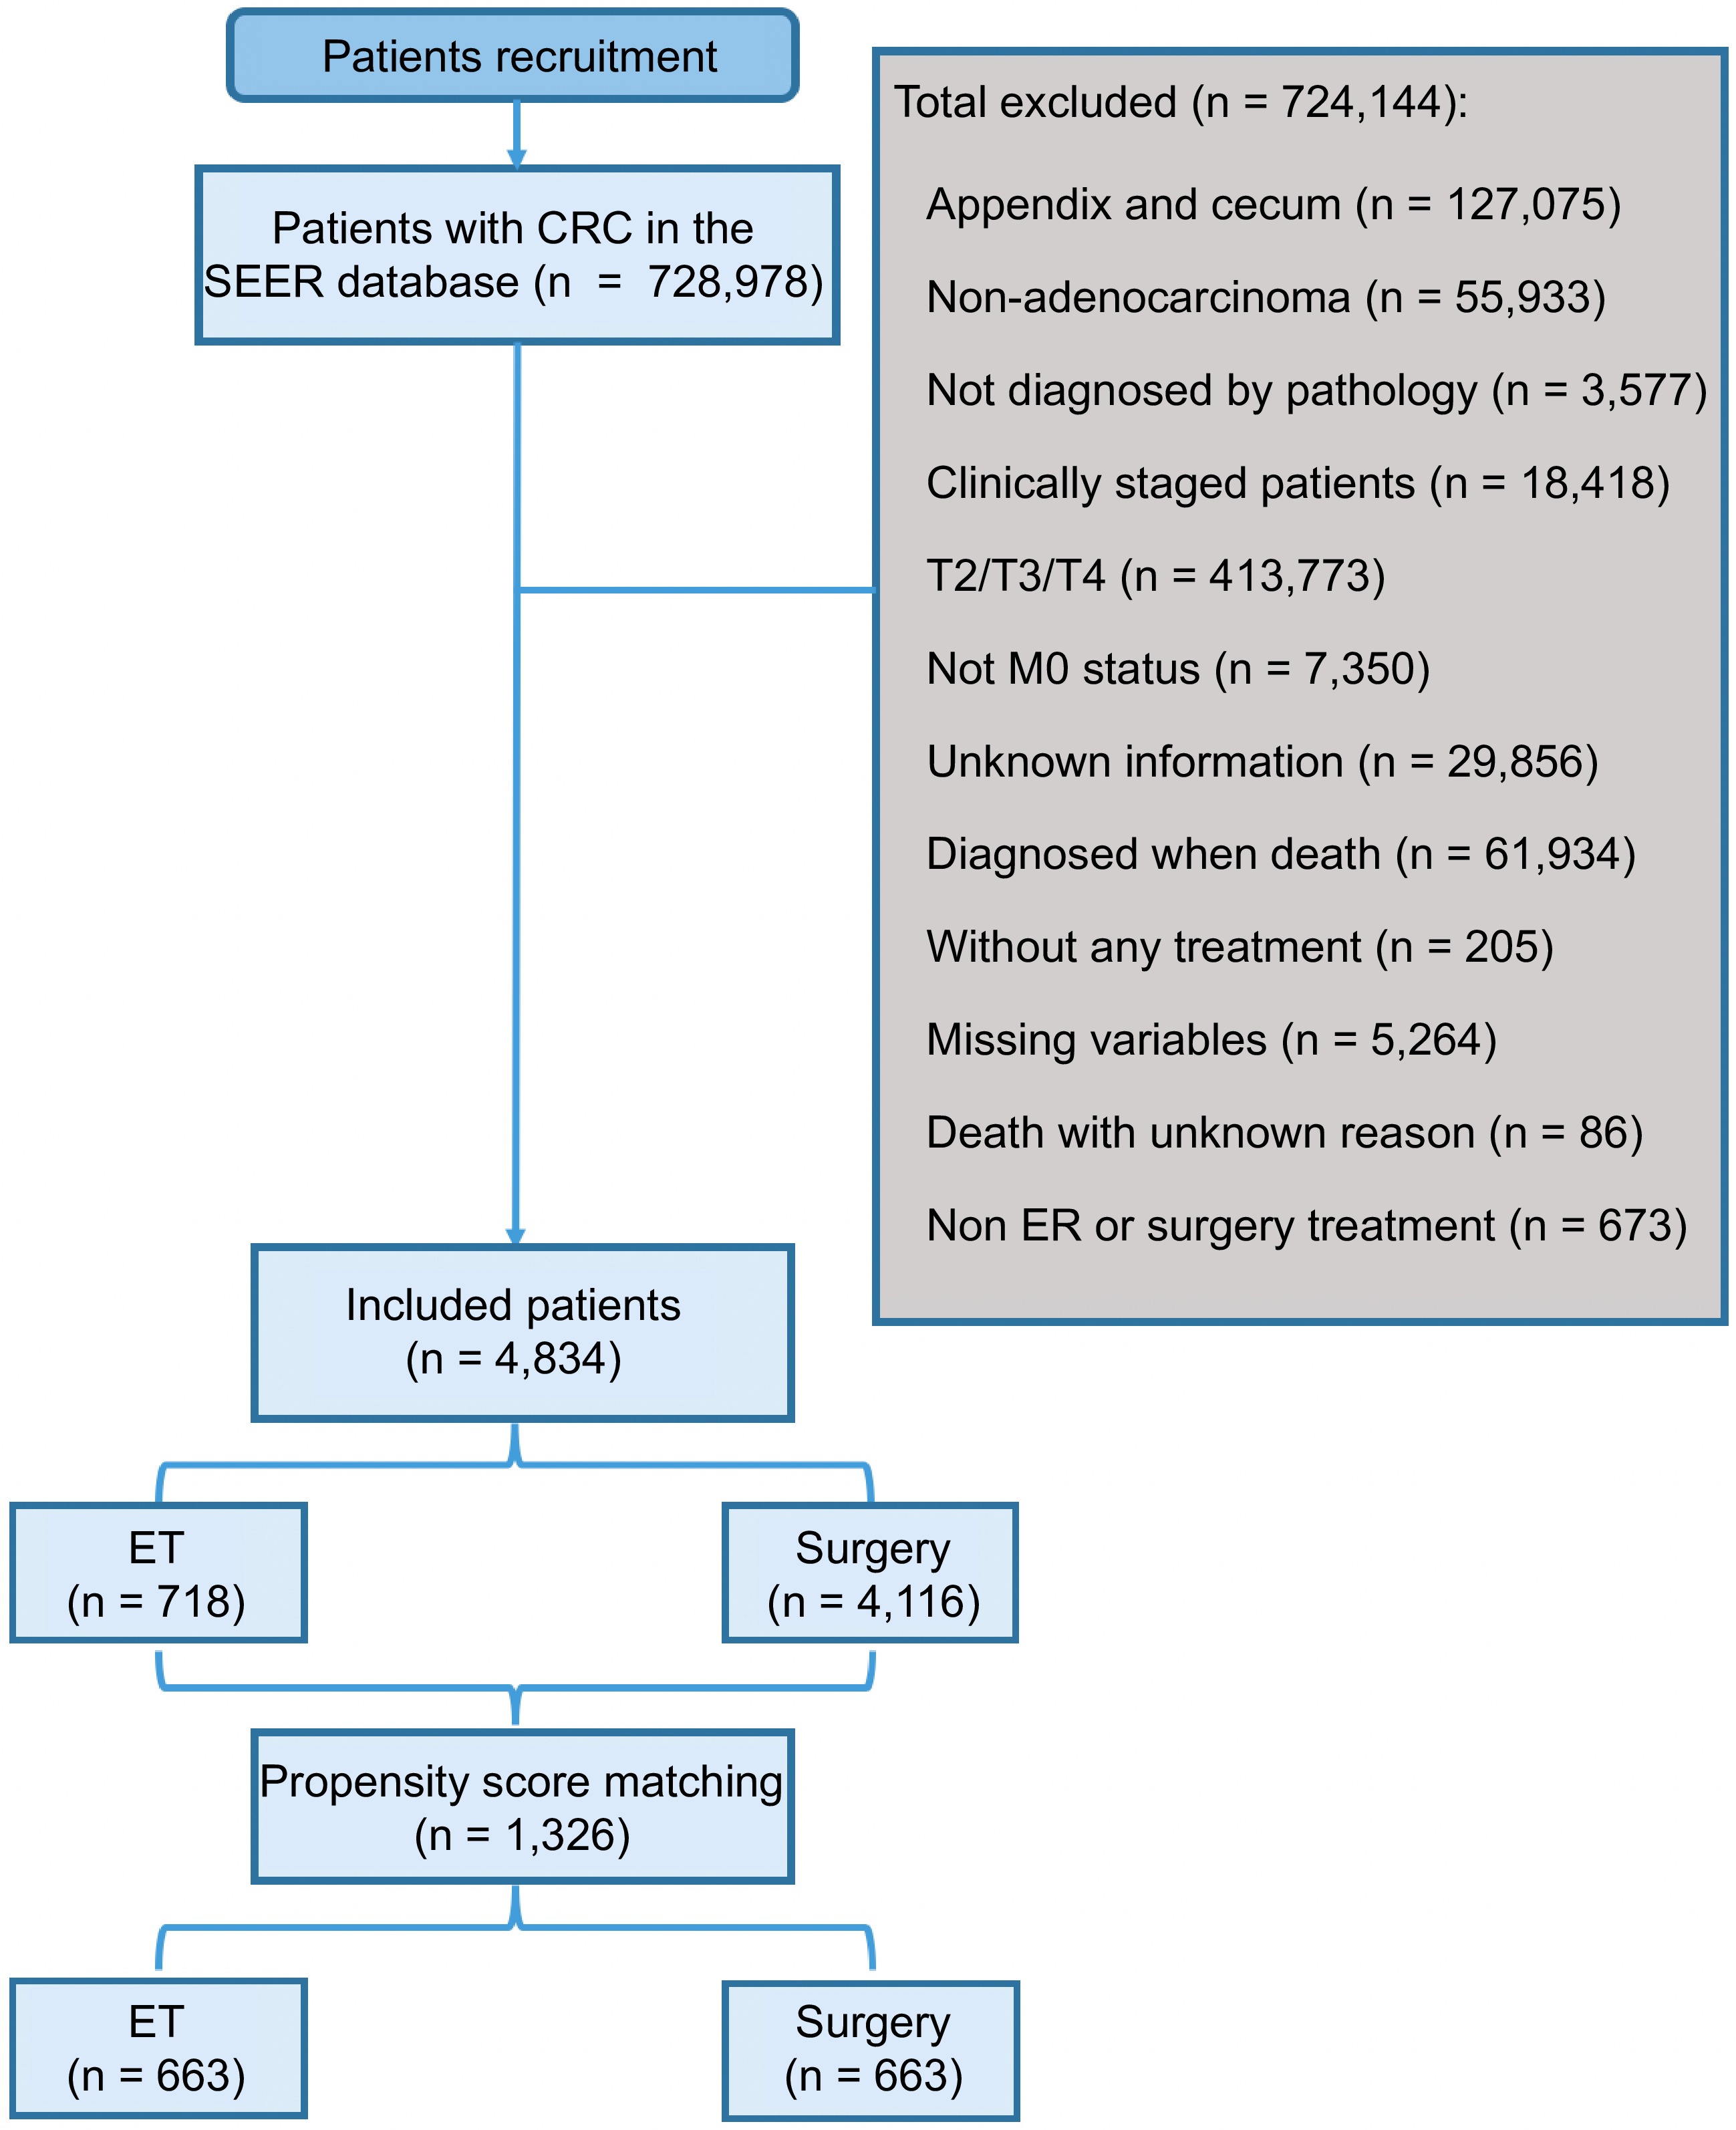
Figure 1.
Flow diagram of eligible patients diagnosed with T1 stage CRC.
-
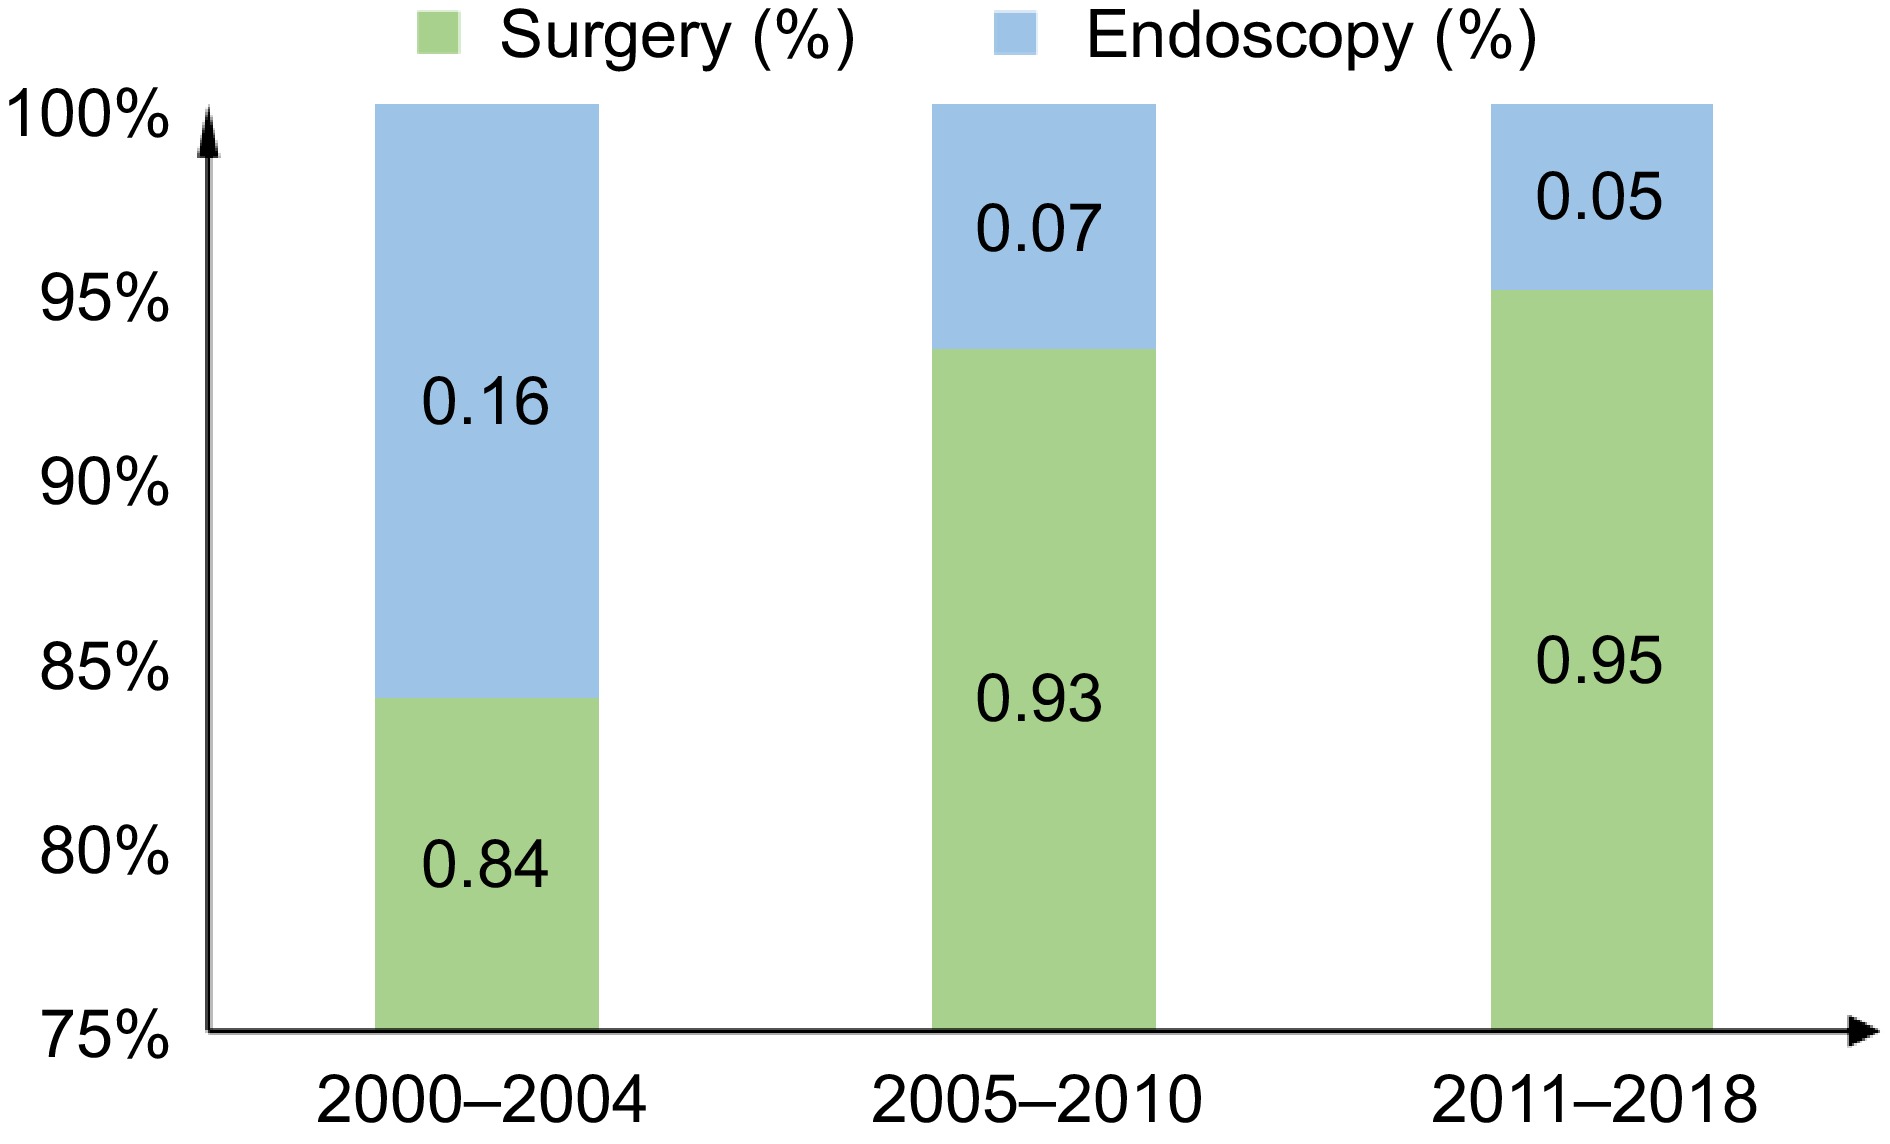
Figure 2.
Proportion of different treatments between 2000-2018.
-
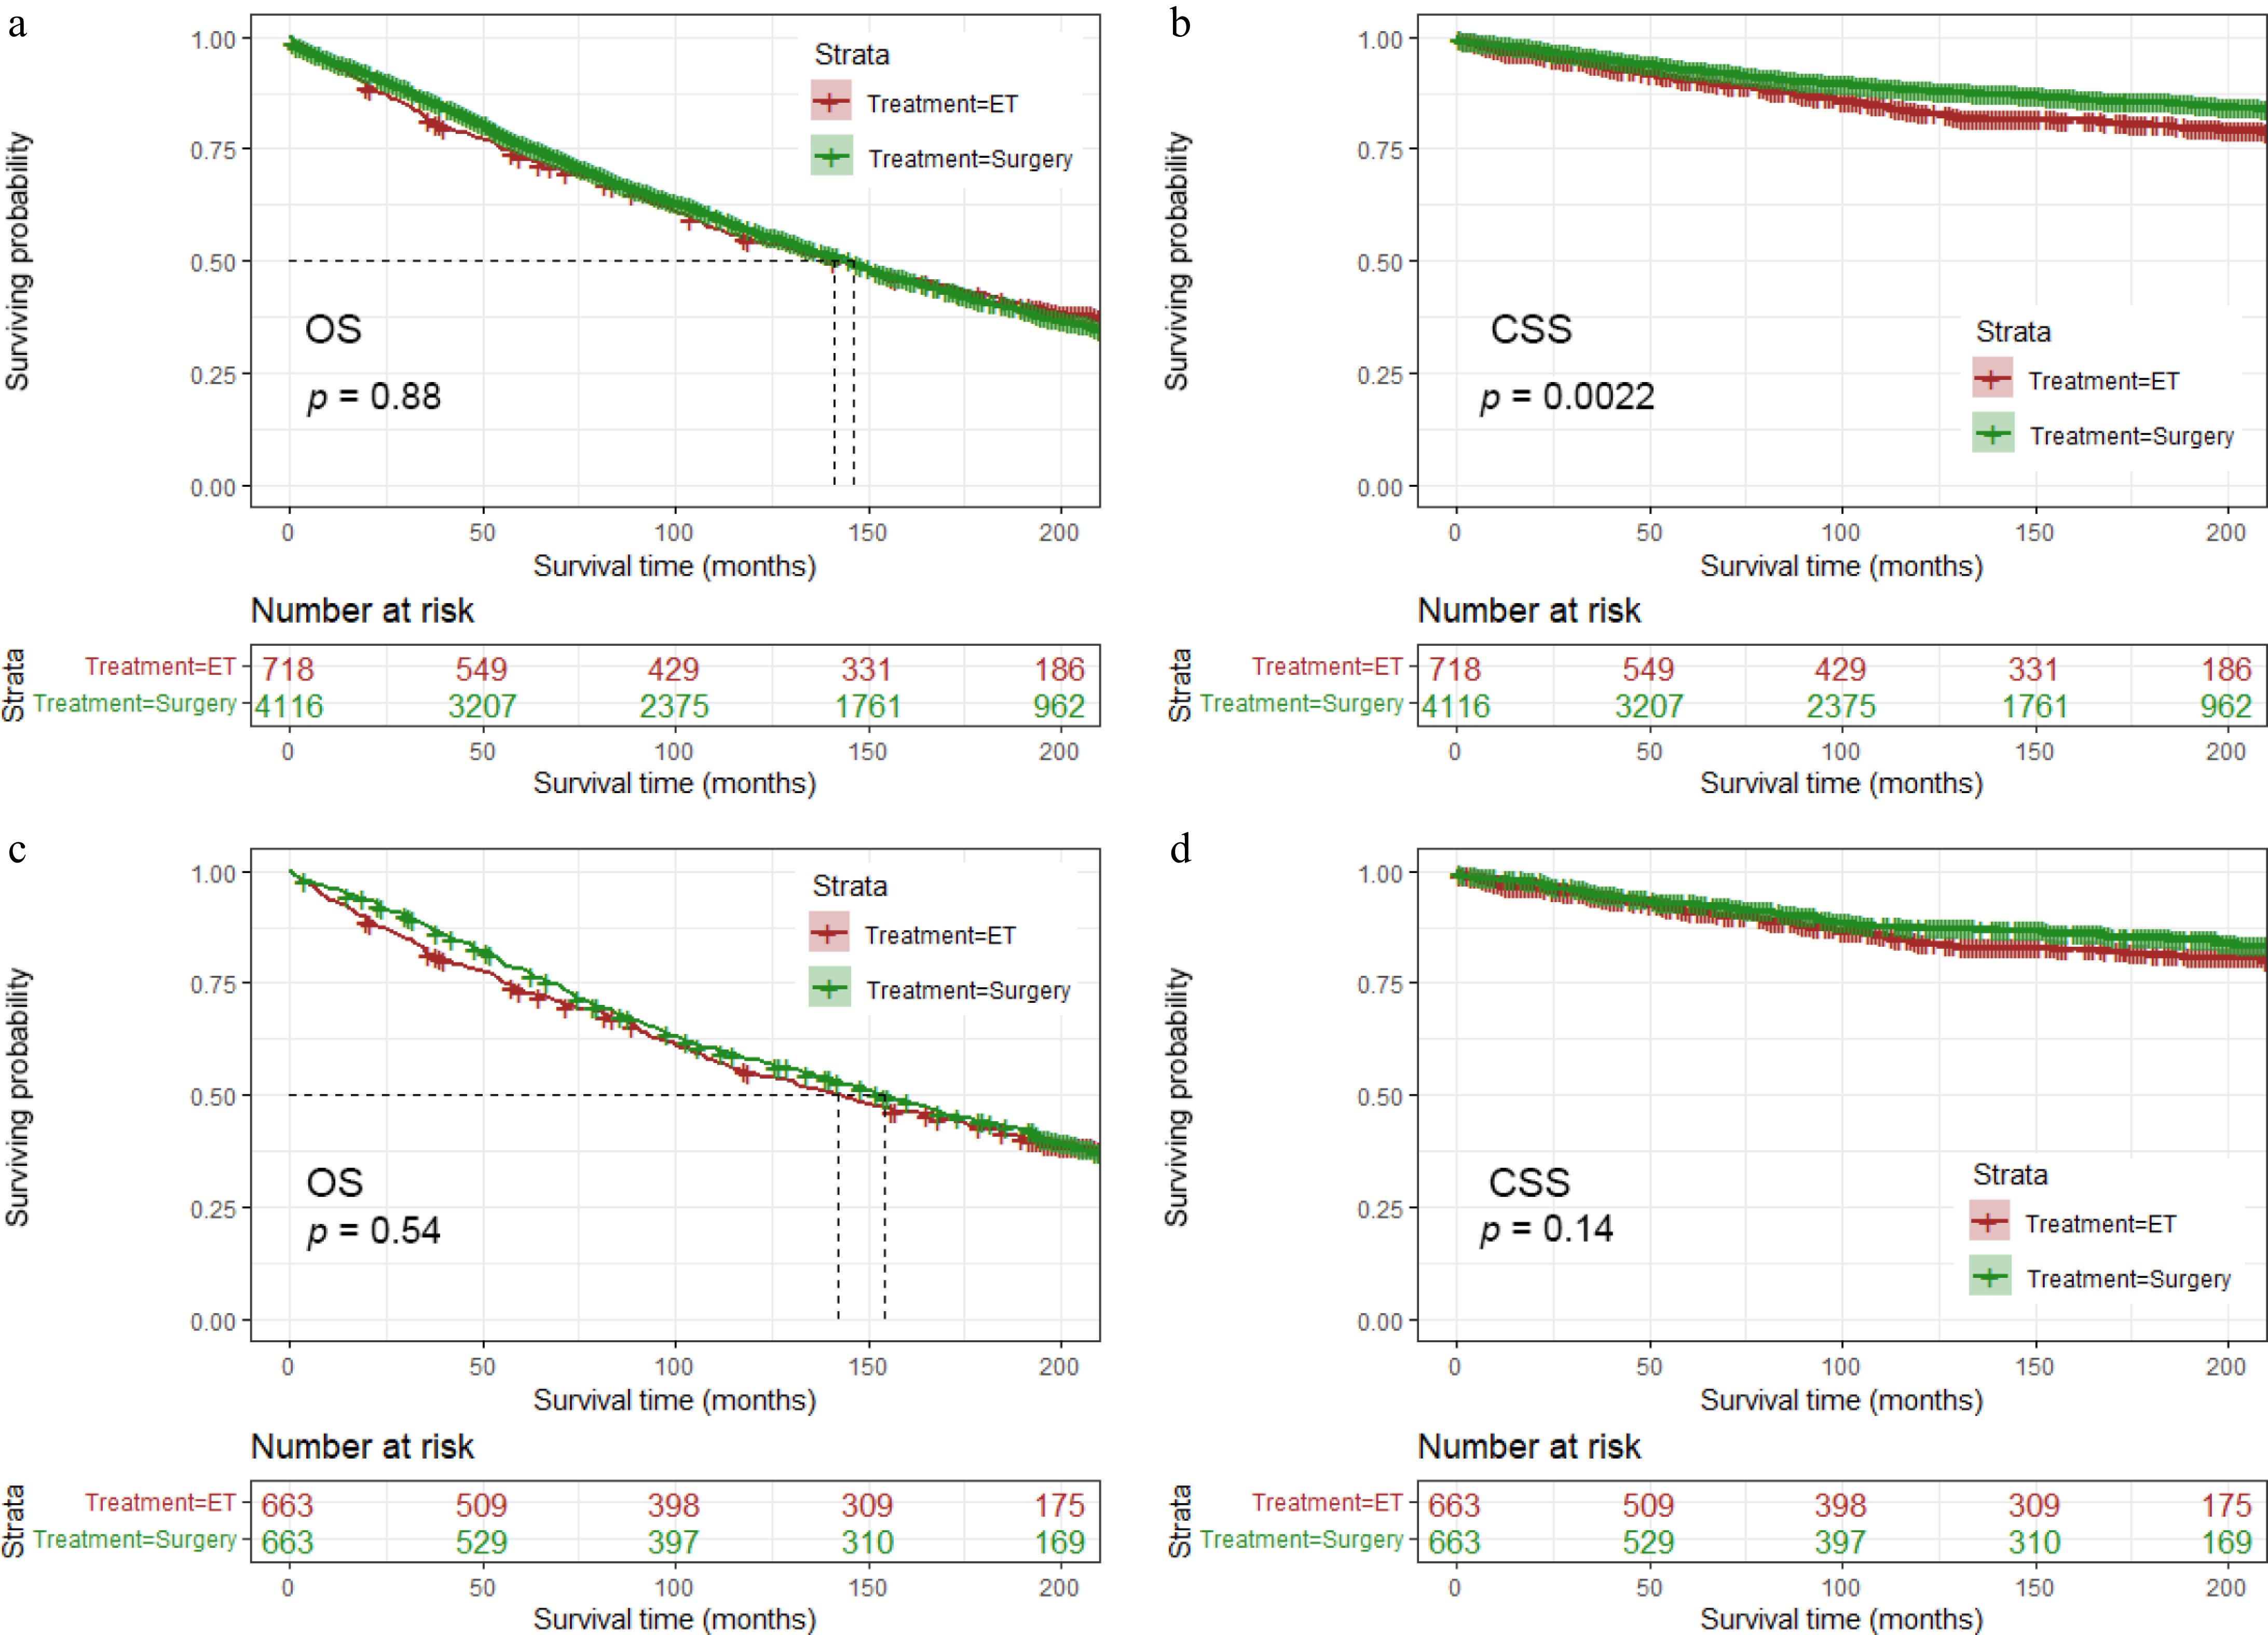
Figure 3.
Kaplan–Meier curves of overall and cancer-specific survival according to treatment methods (a), (b) before PSM, and (c), (d) after PSM.
-
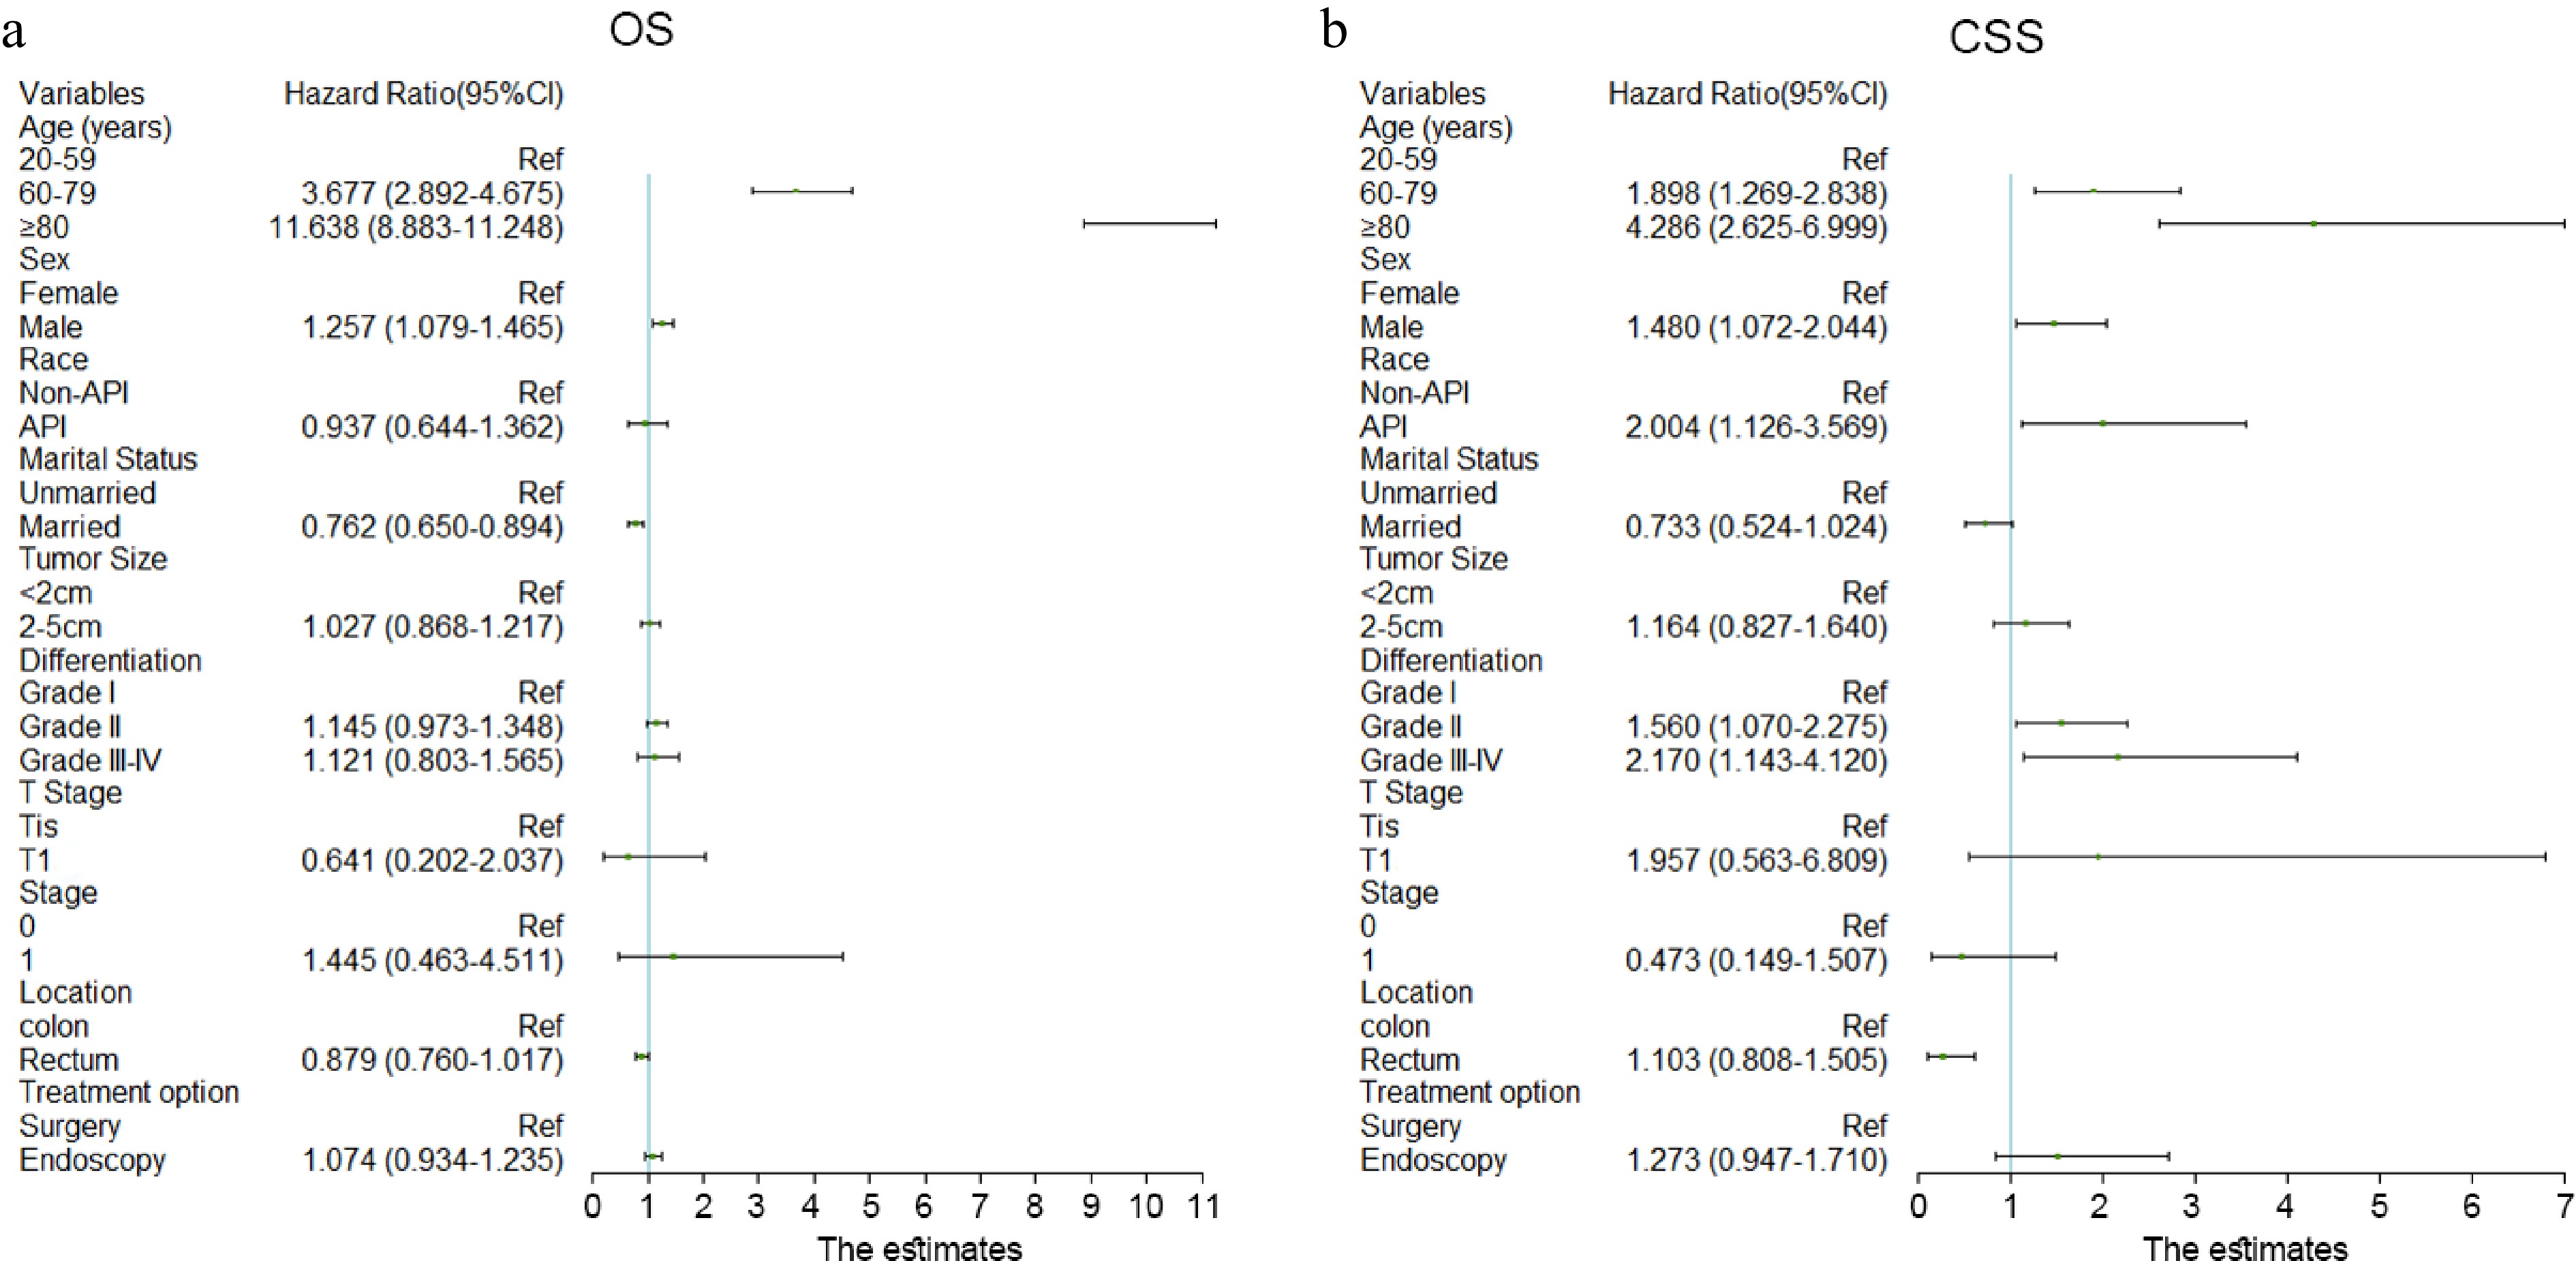
Figure 4.
Cox regression model of multivariable analyses in (a) OS, and (b) CSS.
-
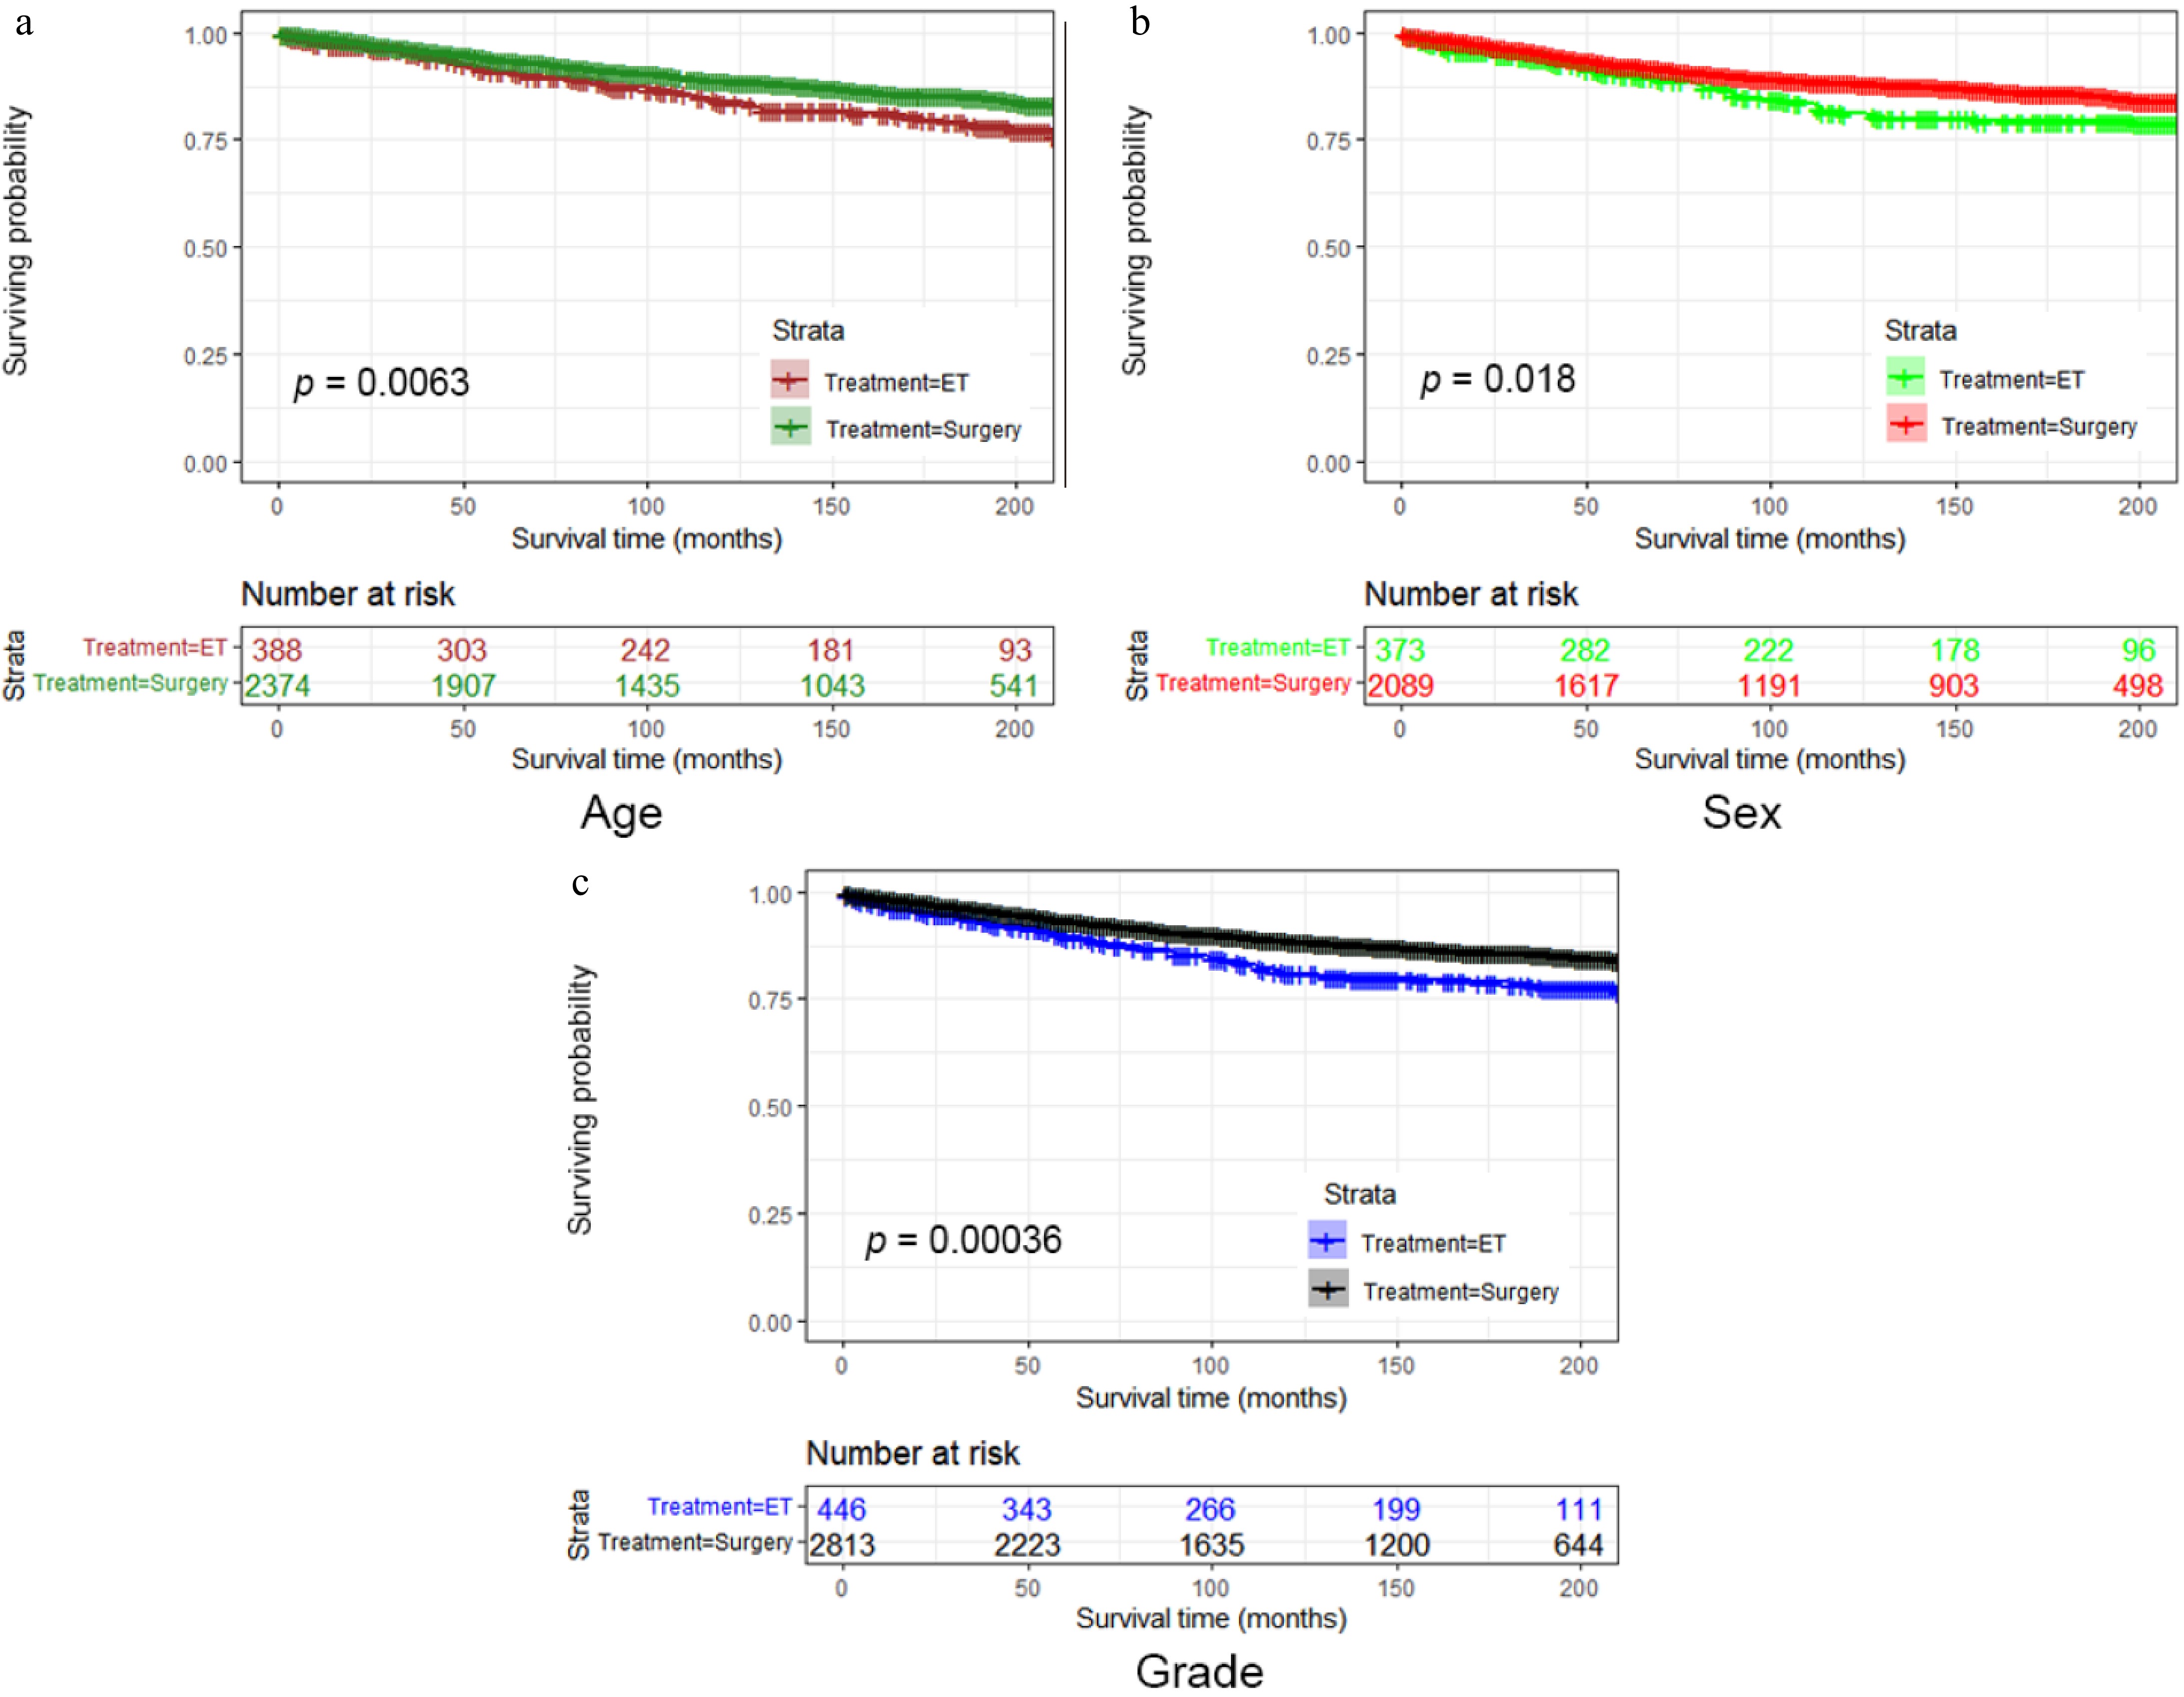
Figure 5.
Subgroup analysis divided by (a) age, (b) sex, or (c) histological grade of the CSS rate by the two treatment options.
-
Variables Surgery
(n = 4,116)ET
(n = 718)p-value Age (years) 20−59 970 (83.8) 188 (16.2) 0.175 60−79 2,374 (86.0) 388 (14.0) ≥ 80 772 (84.5) 142 (15.5) Marital status Unmarried 1,532 (84.8) 274 (15.2) 0.646 Married 2,584 (85.3) 444 (14.7) Sex Male 2,089 (84.8) 373 (15.2) 0.571 Female 2,027 (85.5) 345 (14.5) Race Non-API 3,840 (85.0) 675 (15.5) 0.515 API 276 (86.5) 43 (13.5) Tumor size ≤ 3 cm 2,413 (81.2) 557 (18.8) < 0.001 > 3 cm 1,703 (91.4) 161 (8.6) Histological
gradeGrade I 984 (81.4) 225 (18.6) < 0.001 Grade II 2,813 (86.3) 446 (13.7) Grade III−IV 319 (87.2) 47 (12.8) LNM Negative 3,888 (84.4) 716 (15.6) < 0.001 Positive 288 (99.1) 2 (0.9) Tumor location Colon 2,927 (90.4) 311 (9.6) < 0.001 Rectum 1,189 (74.5) 407 (25.5) Stage 0 269 (72.9) 100 (27.1) < 0.001 1 3,407 (85.0) 602 (15.0) 2 217 (93.9) 14 (6.1) 3 223 (99.1) 2 (0.9) T stage Tis 277 (73.5) 100 (26.5) < 0.001 T1 3,839 (86.1) 618 (13.9) Table 1.
Baseline characteristics of patients treated with surgery and ET for T1 stage colorectal cancer before PSM.
-
Variables Univariate analysis Multivariate analysis CSS OS CSS OS HR (95% CI) p-value HR (95% CI) p-value HR (95% CI) p-value HR (95% CI) p-value Age (years) 20–59 Ref 1.0 Ref 1.0 Ref 1.0 Ref 1.0 60–79 1.818 (1.448–2.283) < 0.001 3.409 (3.004–3.867) < 0.001 1.857 (1.477–2.335) < 0.001 3.363 (2.963–3.816) < 0.001 ≥ 80 3.818 (2.934–4.968) < 0.001 10.286 (8.963–11.805) < 0.001 3.757 (2.866–4.926) < 0.001 9.797 (8.513–11.273) < 0.001 Sex Female Ref 1.0 Ref 1.0 Ref 1.0 Ref 1.0 Male 1.075 (0.914–1.265) 0.384 1.073 (0.998–1.155) 0.058 1.270 (1.069–1.508) 0.007 1.302 (1.205–1.407) < 0.001 Race Non–API Ref 1.0 Ref 1.0 Ref 1.0 Ref 1.0 API 1.181 (0.874–1.596) 0.278 0.774 (0.658–0.910) 0.002 1.327 (0.980–1.796) 0.068 0.918 (0.780–1.080) 0.302 Marital status Unmarried Ref 1.0 Ref 1.0 Ref 1.0 Ref 1.0 Married 0.685 (0.581–0.807) < 0.001 0.660 (0.612–0.710) < 0.001 0.751 (0.628–0.897) 0.002 0.780 (0.720–0.846) < 0.001 Tumor size ≤ 3 cm Ref 1.0 Ref 1.0 Ref 1.0 Ref 1.0 > 3 cm 1.404 (1.193–1.652) < 0.001 1.182 (1.097–1.273) < 0.001 1.362 (1.153–1.610) < 0.001 1.101 (1.021–1.188) 0.013 Histological
gradeGrade I Ref 1.0 Ref 1.0 Ref 1.0 Ref 1.0 Grade II 1.177 (0.962–1.439) 0.113 1.025 (0.941–1.117) 0.569 1.156 (0.942–1.418) 0.166 1.014 (0.930–1.106) 0.753 Grade III–IV 1.725 (1.270–2.343) < 0.001 1.097 (0.942–1.276) 0.234 1.627 (1.193–2.219) 0.002 1.085 (0.931–1.265) 0.295 LNM Negative Ref 1.0 Ref 1.0 Ref 1.0 Ref 1.0 Positive 1.864 (1.383–2.511) < 0.001 1.004 (0.841–1.198) 0.966 0.595 (0.053–6.709) 0.674 0.248 (0.059–1.047) 0.058 T stage Tis Ref 1.0 Ref 1.0 Ref 1.0 Ref 1.0 T1 0.726 (0.552–0.954) 0.022 0.836 (0.733–0.953) 0.007 0.165 (0.023–1.194) 0.074 0.123 (0.039–0.385) < 0.001 Stage 0 Ref 1.0 Ref 1.0 Ref 1.0 Ref 1.0 1 0.732 (0.552–0.970) 0.030 0.858 (0.750–0.980) 0.024 4.779 (0.646–35.344) 0.125 7.463 (2.362–23.580) 0.001 2 0.669 (0.377–1.189) 0.171 0.825 (0.621–1.095) 0.183 4.965 (0.630–39.152) 0.128 7.942 (2.443–25.822) 0.001 3 1.359 (0.915–2.019) 0.129 0.849 (0.683–1.055) 0.140 16.551 (0.252–1087.739) 0.189 32.986 (2.877–387.235) 0.005 Location Colon Ref 1.0 Ref 1.0 Ref 1.0 Ref 1.0 Rectum 1.246 (1.056–1.472) 0.009 0.851 (0.787–0.921) < 0.001 1.238 (1.041–1.473) 0.016 0.934 (0.861–1.014) 0.101 Treatment
optionSurgery Ref 1.0 Ref 1.0 Ref 1.0 Ref 1.0 ET 1.375 (1.120–1.687) 0.002 0.992 (0.896–1.098) 0.878 1.474 (1.184–1.834) 0.001 1.080 (0.970–1.203) 0.159 CI, confidence interval; CSS, cancer–specific survival; OS, overall survival; HR, hazard ratio; API, Asian Pacific Islander. Table 2.
Univariate and multivariate analyses of OS and CSS in patients with T1 stage colorectal cancer treated with surgery and endoscopy before propensity score matching.
-
Variables Surgery
(n = 663) n (%)Endoscopy
(n = 663) n (%)p-value Age (years) 20−59 170 (50) 170 (50) 0.991 60−79 367 (49.9) 369 (50.1) ≥ 80 126 (50.4) 124 (49.6) Marital status Unmarried 248 (49.8) 250 (50.2) 0.955 Married 415 (50.1) 413 (49.9) Sex Male 341 (49.8) 344 (50.2) 0.912 Female 322 (50.2) 319 (49.8) Race Non-API 632 (50.0) 633 (50.0) 1.000 API 31 (50.8) 30 (49.2) Tumor size ≤ 3 cm 511 (50.0) 511 (50.0) 1.000 > 3 cm 152 (50.0) 152 (50.0) Histological
gradeGrade I 198 (50.0) 198 (50.0) 1.000 Grade II 430 (50.1) 429 (49.9) Grade III-IV 35 (49.3) 36 (50.7) LNM Negative 662 (50.0) 662 (50.0) 1.000 Positive 1 (50.0) 1 (50.0) Location Colon 301 (50) 301 (50) 1.000 Rectum 362 (50) 362 (50) Stage 0 69 (49.6) 70 (50.4) 0.988 1 583 (50.1) 581 (49.9) 2 10 (47.6) 11 (52.4) 3 1 (50) 1 (50) T stage Tis 69 (49.6) 70 (50.4) 1.000 T1 594 (50) 593 (50.0) Table 3.
Baseline characteristics of patients treated with surgery and ET for T1 stage colorectal cancer after PSM.
-
Variables Univariate analysis Multivariate analysis CSS OS CSS OS HR (95% CI) p-value HR (95% CI) p-value HR (95% CI) p-value HR (95% CI) p-value Age (years) 20–59 Ref 1.0 Ref 1.0 Ref 1.0 Ref 1.0 60–79 1.811 (1.216–2.699) 0.003 3.698 (2.912–4.696) < 0.001 1.898 (1.269–2.838) 0.002 3.677 (2.892–4.675) < 0.001 ≥ 80 4.070 (2.557–6.476) < 0.001 12.375 (9.527–16.075) < 0.001 4.286 (2.625–6.999) <0.001 11.638 (8.883–11.248) < 0.001 Sex Female Ref 1.0 Ref 1.0 Ref 1.0 Ref 1.0 Male 1.120 (0.834–1.505) 0.452 0.915 (0.975–1.051) 0.209 1.480 (1.072–2.044) 0.017 1.257 (1.079–1.465) 0.003 Race Non–API Ref 1.0 Ref 1.0 Ref 1.0 Ref 1.0 API 1.531 (0.870–2.692) 0.139 0.720 (0.497–1.043) 0.083 2.004 (1.126–3.569) 0.018 0.937 (0.644–1.362) 0.733 Marital status Unmarried Ref 1.0 Ref 1.0 Ref 1.0 Ref 1.0 Married 0.667 (0.495–0.899) 0.008 0.599 (0.486–0.644) < 0.001 0.733 (0.524–1.024) 0.068 0.762 (0.650–0.894) 0.001 Tumor size ≤ 3 cm Ref 1.0 Ref 1.0 Ref 1.0 Ref 1.0 > 3 cm 1.242 (0.890–1.733) 0.203 1.042 (0.883–1.229) 0.627 1.164 (0.827–1.640) 0.384 1.027 (0.868–1.217) 0.754 Histological
gradeGrade I Ref 1.0 Ref 1.0 Ref 1.0 Ref 1.0 Grade II 1.534 (1.067–2.204) 0.021 1.043 (0.893–1.218) 0.598 1.560 (1.070–2.275) 0.021 1.145 (0.973–1.348) 0.102 Grade III–IV 2.042 (1.088–3.834) 0.026 1.084 (0.780–1.506) 0.632 2.170 (1.143–4.120) 0.018 1.121 (0.803–1.565) 0.503 Nodal status Negative Ref 1.0 Ref 1.0 Ref 1.0 Ref 1.0 Positive NA NA 0.050 (0.001–44.849) 0.387 NA NA NA NA T stage Tis Ref 1.0 Ref 1.0 Ref 1.0 Ref 1.0 T1 1.083 (0.657–1.786) 0.754 0.910 (0.729–1.136) 0.403 1.957 (0.563–6.809) 0.291 0.641 (0.202–2.037) 0.451 Stage 0 Ref 1.0 Ref 1.0 Ref 1.0 Ref 1.0 1 1.077 (0.653–1.776) 0.773 0.916 (0.734–1.143) 0.436 0.473 (0.149–1.507) 0.205 1.445 (0.463–4.511) 0.526 2 1.937 (0.565–6.641) 0.293 0.472 (0.149–1.494) 0.201 NA NA NA NA 3 NA NA NA NA NA NA NA NA Location Colon Ref 1.0 Ref 1.0 Ref 1.0 Ref 1.0 Rectum 1.150 (0.853–1.550) 0.360 0.860 (0.748–0.989) 0.034 1.103 (0.808–1.505) 0.536 0.879 (0.760–1.017) 0.082 Treatment
optionSurgery Ref 1.0 Ref 1.0 Ref 1.0 Ref 1.0 ET 1.246 (0.927–1.673) 0.145 1.044 (0.908–1.201) 0.541 1.273 (0.947–1.710) 0.110 1.074 (0.934–1.235) 0.316 CI, confidence interval; CSS, cancer–specific survival; OS, overall survival; HR, hazard ratio; API, Asian Pacific Islander. Table 4.
Univariate and multivariate analyses of OS and CSS in patients with T1 stage colorectal cancer treated with surgery and ET after PSM.
Figures
(5)
Tables
(4)