-
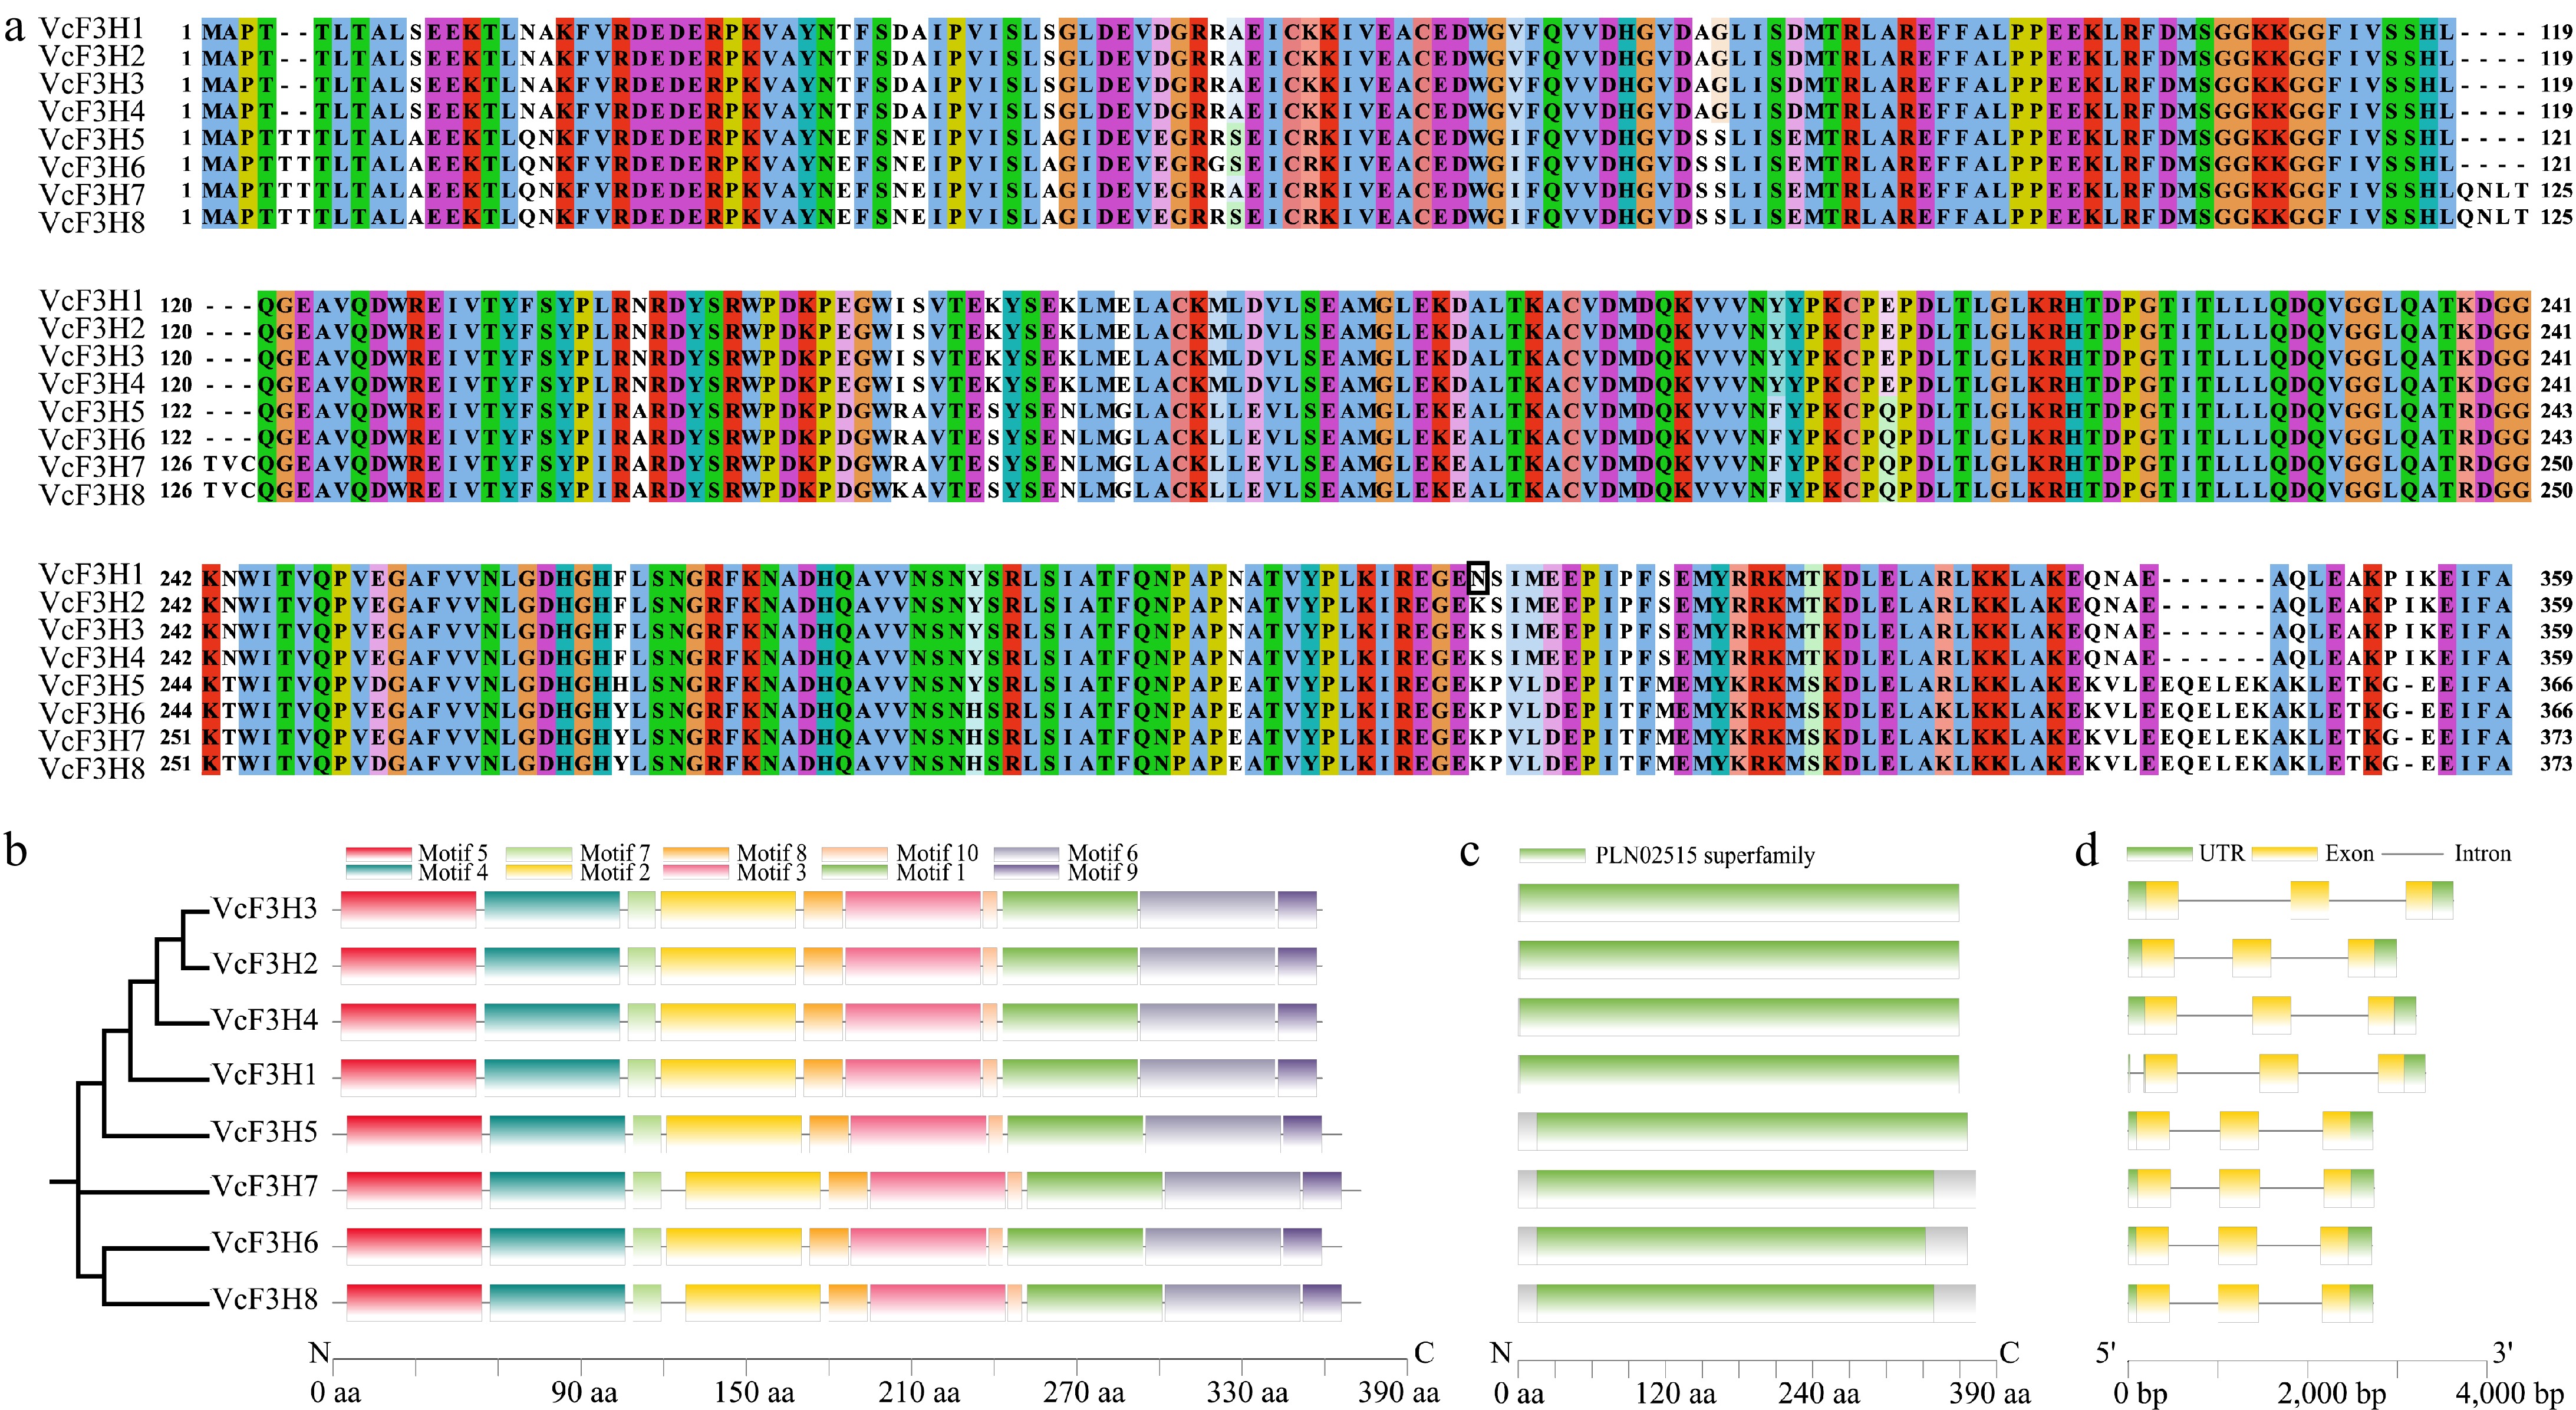
Figure 1.
(a) Sequence alignment, (b) conserved motifs, (c) domain, and (d) gene structure analysis results of the eight anthocyanin-related VcF3Hs identified in blueberry.
-
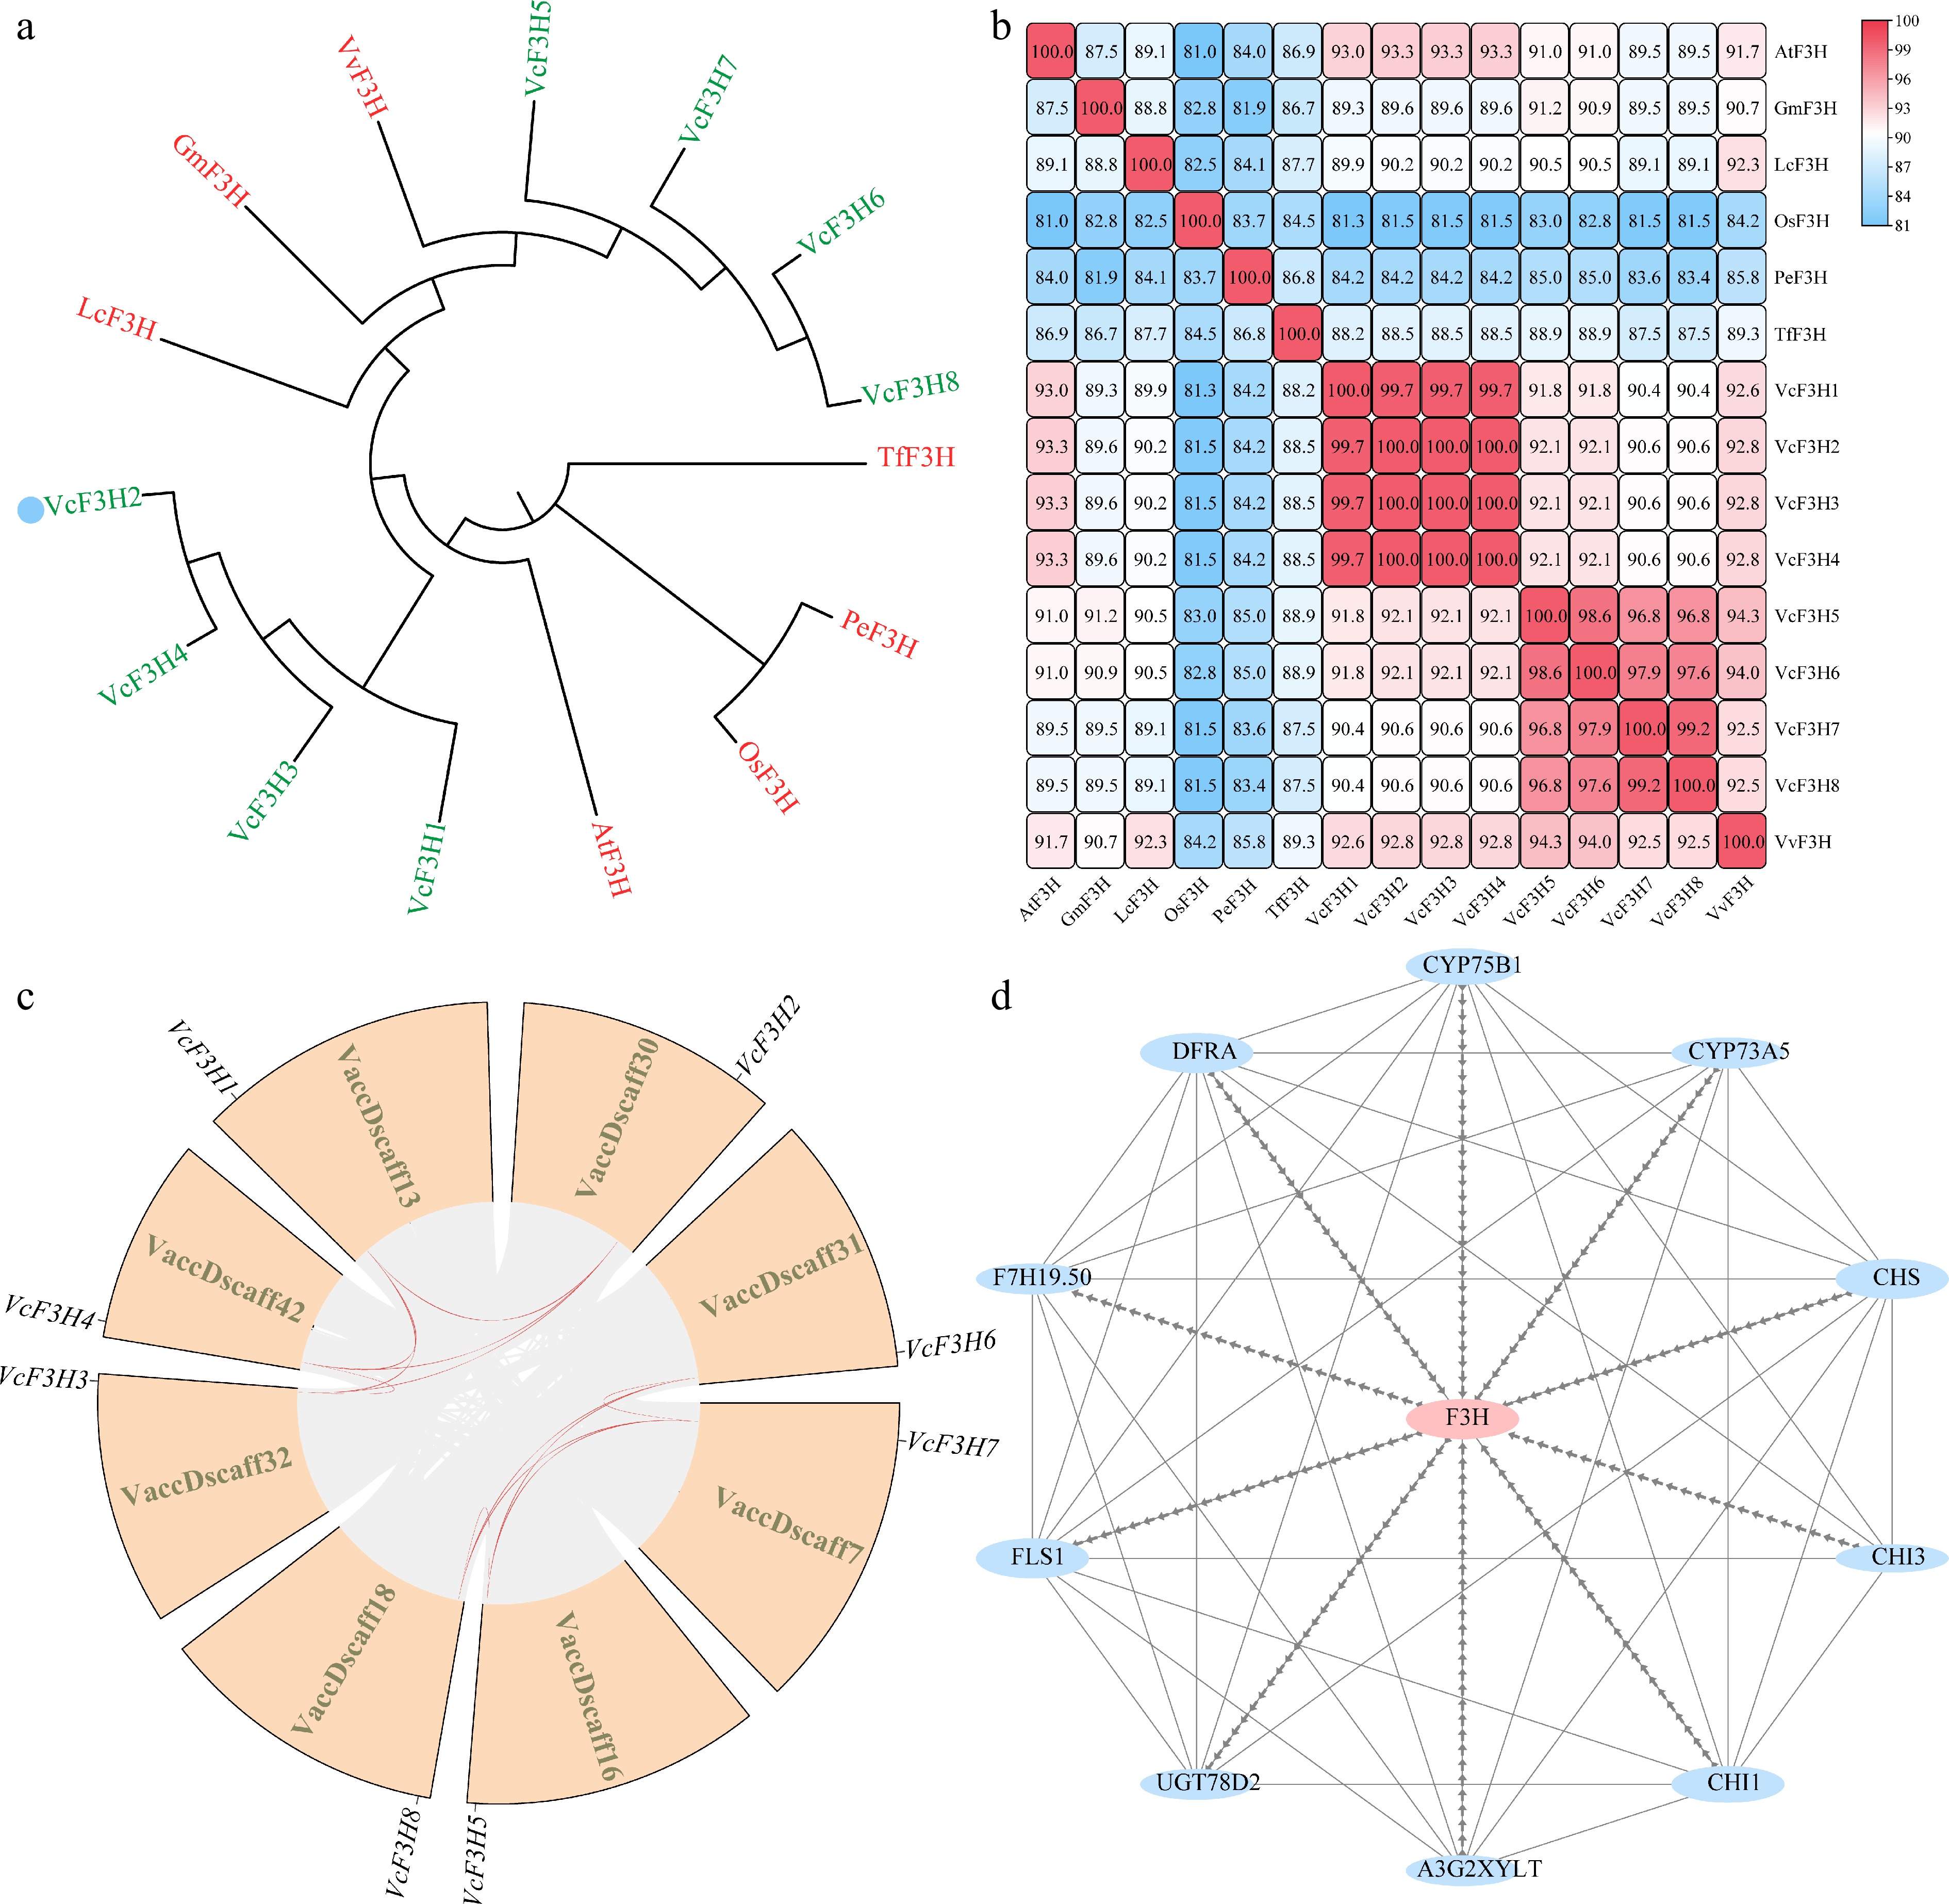
Figure 2.
(a) Phylogenetic, (b) similarity, (c) synteny, and (d) interacting protein analysis results of VcF3Hs.
-
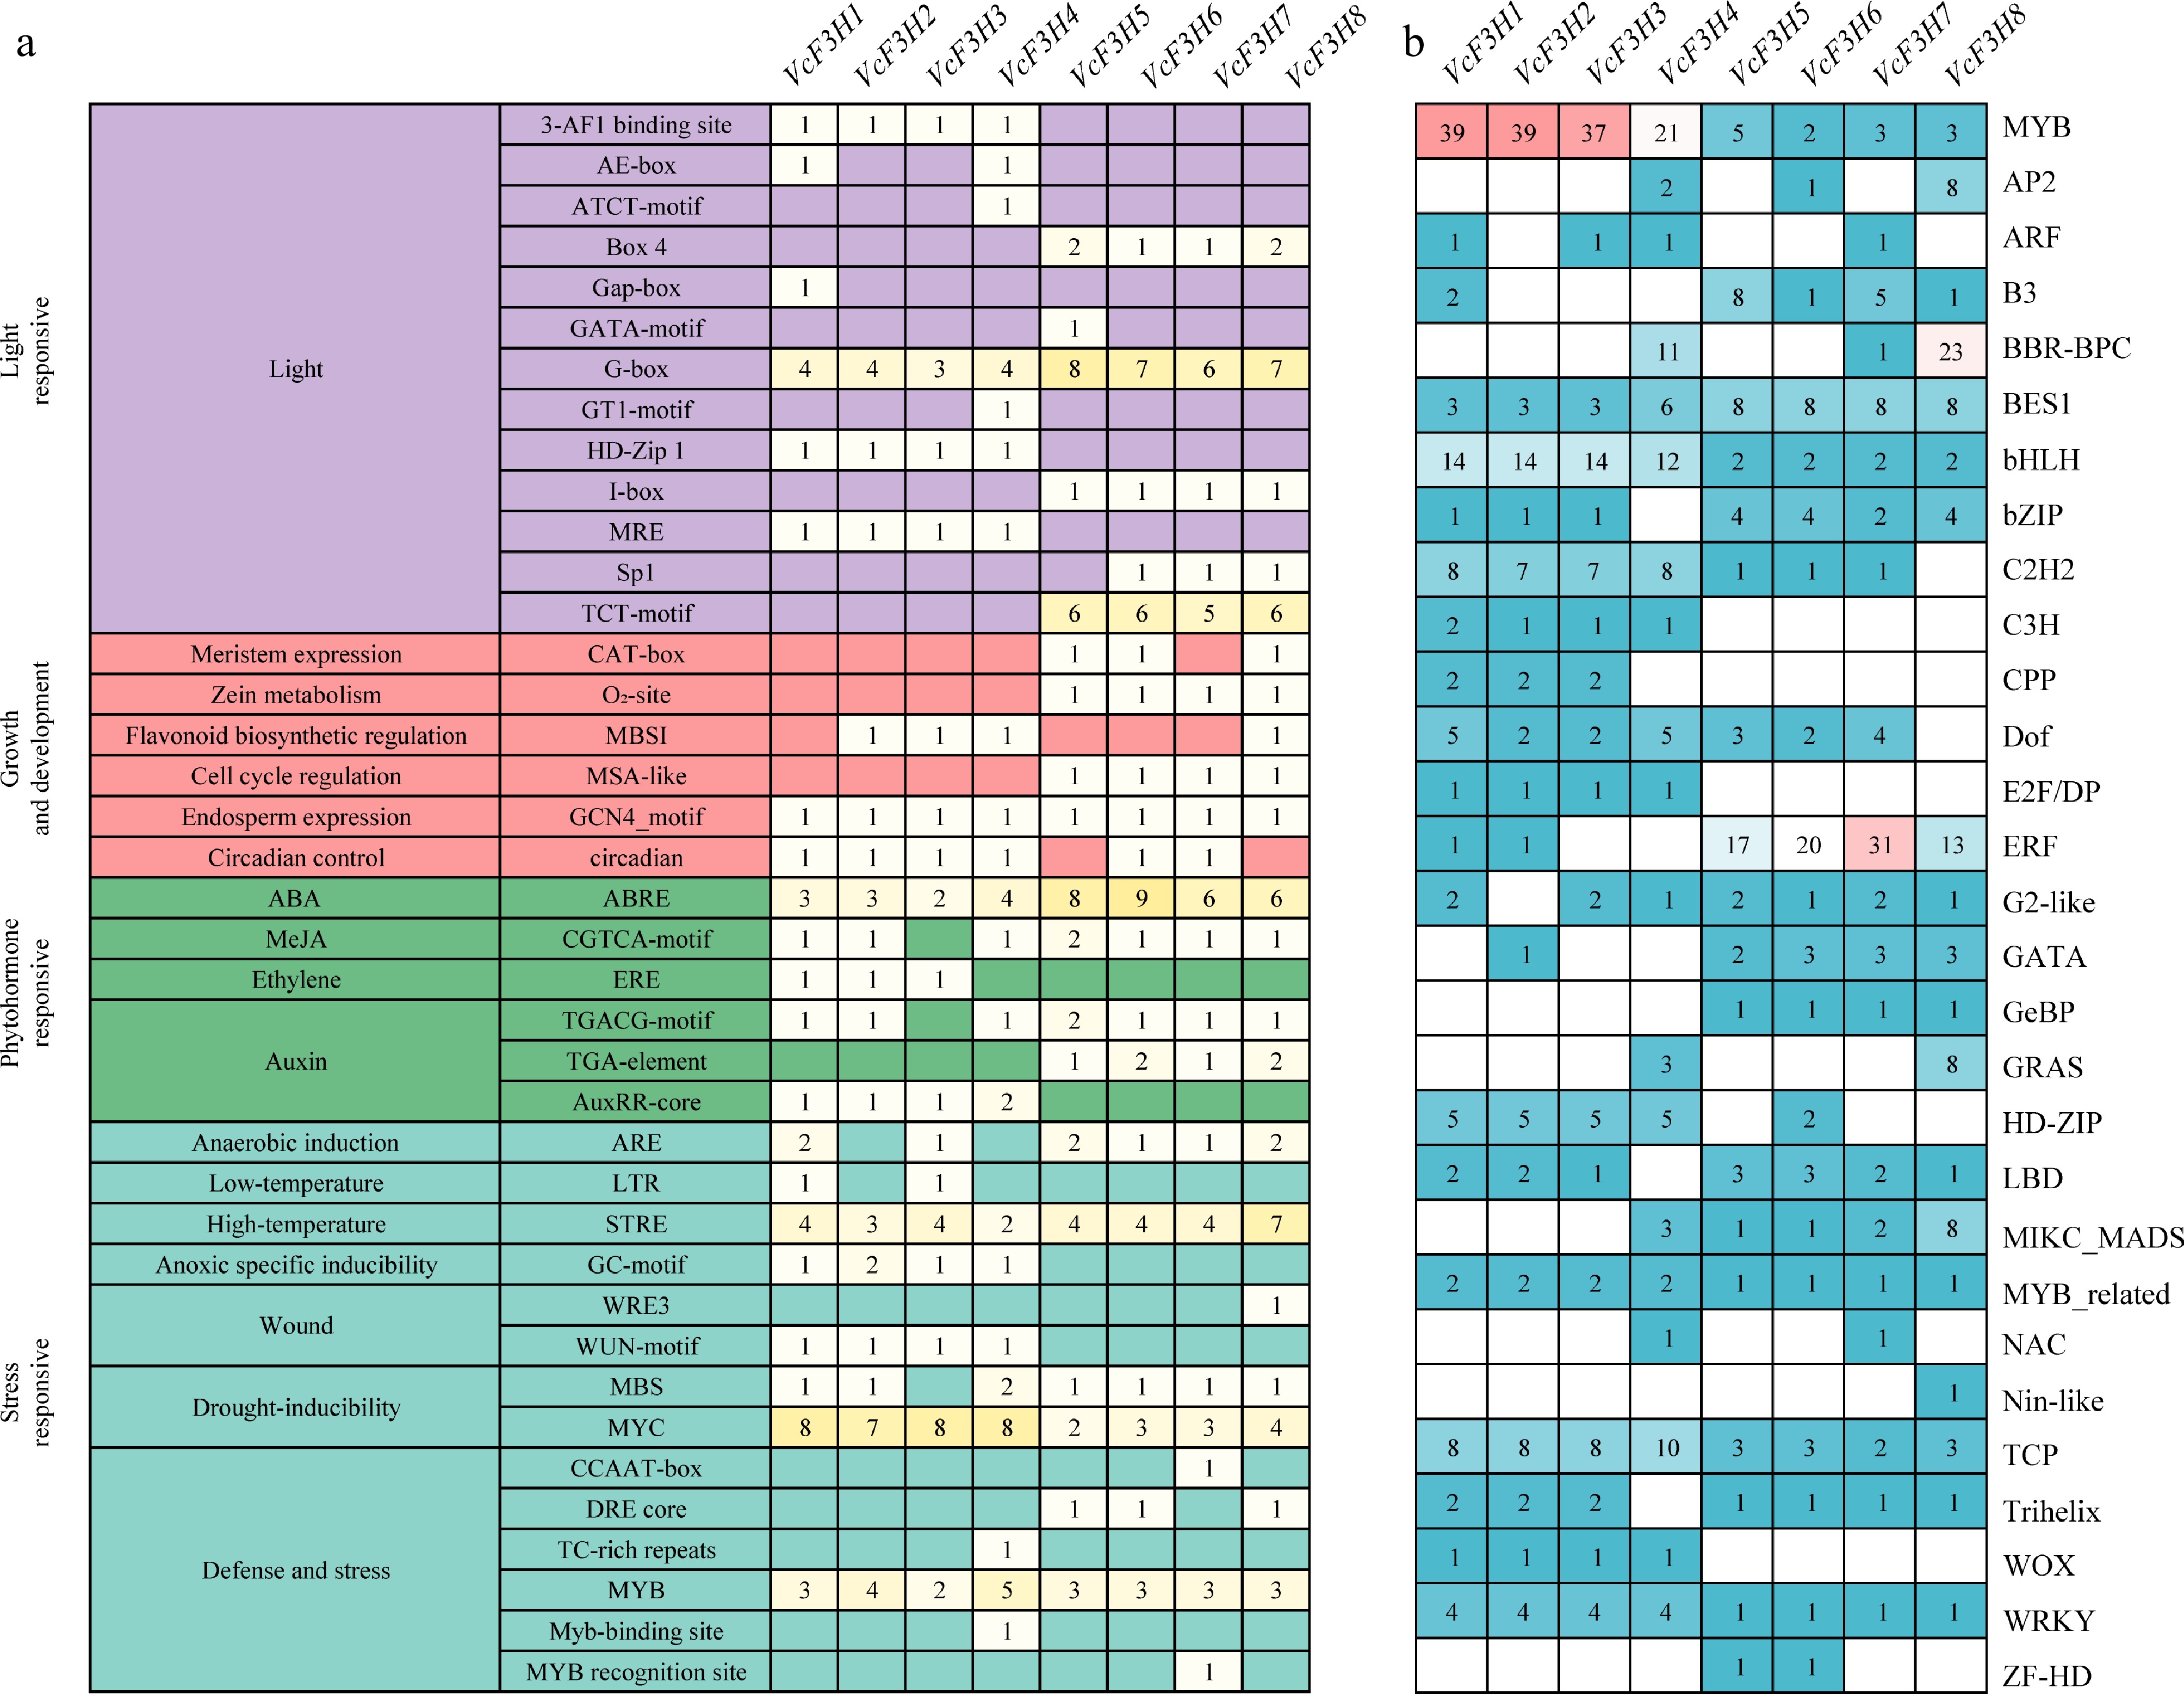
Figure 3.
Predicted (a) cis-acting elements, and (b) transcription factor binding sites in promoters of VcF3H.
-
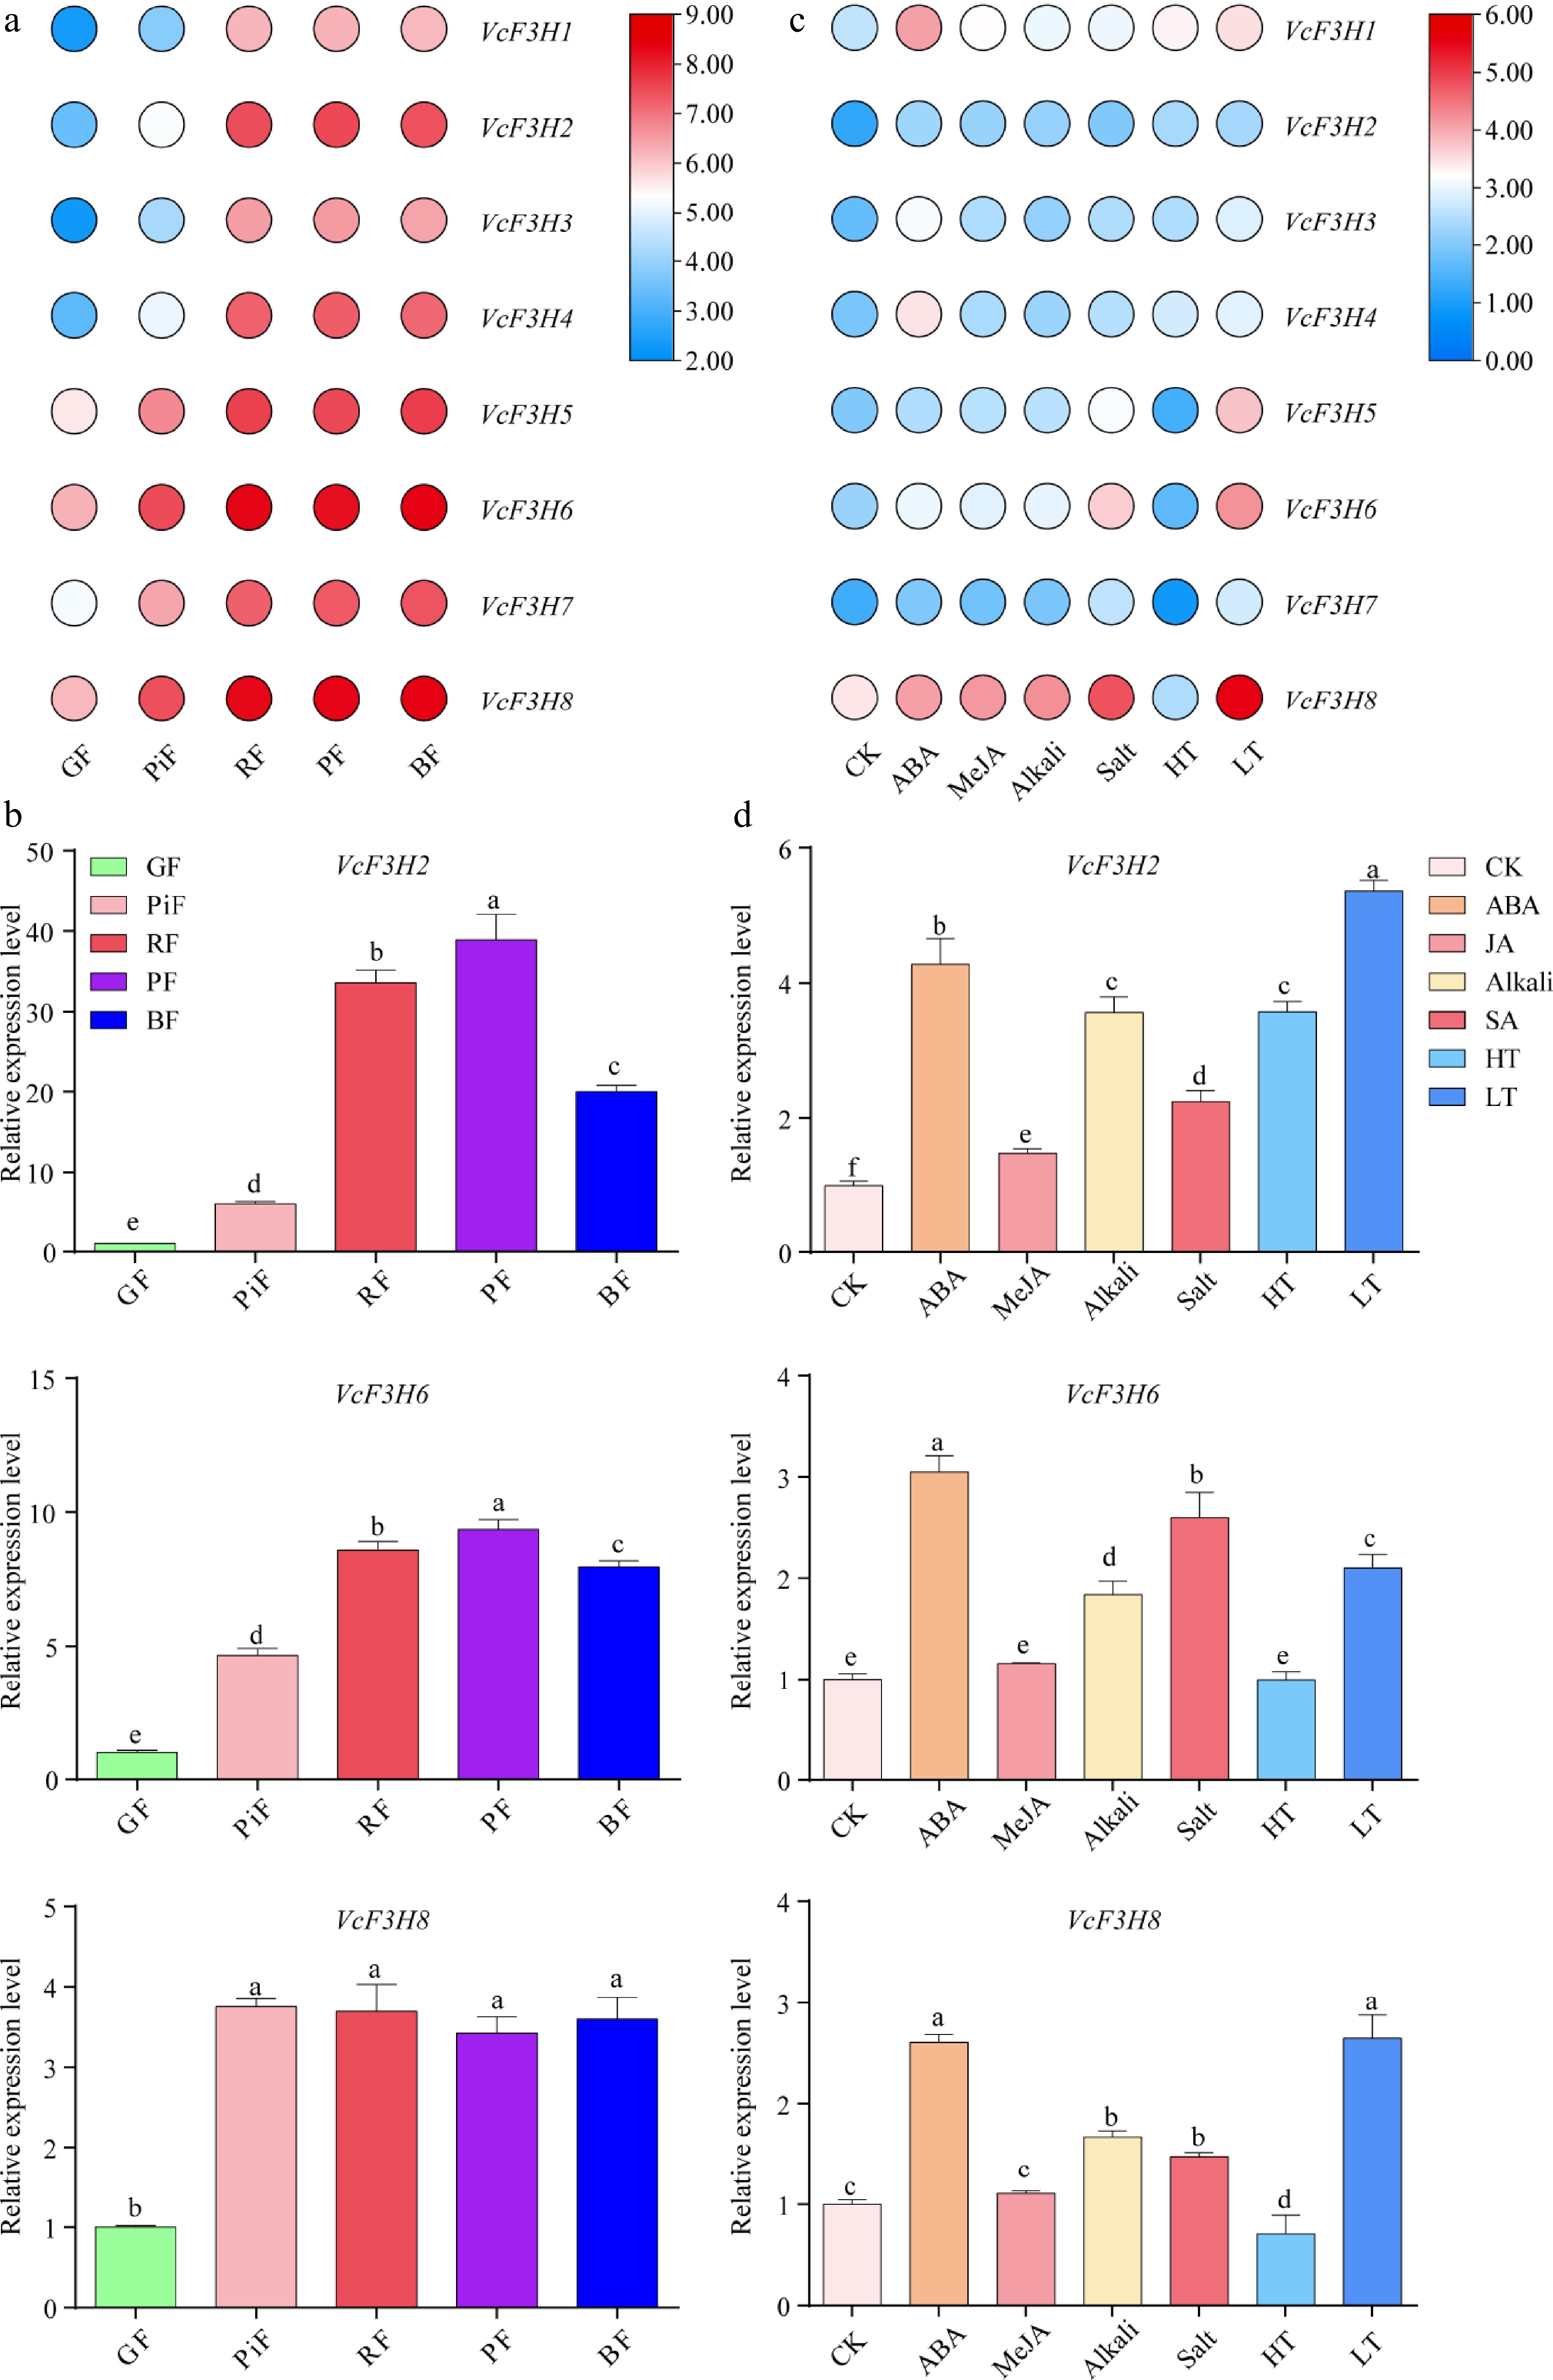
Figure 4.
Gene expression analysis results of VcF3Hs in (a), (b) fruits at five different ripening stages, and (c), (d) in leaves treated with different phytohormones and abiotic stresses. (a) and (c) are transcriptome data analysis results. The Log2 (FPKM + 1) value is used for heatmap drawing. The redder the color, the higher the gene expression, and the bluer the color, the lower the gene expression. (b) and (d) are qRT-PCR analysis results. Different letters above columns represent a significant difference at the p < 0.05 level. GF: green fruit; PiF: pink fruit; RF: red fruit; PF: purple fruit; BF: blue fruit; CK: nontreated control leaf; ABA, MeJA, Alkali, Salt, HT, and LT represents leaf treated with 100 mM ABA, 100 mM MeJA, 200 mM NaCl, and Na2SO4, 200 mM NaHCO3 and Na2CO3, 4 °C low temperature and 40 °C high temperature, respectively.
-
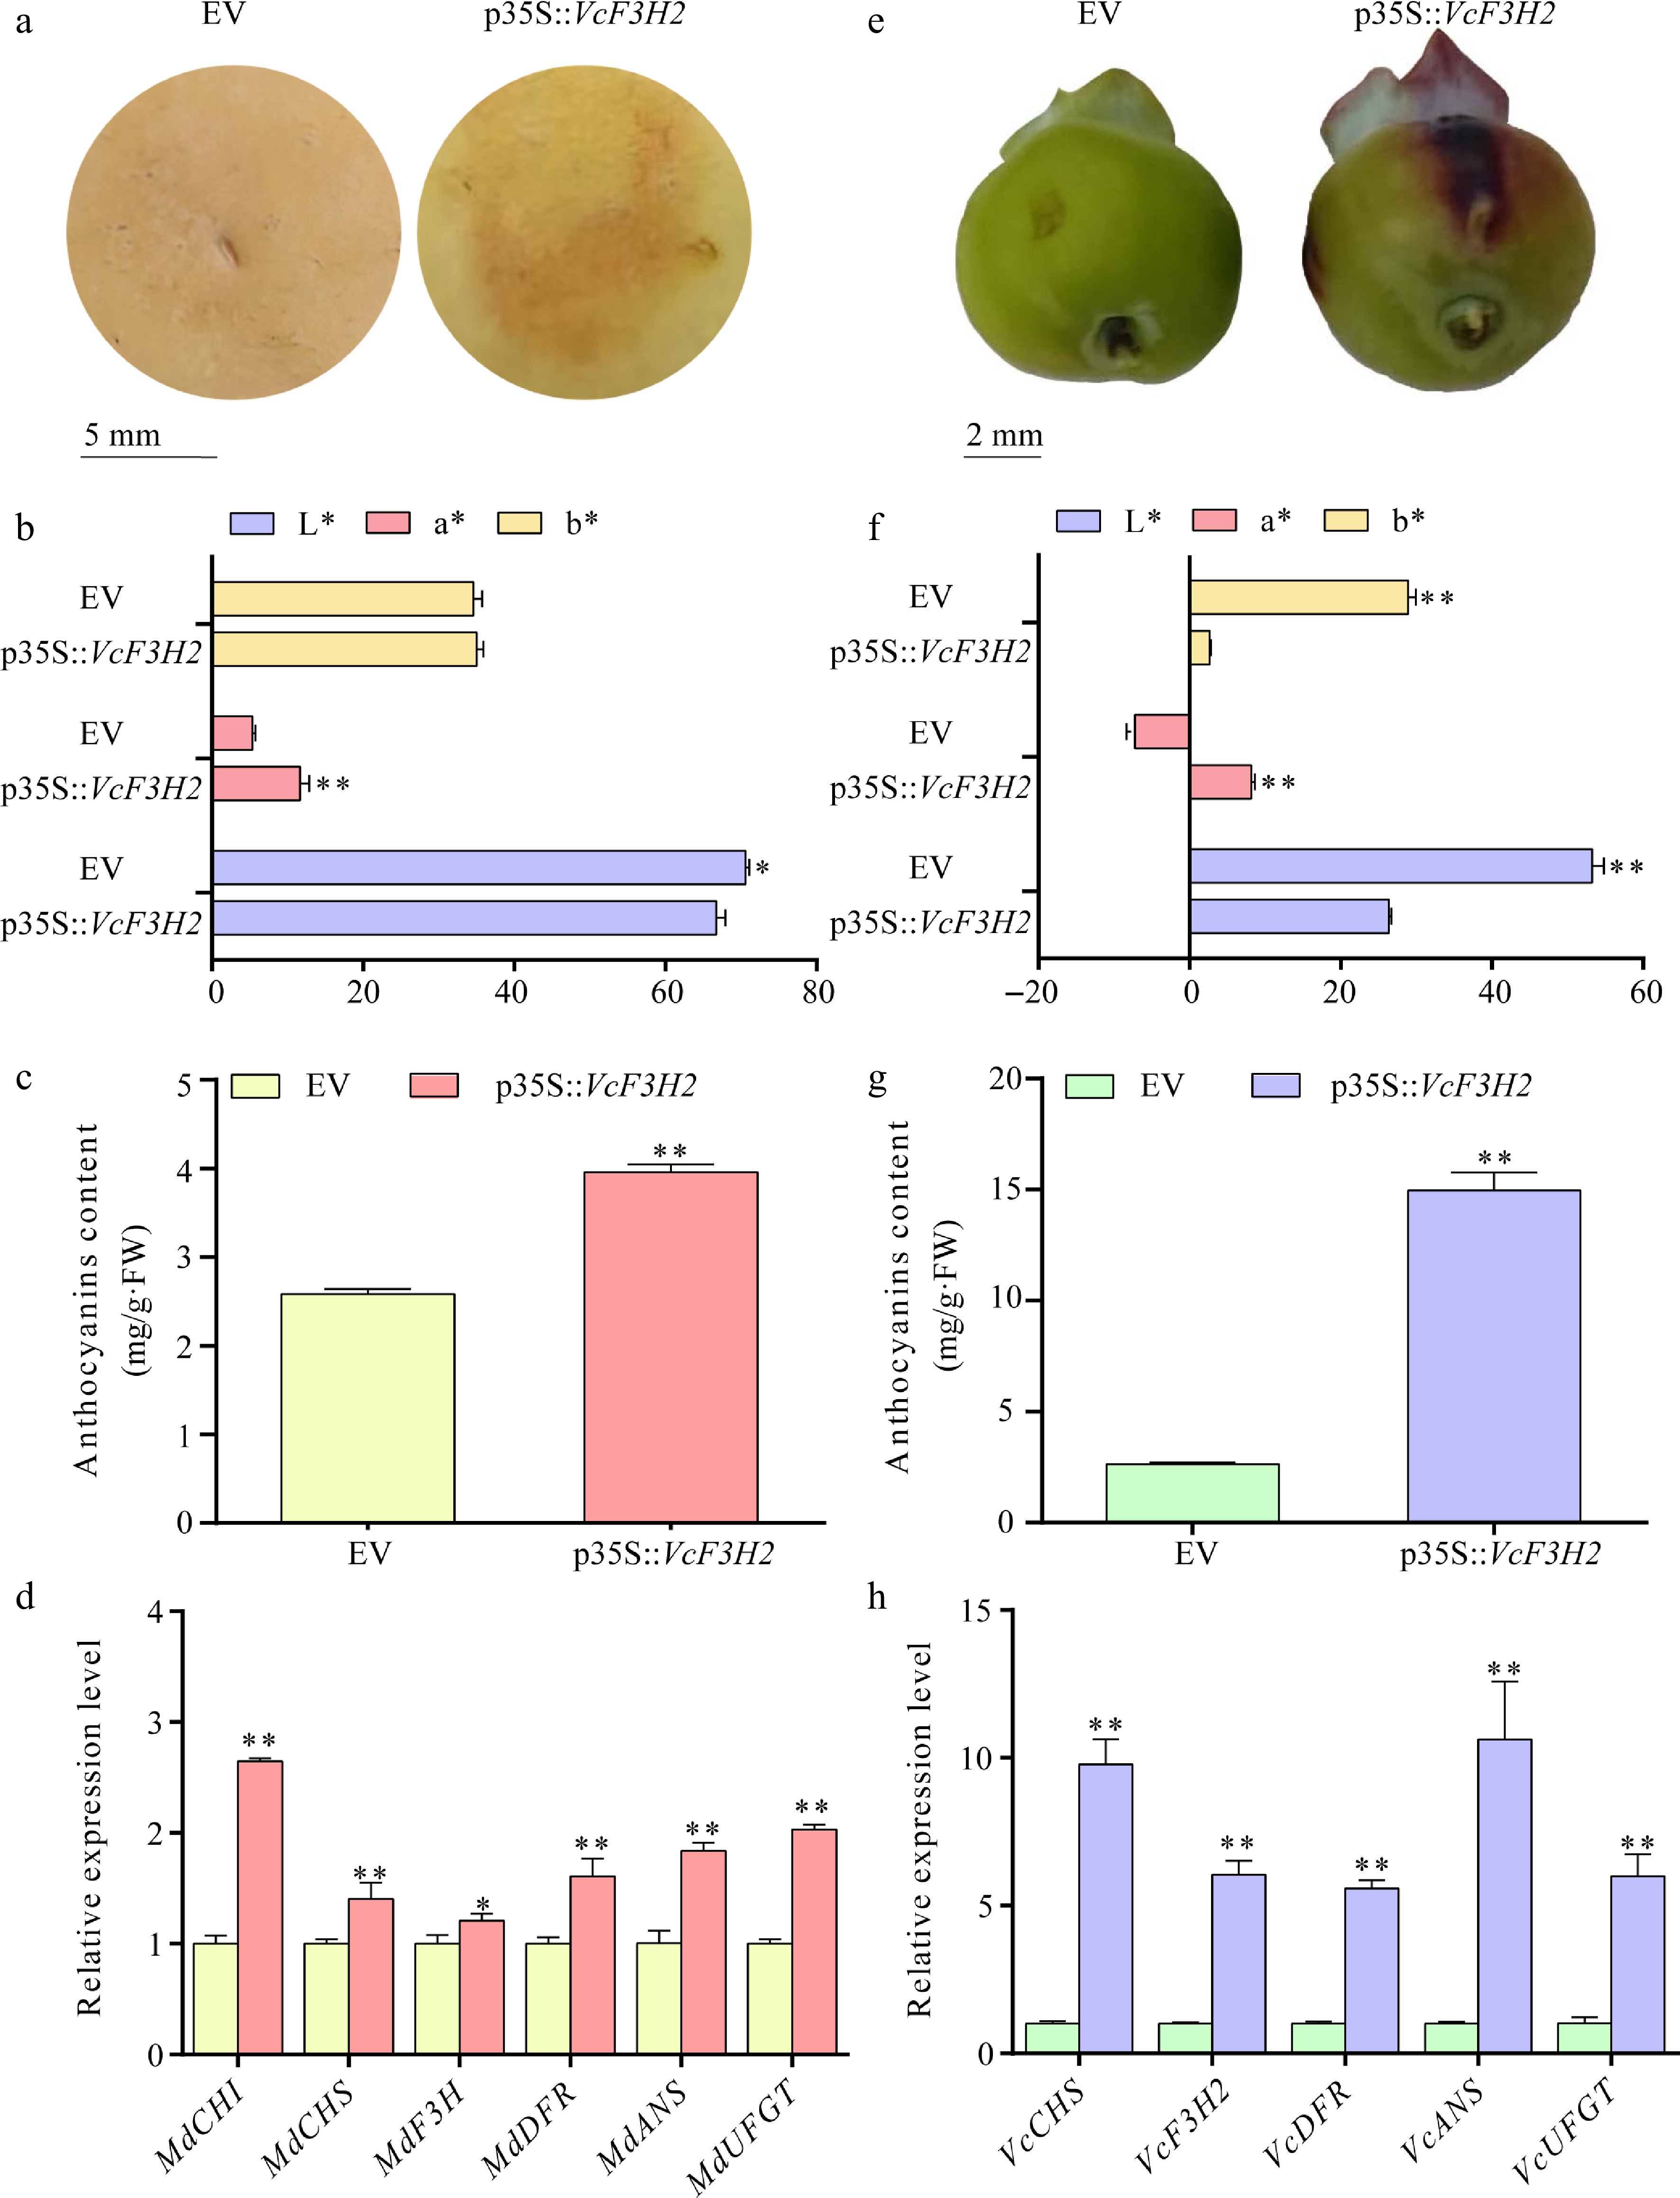
Figure 5.
The influences of VcF3H2 overexpression in anthocyanins biosynthesis and expression of corresponding structural genes in apple and blueberry fruits. (a) Transient overexpression of VcF3H2 promoted anthocyanins accumulation in apple peel; (b)−(d) Effects of overexpression of VcF3H2 on color parameters, anthocyanins content and expression of anthocyanins biosynthesis structural genes in apple peels. (e) Transient overexpression of VcF3H2 promoted anthocyanins accumulation in blueberry fruit peels; (f)−(h) Effects of overexpression of VcF3H2 on color parameters, anthocyanin content, and expression of anthocyanin biosynthesis structural genes in blueberry fruit peels. Data were presented as the means ± standard deviations of three biological replicates, with asterisks showing significant differences (*, p < 0.05; **, p < 0.01). In (b) and (f), L* indicates lightness from 0 (black) to 100 (white); a* indicates red/green (+a* = redder, −a = greener); b* indicates yellow/blue (+b* = yellower, −b* = bluer).
-
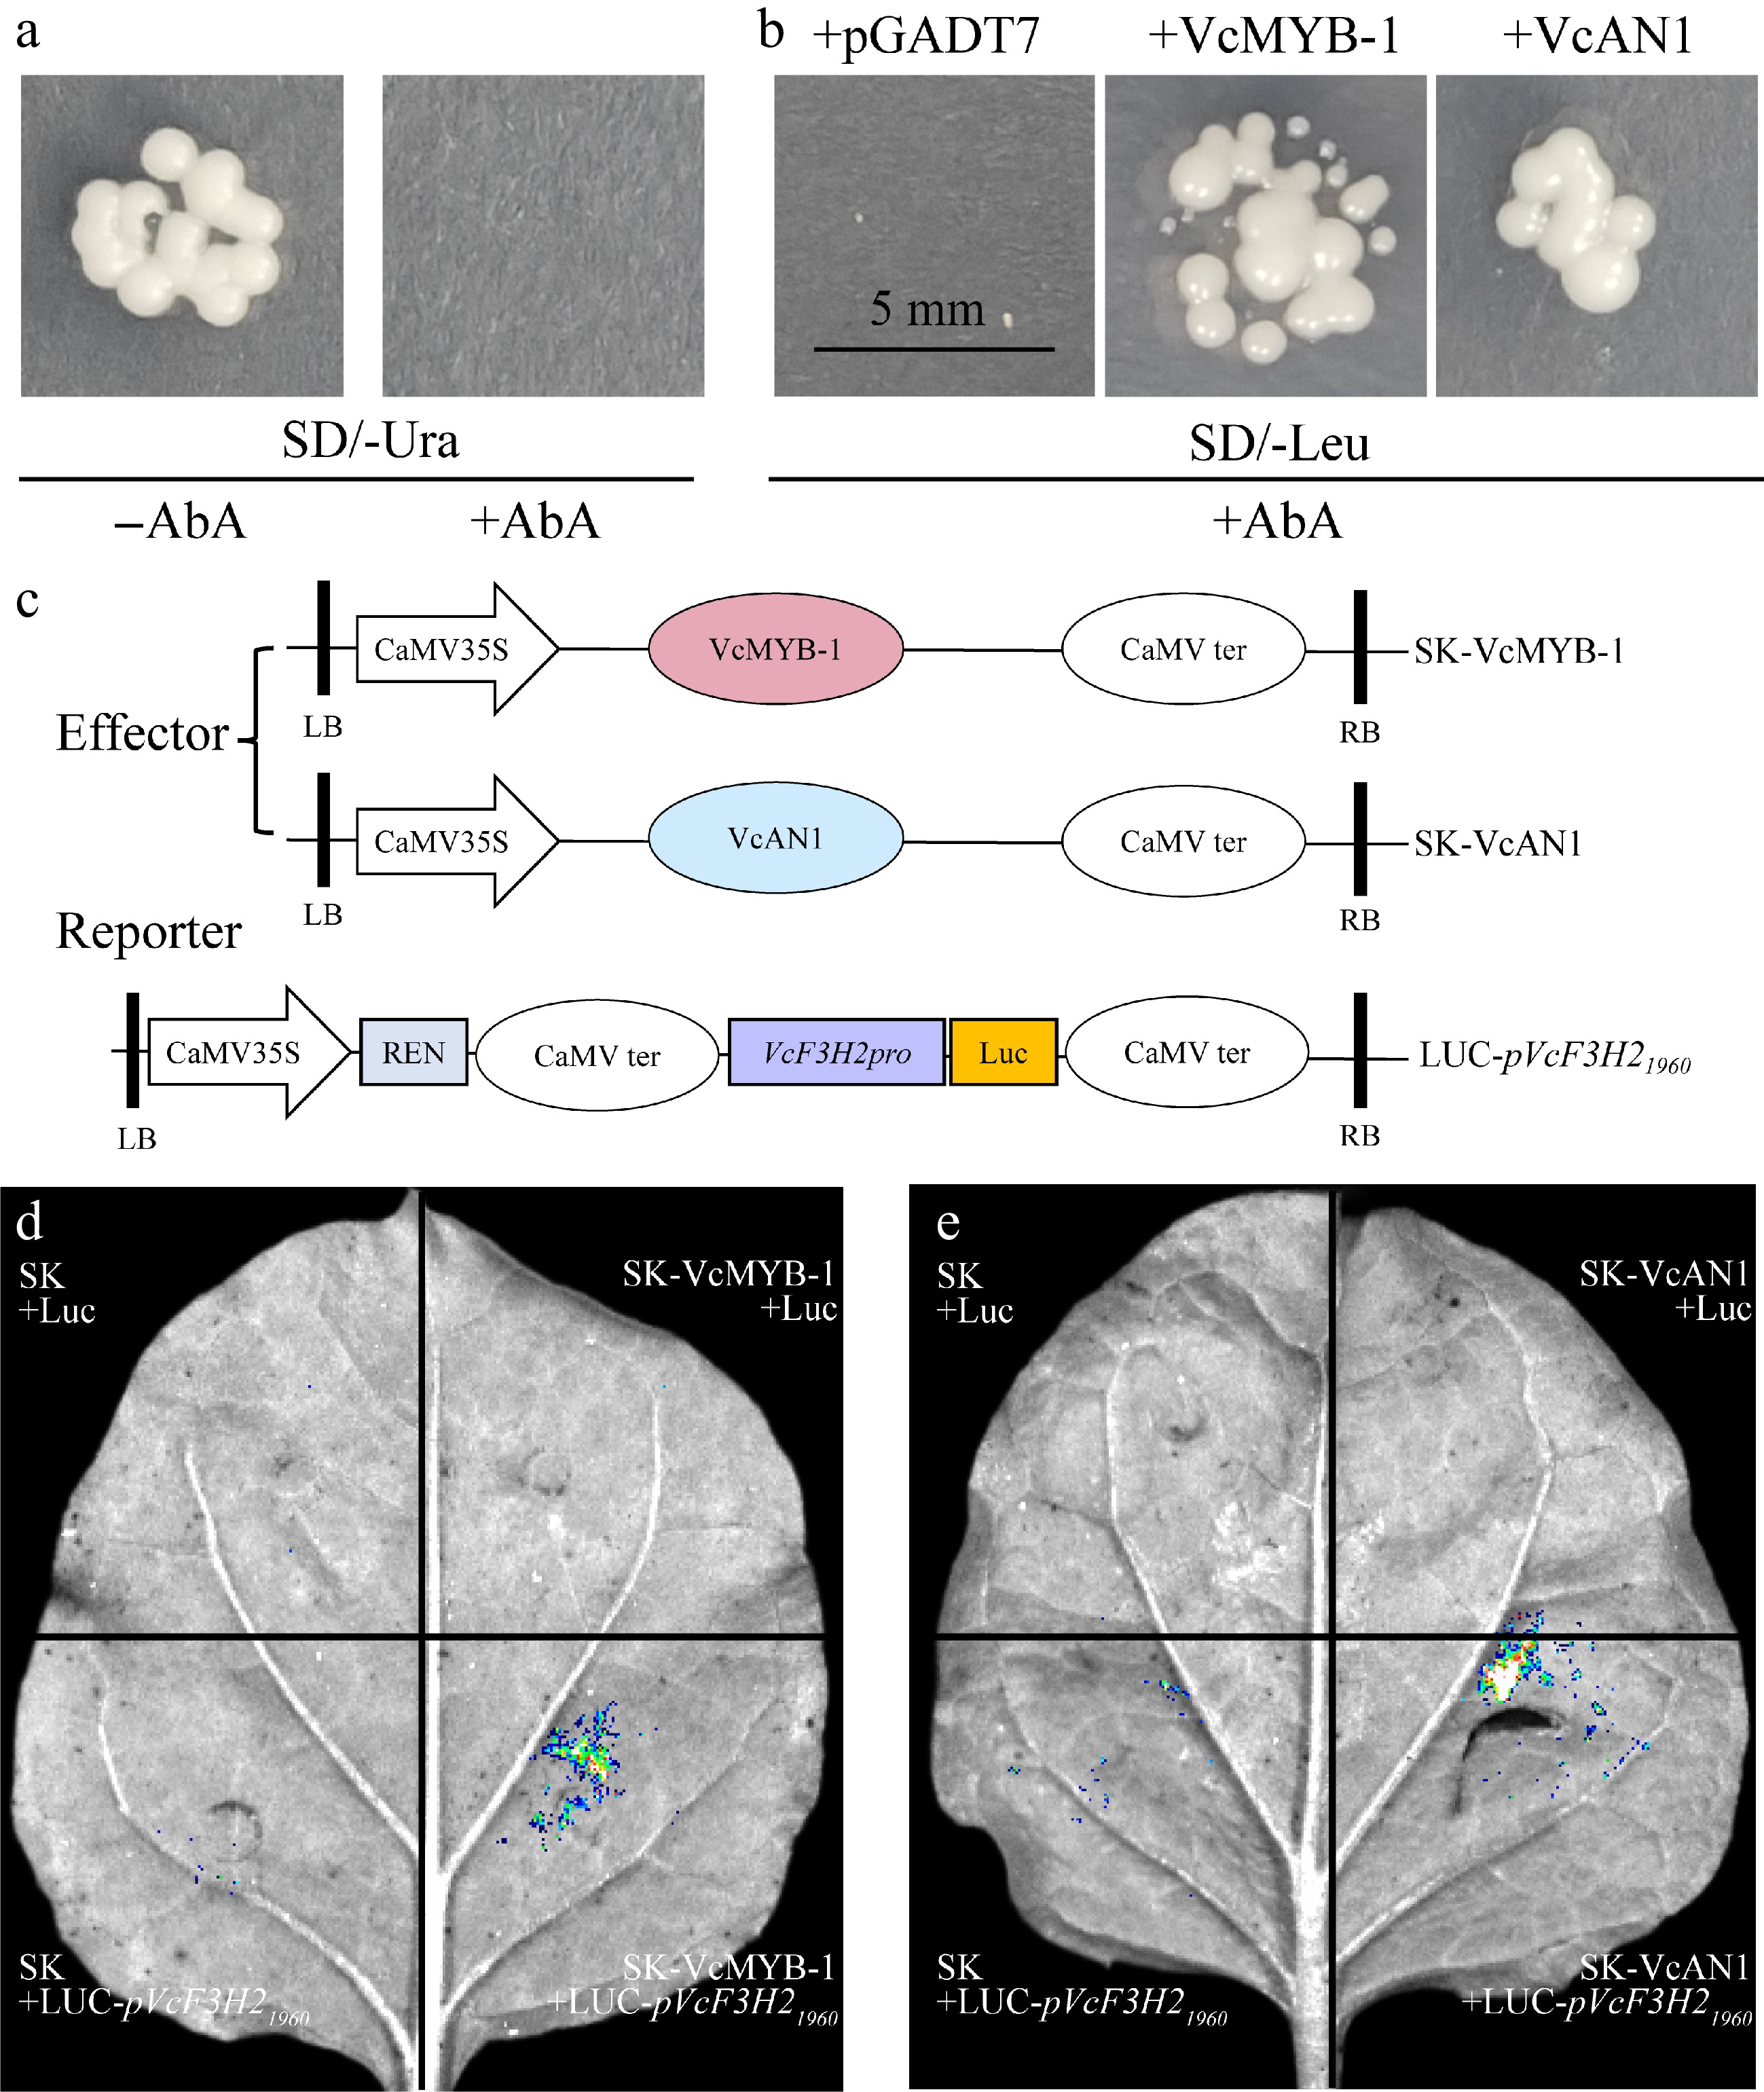
Figure 6.
Regulation of VcMYB-1 and VcAN1 on VcF3H2 promoter. (a) Self-activation verification of the VcF3H2 promoter. AbA: Aureobasidin A. (b) Y1H validation results. (c) Schematic diagrams for the effector and reporter constructs used for LUC; REN: Renilla luciferase. The stop codon removed CDS sequences of VcMYB-1 and VcAN1 were inserted into the pNC-Green-SK vector to generate effector constructs. The 1960 bp VcF3H2 promoter sequence was cloned into pNC-Green-Luc vector to generate the reporter construct (LUC-pVcF3H21960). LB: left border; RB: right border. (d) and (e) LUC imaging results for the binding and activation abilities of VcMYB-1 and VcAN1 on the VcF3H2 promoter, respectively.
-
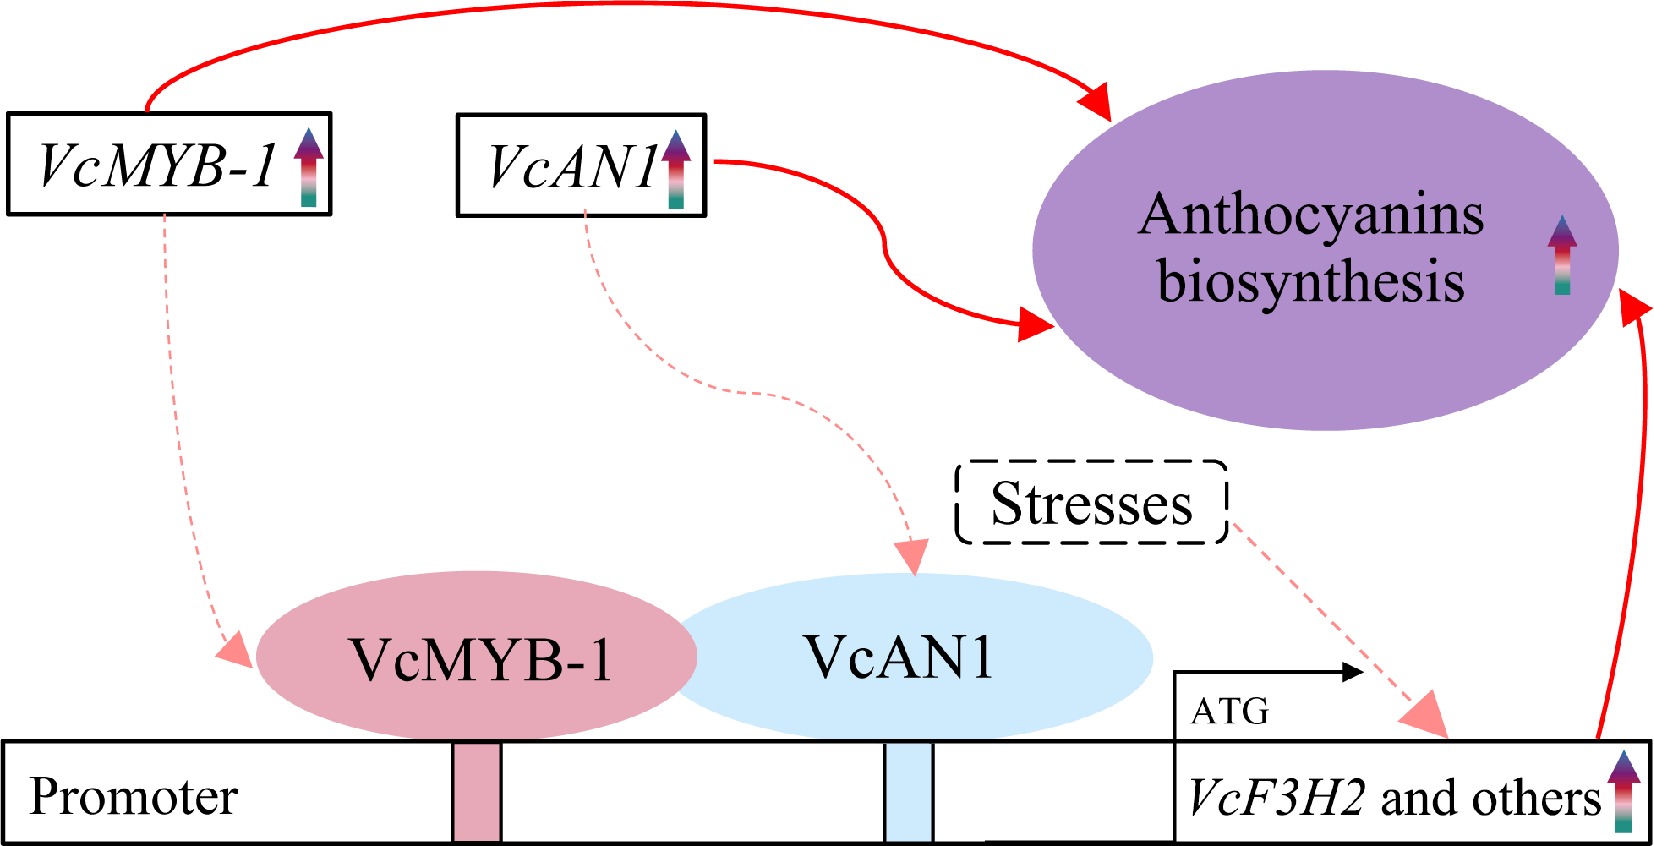
Figure 7.
The 'VcMYB/VcAN1-VcF3H2' module in regulating anthocyanin biosynthesis in blueberry. Rainbow arrows represent upregulation or increase during fruit ripening. Red arrows represent promoting effects. Solid arrows represent results have been validated in this study or previous studies, and dotted arrows represent results that need to be further confirmed.
Figures
(7)
Tables
(0)