-
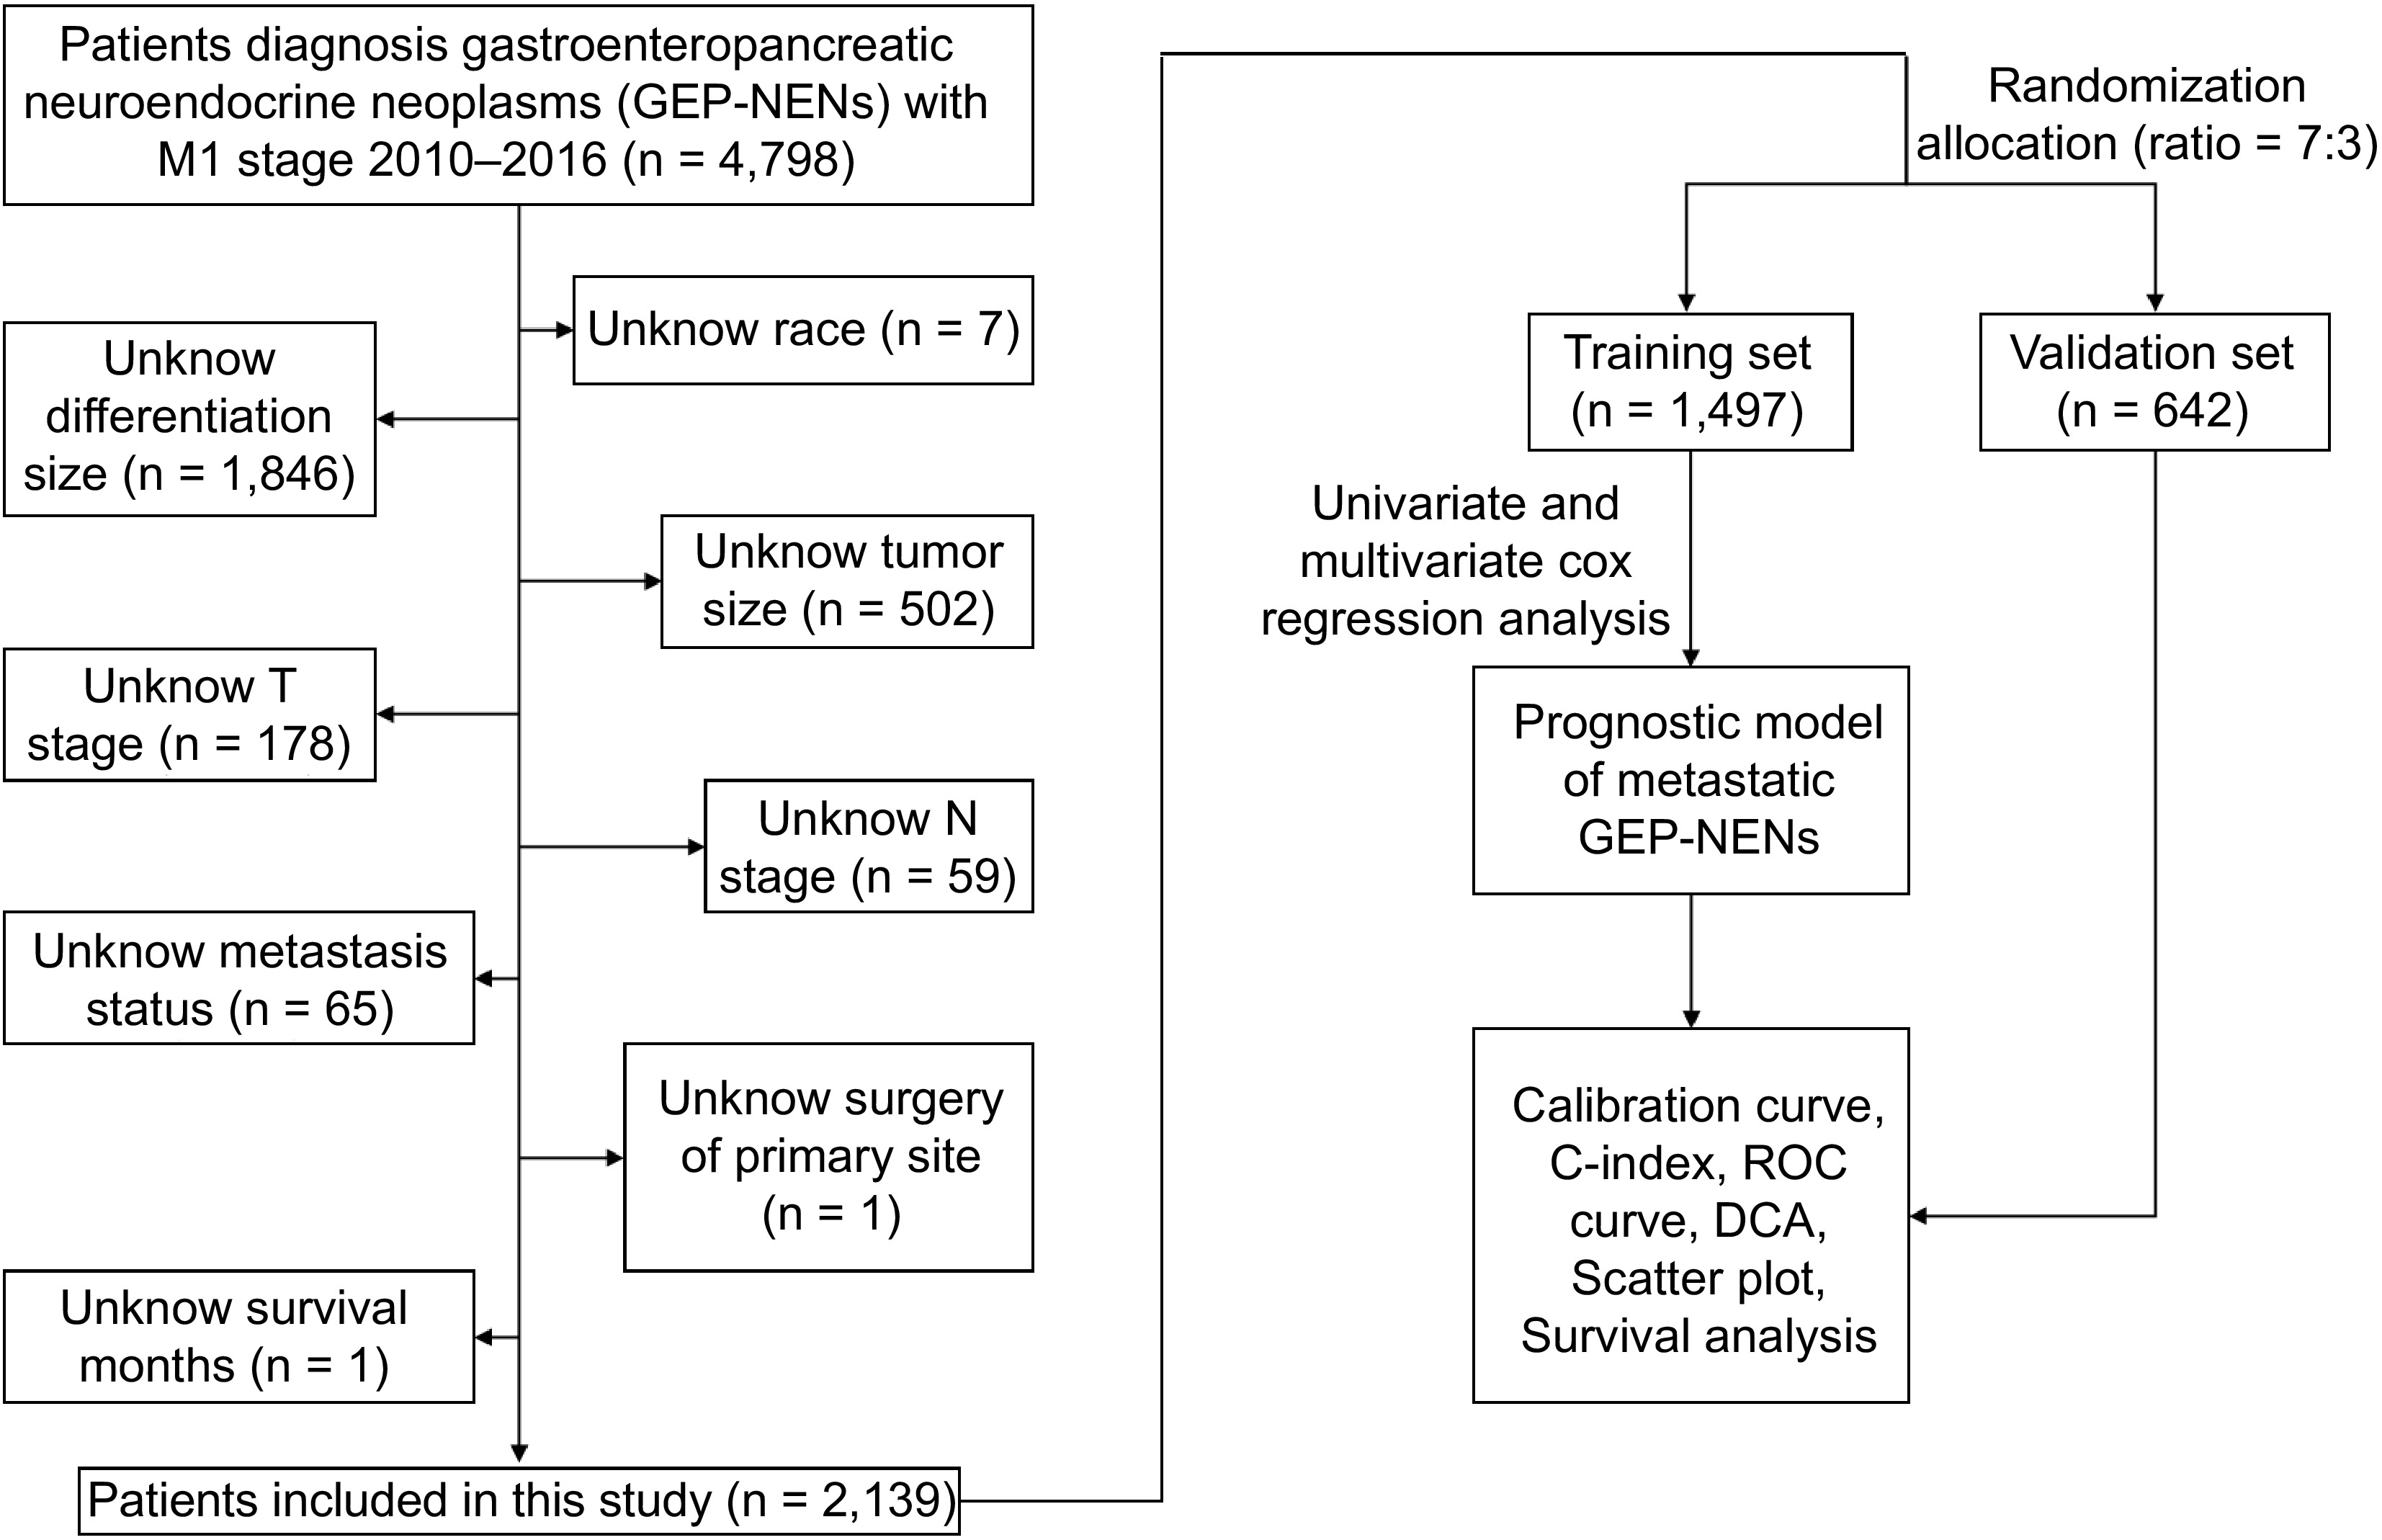
Figure 1.
Flow chart of patient selection and research routine of this study.
-
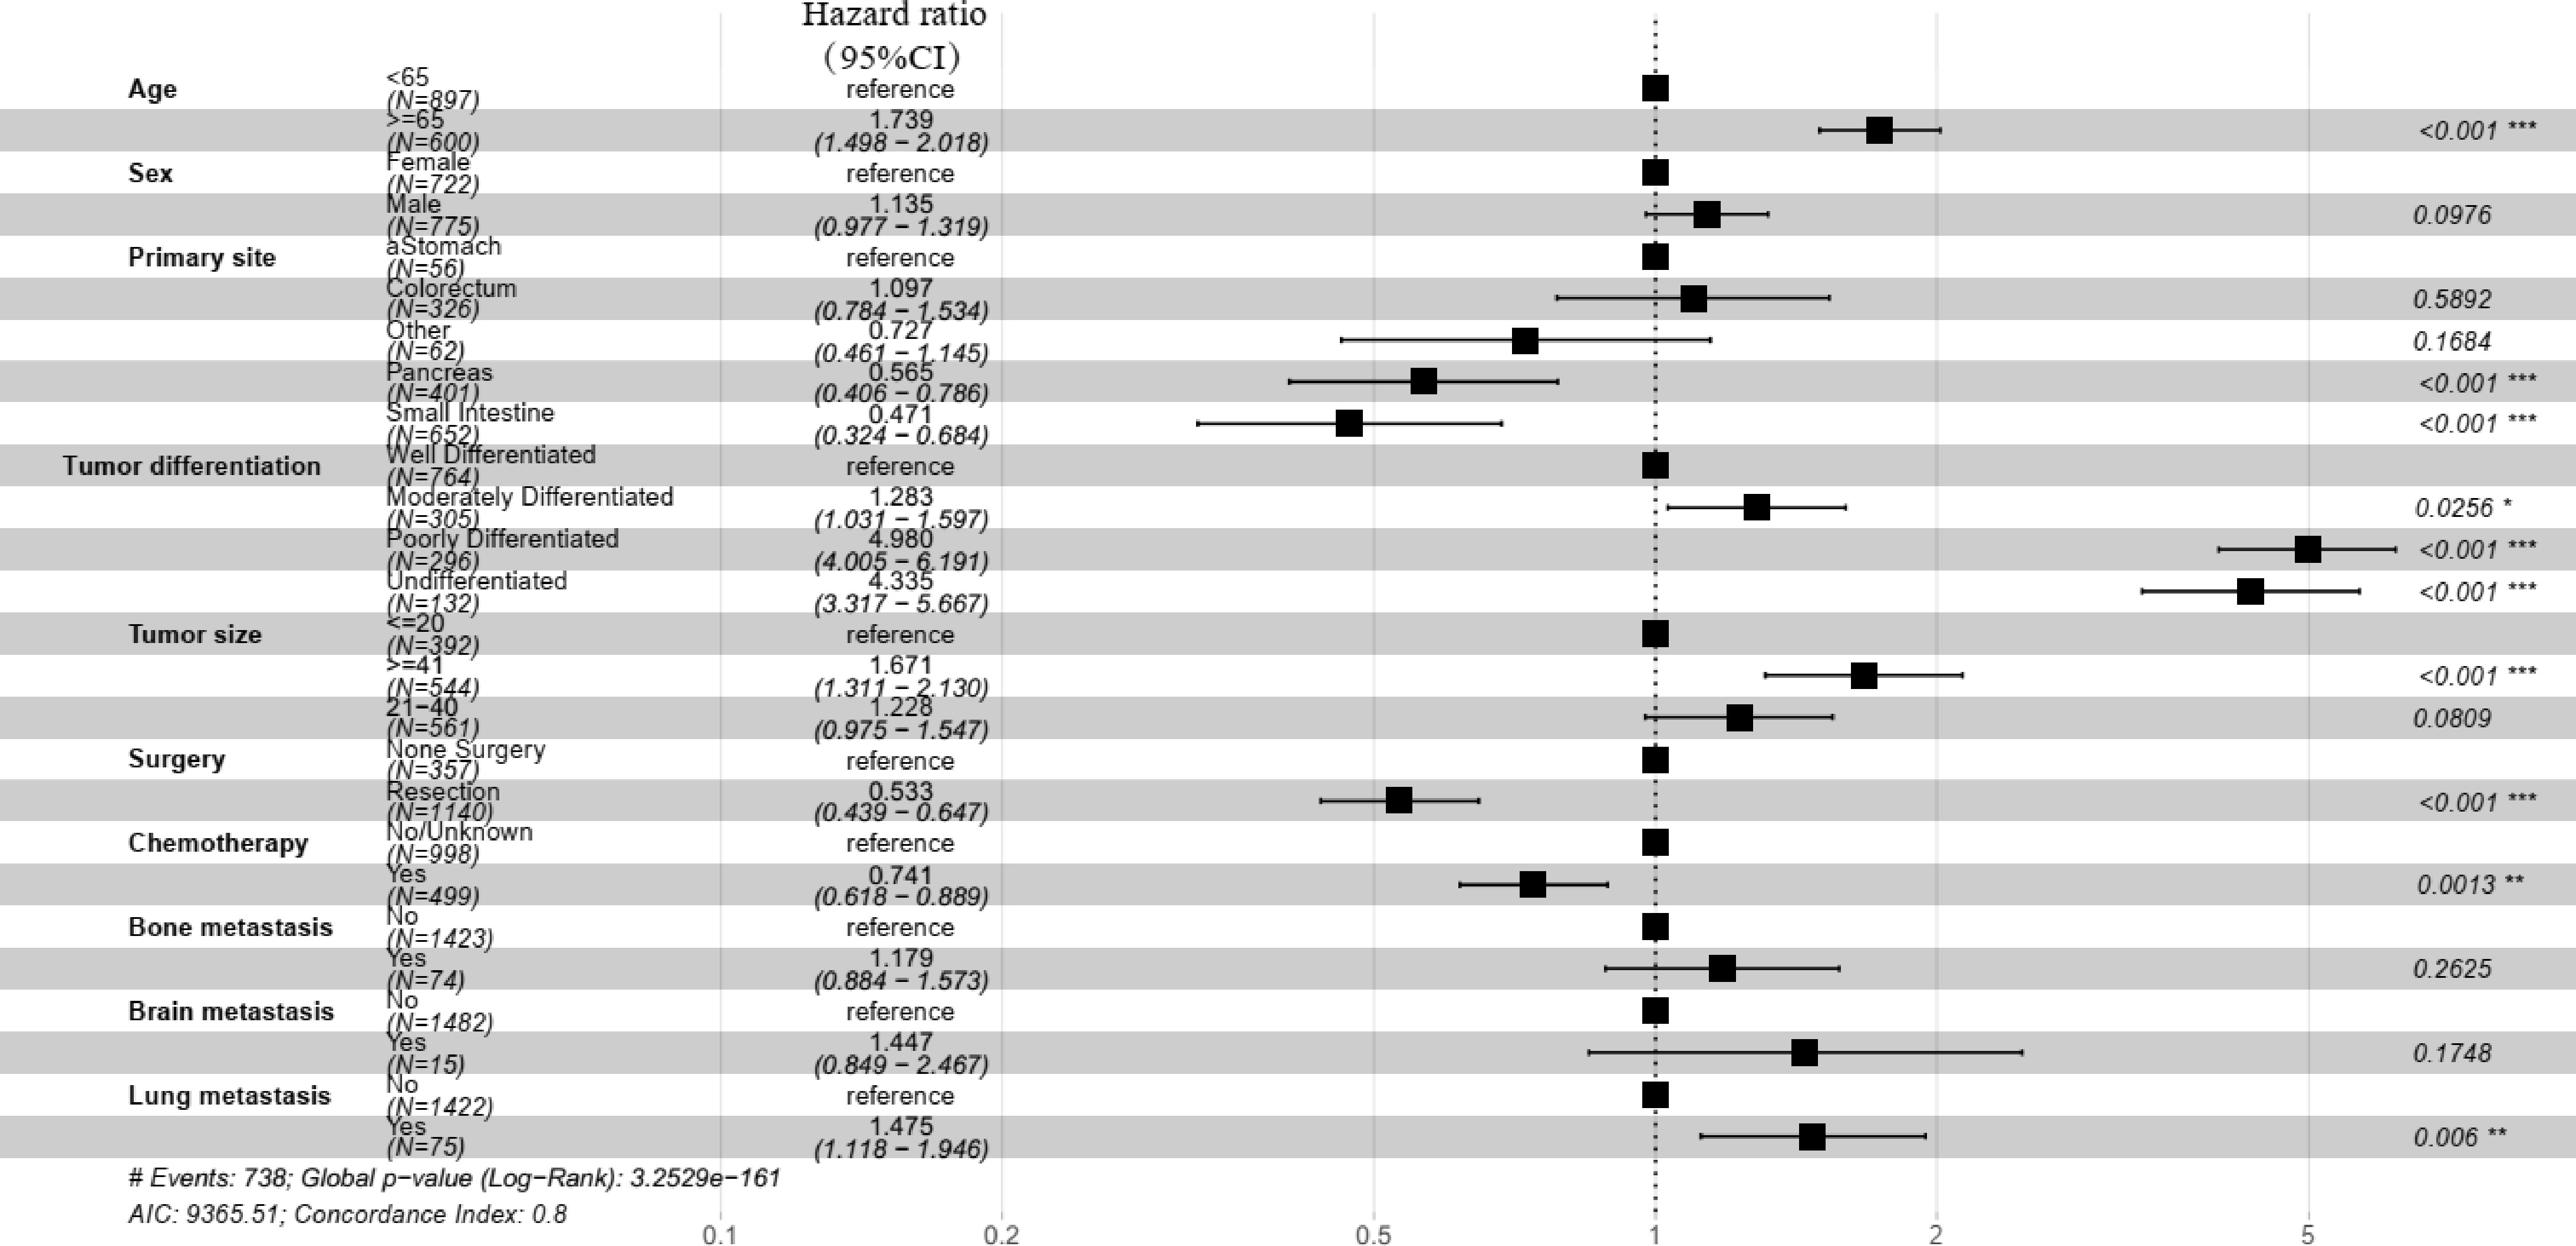
Figure 2.
Forest plot of the multivariate Cox regression analysis of the training group.
-
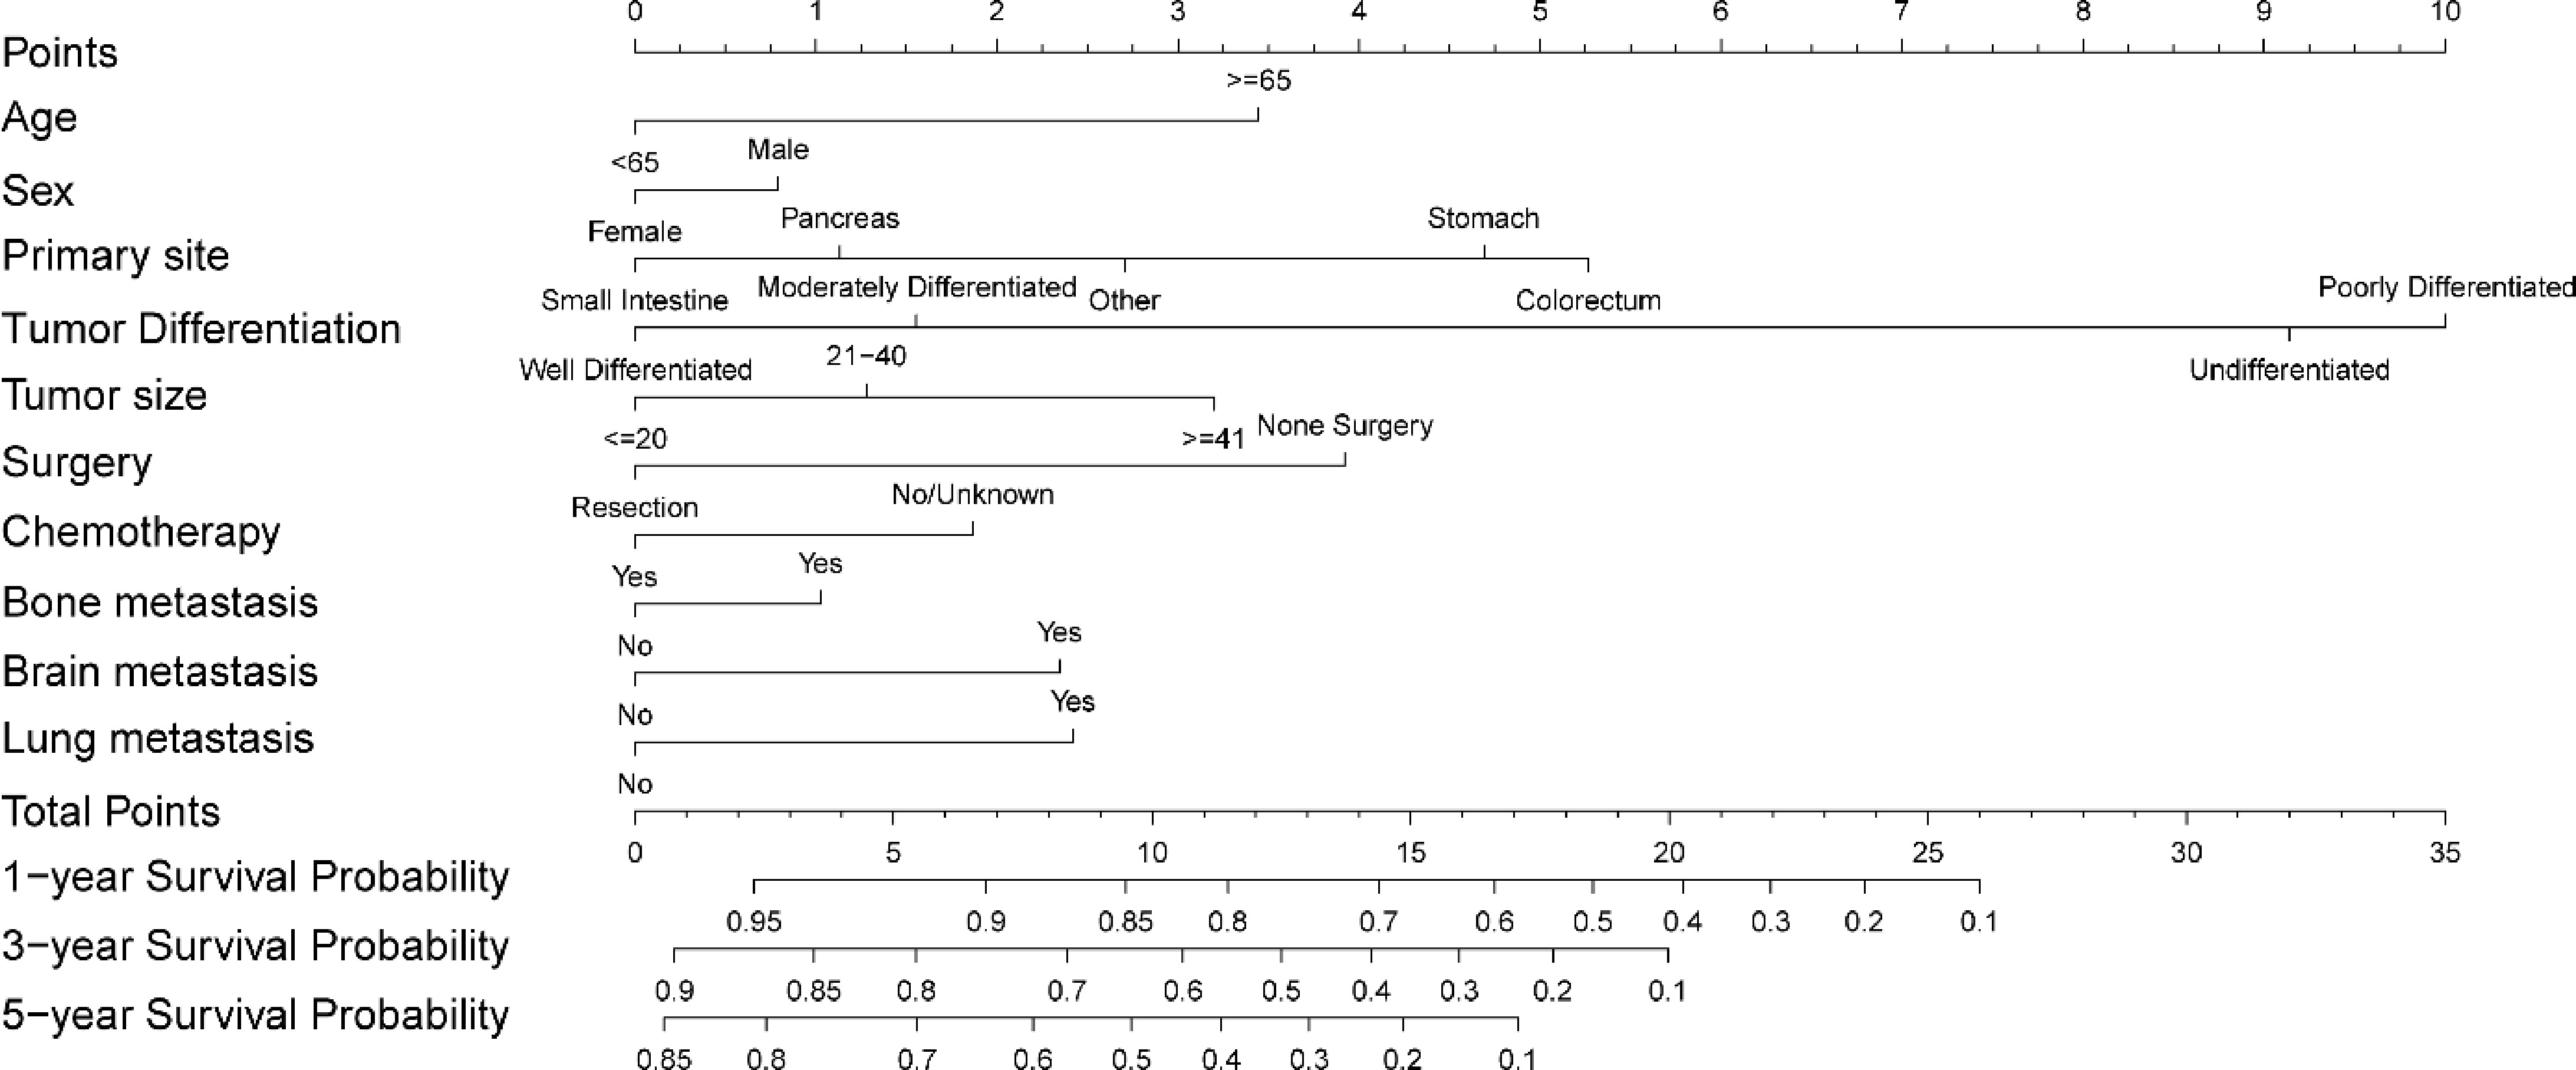
Figure 3.
The prognostic nomogram for predicting overall survival of stage IV GEP-NENs in the training group.
-
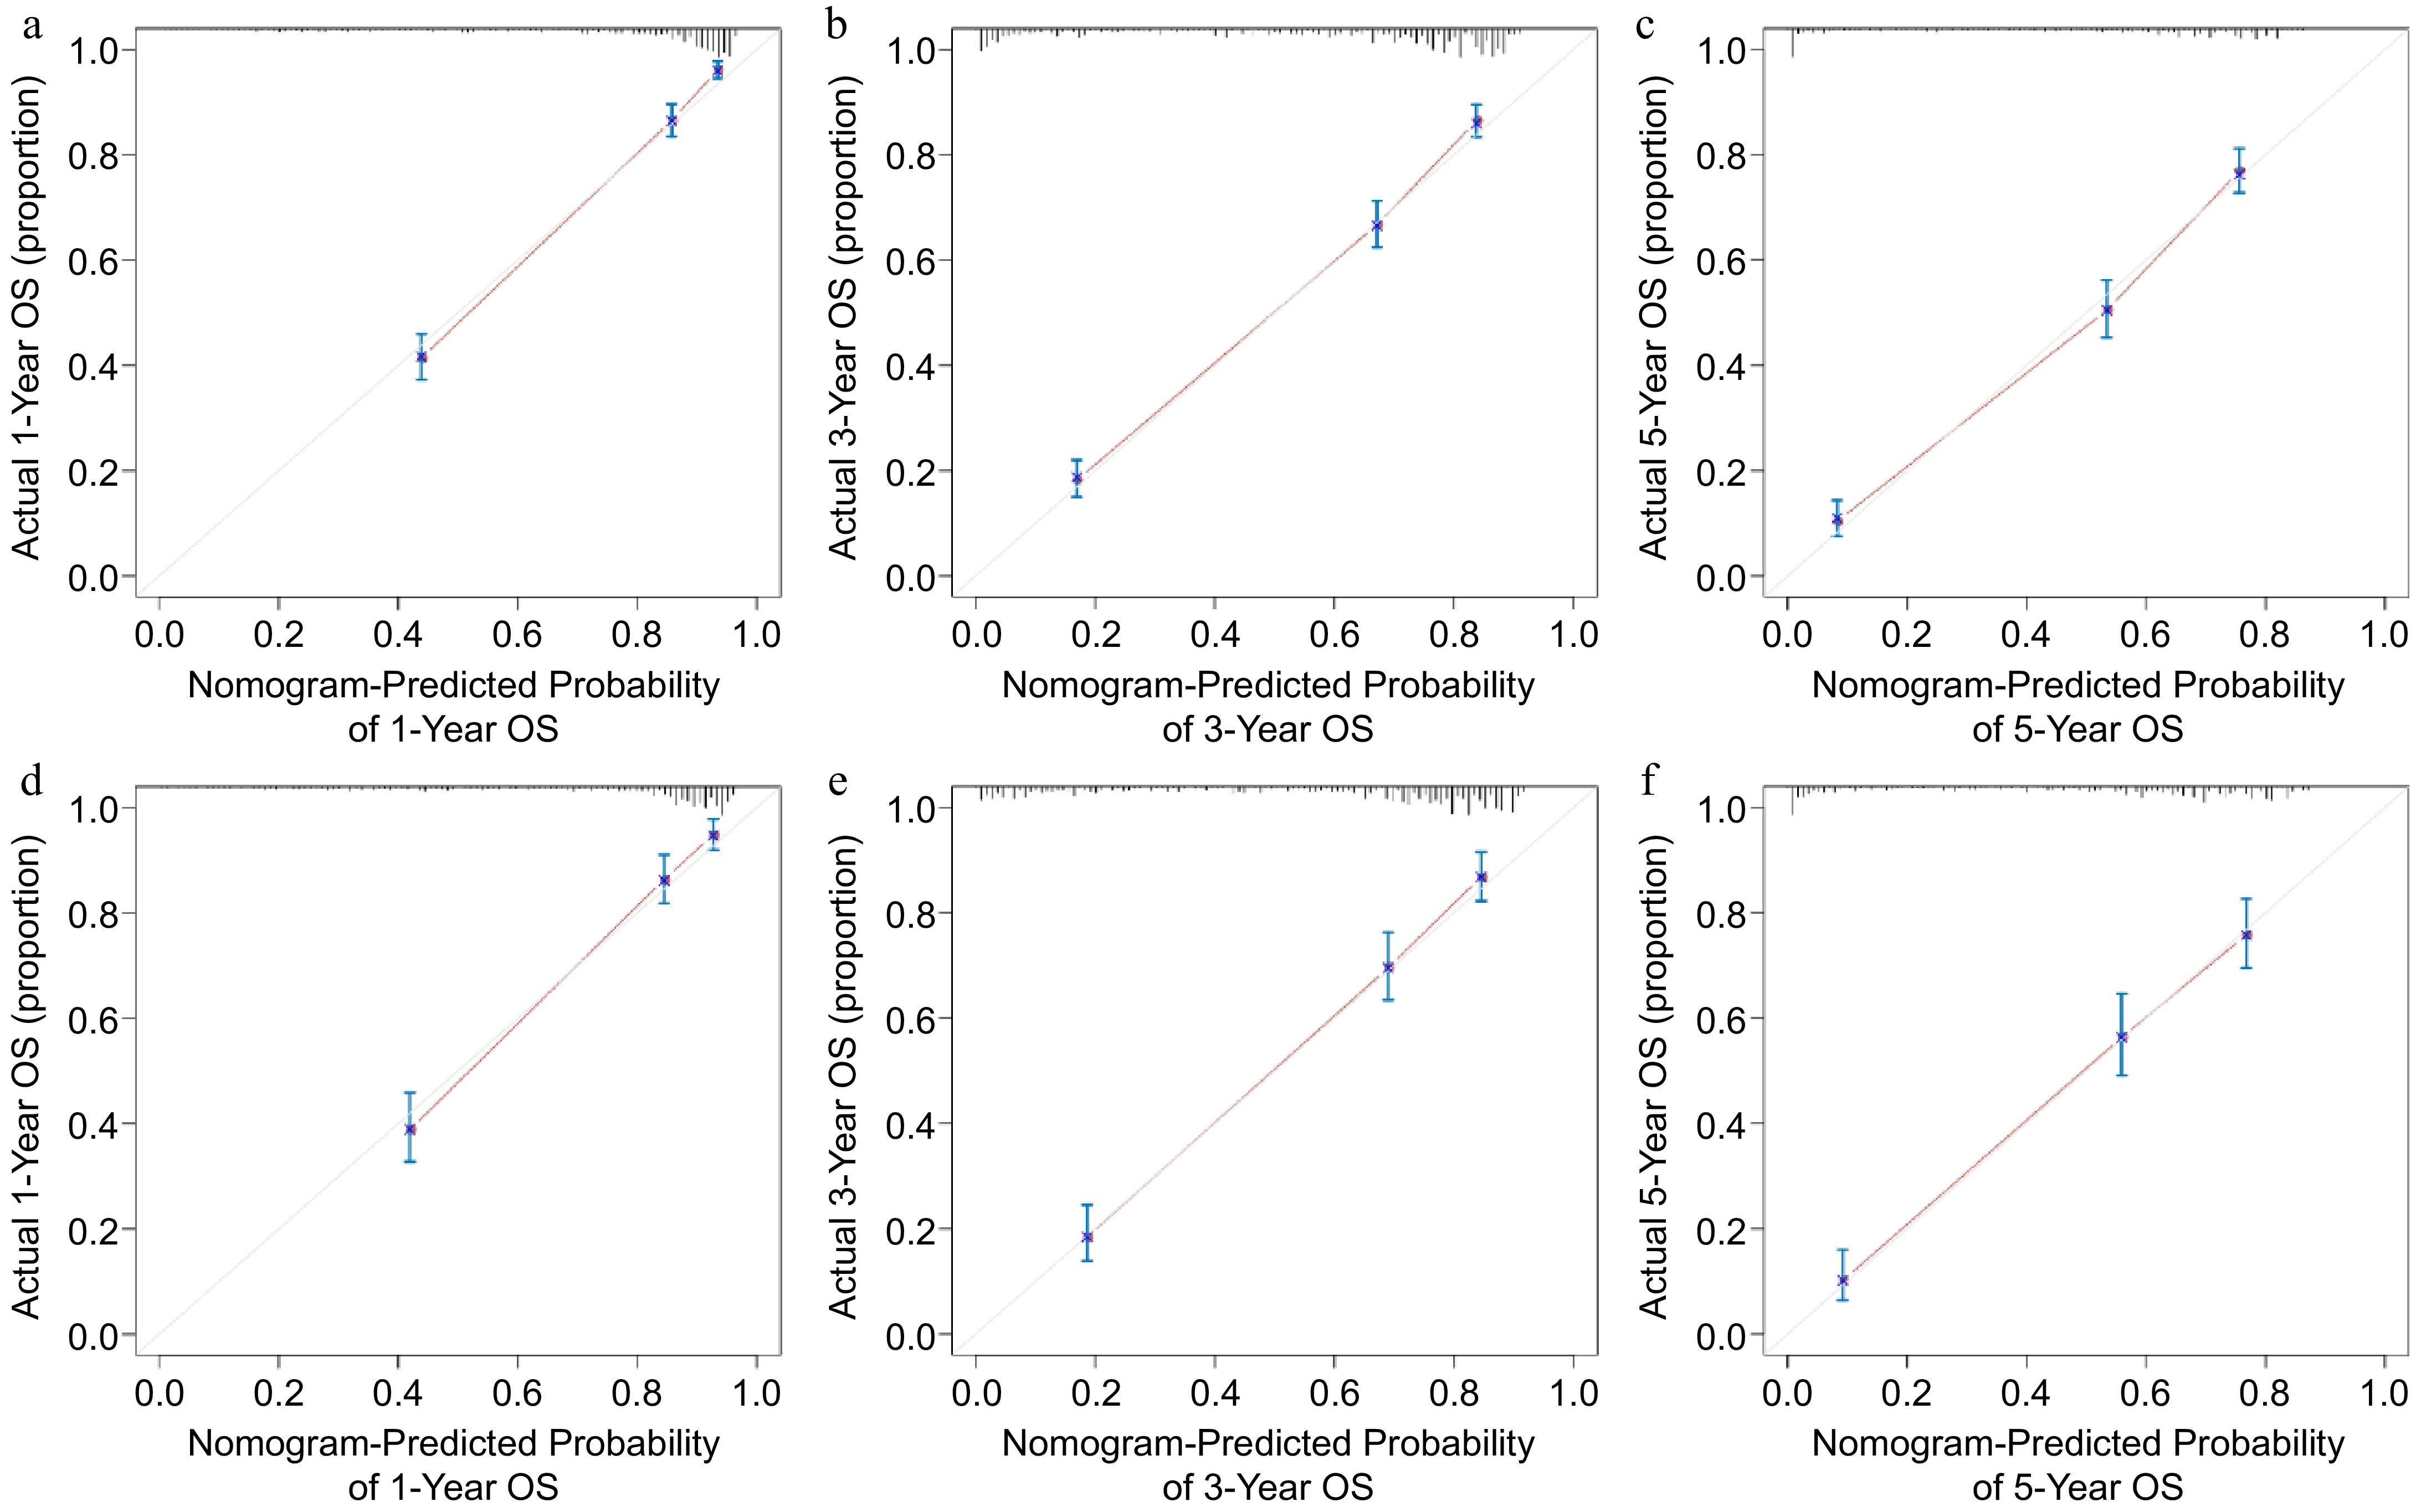
Figure 4.
Calibration curve analysis of the nomogram predicting survival probabilities. Nomogram-predicting (a) 1-year, (b) 3-year, and (c) 5-year survival probabilities in the training group. Nomogram-predicting (d) 1-year, (e) 3-year, and (f) 5-year survival probabilities in the validation group.
-
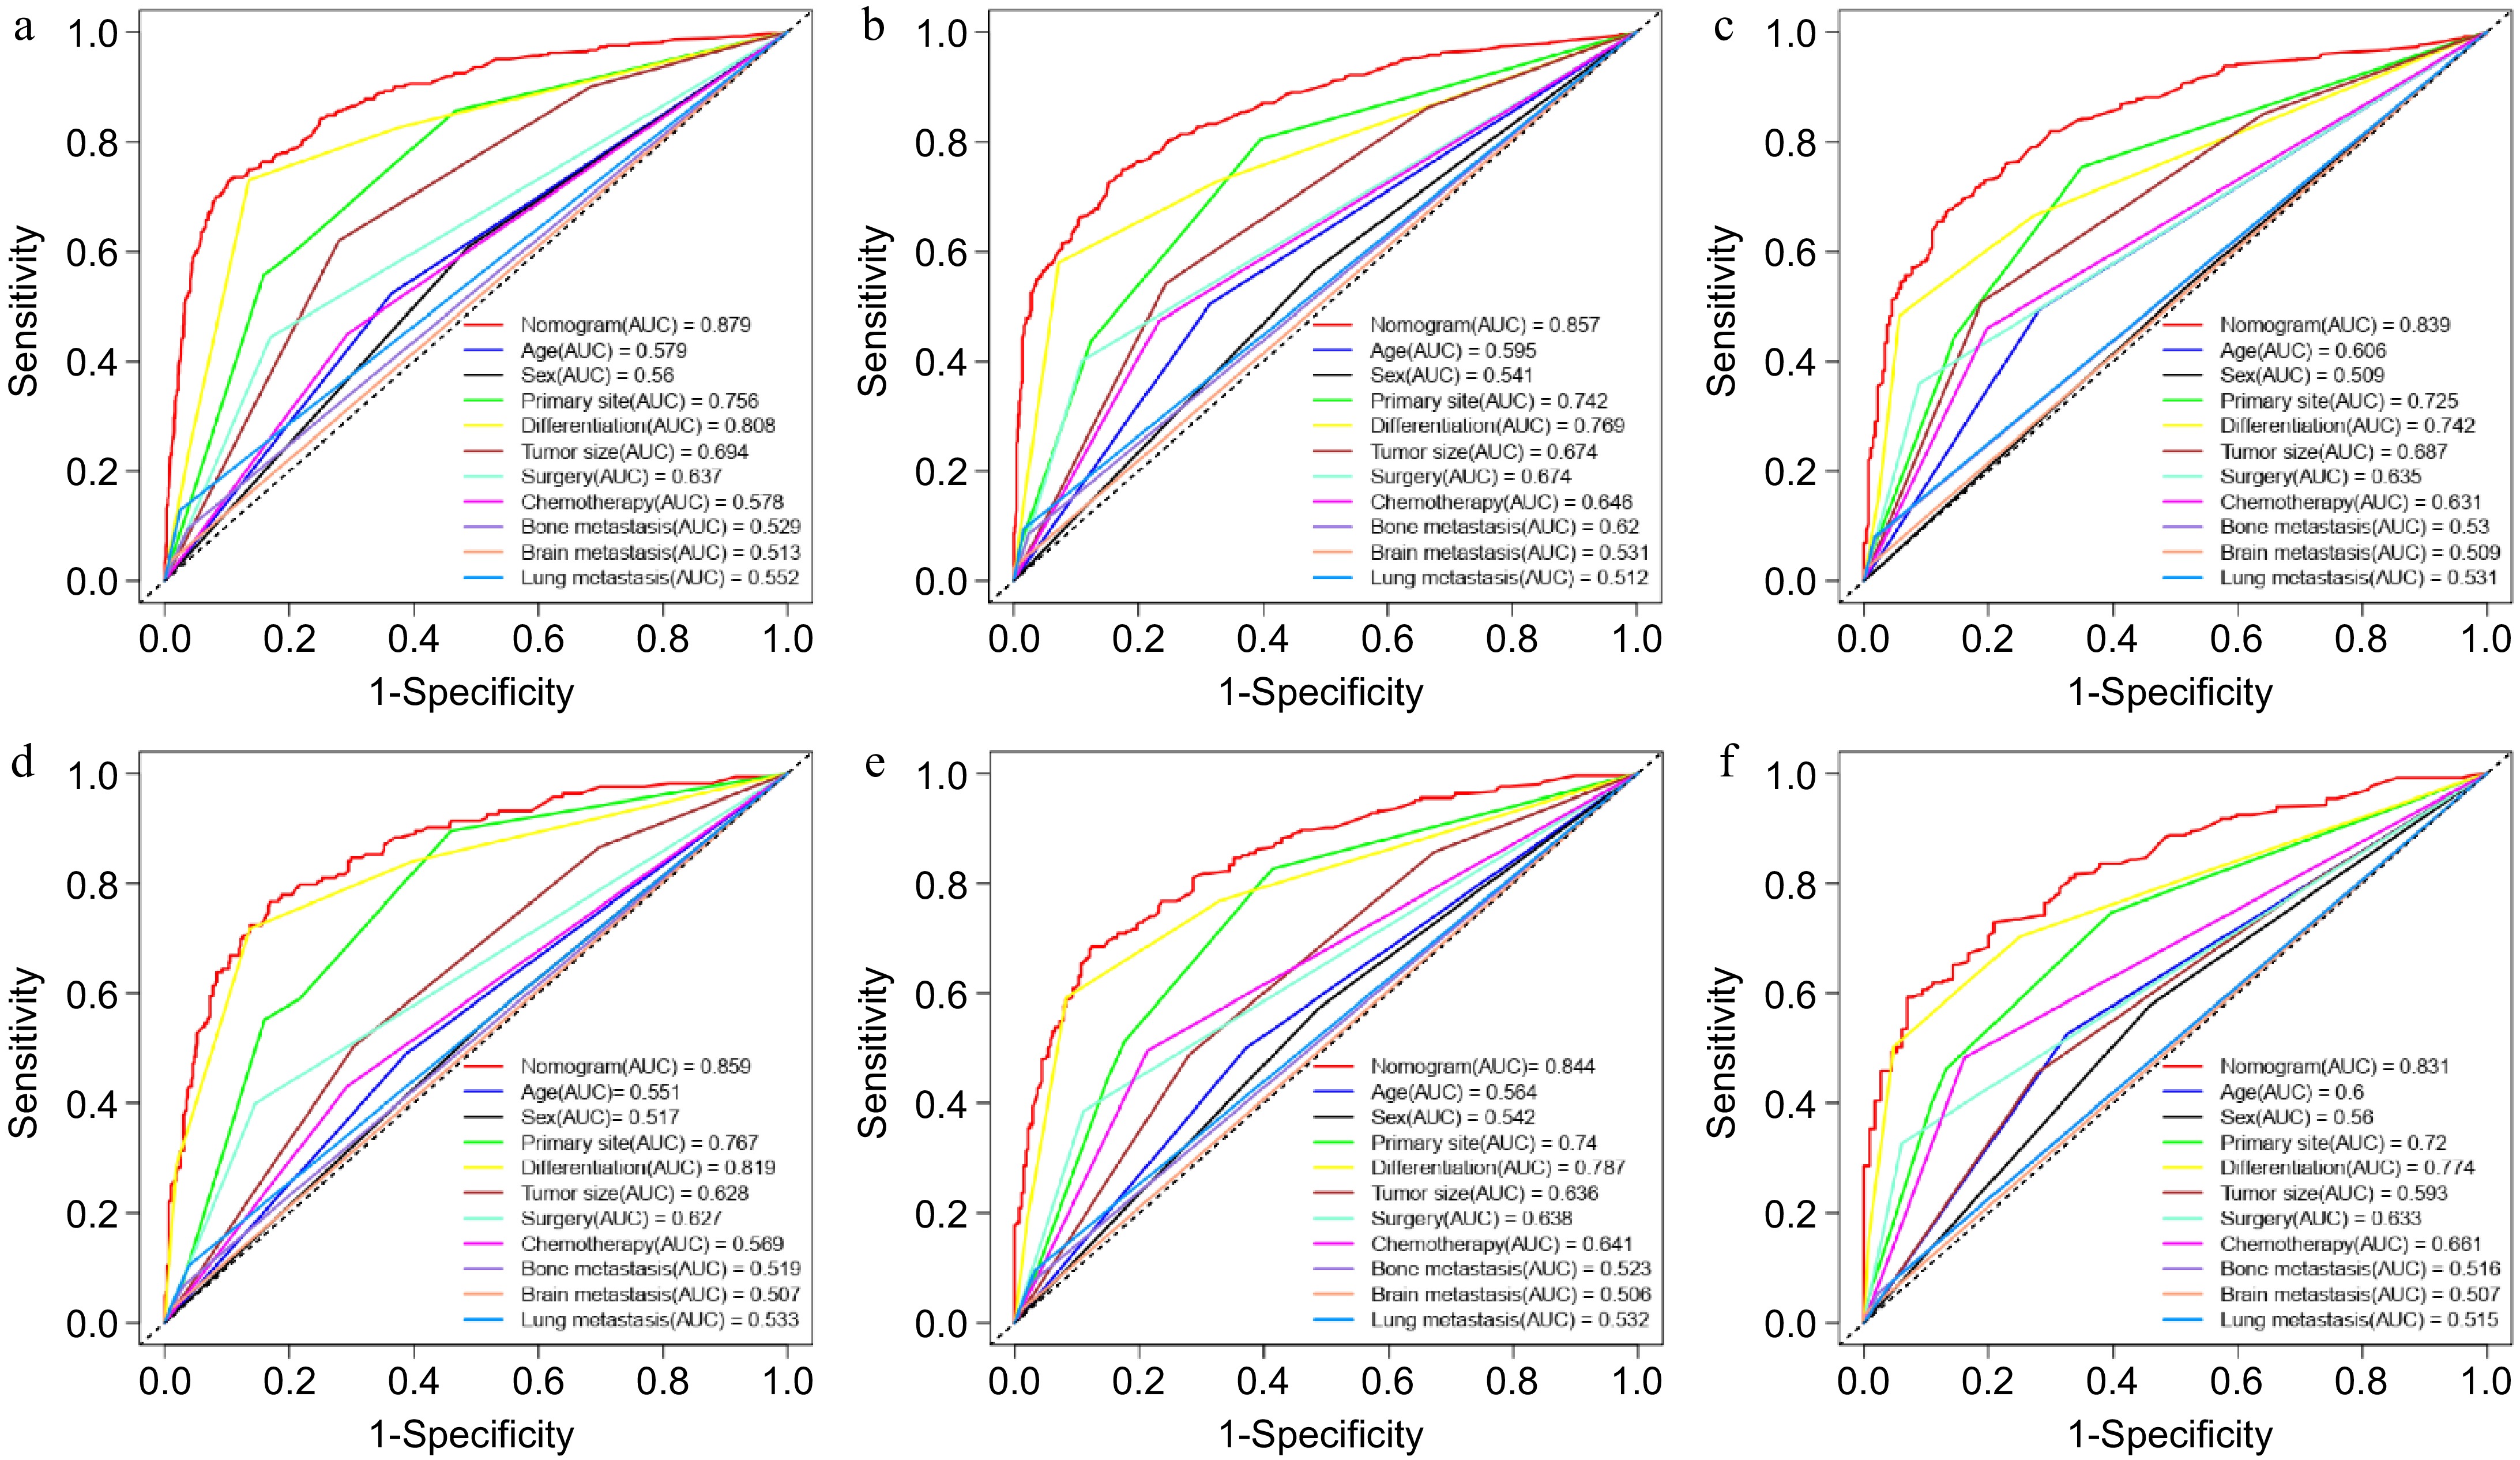
Figure 5.
ROC analysis and AUC evaluating the accuracy of nomogram- and risk factor-predicting overall survival. (a) 1-year, (b) 3-year, and (c) 5-year OS in the training group. (d) 1-year, (e) 3-year, and (f) 5-year OS in the validation group.
-
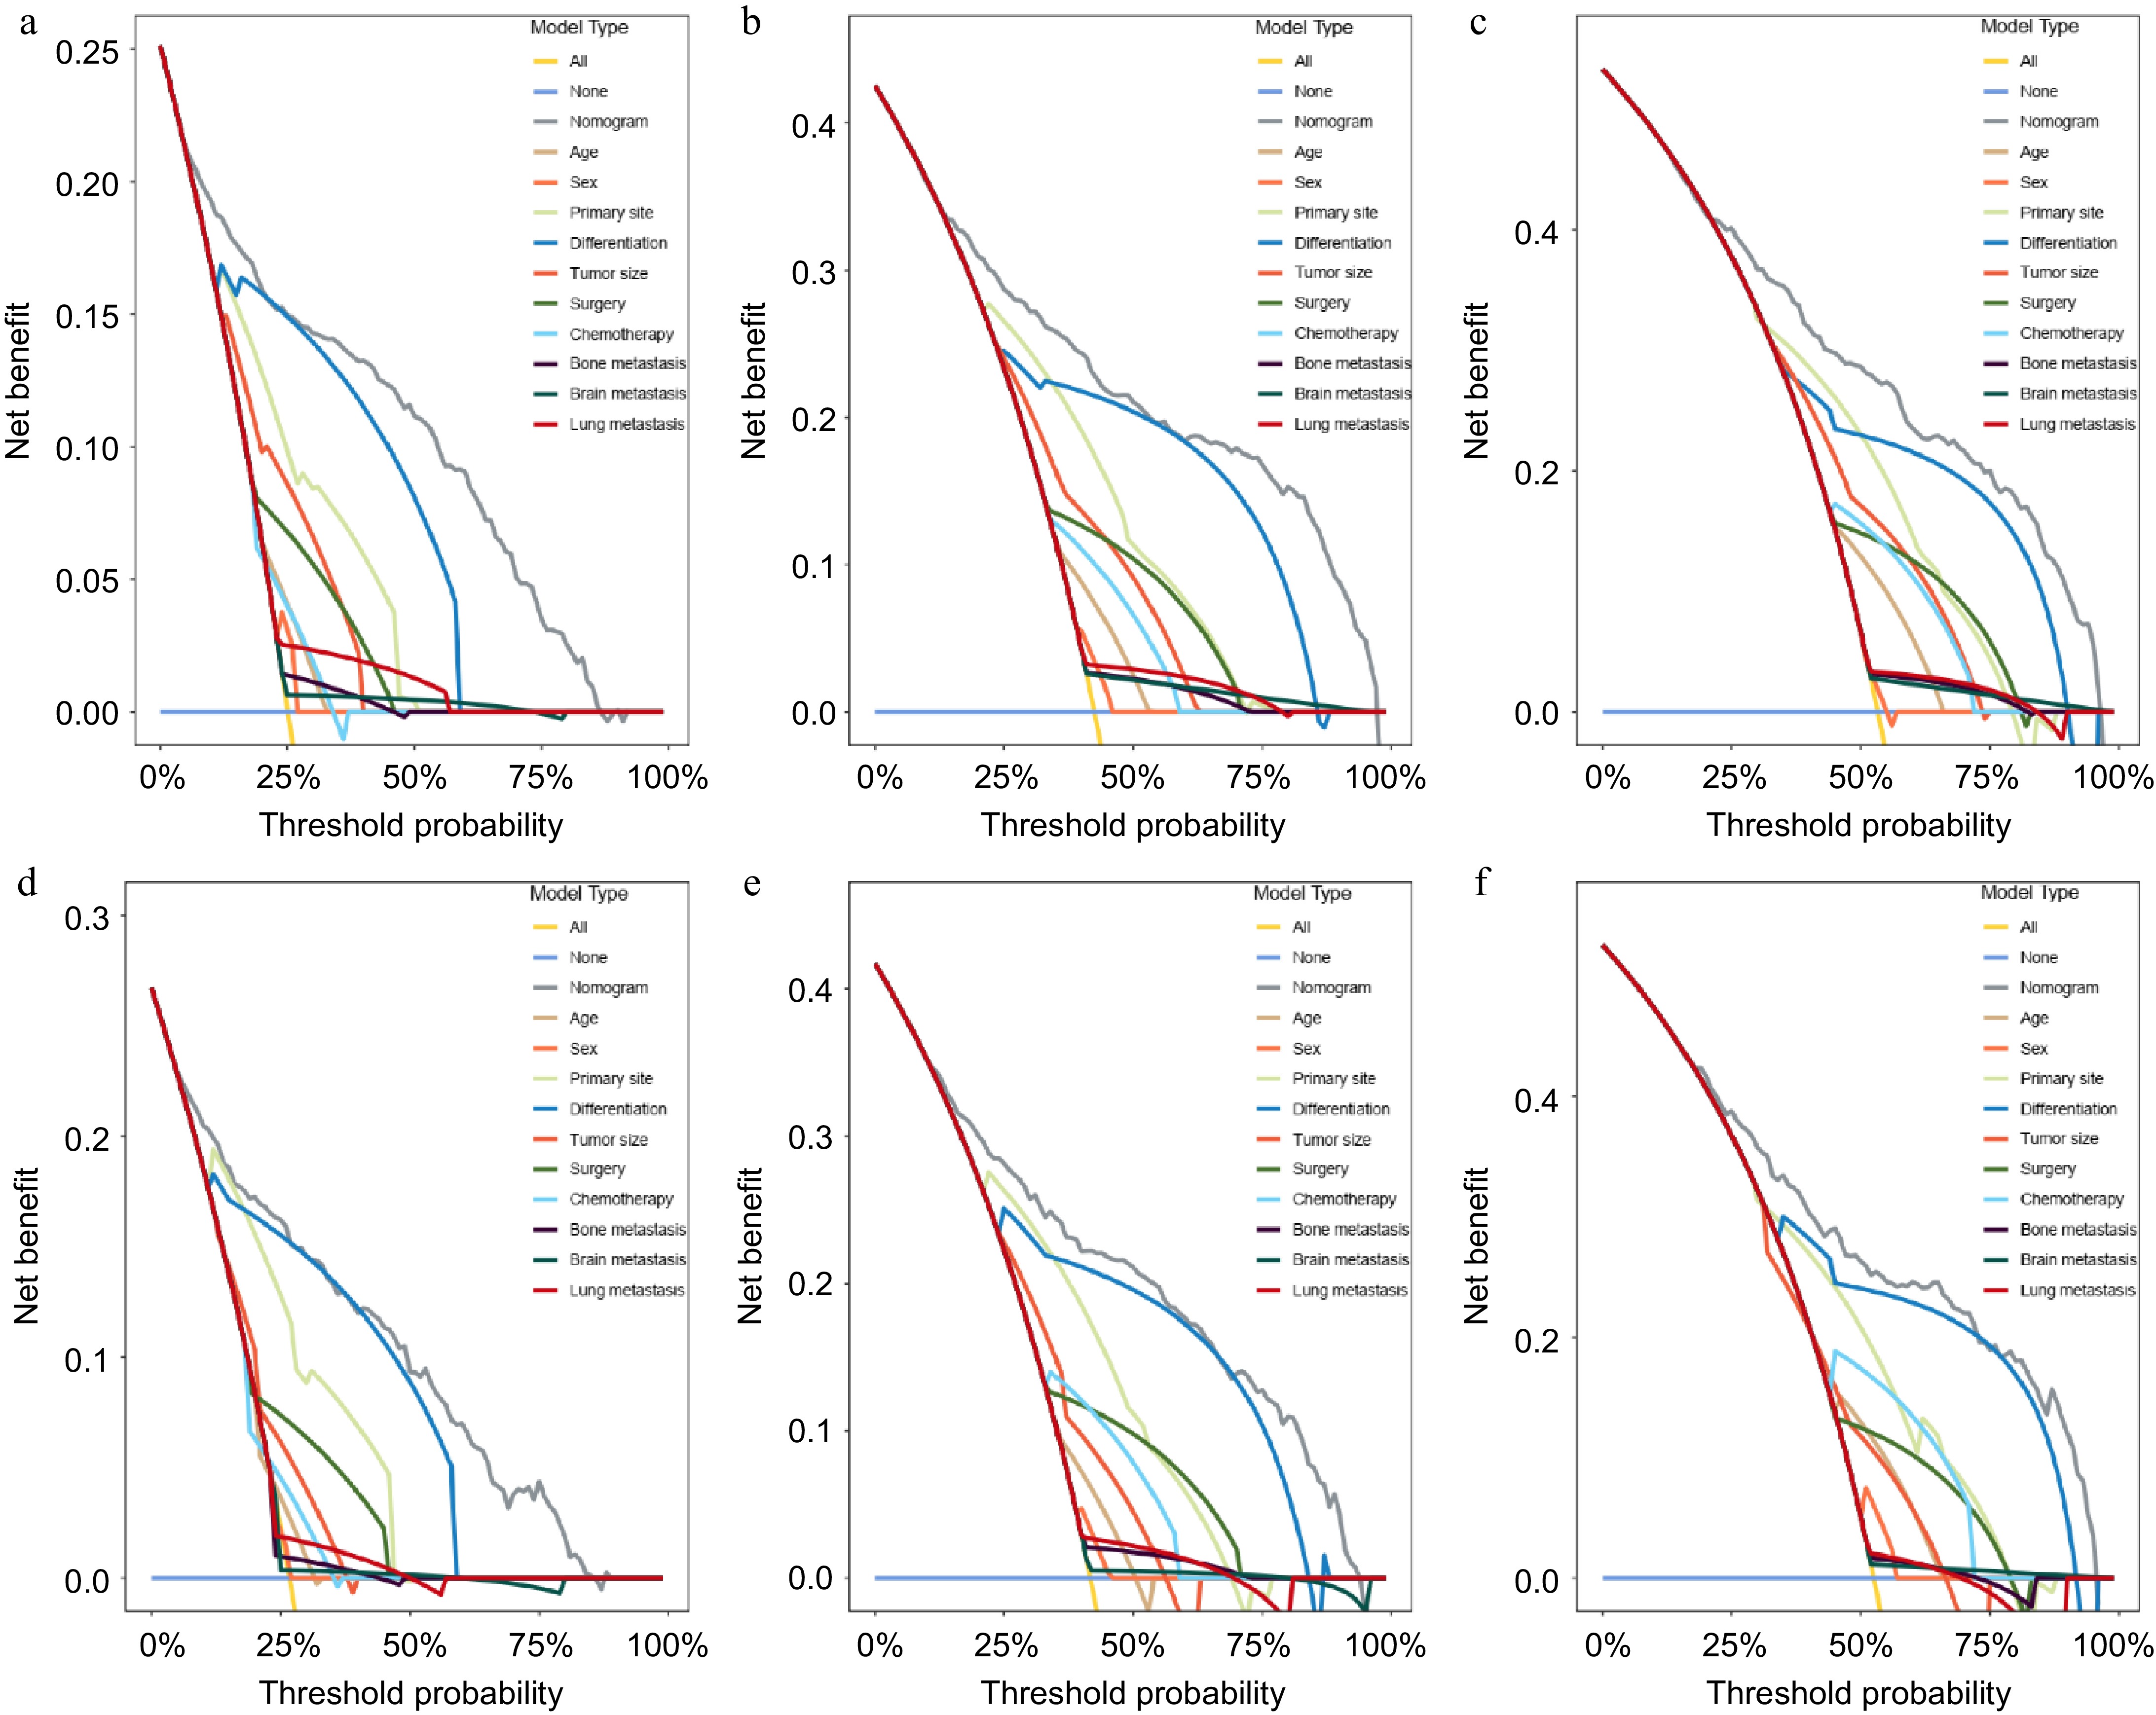
Figure 6.
DCA analysis of the clinical benefit of the nomogram- and risk factor-predicting in the training group and validation group. (a) 1-year, (b) 3-year, and (c) 5-year OS in the training group. (d)1-year, (e) 3-year, and (f) 5-year OS in the validation group.
-
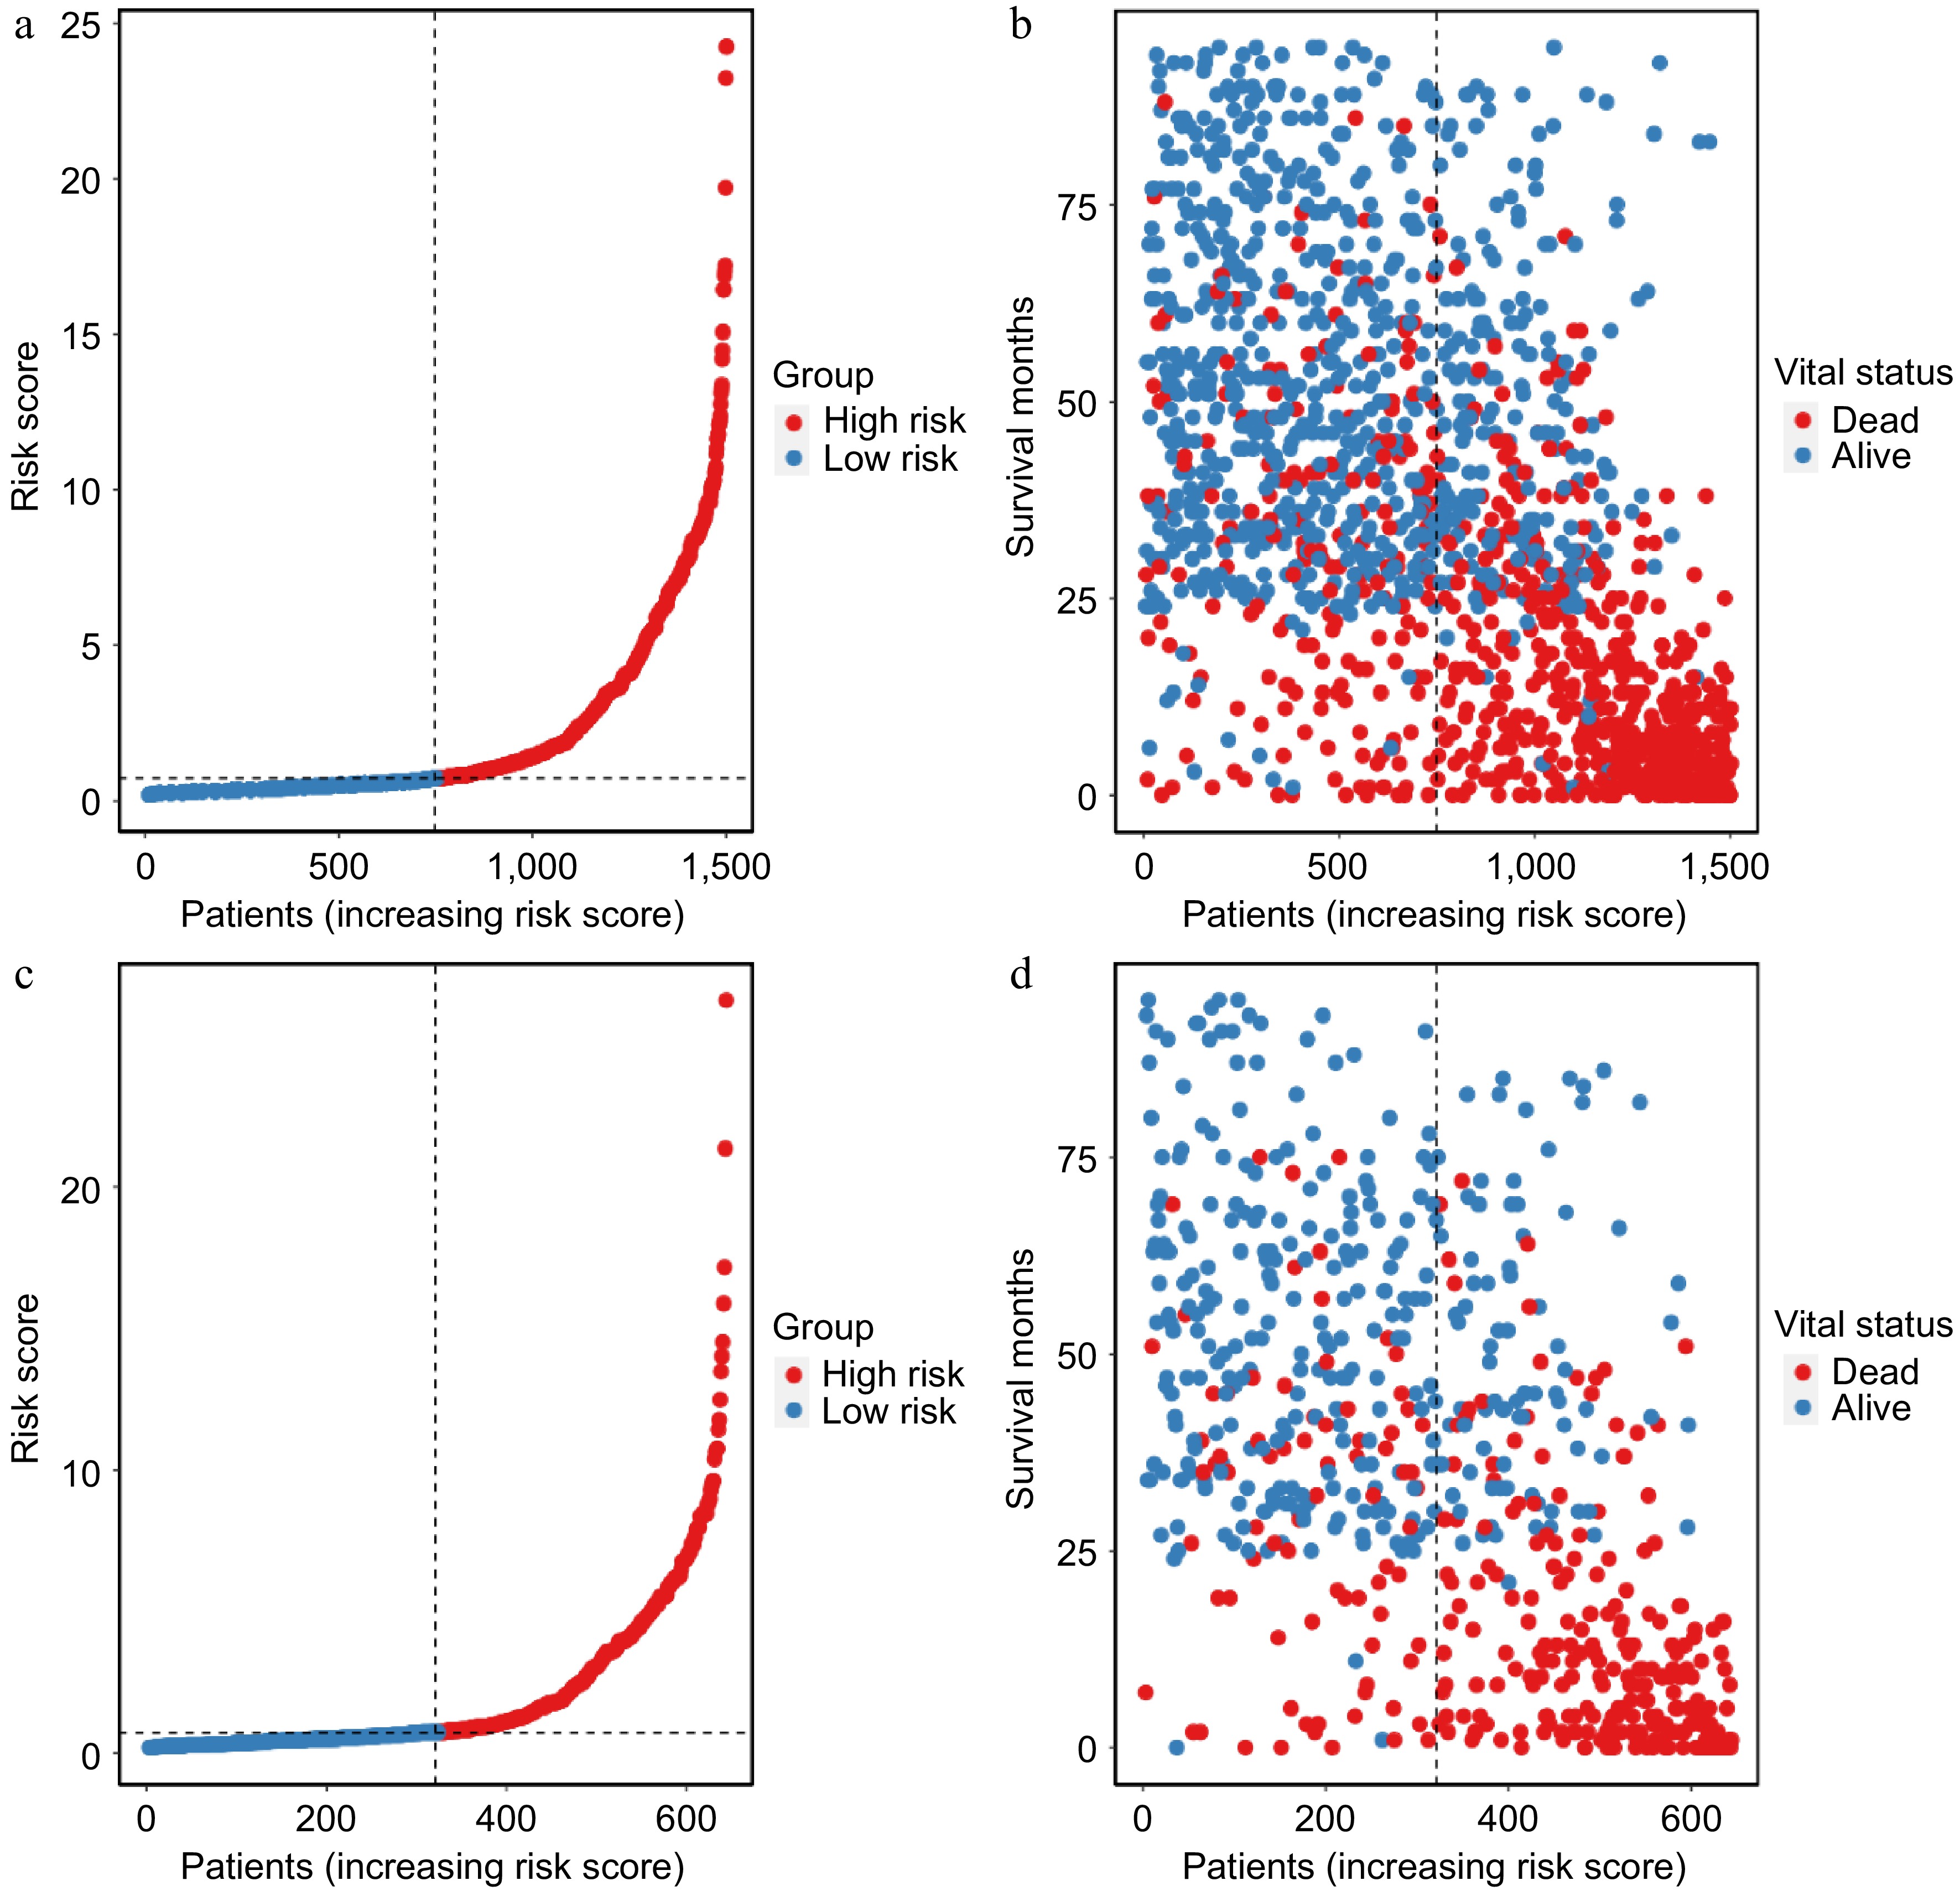
Figure 7.
Scatter plot demonstrating the risk score distribution and survival status in the (a), (b) training cohort, and the (c), (d) validation cohort.
-
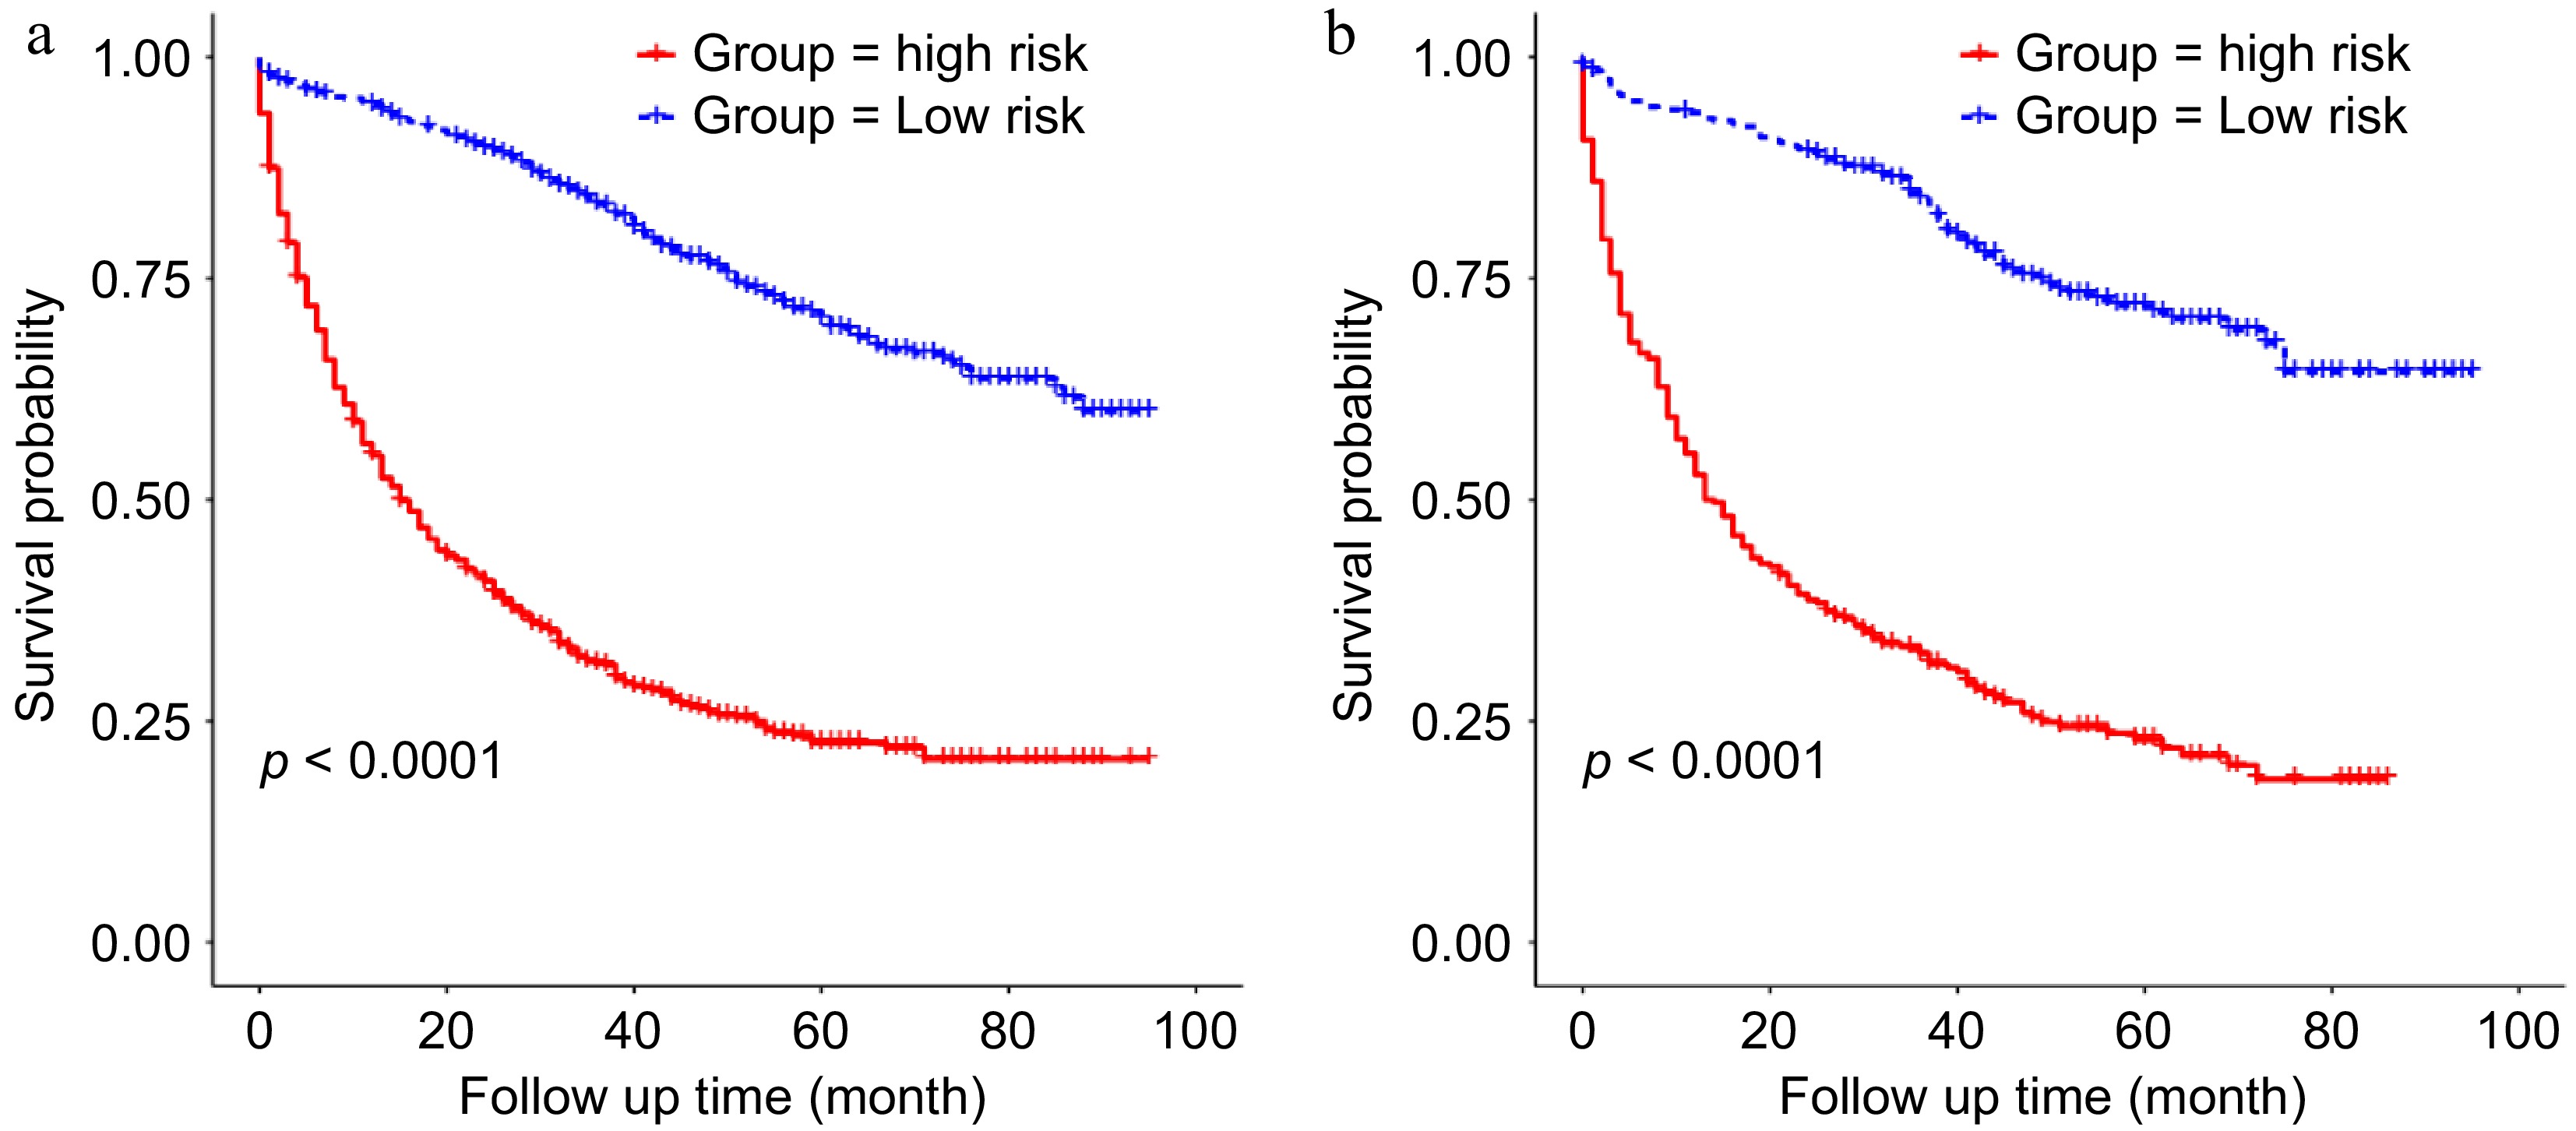
Figure 8.
Kaplan-Meier analysis of the survival difference between the high-risk and the low-risk groups based on the nomogram in the (a) training group, and the (b) validation group.
-
Characteristics Training set
(n = 1,497)Validating set
(n = 642)p-value Sex 0.847 Female 722 (48.2%) 306 (47.7%) Male 775 (51.8%) 336 (52.3%) Age (year) 0.546 < 65 897 (59.9%) 375 (58.4%) ≥ 65 600 (40.1%) 267 (41.6%) Race 0.449 Black 198 (13.2%) 73 (11.4%) White 1219 (81.4%) 537 (83.6%) Other* 80 (5.3%) 32 (5.0%) Primary site 0.824 Stomach 56 (3.7%) 21 (3.3%) Colorectum 326 (21.8%) 148 (23.1%) Pancreas 401 (26.8%) 169 (26.3%) Small intestine 652 (43.6%) 272 (42.4%) Other* 62 (4.1%) 32 (5.0%) Tumor differentiation 0.610 Well differentiated 764 (51.0%) 311 (48.4%) Moderately differentiated 305 (20.4%) 146 (22.7%) Poorly differentiated 296 (19.8%) 129 (20.1%) Undifferentiated 132 (8.8%) 56 (8.7%) Tumor size (mm) 0.934 ≤ 20 392 (26.2%) 166 (25.9%) 21 − 40 561 (37.5%) 246 (38.3%) ≥ 41 544 (36.3%) 230 (35.8%) LN metastasis 0.065 No 438 (29.3%) 162 (25.2%) Yes 1059 (70.7%) 480 (74.8%) Surgery 0.260 None surgery 357 (23.8%) 138 (21.5%) Resection 1140 (76.2%) 504 (78.5%) Chemotherapy 0.984 No/Unknown 998 (66.7%) 429 (66.8%) Yes 499 (33.3%) 213 (33.2%) Radiotherapy 0.231 No 1447 (96.7%) 613 (95.5%) Yes 50 (3.3%) 29 (4.5%) Bone metastasis 0.344 No 1423 (95.1%) 617 (96.1%) Yes 74 (4.9%) 25 (3.9%) Brain metastasis 0.805 No 1482 (99.0%) 637 (99.2%) Yes 15 (1.0%) 5 (0.8%) Liver metastasis 0.205 No 381 (25.5%) 181 (28.2%) Yes 1116 (74.5%) 461 (71.8%) Lung metastasis 0.642 No 1422 (95.0%) 606 (94.4%) Yes 75 (5.0%) 36 (5.6%) Vital status 0.906 Alive 759 (50.7%) 323 (50.3%) Dead 738 (49.3%) 319 (49.7%) Race, Other* (American Indian/AK Native, Asian/Pacific Islander); Primary site, Other* (Ampulla Vater, Appendix). Table 1.
Characteristics of stage IV GEP-NENs.
-
Characteristic Univariate analysis Multivariate analysis Hazard ratio (95% CI) p-value Hazard ratio (95% CI) p-value Age < 65 1 1 ≥ 65 1.768 (1.529−2.043) < 0.001*** 1.7388 (1.4983−2.0178) < 0.001*** Sex Female 1 1 Male 1.186 (1.027−1.371) 0.0206* 1.1354 (0.9770−1.319)4 0.0976 Race Black 1 White 0.9511 (0.7683−1.177) 0.645 Other 0.8780 (0.5992−1.286) 0.504 Primary site Stomach 1 1 Pancreas 0.4687 (0.3393−0.6475) < 0.001*** 0.5646 (0.4057−0.7859) < 0.001*** Small intestine 0.1693 (0.1215−0.2360) < 0.001*** 0.4707 (0.3238−0.6844) < 0.001*** Colorectum 0.8889 (0.6448−1.2254) 0.472 1.0968 (0.7842−1.5341) 0.5892 Other 0.5199 (0.3386−0.7982) 0.0028** 0.7265 (0.4611−1.1447) 0.168 Tumor differentiation Well 1 1 Moderate 1.406 (1.133−1.746) 0.0020** 1.2833 (1.0308−1.5975) 0.0256* Poor 7.245 (6.044−8.685) < 0.001*** 4.9798 (4.0054−6.1913) < 0.001*** Undifferentiated 7.344 (5.841−9.235) < 0.001*** 4.3354 (3.3169−5.6666) < 0.001*** Tumor size ≤ 20 1 1 21−40 1.688 (1.352−2.107) < 0.001*** 1.2281 (0.9751−1.5469) 0.0809 ≥ 41 3.609 (2.924−4.454) < 0.001*** 1.6713 (1.3110−2.1305) < 0.001*** LN metastasis No 1 Yes 0.952 (0.8141−1.113) 0.538 Surgery None surgery 1 1 Resection 0.3404 (0.2922−0.3967) < 0.001*** 0.5327 (0.4386−0.6471) < 0.001*** Chemotherapy No/unknown 1 1 Yes 2.146 (1.855−2.484) < 0.001*** 0.7411 (0.6177−0.8891) 0.0013** Radiotherapy No 1 Yes 1.131 (0.7751−1.65) 0.524 Bone metastasis No 1 1 Yes 2.458 (1.877−3.219) < 0.001*** 1.1790 (0.8839−1.5725) 0.2625 Brain metastasis No 1 1 Yes 5.609 (3.348−9.4) < 0.001*** 1.4468 (0.8486−2.4666) 0.1748 Liver metastasis No 1 Yes 1.082 (0.9165−1.279) 0.351 Lung metastasis No 1 1 Yes 3.094 (2.376−4.028) < 0.001*** 1.4748 (1.1180−1.9455) 0.0060** * p-value < 0.05; ** p-value < 0.01; *** p-value < 0.001; CI, confidence interval. Values in blodface were p-value < 0.05. Table 2.
Univariate and multivariate analysis of overall survival in patients of the training group.
Figures
(8)
Tables
(2)