-
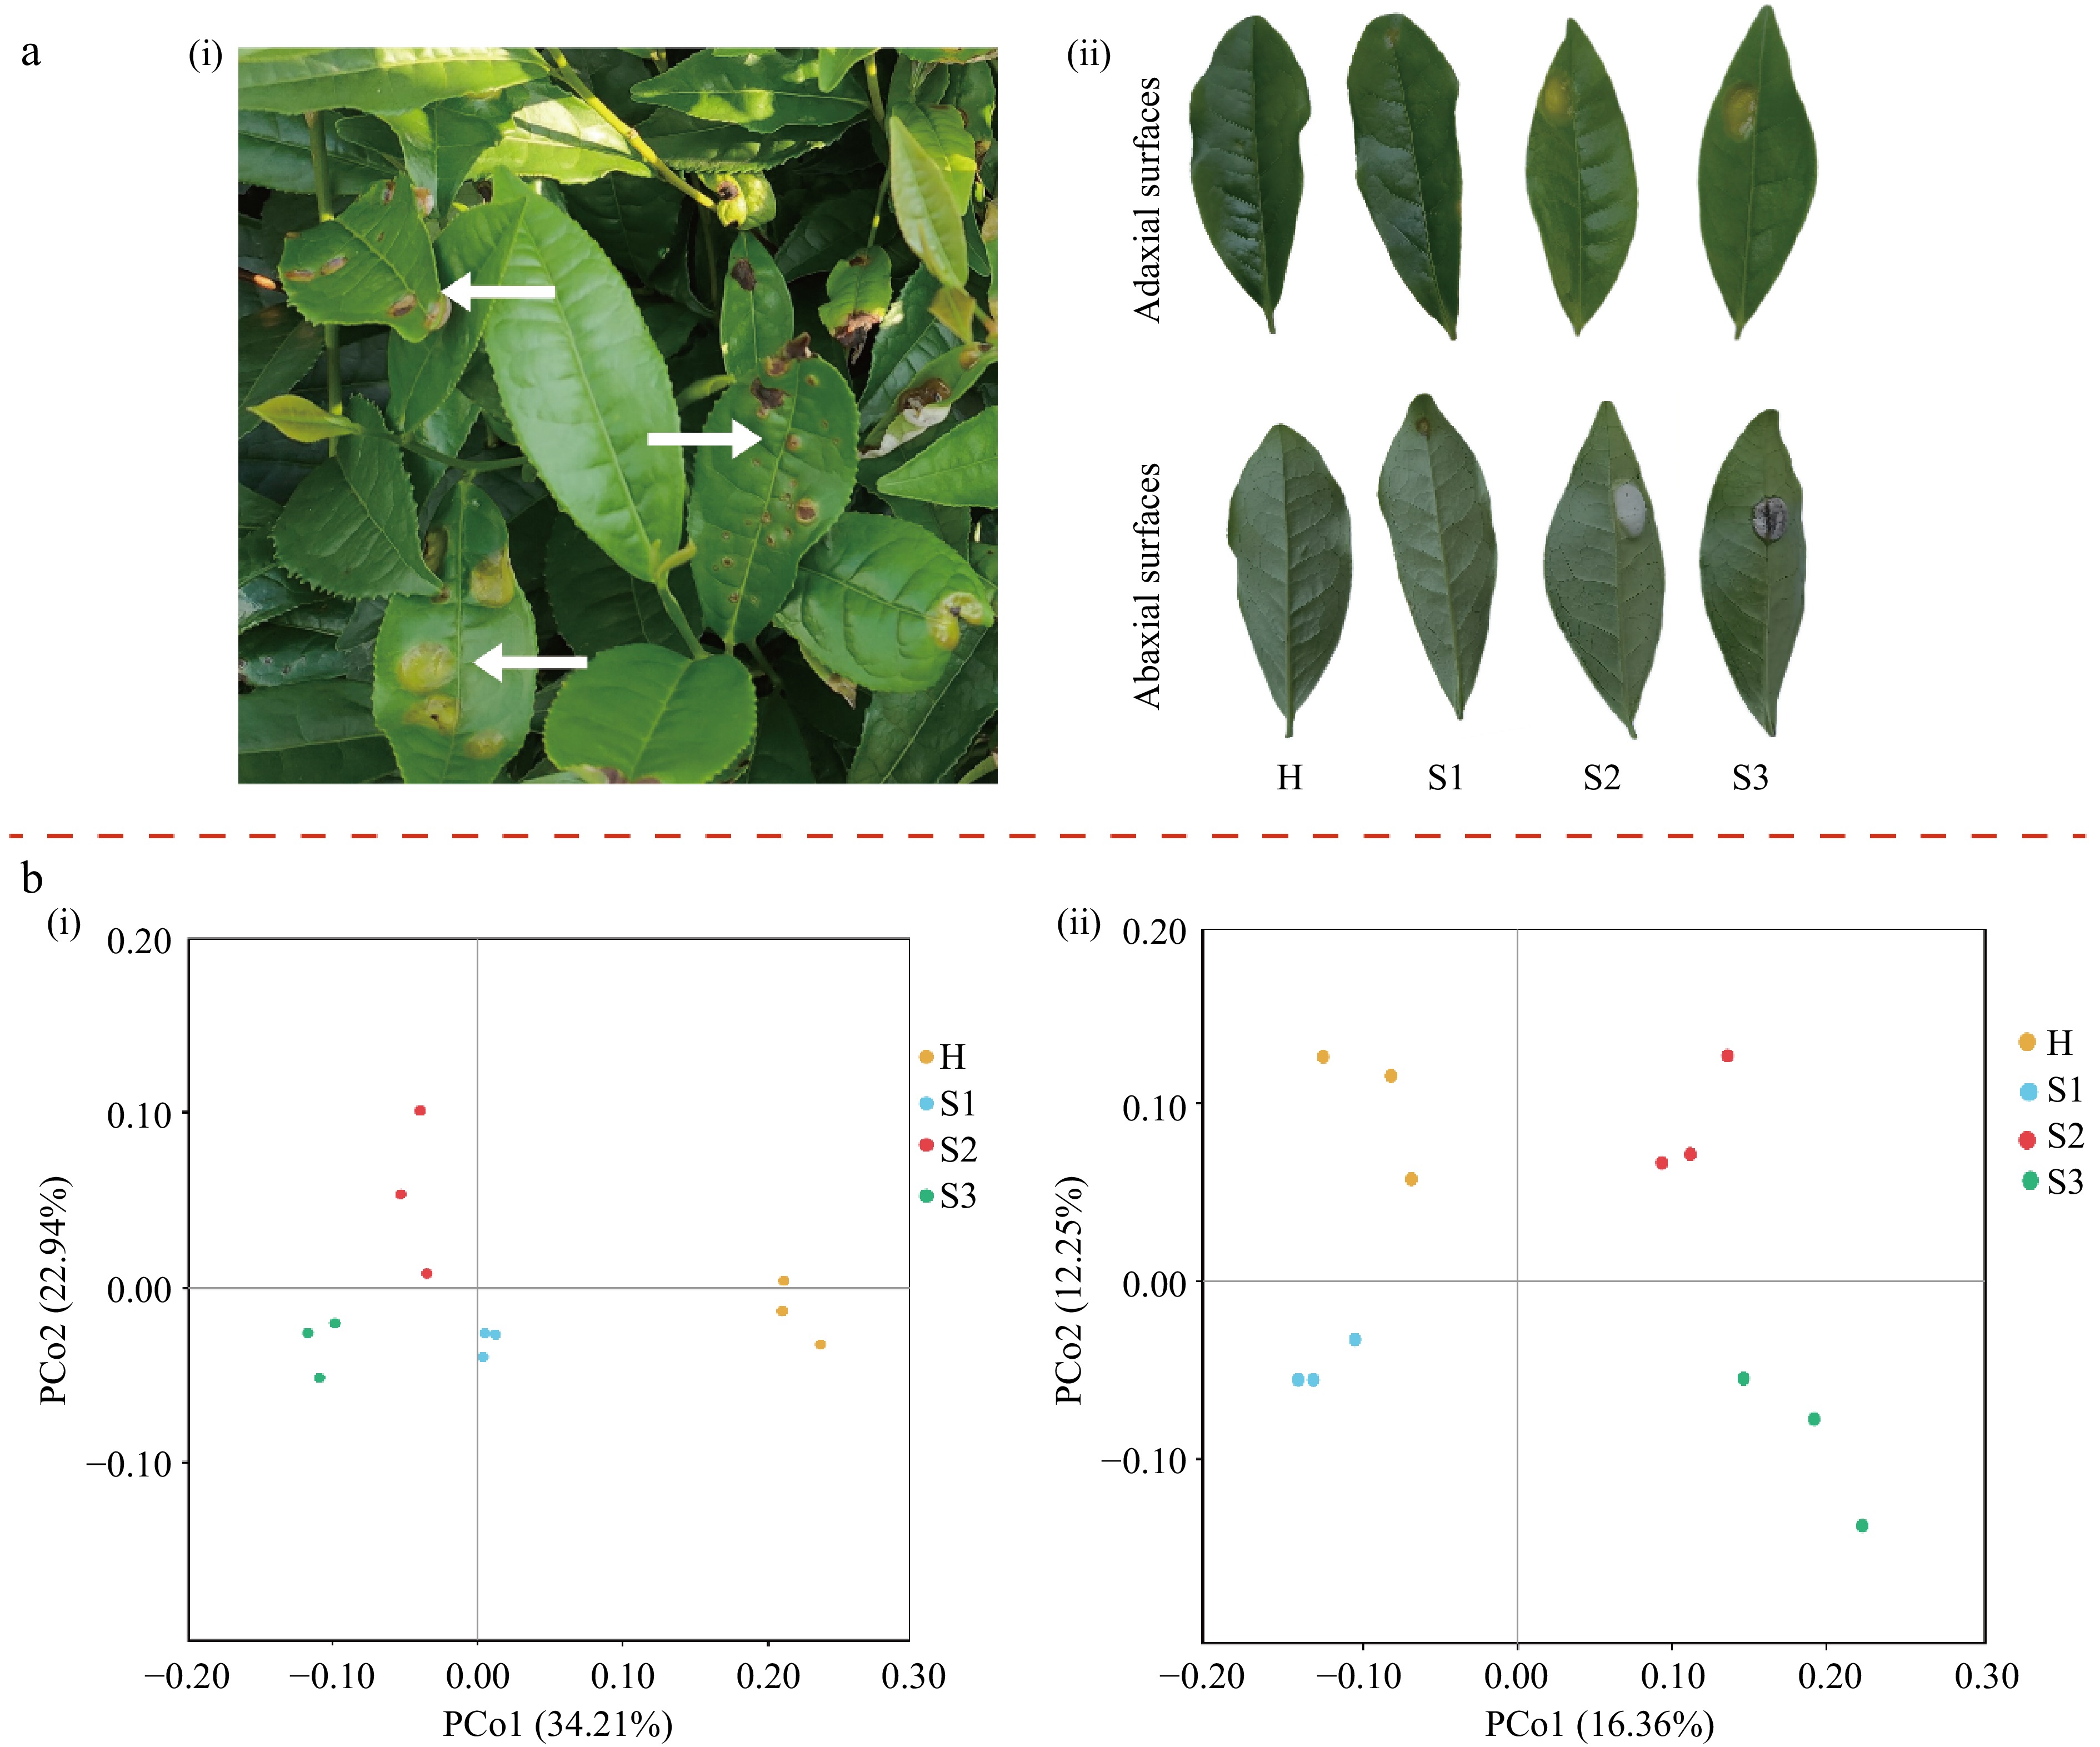
Figure 1.
(a) Phenotypes and disease symptoms of leaves infested with tea blister blight. (b) PCoA plots of the microbial community based on unweighted UniFrac distances. (ai) Appearance of tea blister blight disease in tea plantations; (aii) disease phenotypes of tea leaves at different tea blister blight disease stages. (bi) Bacterial community; (bii) fungal community. H, healthy leaves; S1, tea leaves in the early disease stage; S2, tea leaves in the middle disease stage; S3, tea leaves in the late disease stage.
-
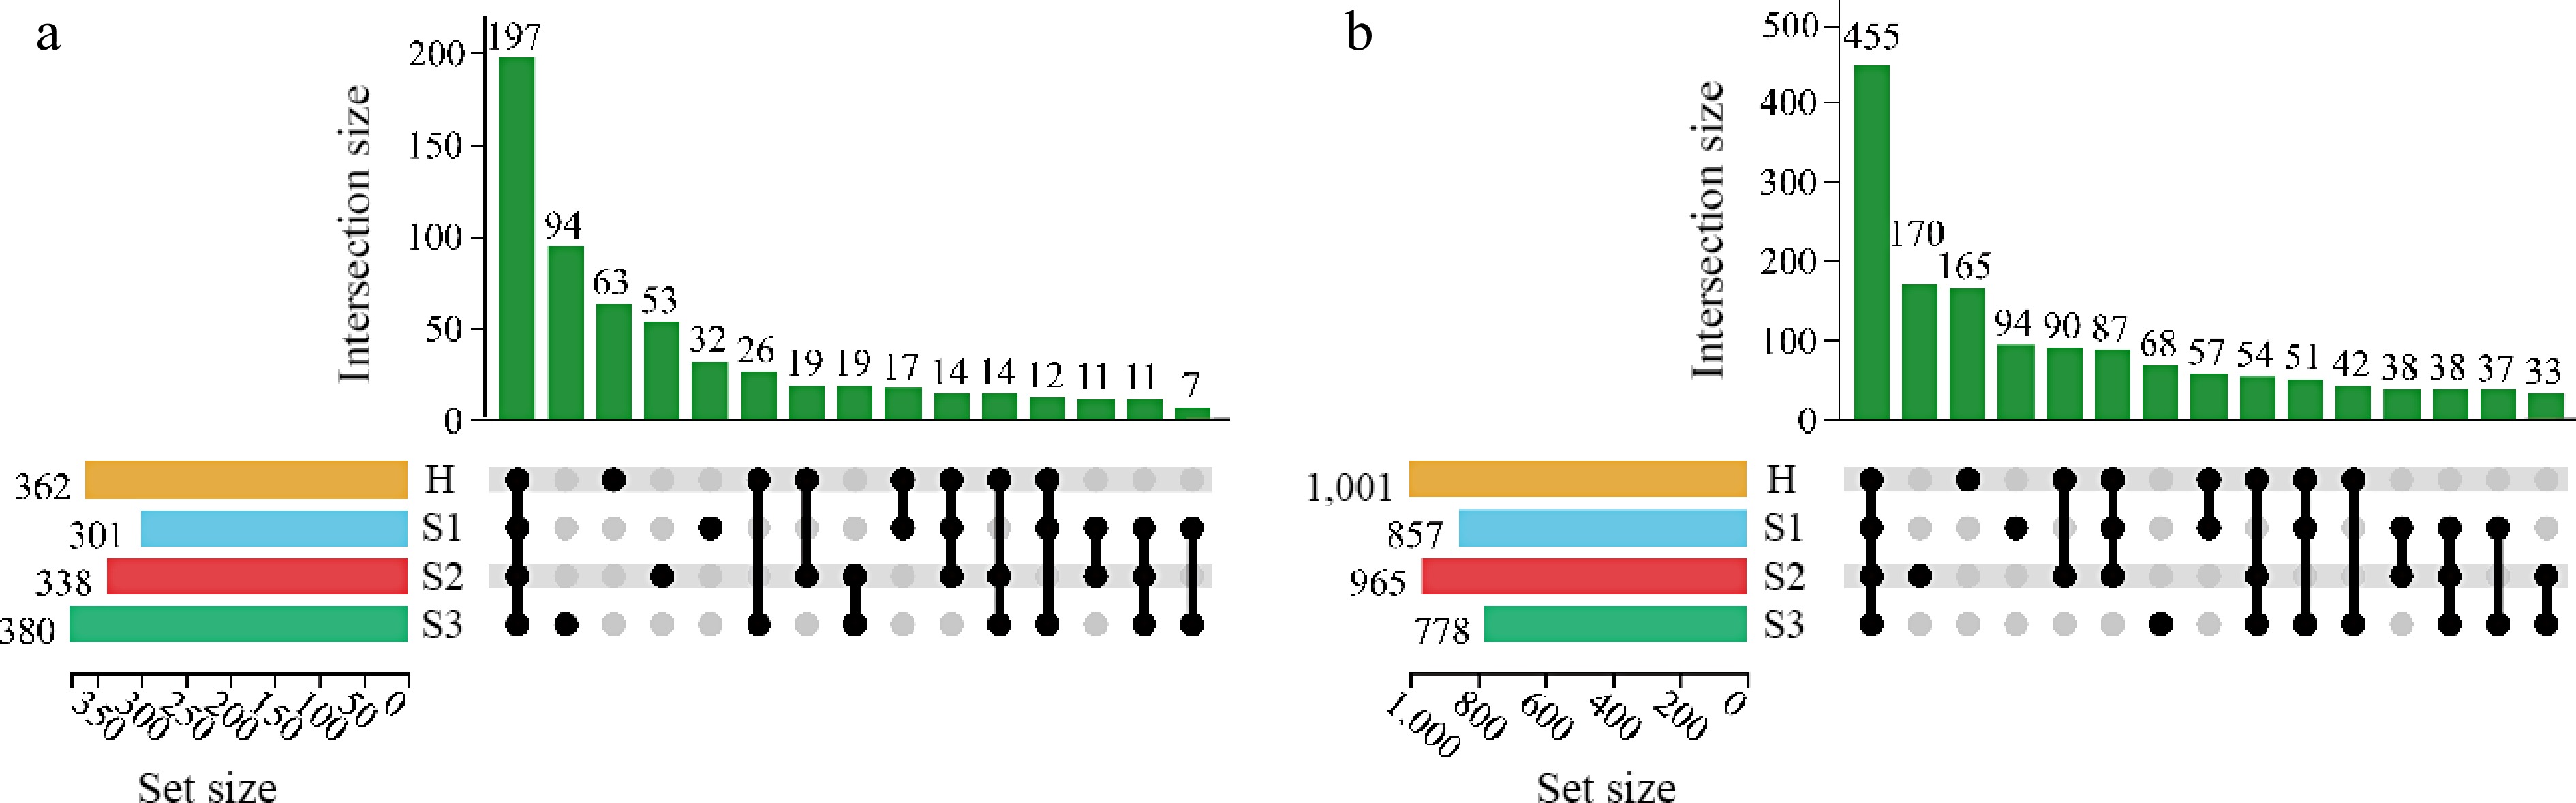
Figure 2.
UpSet plot of OTUs of the microbial community at different disease development stages. (a) Bacterial community; (b) fungal community; H, healthy leaves; S1, tea leaves in the early disease stage; S2, tea leaves in the middle disease stage; S3, tea leaves in the late disease stage; Dark circles indicate samples containing accessions, while connecting bars indicate multiple overlapping samples.
-
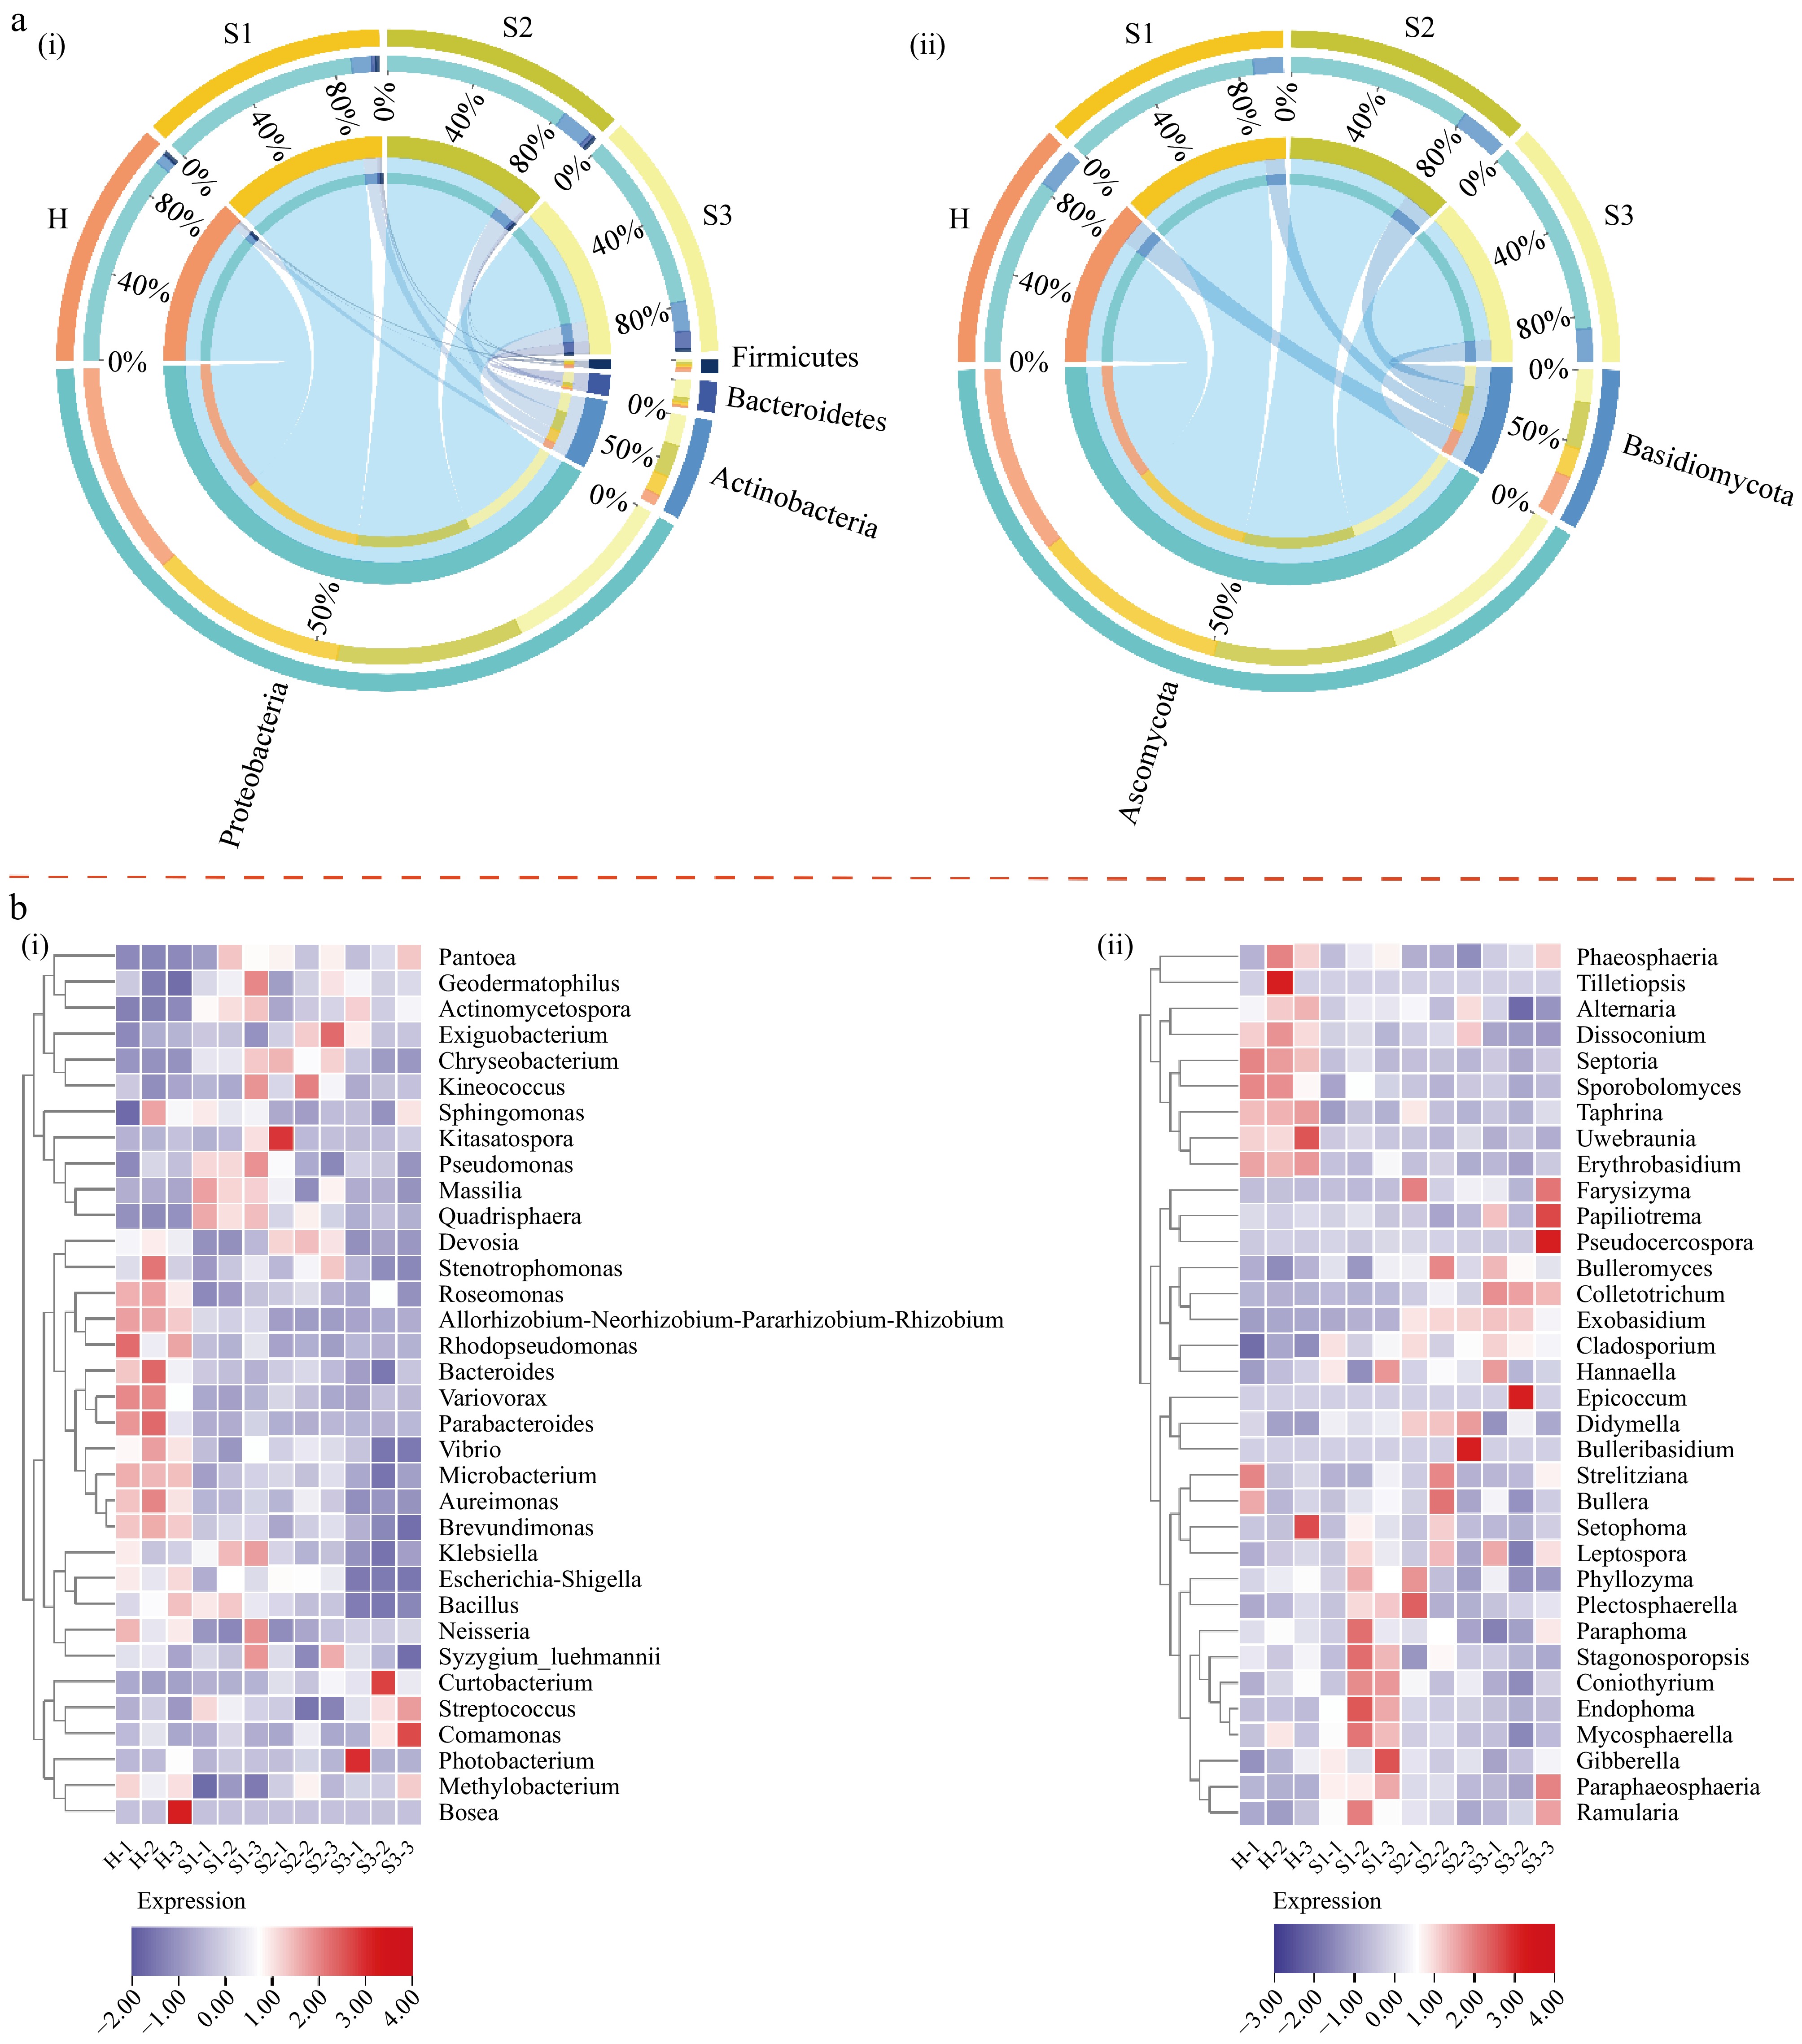
Figure 3.
(a) Differences in the microbial community at different disease development stages at the phylum level. (b) Heatmap of the 35 most abundant genera in the bacterial and fungal communities at different disease development stages. (ai) Bacterial community; (aii) fungal community; (bi) bacterial community; (bii) fungal community. H, healthy leaves; S1, tea leaves in the early disease stage; S2, tea leaves in the middle disease stage; S3, tea leaves in the late disease stage. The samples are clustered according to the similarities among their constituents and arranged in a horizontal order. Red represents the more abundant genera in the corresponding group, while blue represents the less abundant genera.
-
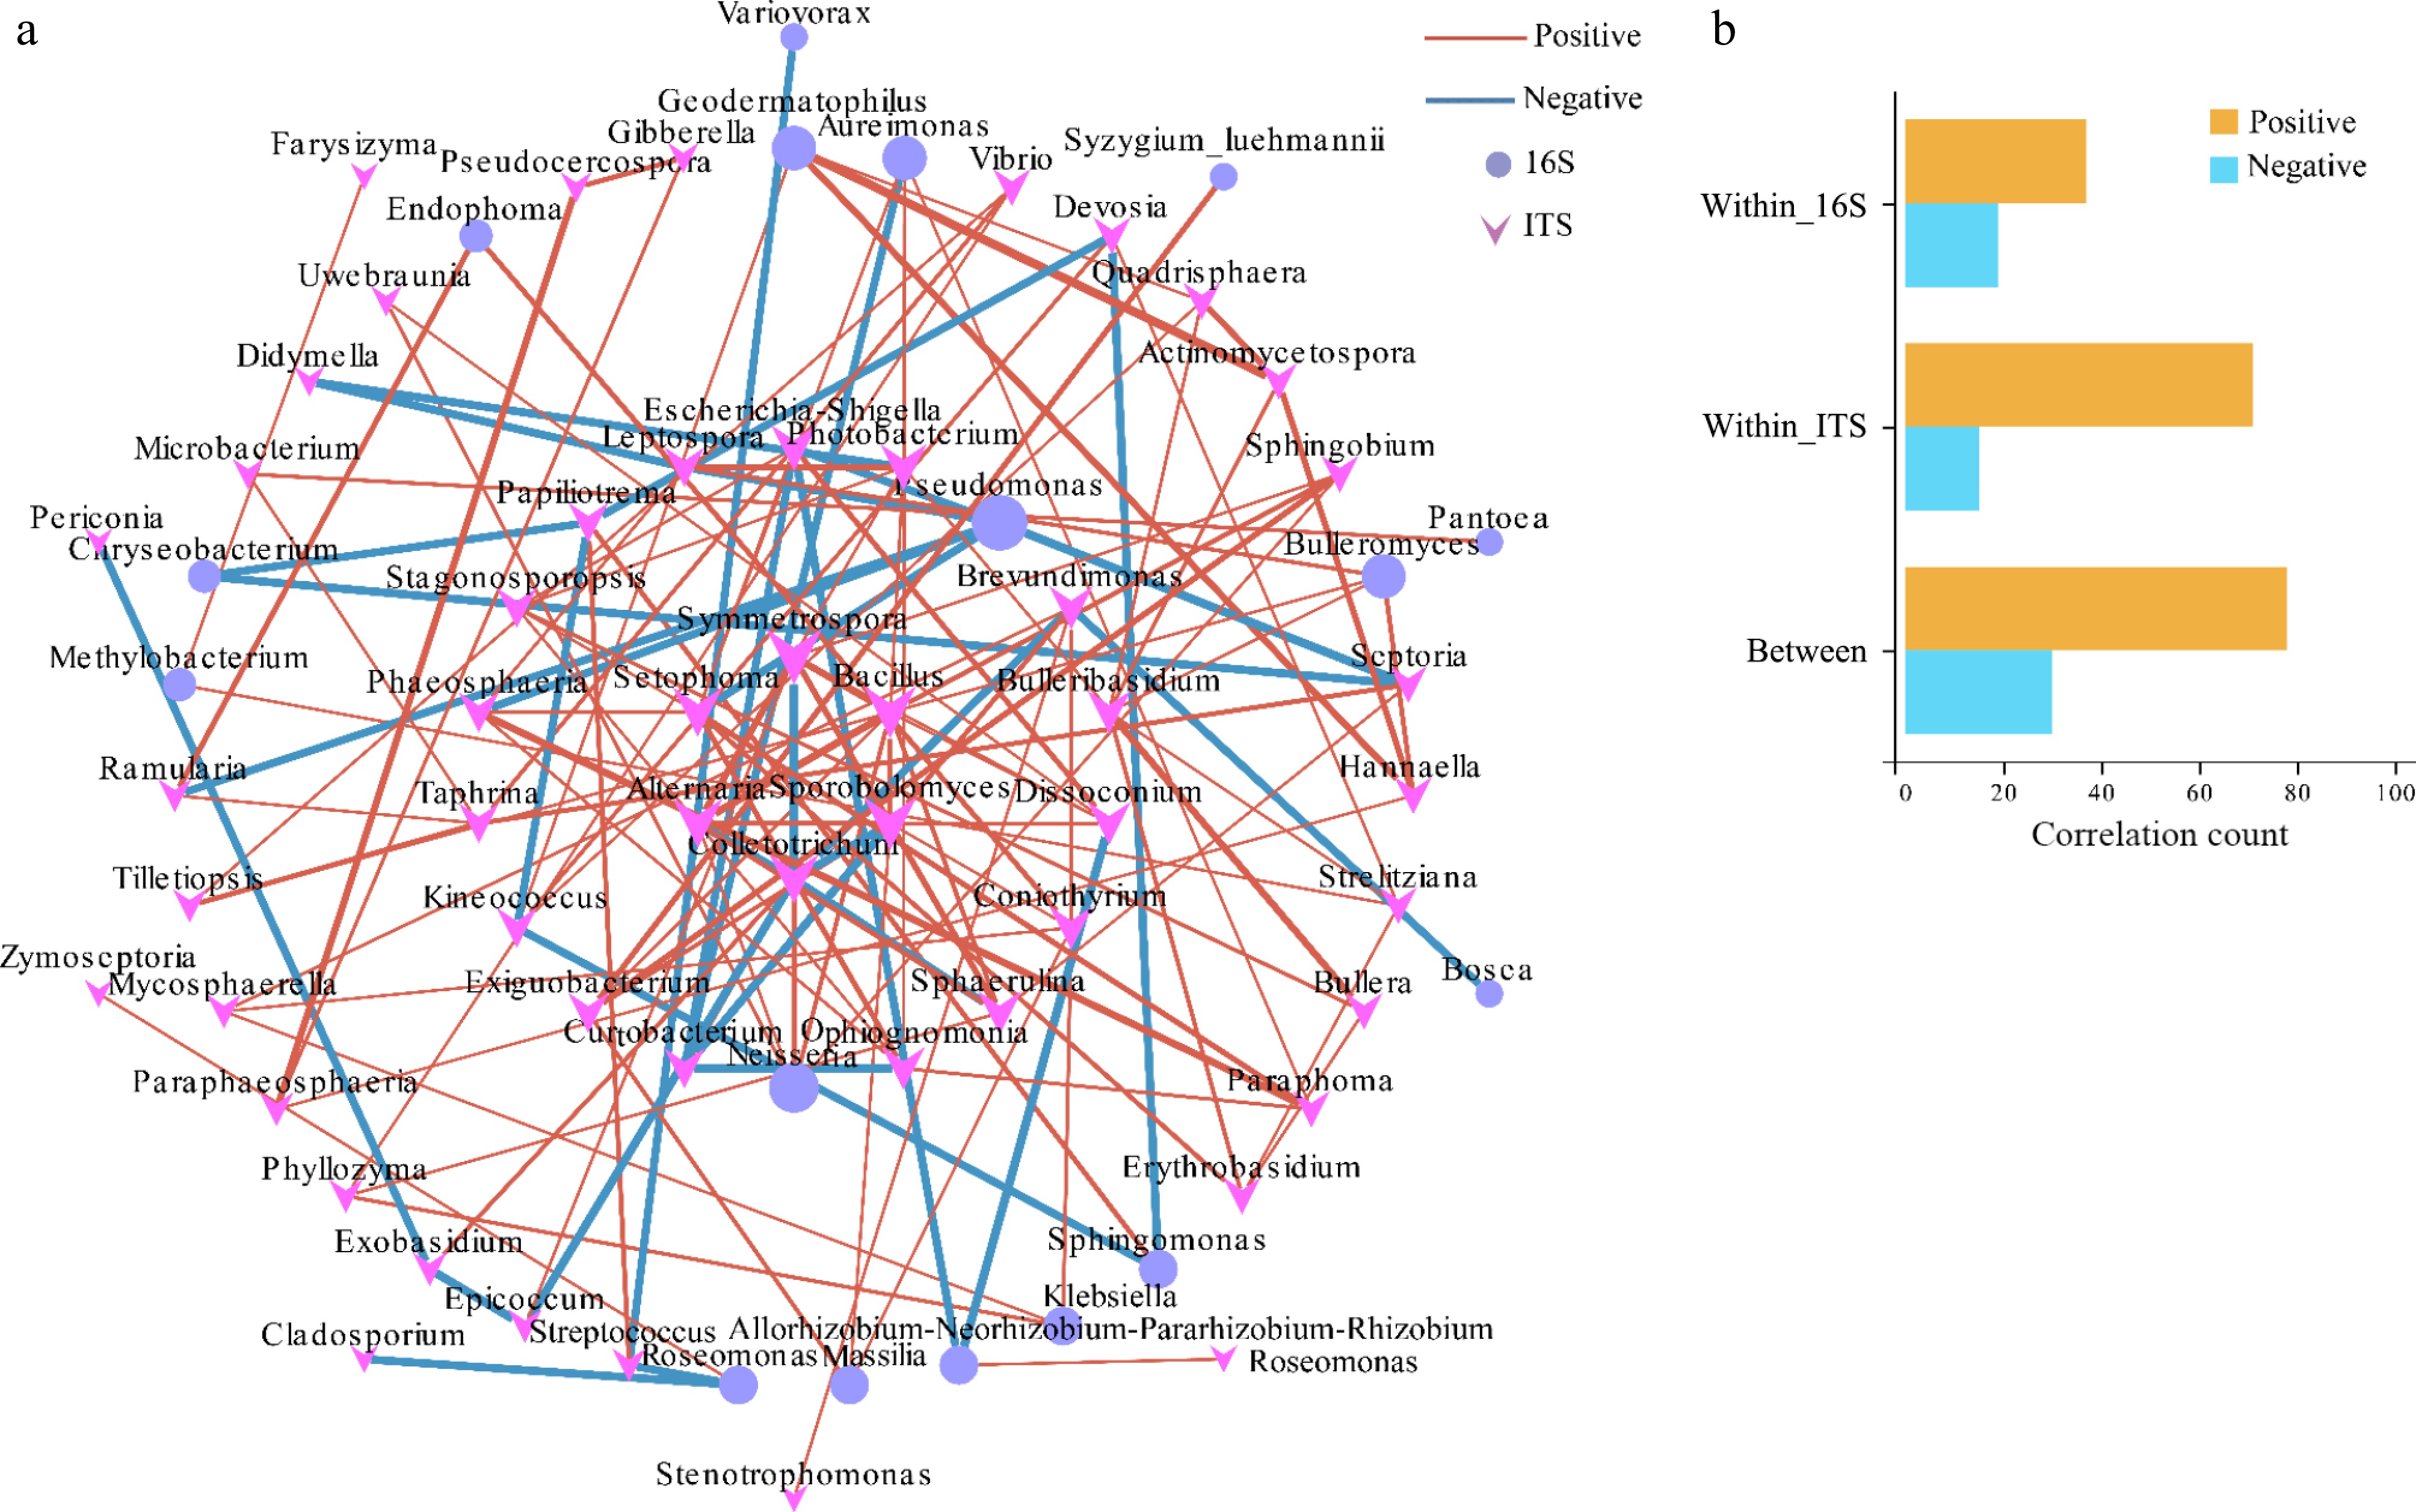
Figure 4.
Co-occurrence network and correlation analysis among the bacterial and fungal communities. (a) Co-occurrence network. (b) Correlation analysis; all correlated OTUs were visualized in a network, where OTUs were set as nodes and the correlations were set as edges. OTUs that were identified as indicator OTUs in an indicator analysis and that also appeared in the co-occurrence were shown as larger nodes.
-
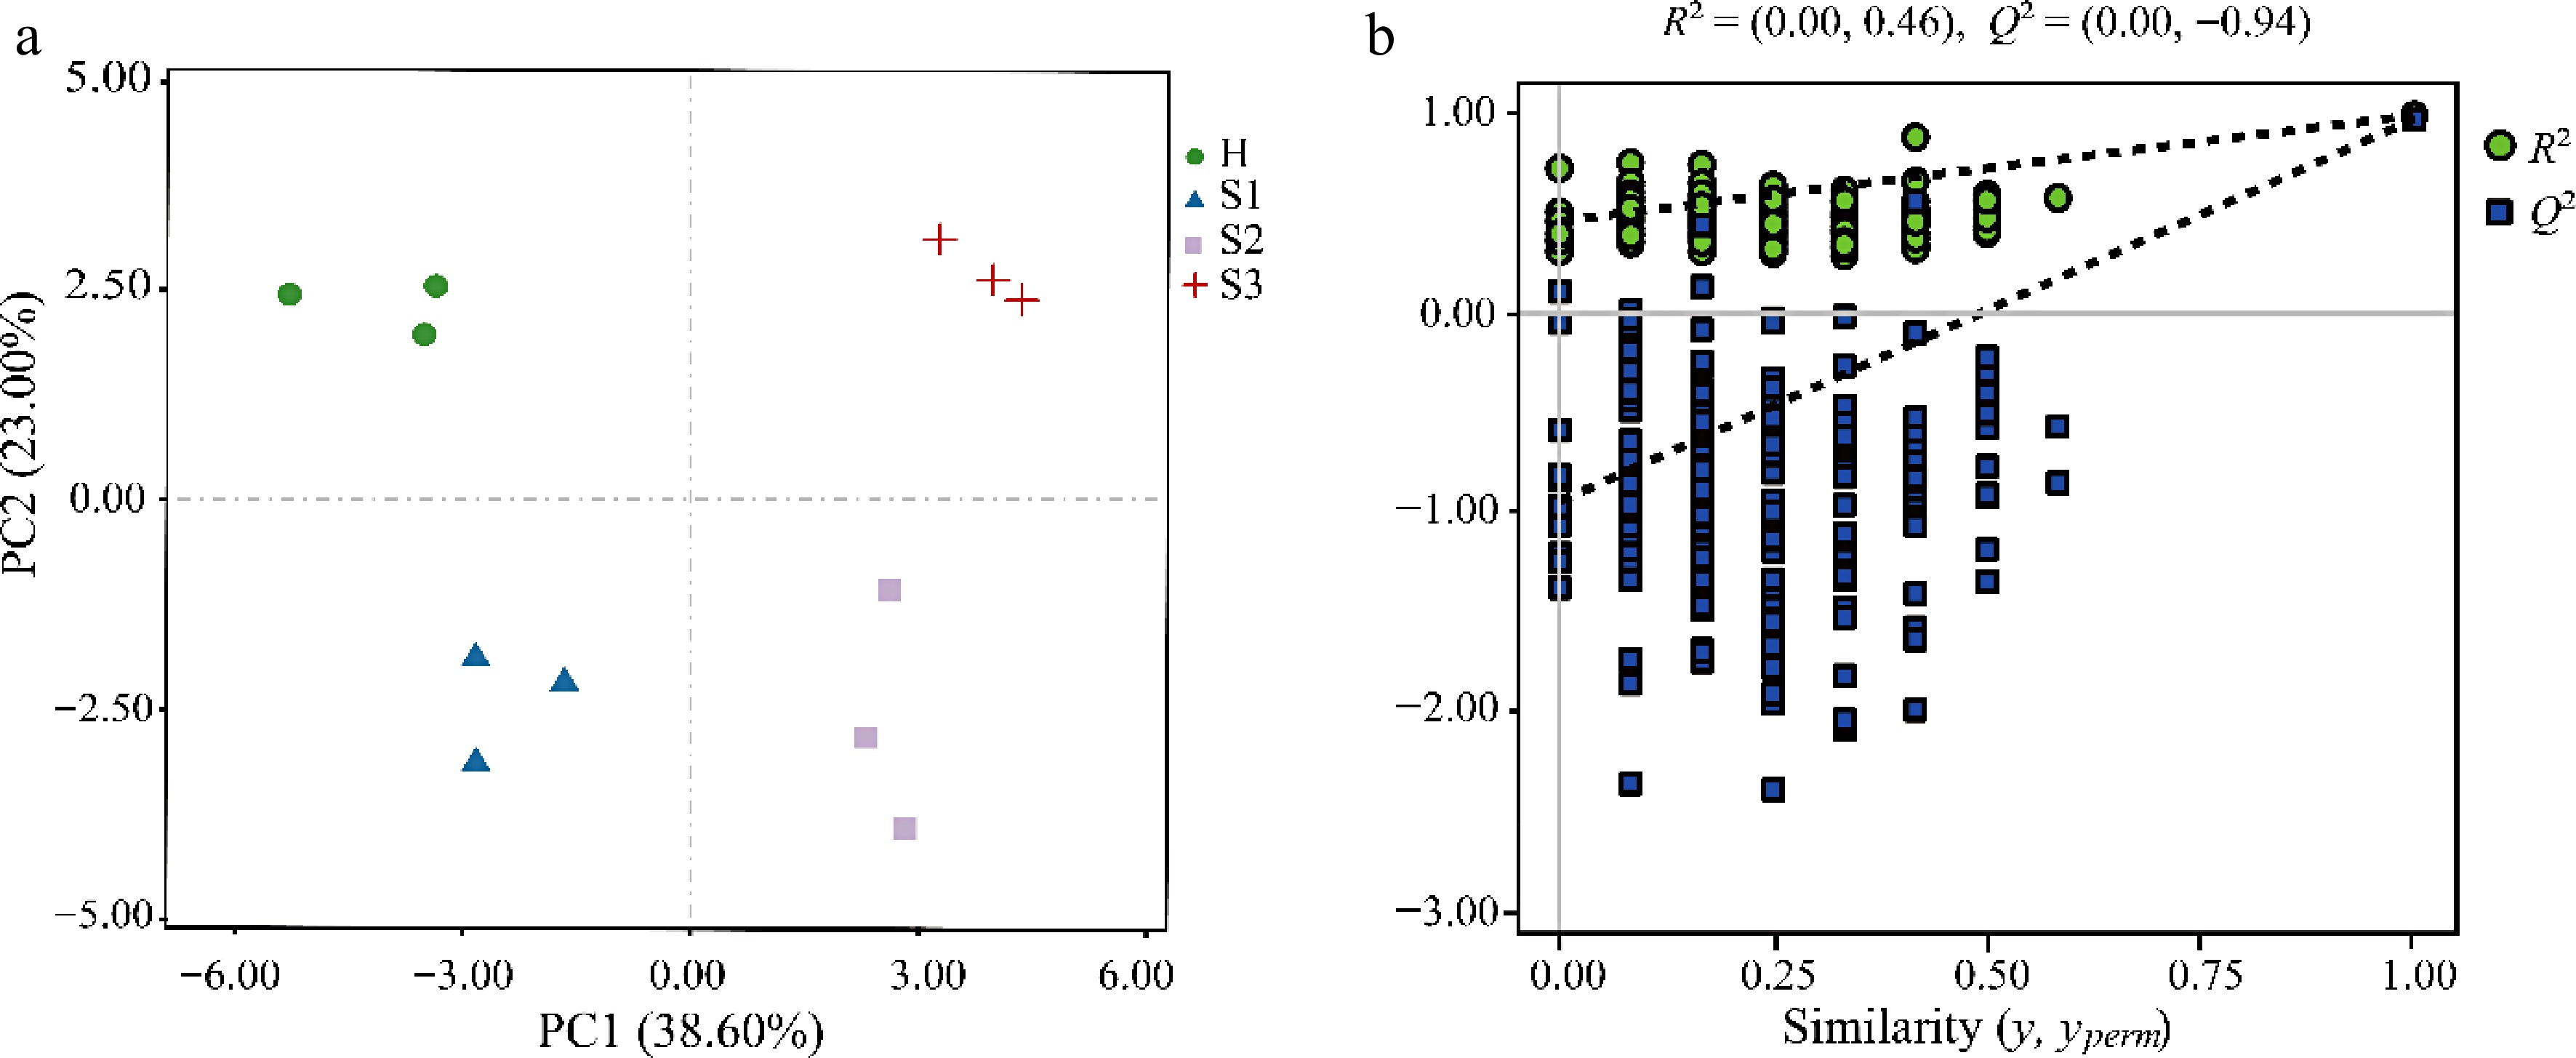
Figure 5.
Multivariate statistical analysis for the differences in the metabolites of tea leaves at different disease development stages. (a) PLS-DA score plot; (b) permutation tests for the PLS-DA score plot. H, healthy leaves; S1, tea leaves in the early disease stage; S2, tea leaves in the middle disease stage; S3, tea leaves in the late disease stage.
-
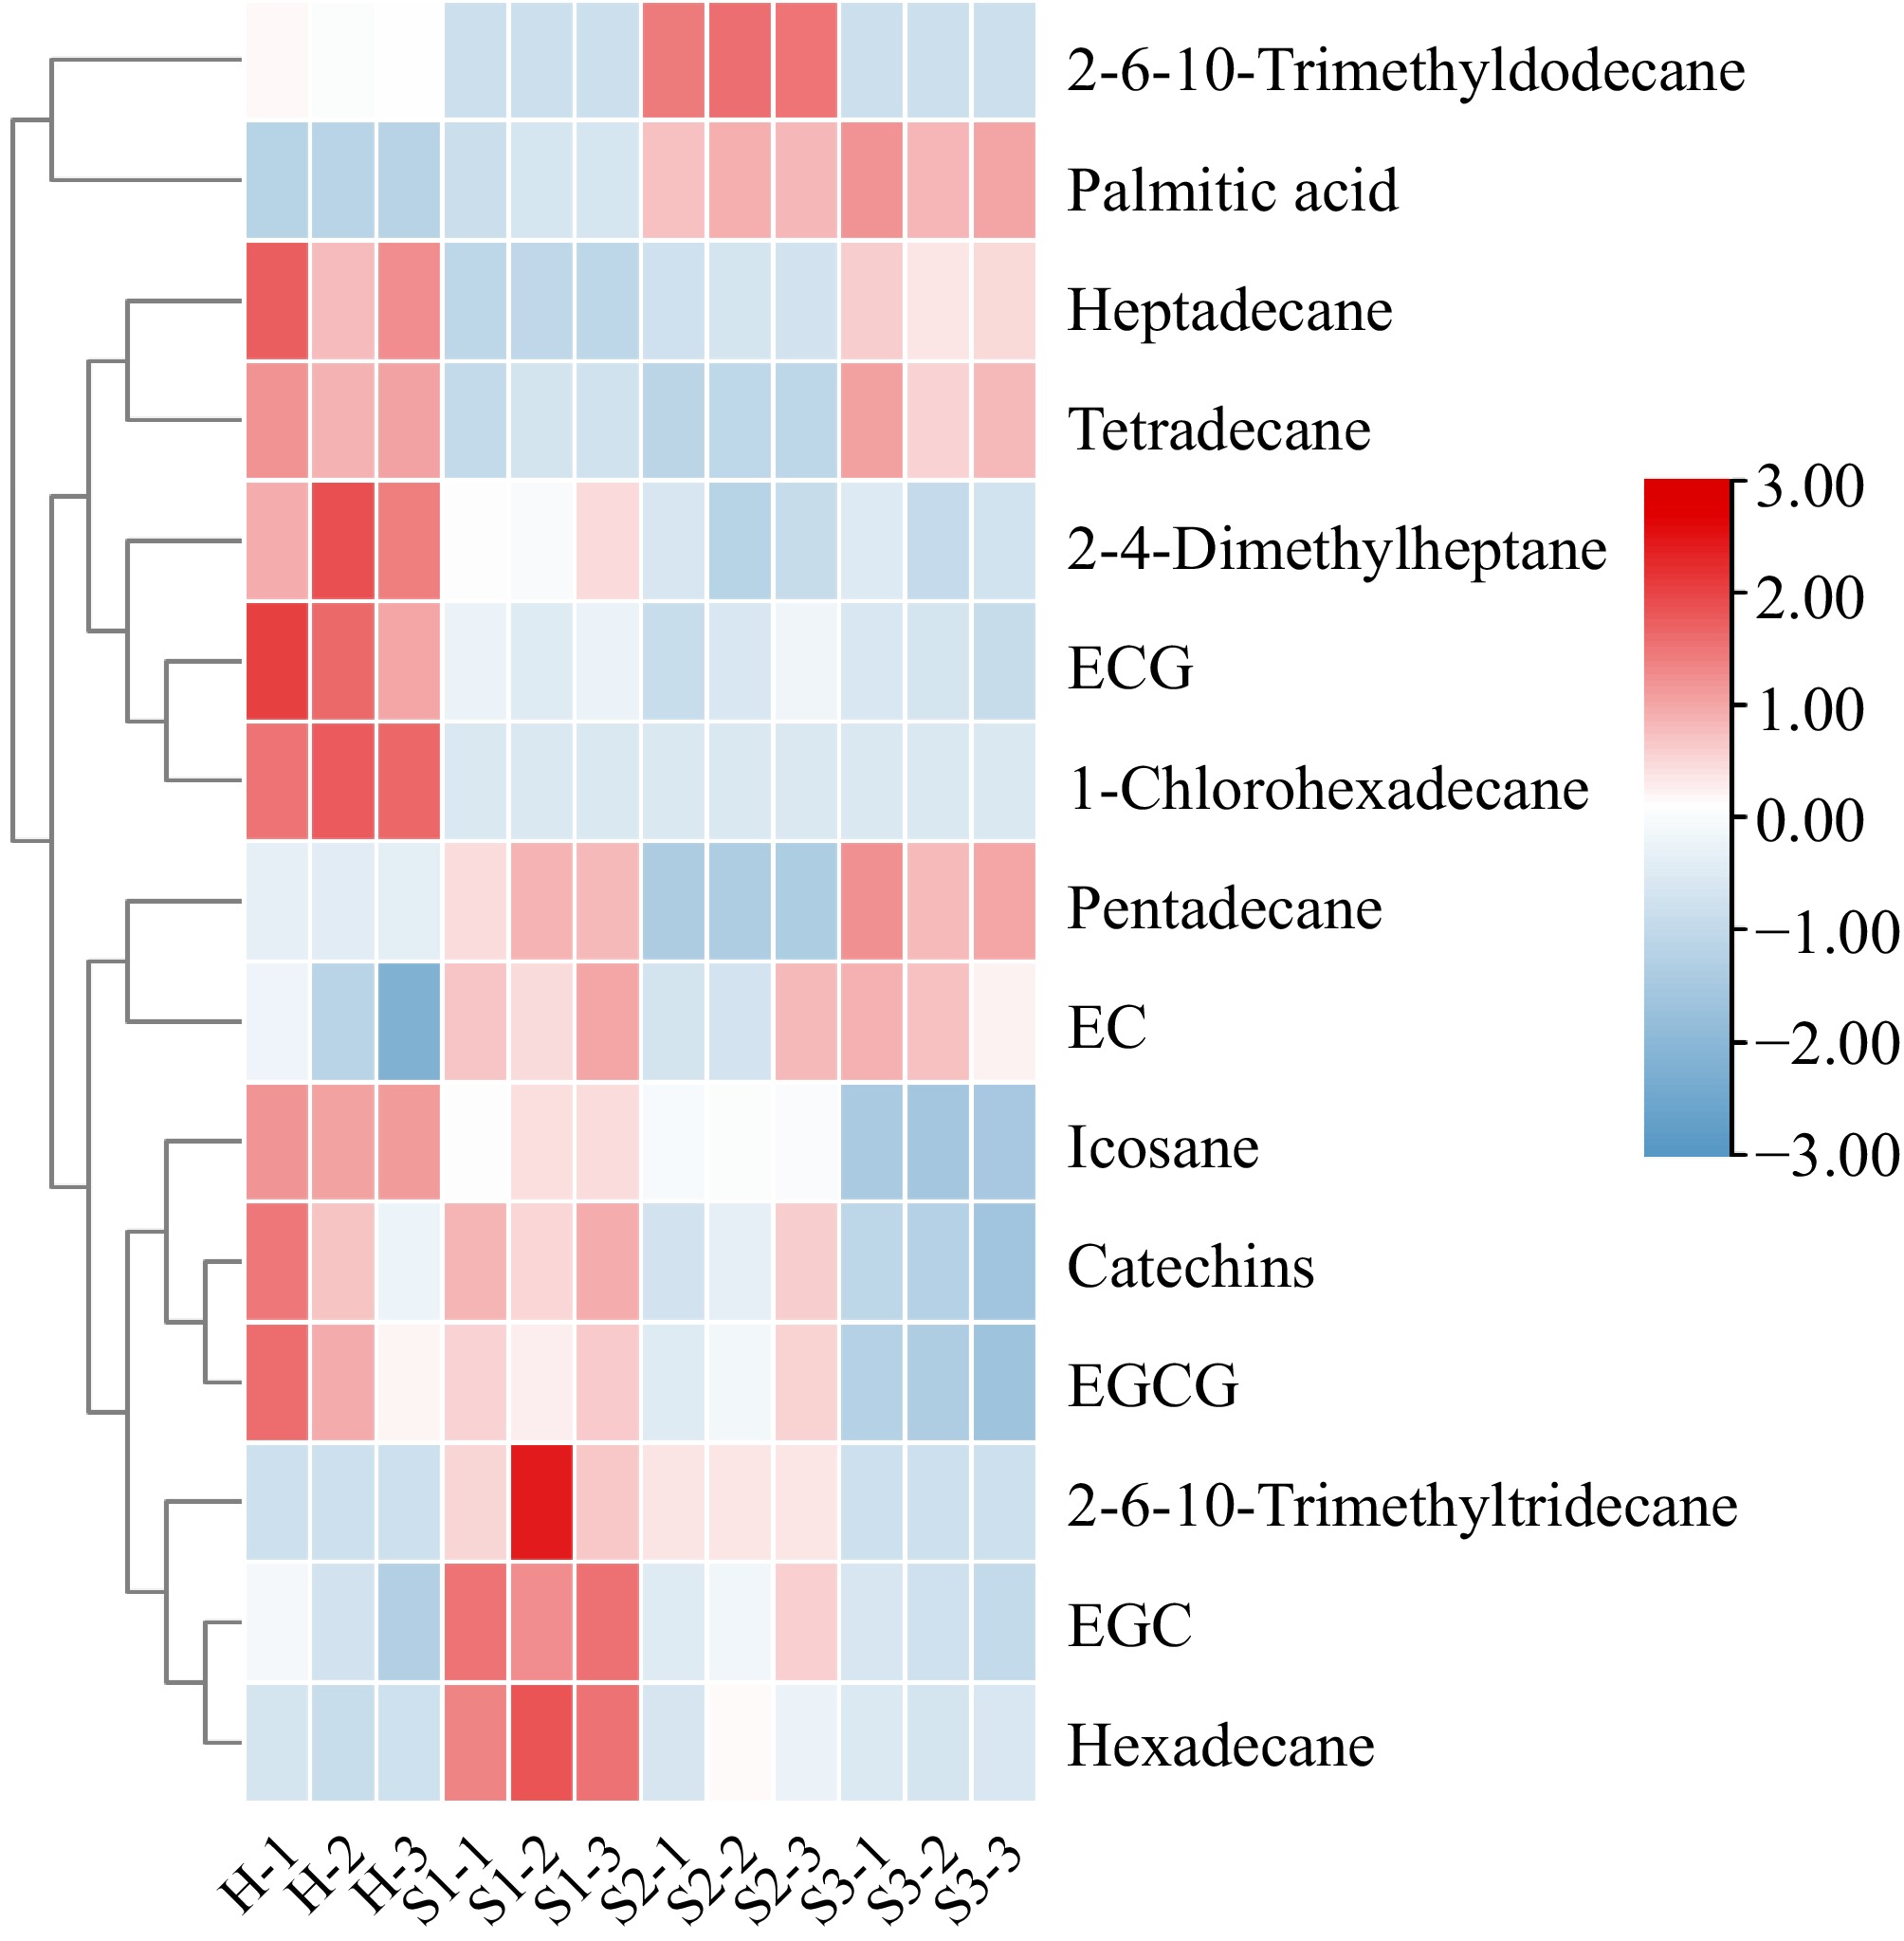
Figure 6.
Heatmap analysis of differentially abundant metabolites. H, healthy leaves; S1, tea leaves in the early disease stage; S2, tea leaves in the middle disease stage; S3, tea leaves in the late disease stage. The samples are clustered according to the similarities among their constituents and arranged in a horizontal order. Red represents the more abundant metabolites in the corresponding group, and blue represents the less abundant metabolites.
-
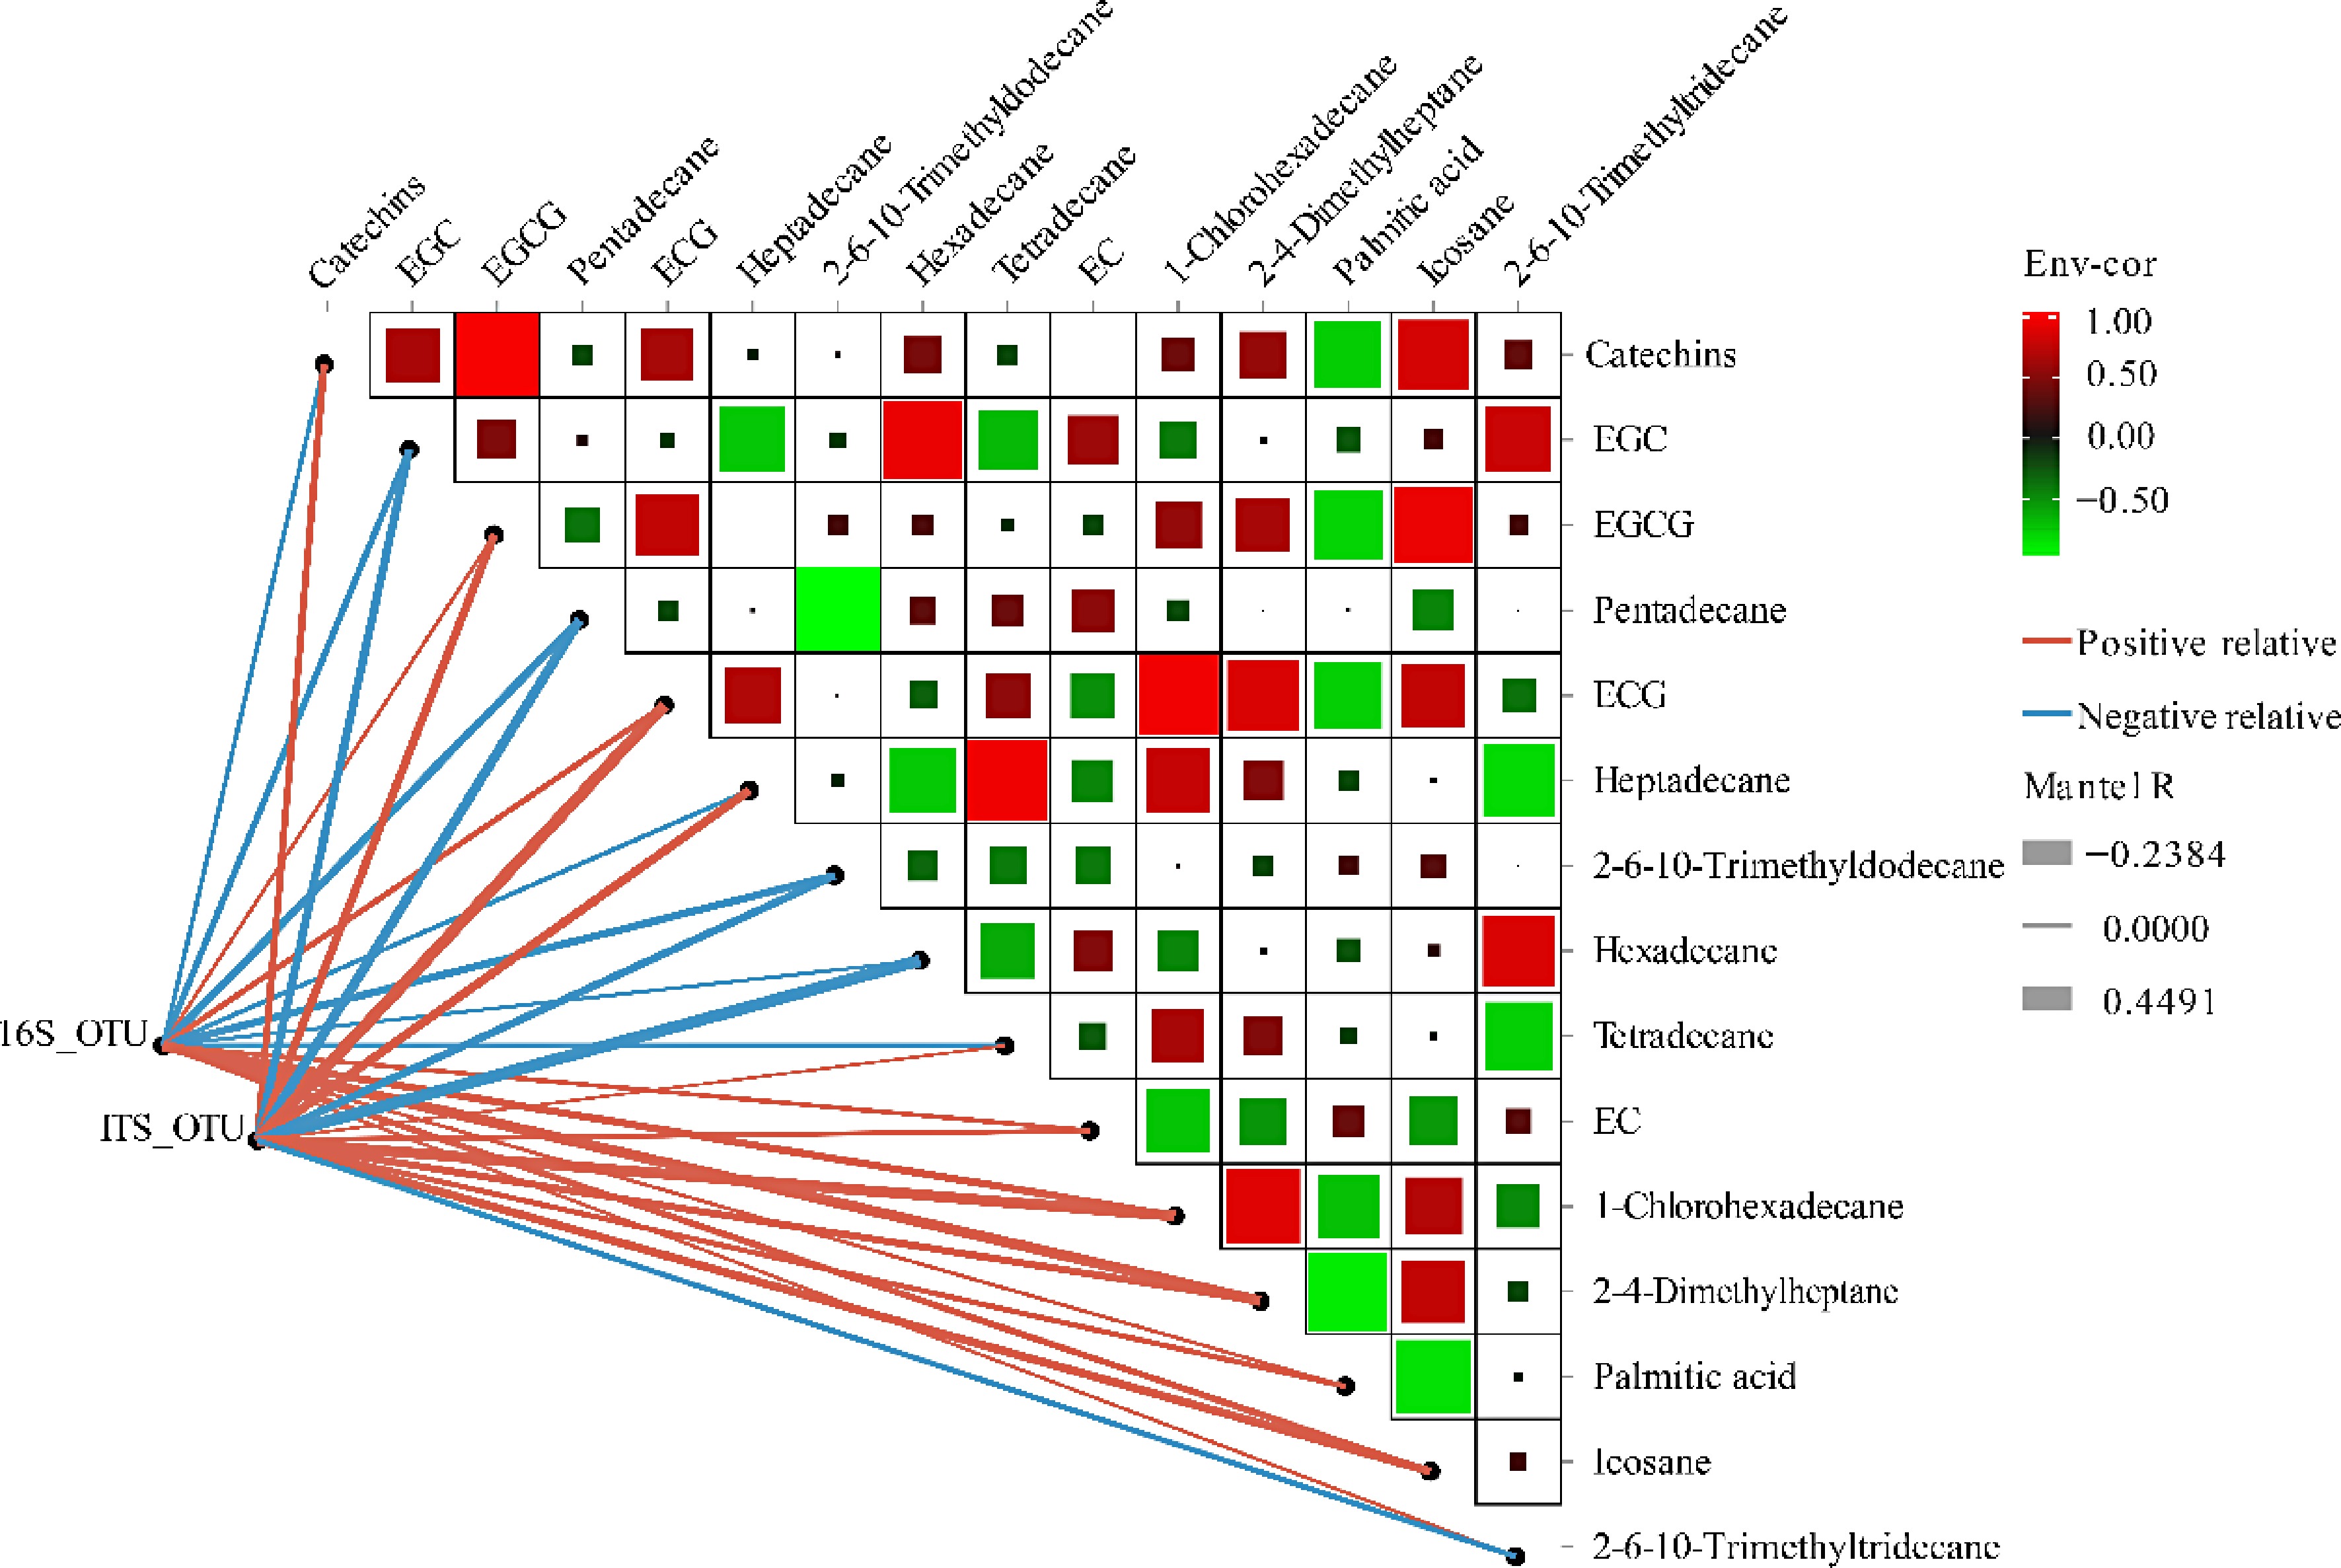
Figure 7.
Correlation of microbial communities with main biochemical components determined by the partial Mantel test. Pairwise comparisons of metabolites are shown with a color gradient denoting Spearman's correlation coefficients. OTU composition in relation to metabolites determined by partial Mantel tests. Edge width corresponds to Mantel's R statistic for the corresponding distance correlations.
-
Treatment Bacteria Fungi Sobs Chao1 Shannon Sobs Chao1 Shannon H 269.00 ± 11.36a 296.34 ± 11.97a 4.57 ± 0.46a 756.00 ± 29.60a 829.84 ± 36.32a 4.85 ± 0.31a S1 243.00 ± 38.69a 293.12 ± 28.85a 4.51 ± 0.48a 712.33 ± 13.58ab 812.52 ± 24.39ab 4.25 ± 0.49ab S2 268.67 ± 11.59a 307.35 ± 15.27a 4.79 ± 0.03a 684.67 ± 13.05bc 761.59 ± 6.78bc 3.58 ± 0.14bc S3 282.00 ± 60.23a 308.86 ± 57.81a 4.54 ± 0.42a 642.00 ± 51.18c 721.74 ± 33.74c 3.25 ± 0.38c H, healthy leaves; S1, tea leaves in the early disease stage; S2, tea leaves in the middle disease stage; S3, tea leaves in the late disease stage. The values are expressed as the means ± standard errors. Lowercase letters in the same column indicate significant differences at p < 0.05. Table 1.
Alpha diversity of bacterial and fungal communities on the surface of tea leaves at different blister blight disease stages.
Figures
(7)
Tables
(1)