-
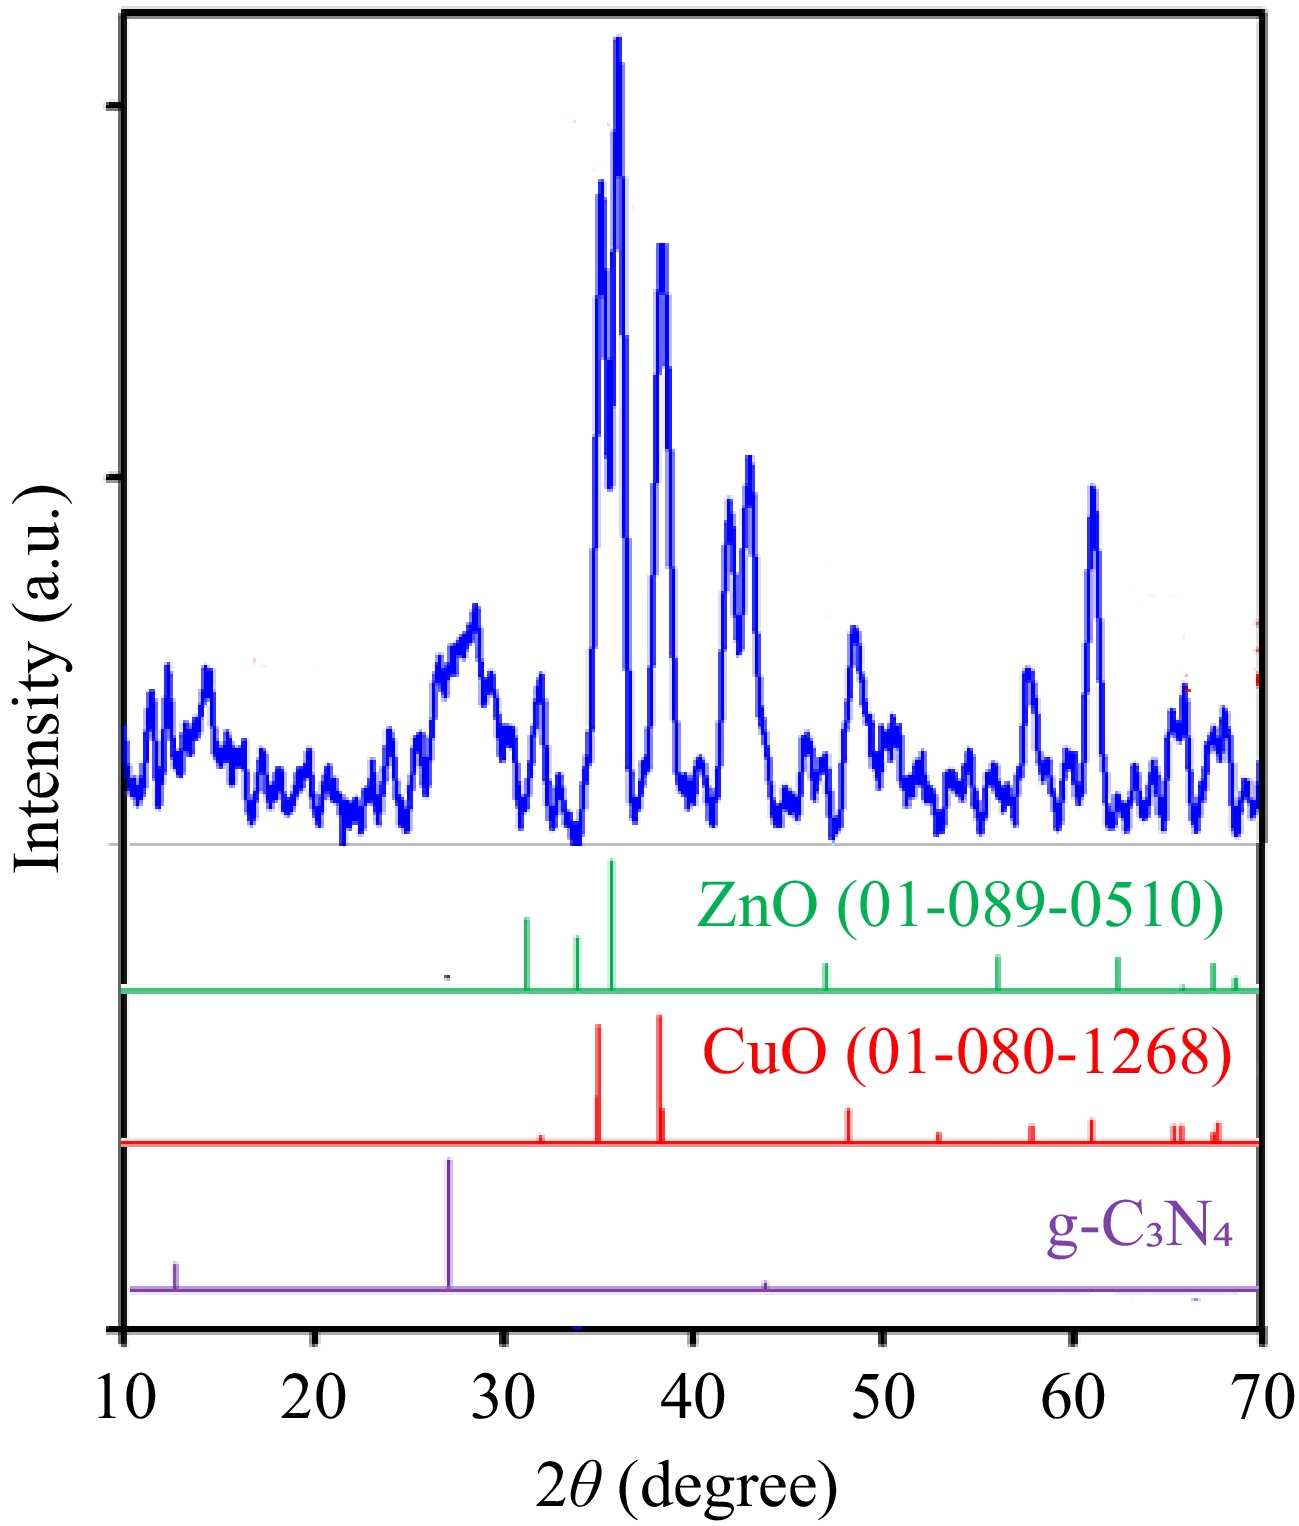
Figure 1.
XRD patterns of the g-C3N4-CuO-ZnO heterojunction.
-
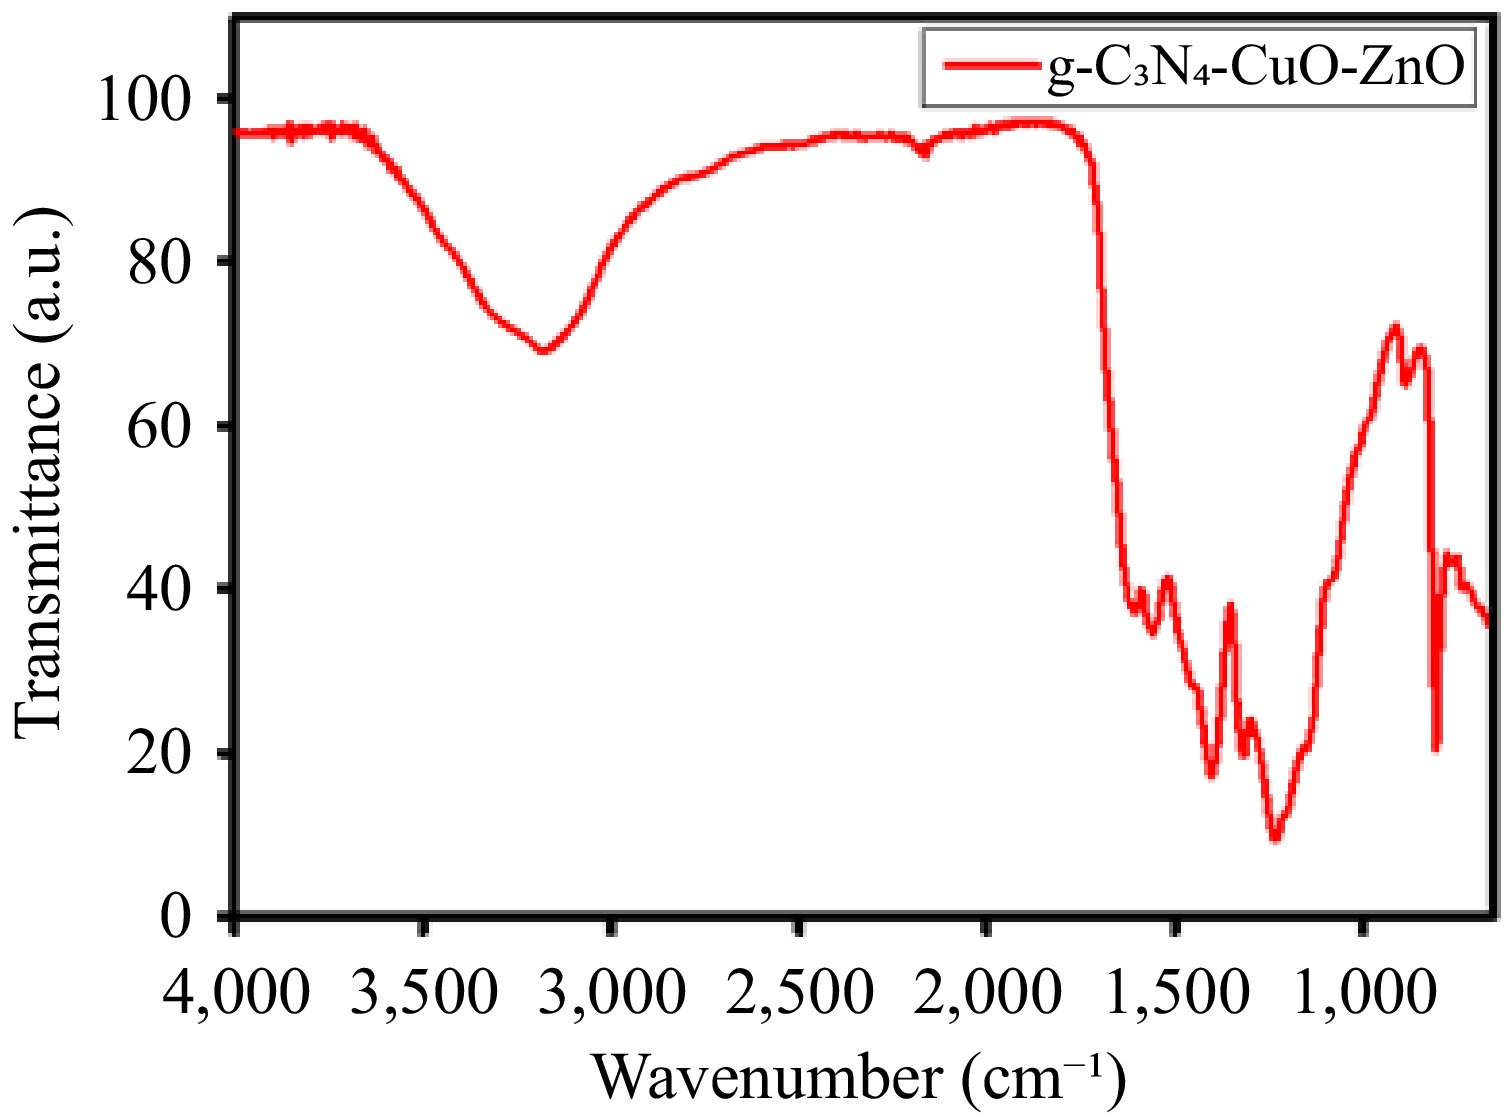
Figure 2.
FTIR spectrum of the g-C3N4-CuO-ZnO heterojunction.
-
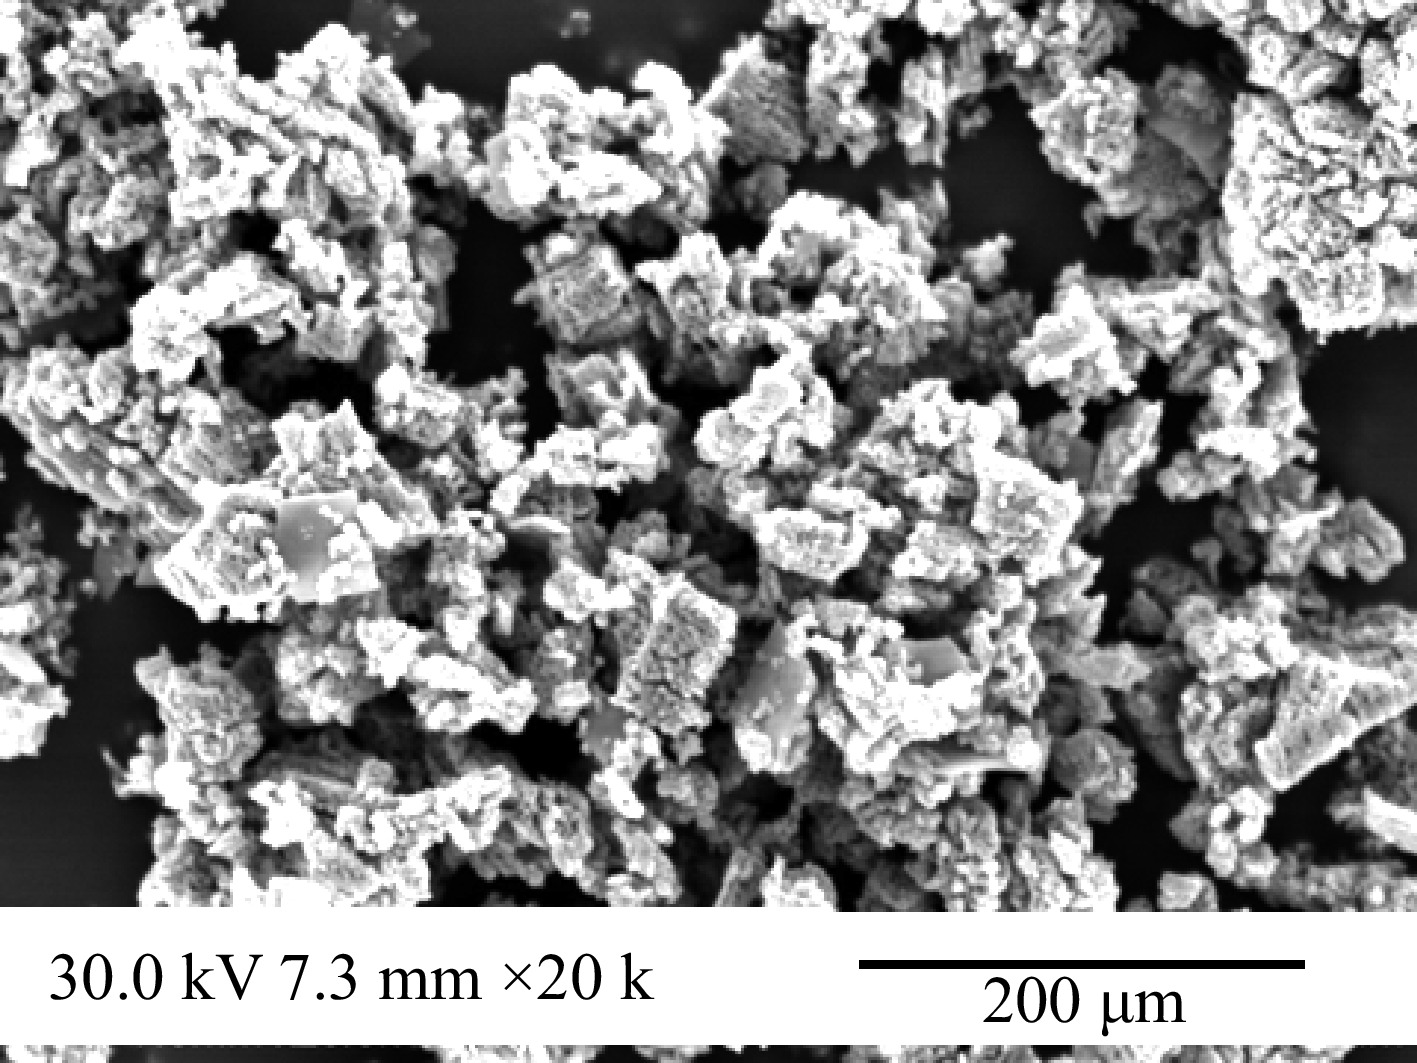
Figure 3.
SEM analysis of the g-C3N4-CuO-ZnO heterojunction.
-
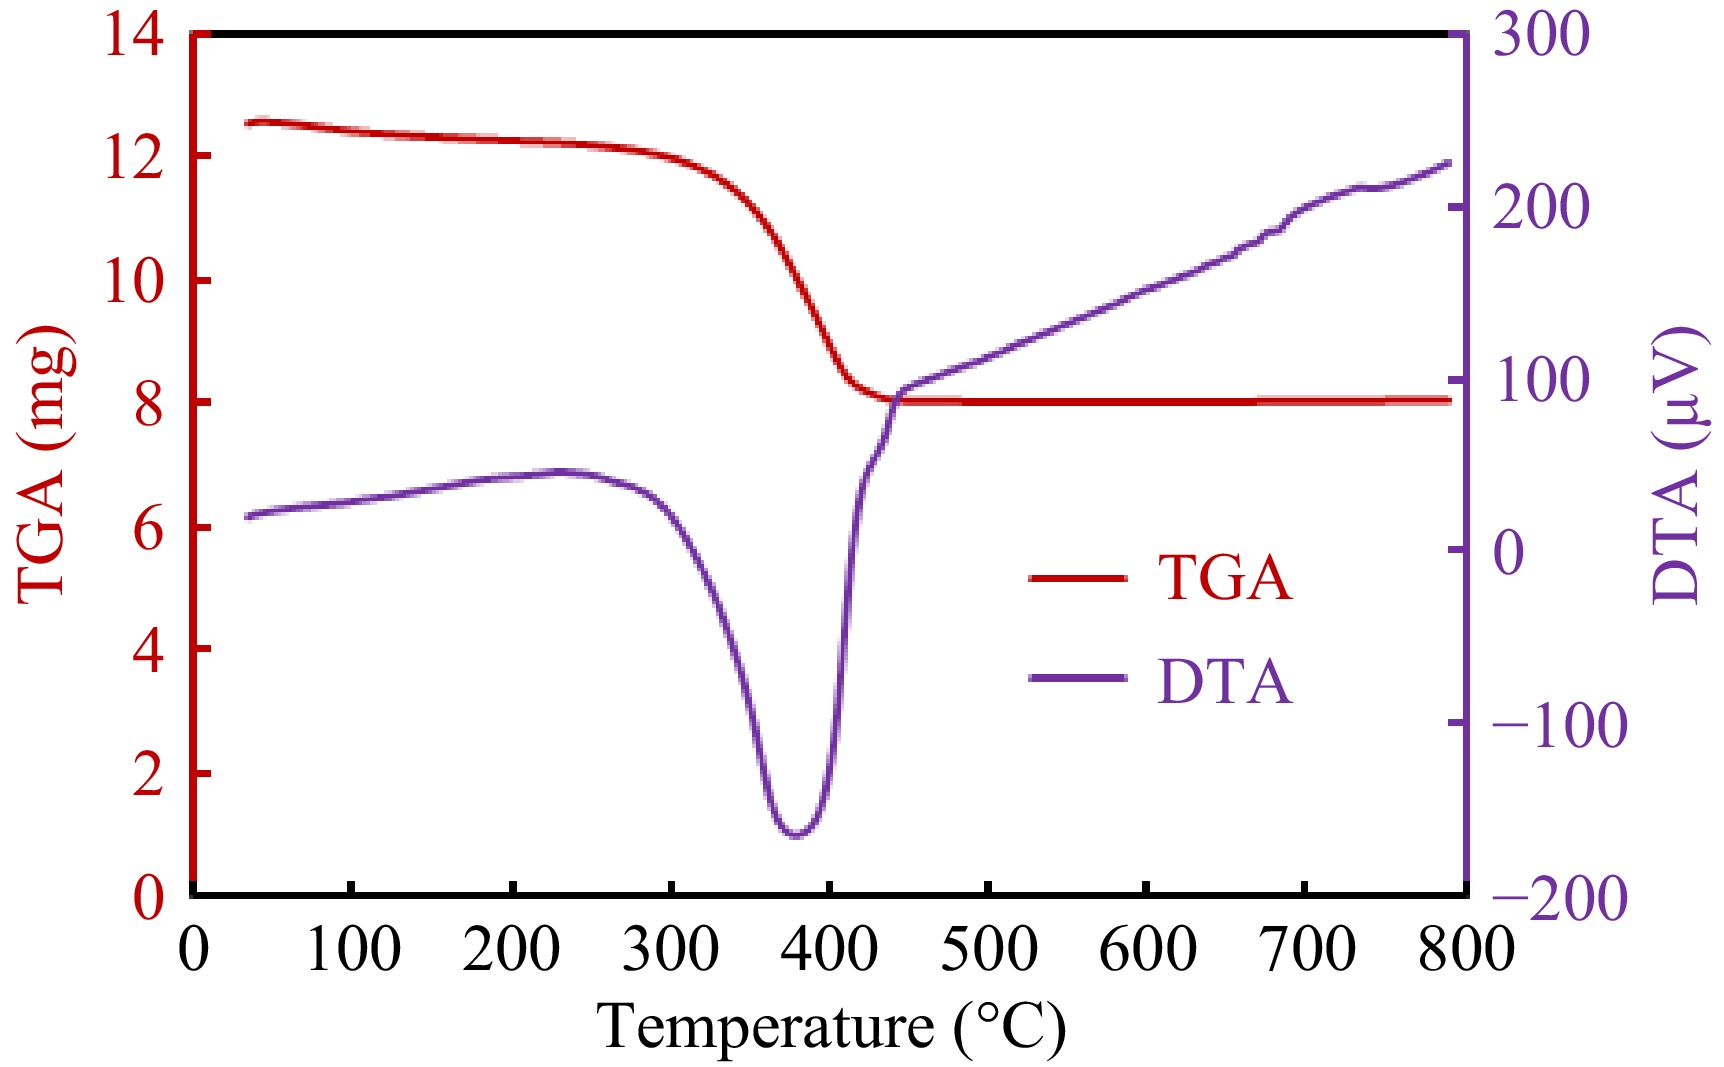
Figure 4.
TGA and DTA curves for the g-C3N4-CuO-ZnO heterojunction.
-
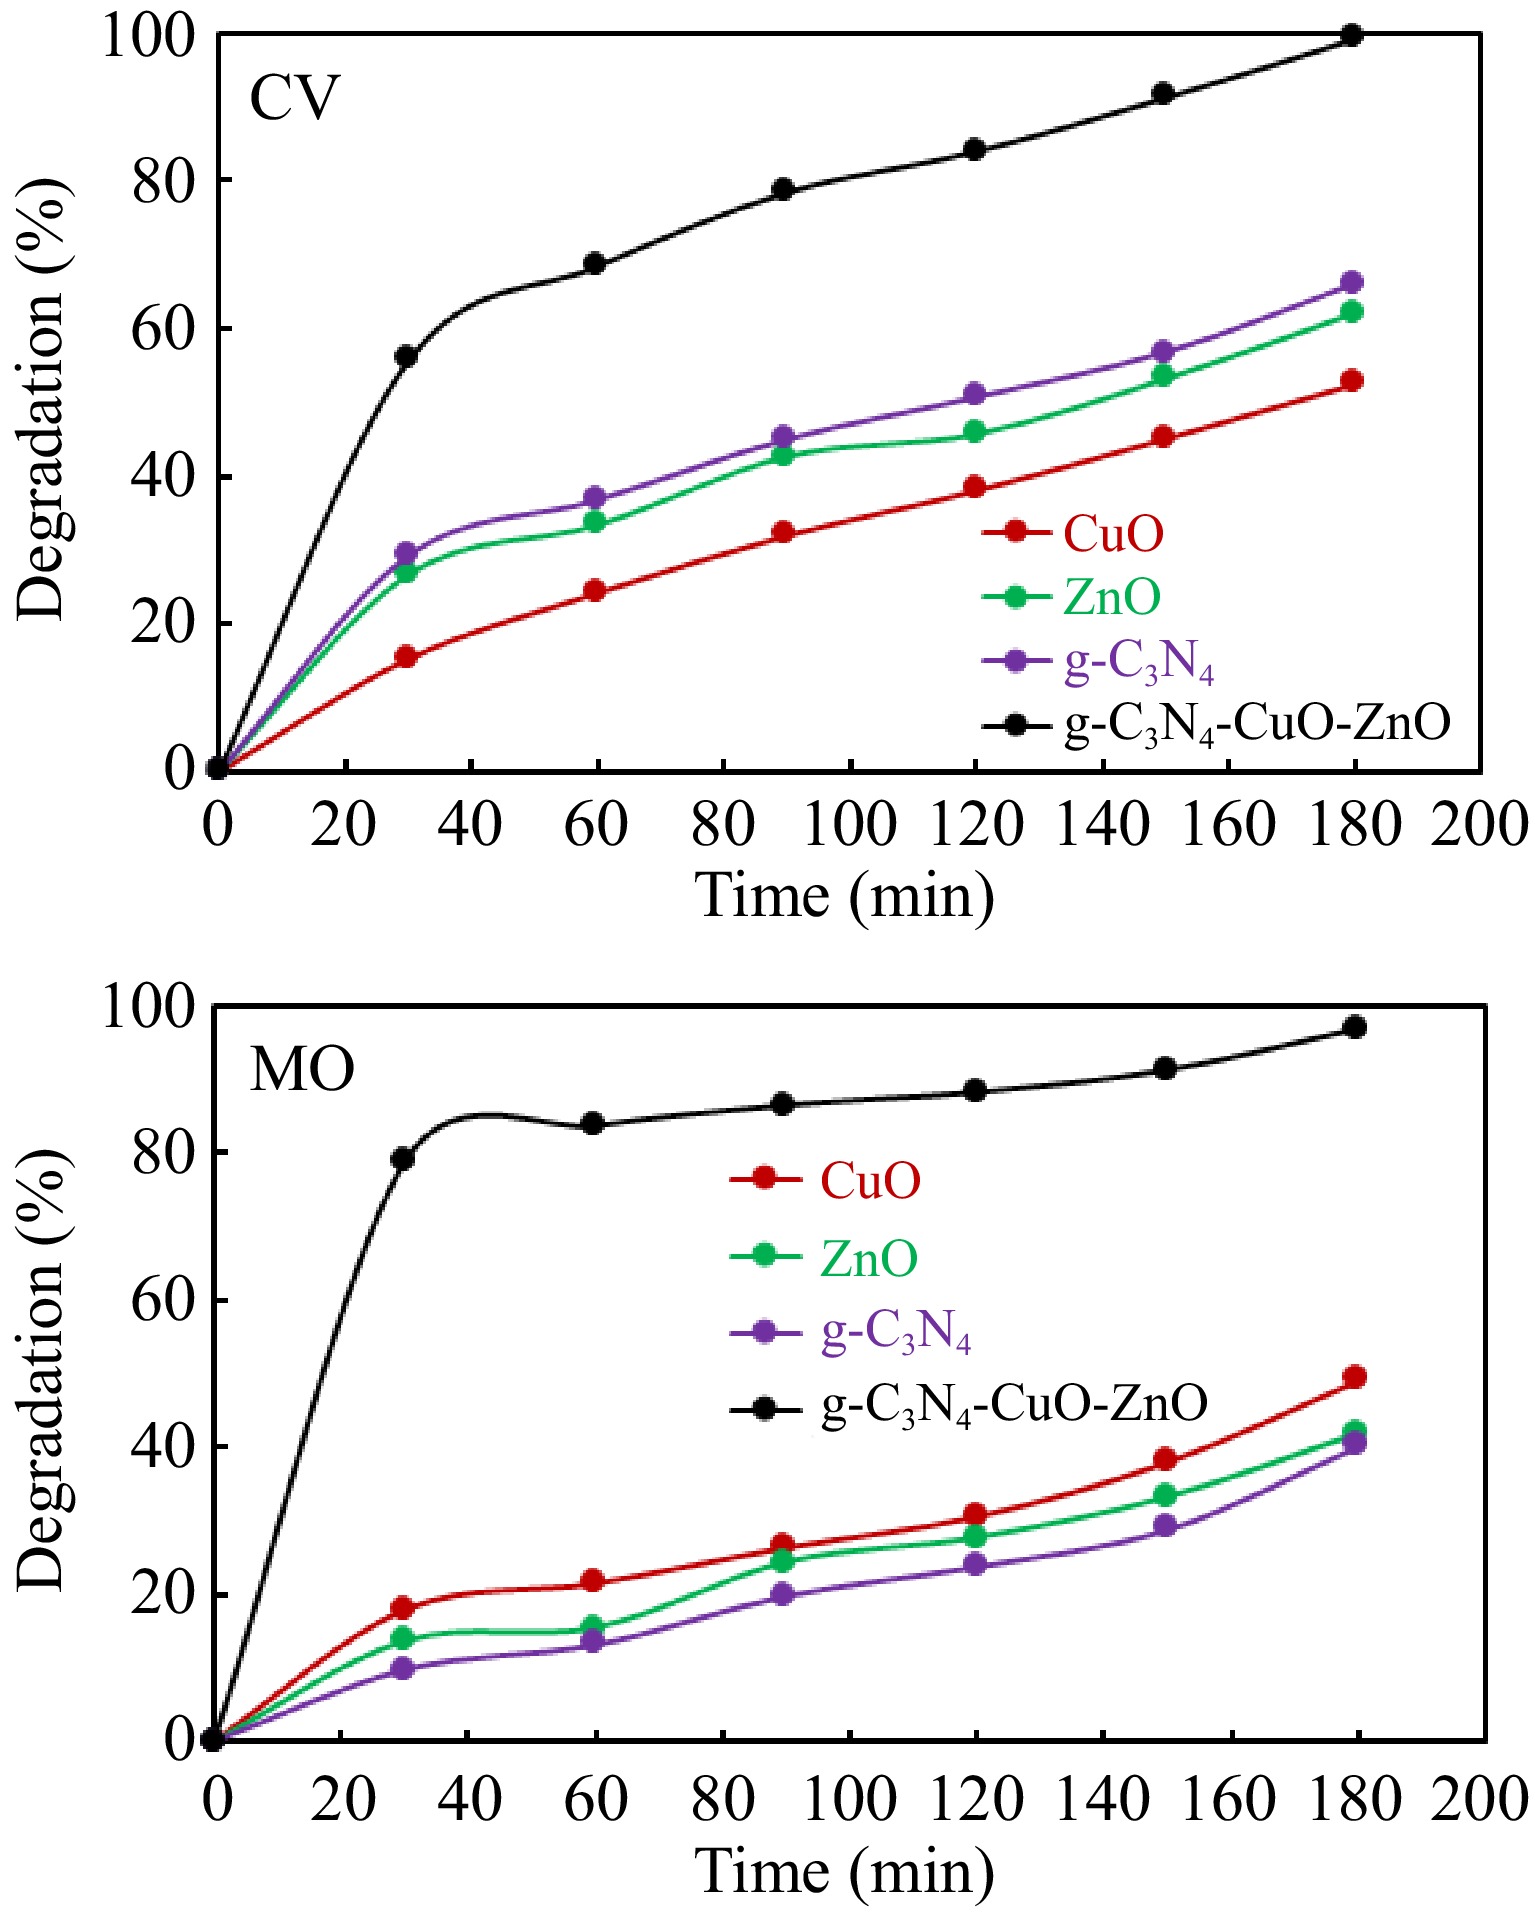
Figure 5.
Comparison of photocatalytic activities of different substances.
-
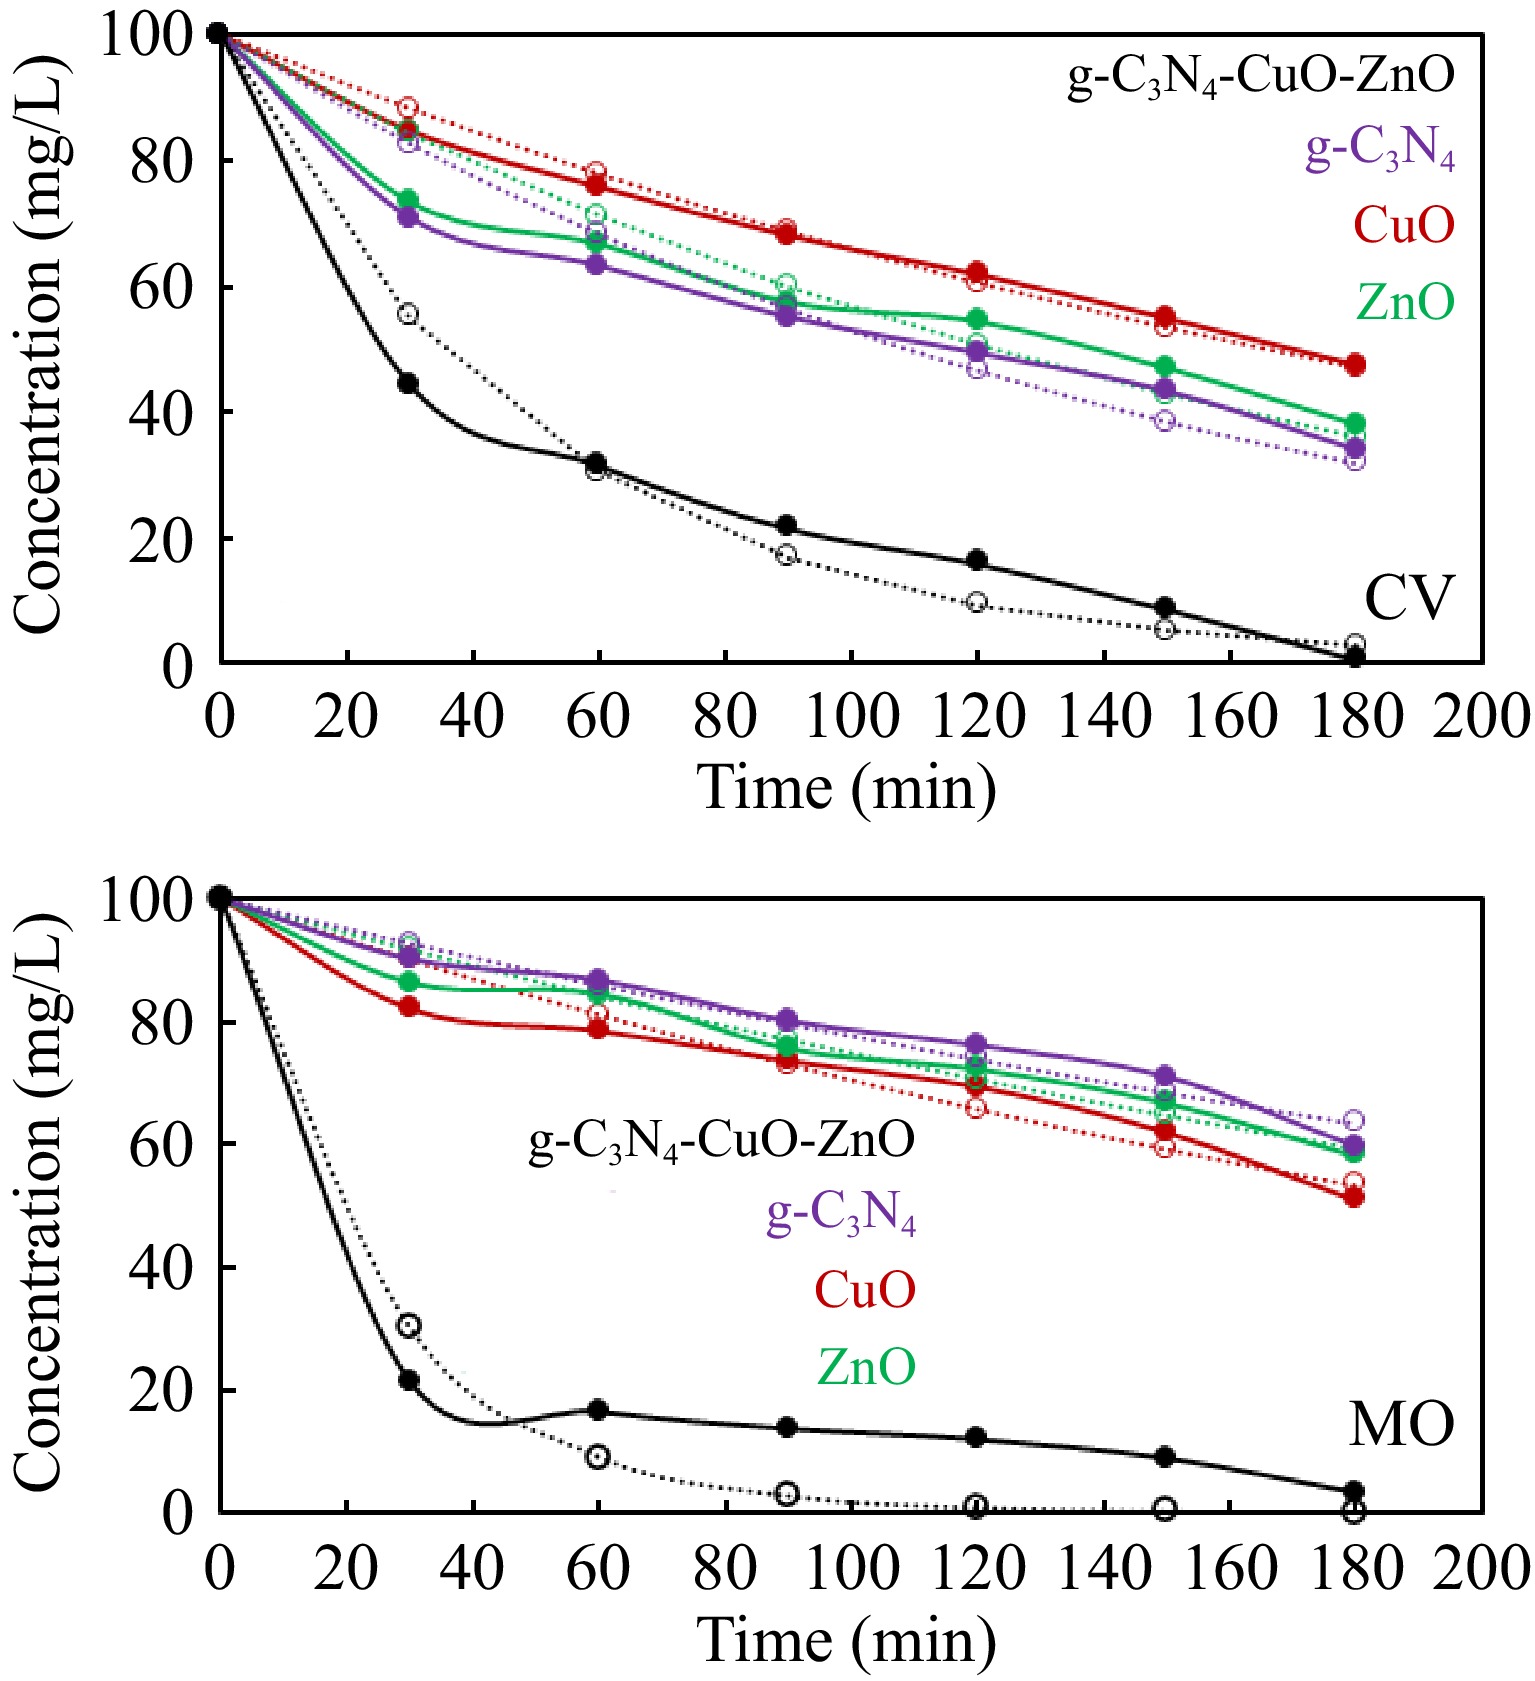
Figure 6.
Kinetics analysis of photocatalytic degradation data of dyes according to kinetics model given in Eqn (8). The solid lines represented the experimental data while the broken lines represent the data calculated by kinetics Eqn (8) using Solver.
-
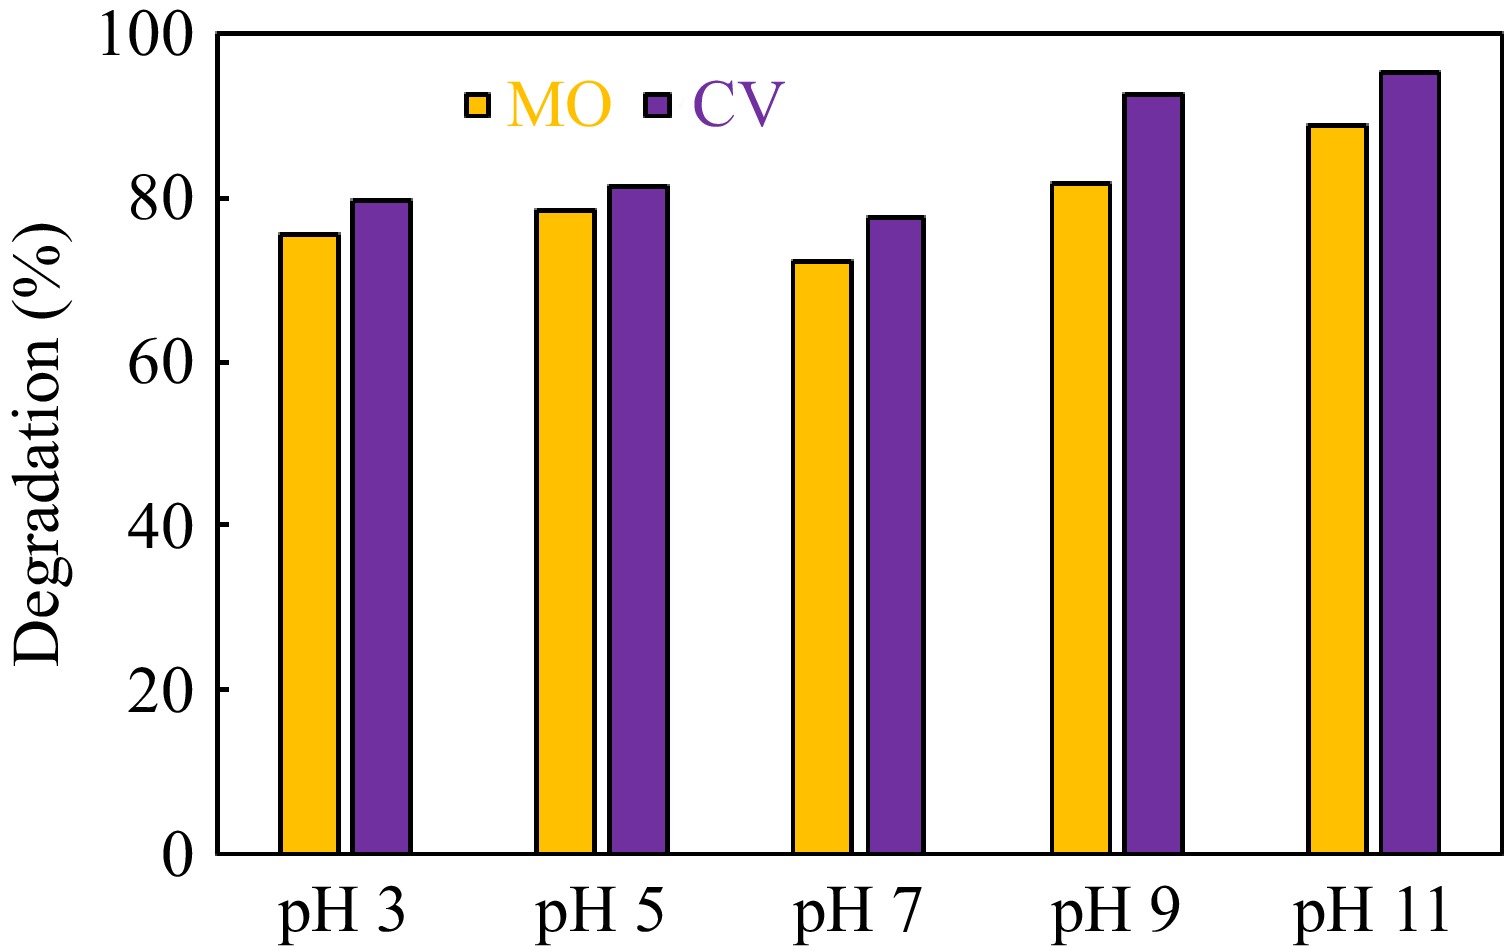
Figure 7.
Effect of initial pH on g-C3N4-CuO-ZnO catalyzed photodegradation of methyl orange and crystal violet dye.
-
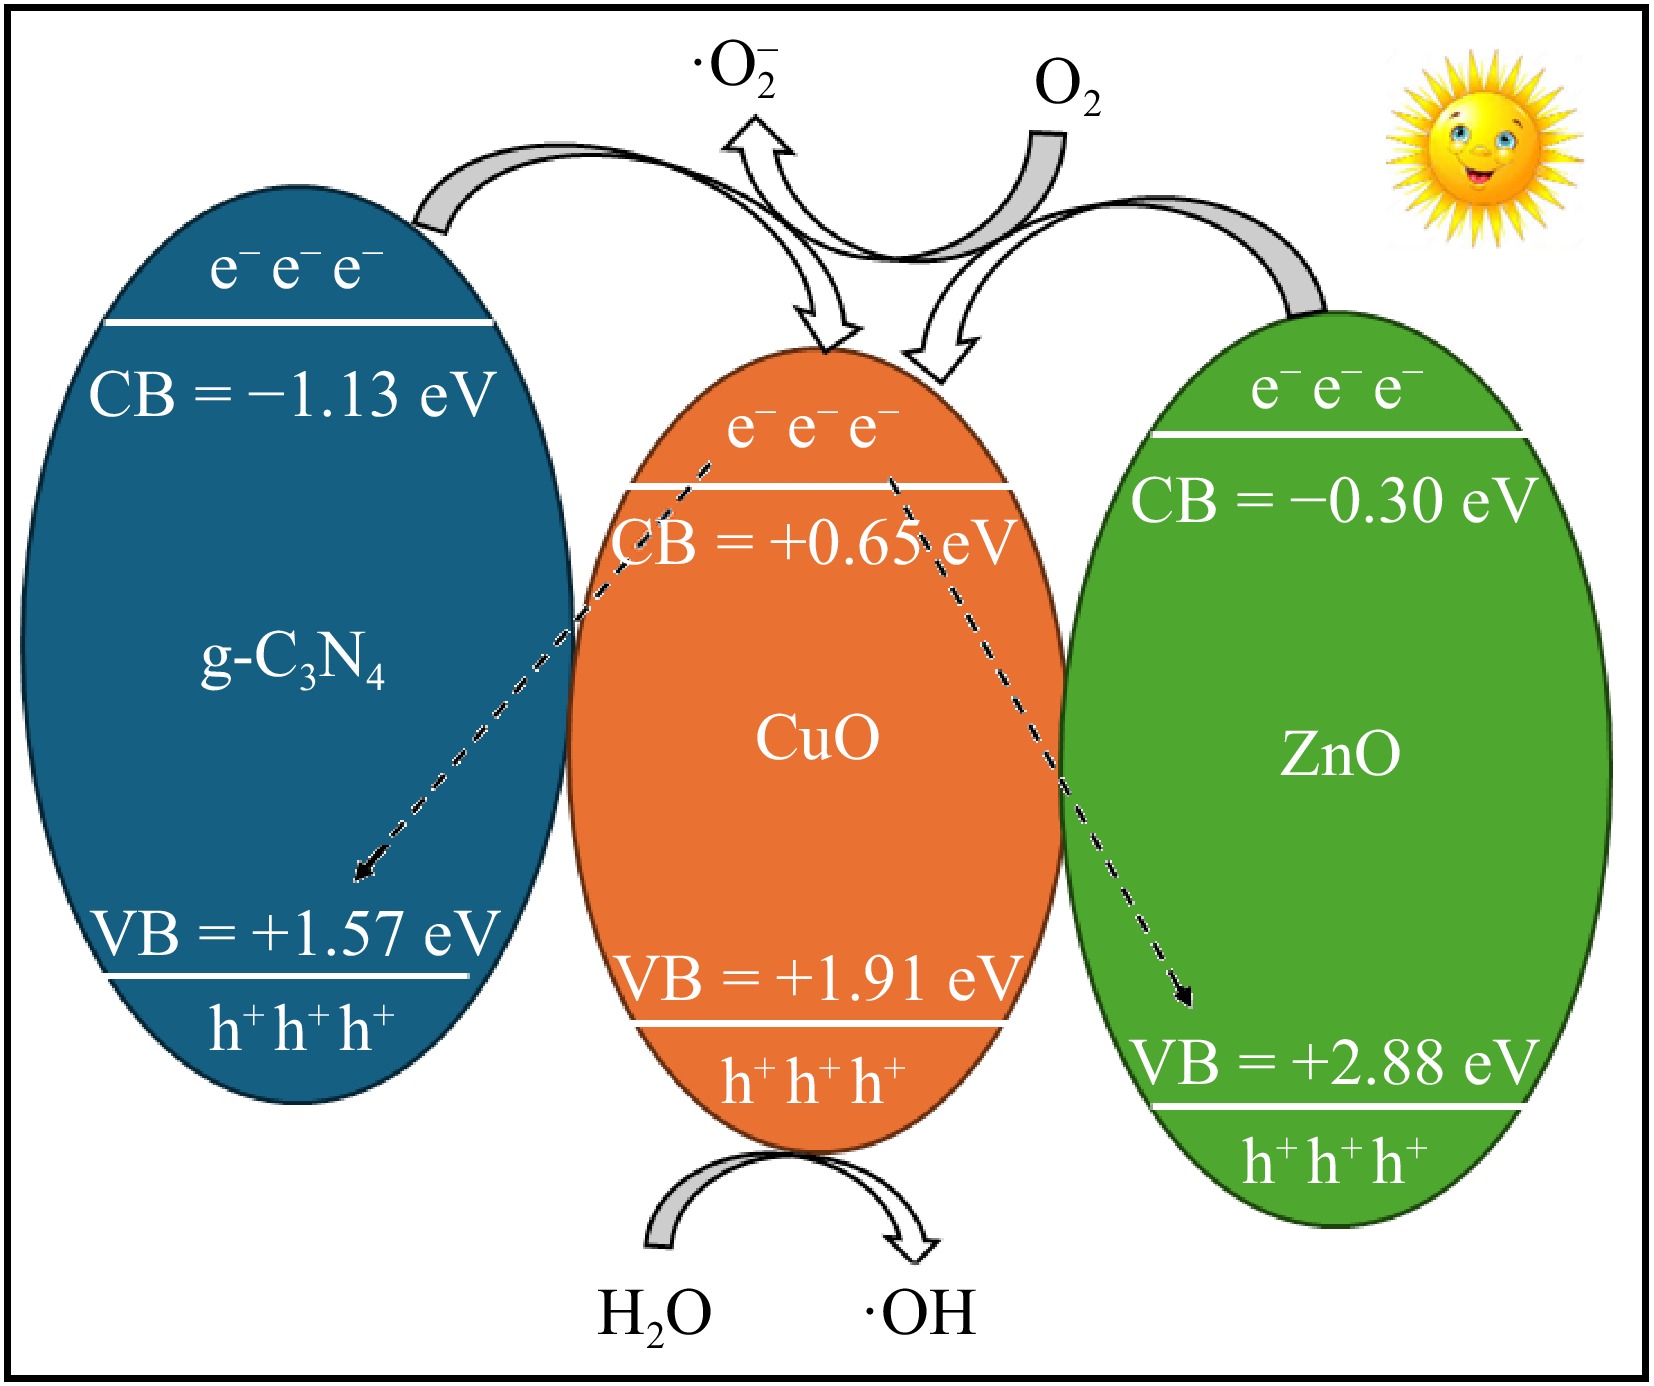
Figure 8.
Proposed mechanism of the photocatalytic process.
-
Catalyst Crystal violet dye Methyl orange dye k (min−1) R2 k (min−1) R2 g-C3N4 0.00637 0.988 0.00252 0.986 CuO 0.00418 0.986 0.00349 0.987 ZnO 0.00568 0.988 0.00290 0.988 g-C3N4-CuO-ZnO 0.01978 0.947 0.03994 0.928 Table 1.
Rate constants for degradation of crystal violet and methyl orange dyes over different substances. These rate constants were determined by analyzing the degradation data according to kinetics Eqn (8) using Solver.
Figures
(8)
Tables
(1)